1. Introduction
Due to a 13-fold increase in Coronavirus disease 2019 (COVID-19) cases outside of China on 11 March 2020, the World Health Organizations Director General characterized it as a pandemic [
1]. At the time of this writing, on 5 August 2021, the Centers for Disease Control reported that there were over 35 million cases of COVID-19 in the U.S., with the total deaths exceeding 600,000 [
2]. This pandemic has resulted in stay-at-home orders being instituted around the world, which has many negative externalities associated with it, but one positive one has been a marked decrease in many criteria air pollutants due to decreases in transportation volumes and industrial production [
3,
4], including reduced concentrations of nitrogen dioxide (NO
2) [
5,
6,
7,
8]. This change has also been quantified via satellite imagery, which indicates a substantial drop in NO
2 tropospheric column of over 20% from January to April 2020 versus the same time frame in 2019 over parts of China, Western Europe, and the United States [
9] and similarly in 20 North American cities. Goldberg et al. (2020) calculated decreases in NO
2 during this similar timeframe; when adjusted for seasonality and meteorology in a North American city study, they were between 9% and 43%. It is important to note that satellite data, due to its analysis being based on the entire tropospheric column and its spatial and temporal coverage limitations, can misreport on the ground-pollutant measurements. Additionally, urban regions versus remote regions can have daily NO
2 retrievals varying up to 40% [
10].
As anthropogenic activities of nitrogen oxide (NOx) far surpass natural emissions [
11], they have resulted in a three- to six-fold increase in nitrogen oxide (NOx = NO + NO
2) emissions since the pre-industrial era [
12]. Anthropogenic sources of NOx include fossil fuel/biofuel combustion, industry, and the transportation sector, and natural sources of NOx include soil nitrification-denitrification processes, wild fires, and lightning [
11]. NO
2 from traffic emissions have profound and measurable health implications, such as heart disease or upper respiratory infections, in populations with increase in nonaccidental mortality [
13,
14]. Besides increasing acidification, exacerbating global climate change, decreasing visibility, and increasing ozone and aerosol in the troposphere [
15], NOx also induces small-particle formation and has shown to be positively correlated to adverse health conditions as a result of long-term exposure [
16,
17].
High vehicular emissions can result in corridors of heavy air pollution [
18] in rural and urban regions. NO
2 pollution, a tracer for vehicular emissions, has been linked to adverse health effects for increased asthma events in predominantly urban areas [
19]. A 20 ppb increase in NO
2 has been found to increase chronic obstructive pulmonary disease (COPD) hospital visits, cardiovascular disease, lung cancer in adults, and respiratory mortality [
13,
14].
Recent COVID-19 research has consistently shown reduction of vehicular travel as the cause of NO2 decreases; however, the one knowledge gap in this body of research is simply that the vehicle type (cars versus multiple-axled vehicles) is nearly as important as the vehicle number, and this varies substantially between cities. The onset of COVID-19 and the stay-at-home orders in March and April have posed a unique opportunity to examine these changes in vehicular NO2 emission as a result of reduction of vehicle volume and type in the U.S. To examine changes in NO2 in cities and how that relates to vehicular traffic during the COVID-19 lockdown, we examine the impact of stay-at-home orders in March through April 2020 versus a five-year average of calibrated high-quality data from March–April from 2015–2019. We utilize 2020 daily raw data for NO2 from EPA-grade sensors in 11 large cities around the U.S. Additionally, NO2 concentrations in Indianapolis, IN, are assessed and compared to vehicle volume broken down by classification with the premise that truck-traffic volumes (with varying axles) are a good metric for vehicular emissions in cities.
4. Discussion
The onset of COVID-19 and the stay-at-home orders in March and April have presented an opportunity to examine the changes in NO2 concentrations and their relationship to VMT in 11 cities in the U.S., with implications for local health outcomes.
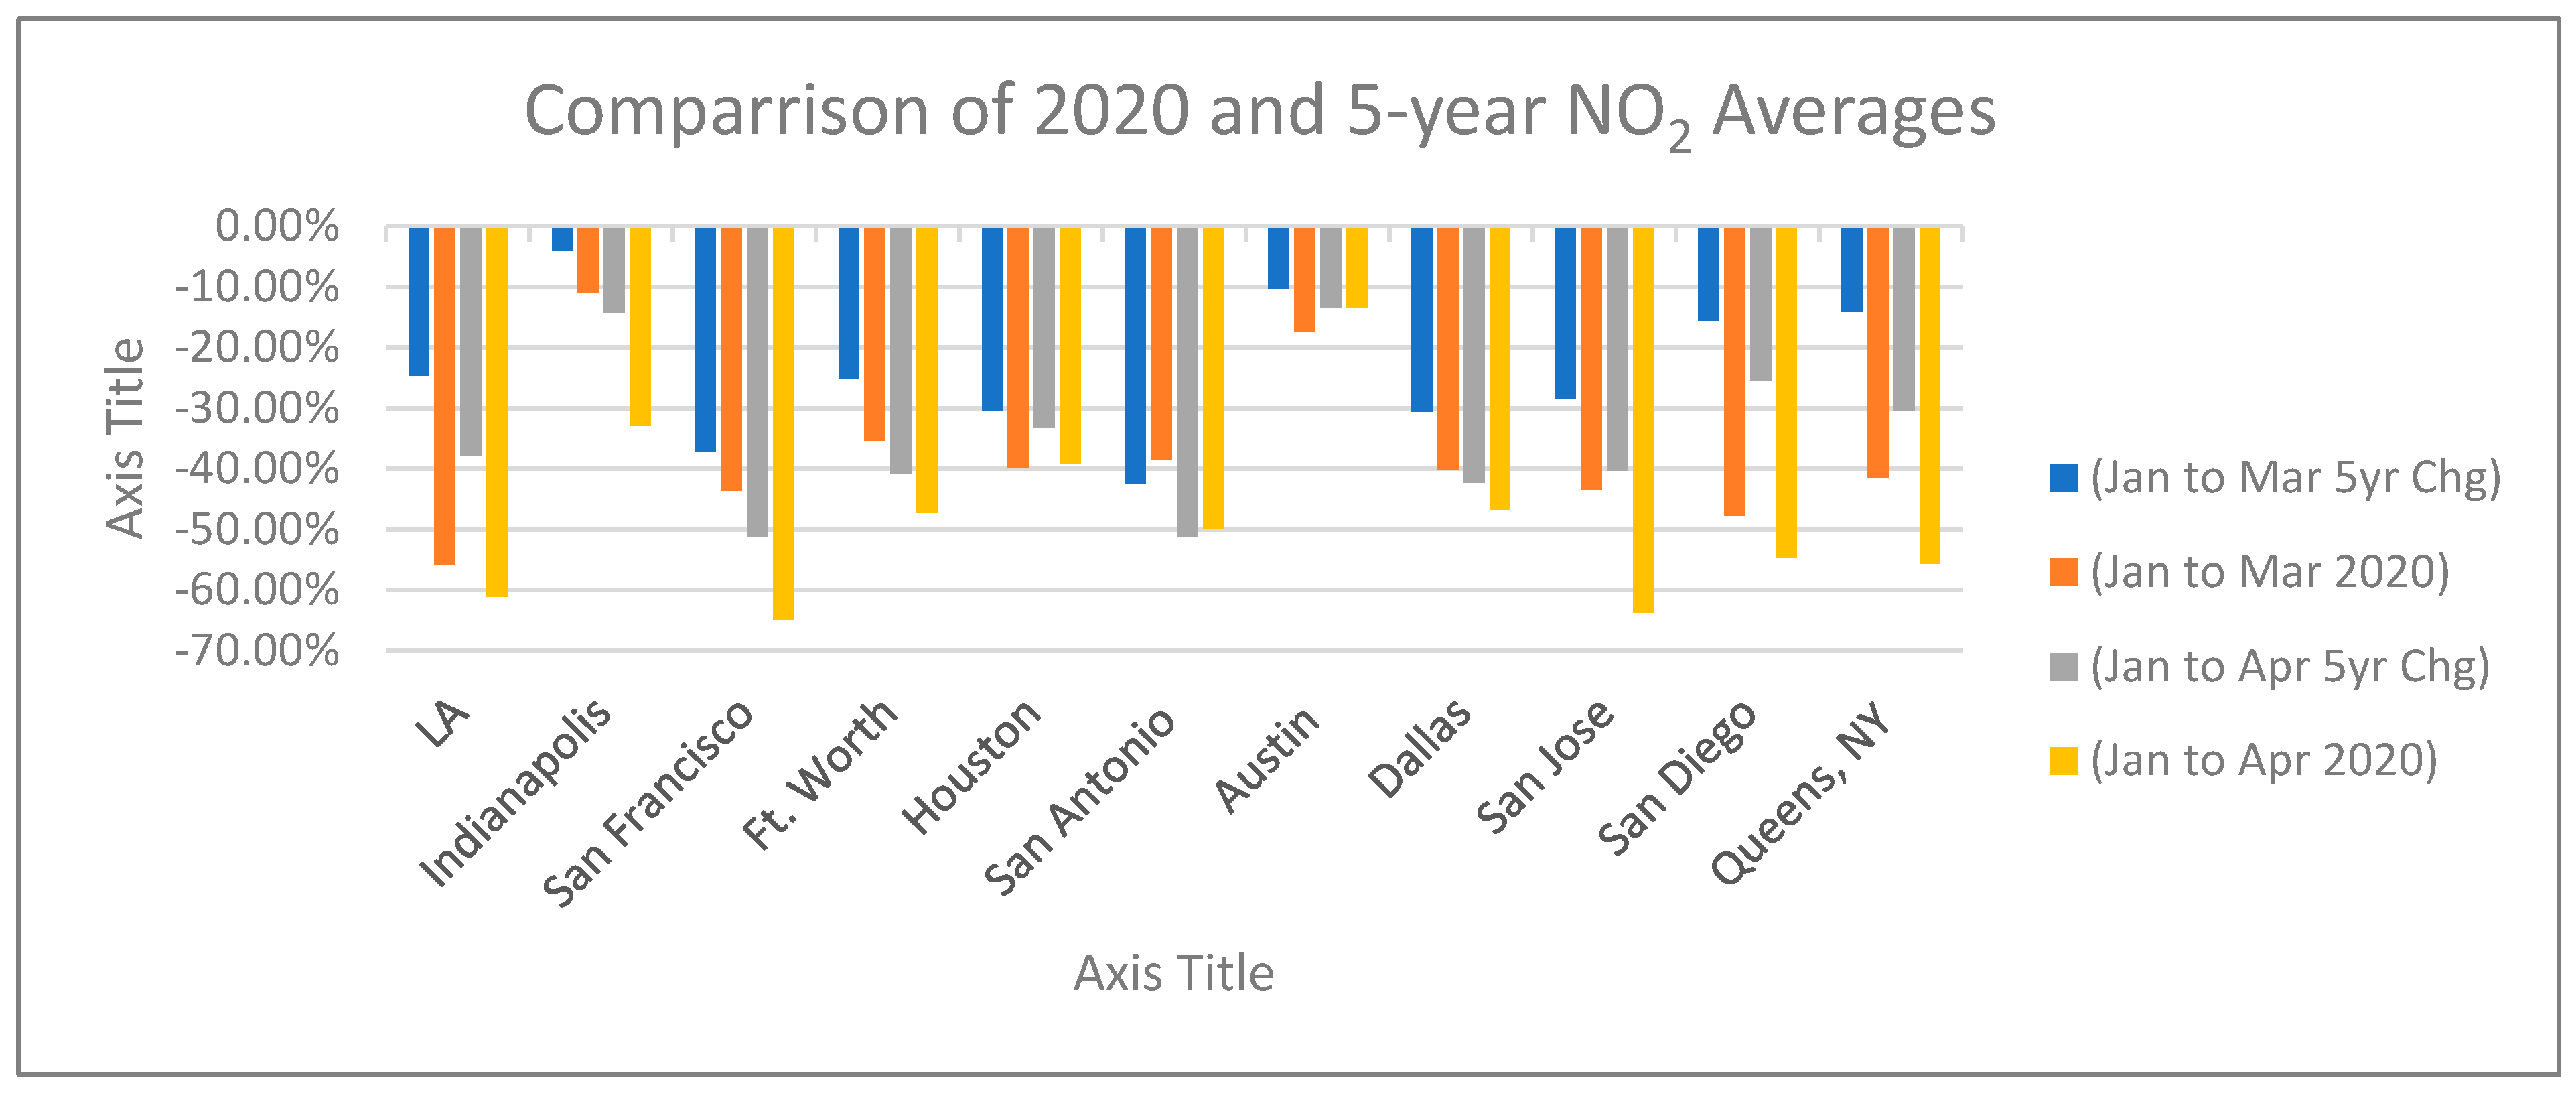
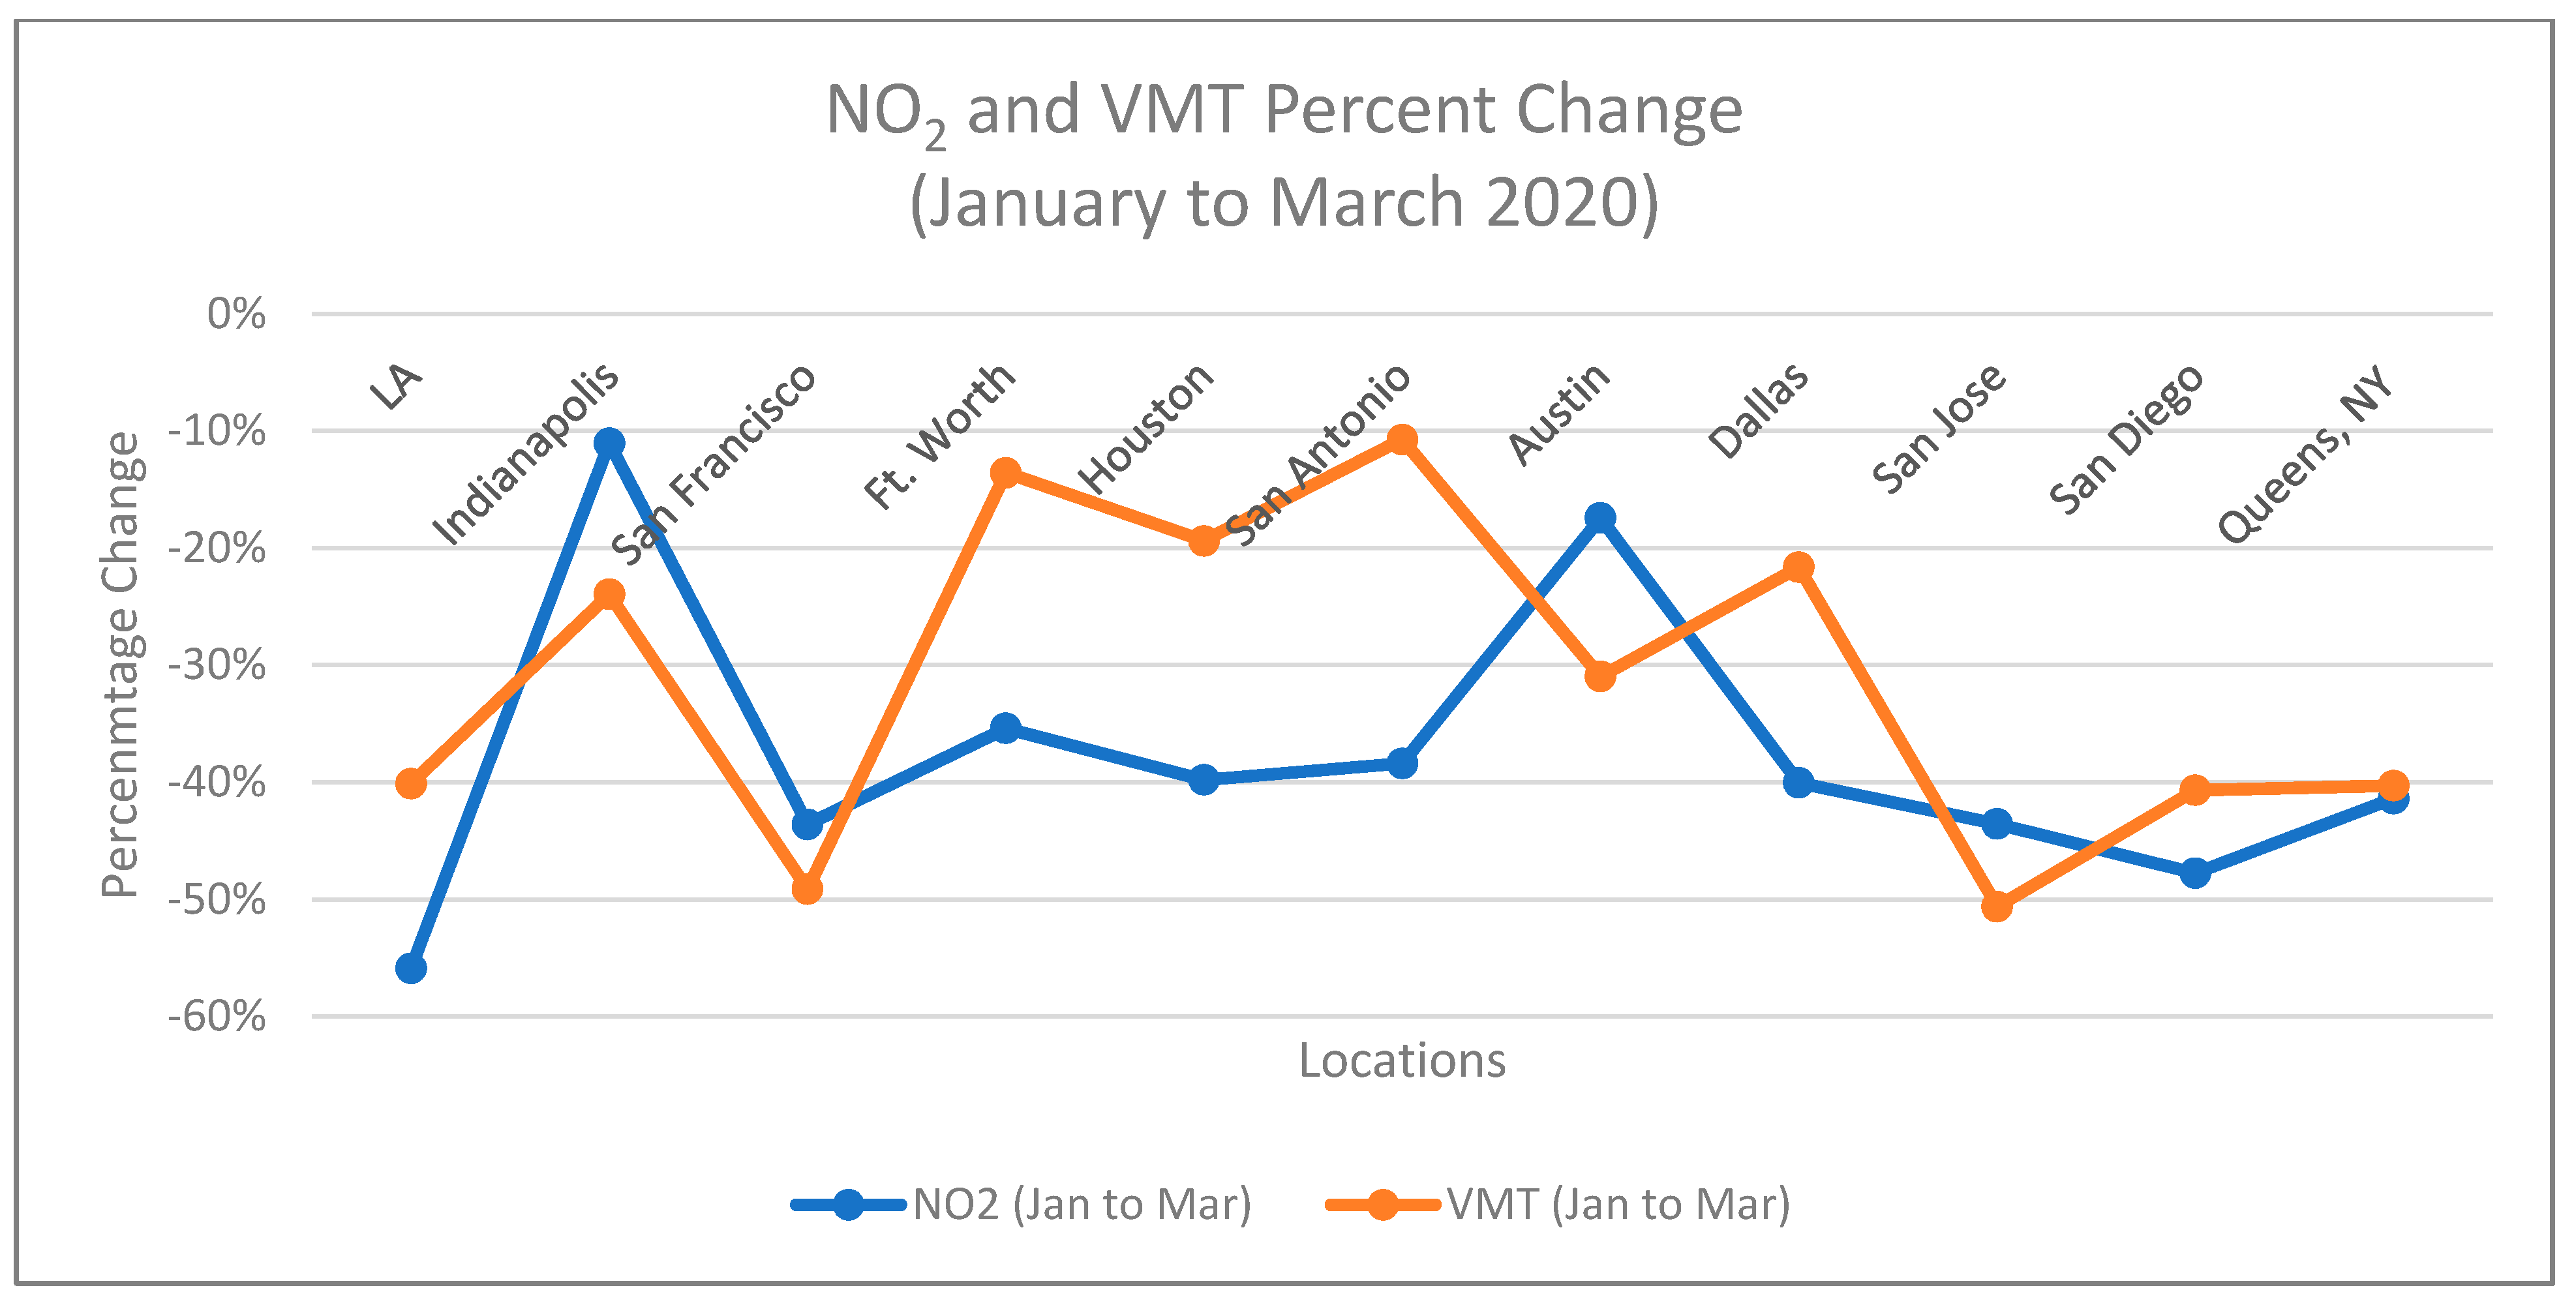
Our analysis of the impacts of stay-at-home orders utilized ground-based sensor data from 11 U.S. cities. We found an average reduction of NO
2 of 45% measured in March and April 2020 when compared with their 5-year averages of 29% (2015–2019) (
Table 1 and
Table 2). January to April 2020 resulted in a NO
2 drop between 14–65% versus its respective 5-year average drop between 13–51%. Four Texas cities had poor correlation between VMT and NO
2 (Ft. Worth, San Antonio, Austin, and Dallas). This offset compared to studies using satellite data is likely due to differences in the air being sampled with each approach (i.e., ground-level versus troposphere scale). San Diego, San Jose, and Indianapolis had the strongest strength of relationship between VMT and NO
2, as is illustrated from the correlation analysis.
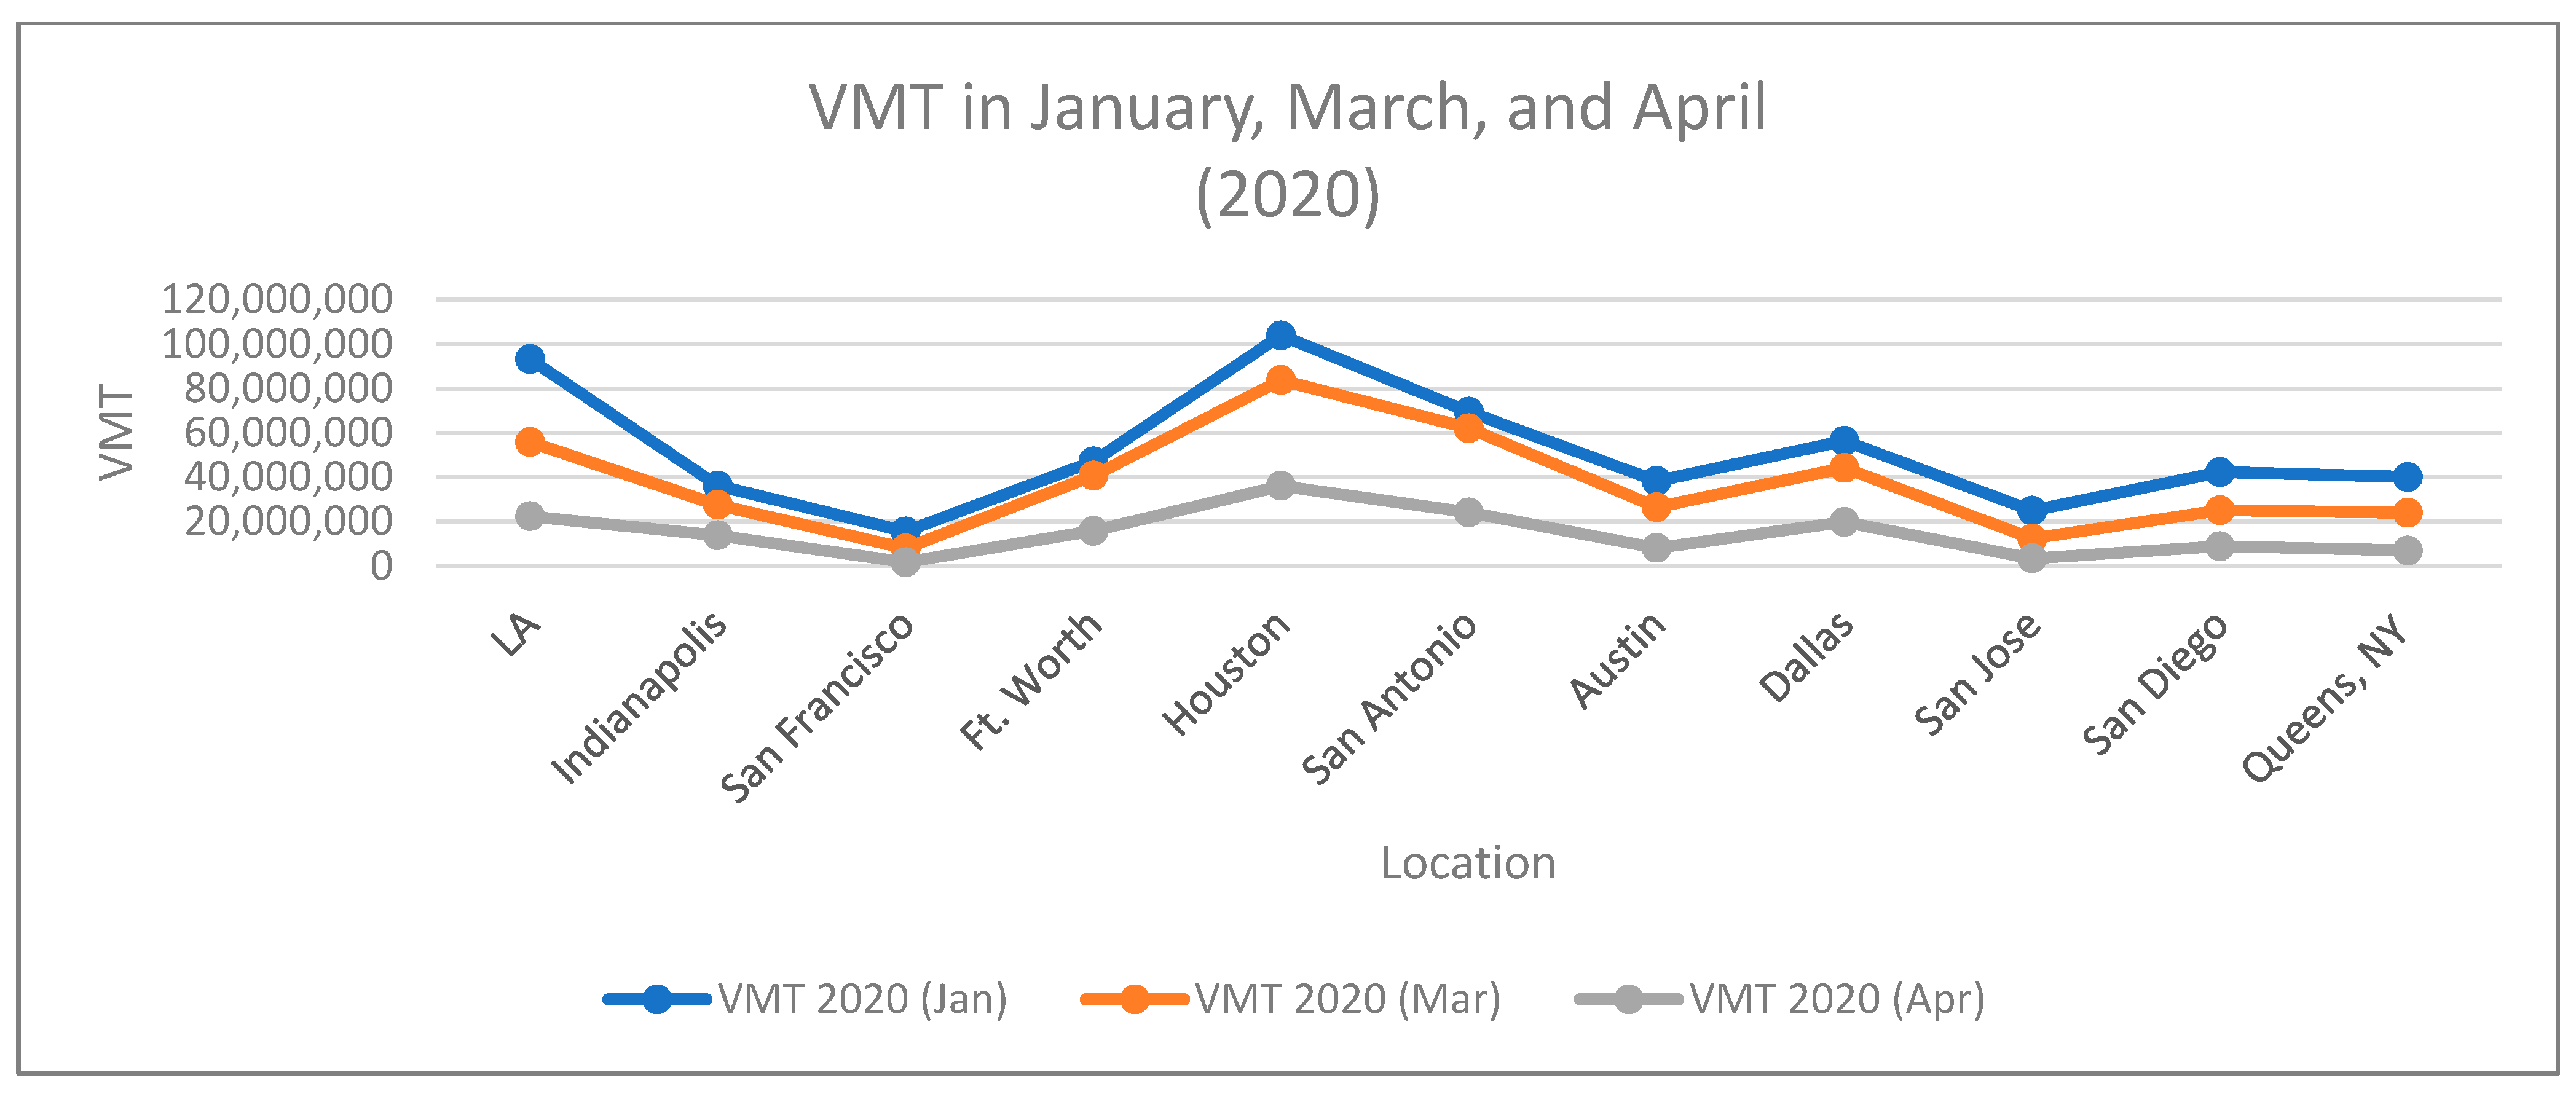
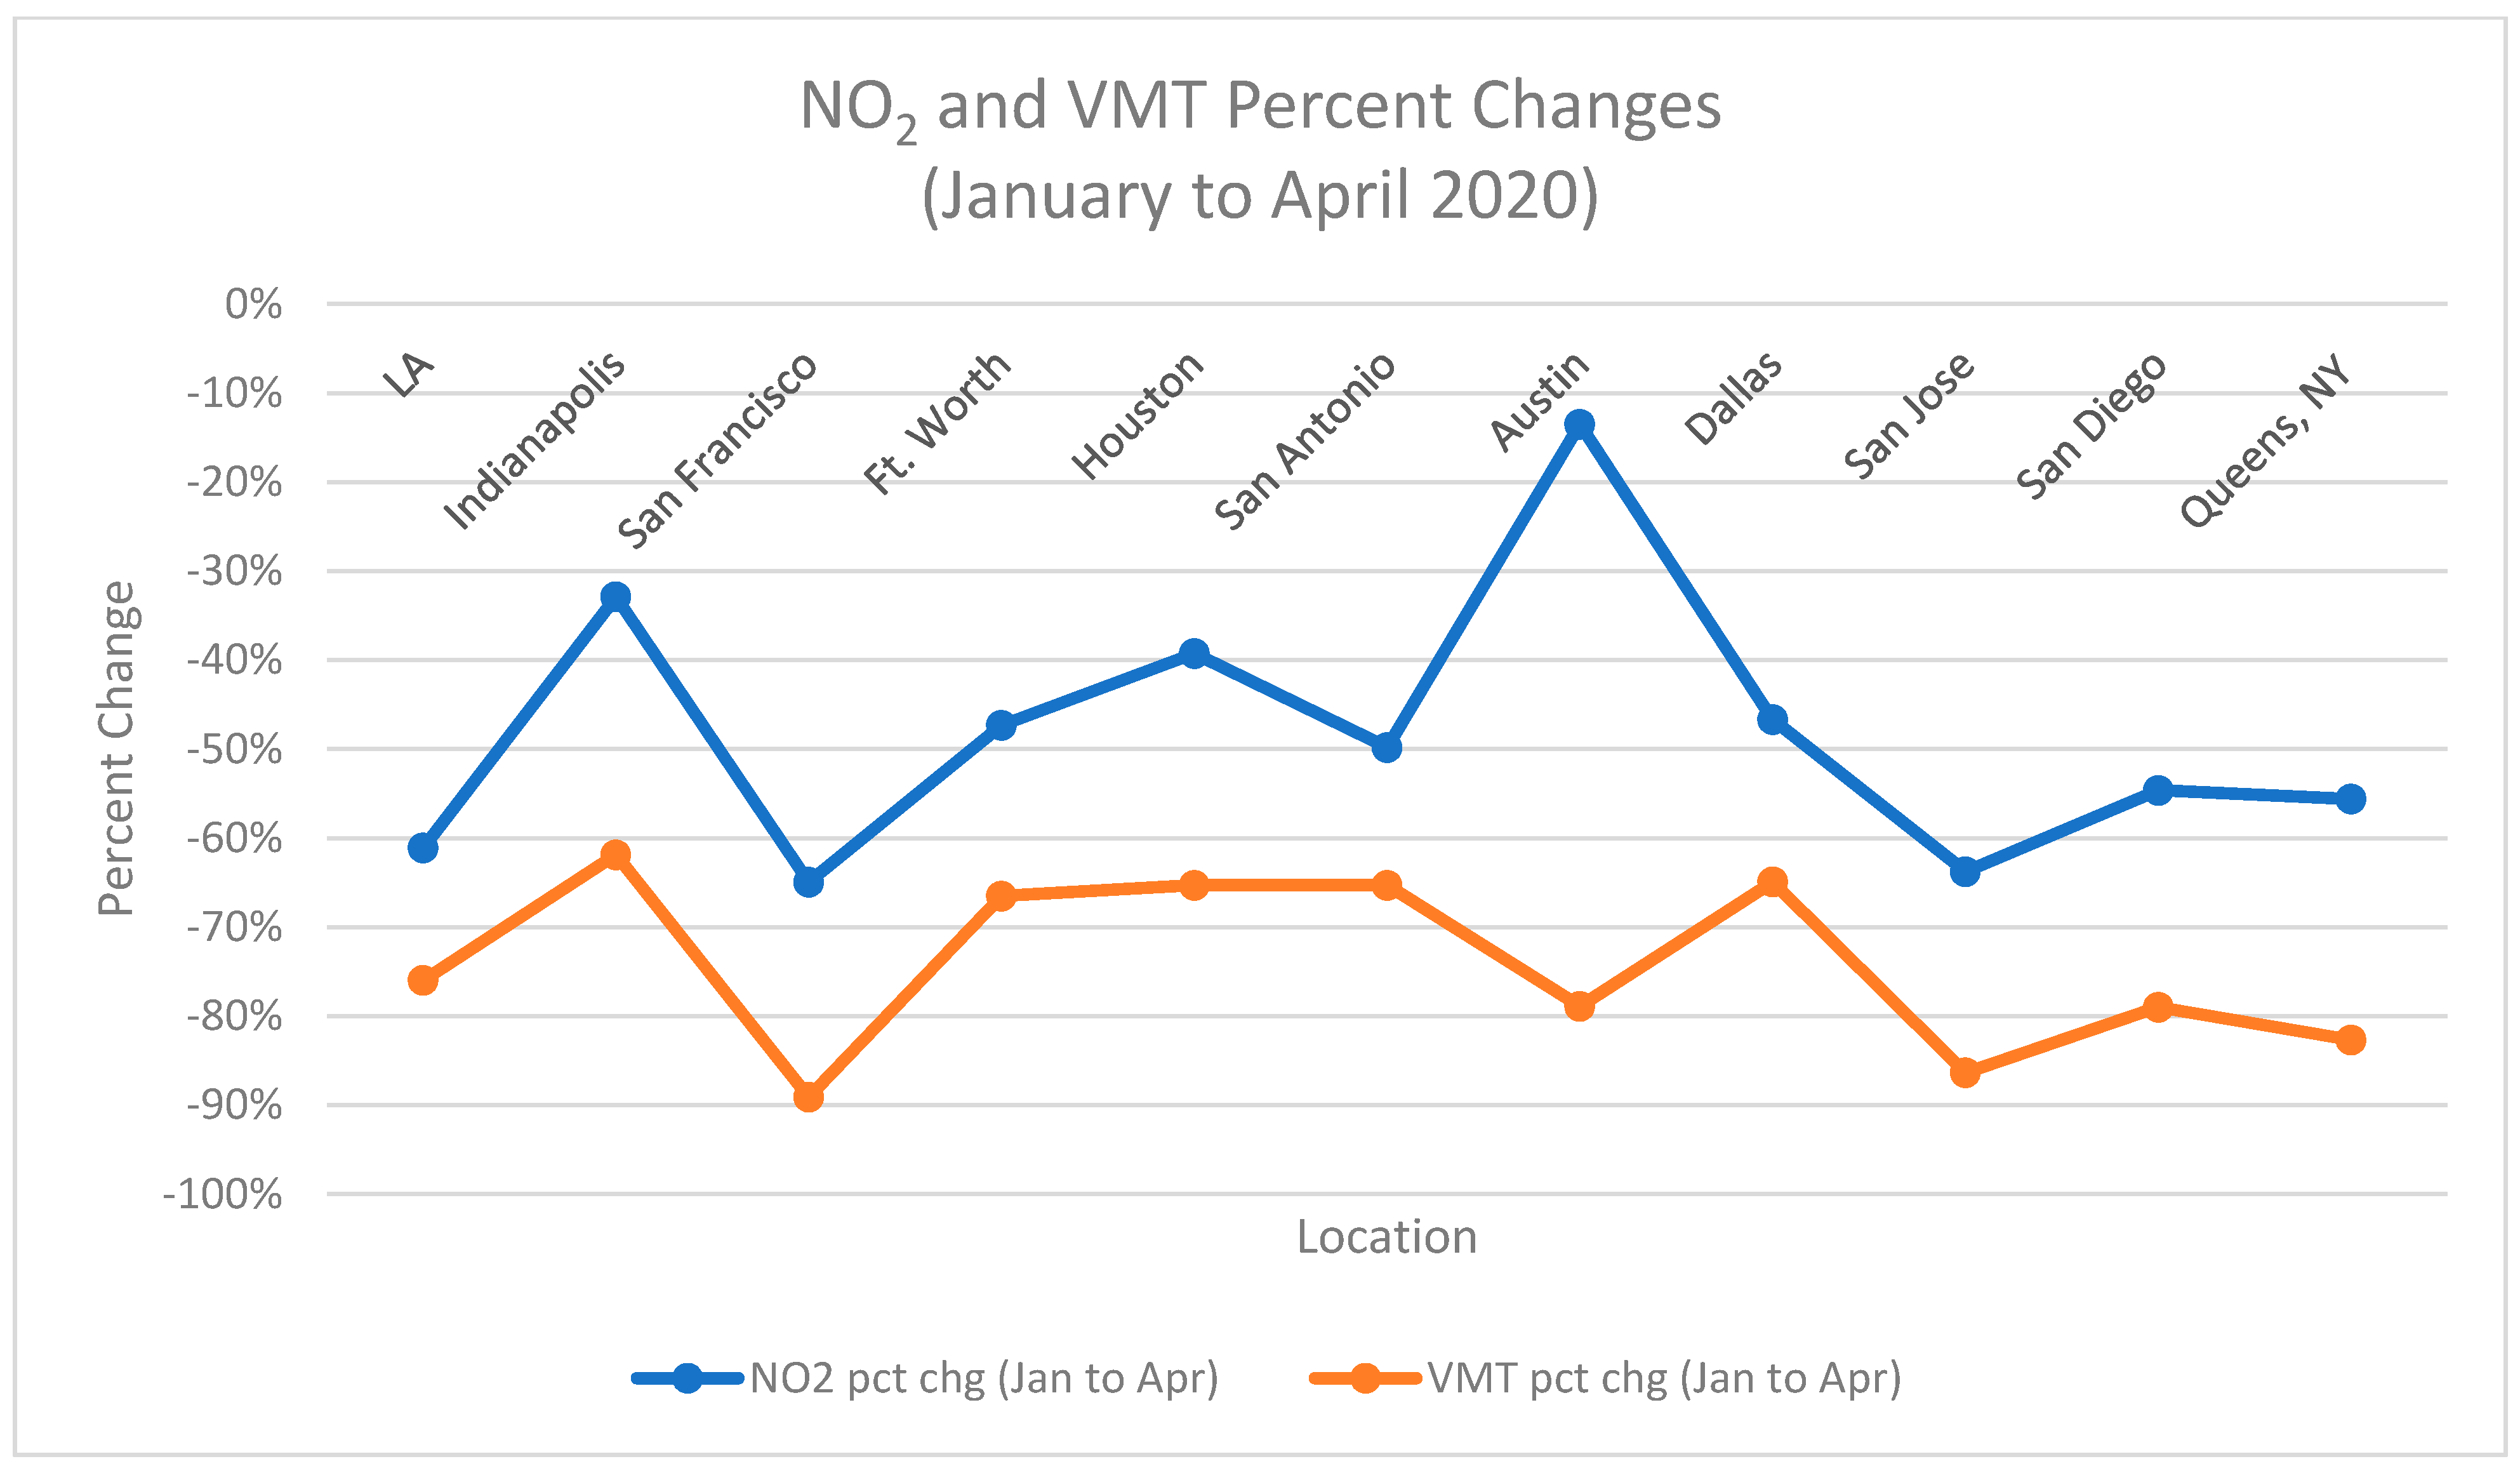
The VMT reduction in April 2020 ranged between 62% and 89% (
Table 3) when compared to January 2020. Average ratios of NO
2/VMT for the 11 locations indicates that for every 1,000,000 less VMT, NO
2 decreases by an average of 0.24 ppb (
Table 5). A 1,000,000 average VMT drop in San Francisco resulted in the most significant decrease in NO
2 (0.65 ppb), and Houston resulted in the least significant decrease (0.07 ppb). The petrochemical industry in Texas, and particularly in the greater Houston area, probably plays a significant role in NO
2 production [
36], and thus the VMT-NO
2 relationship is not likely the only significant factor influencing the scale of observed decreases in NO
2.
The lack of observed significant correlations between NO
2 and VMT for the four Texas cities remains unresolved. We suggest two options: (1) the locations of the fixed AQ sensors’ locations in relation to emission sources as related to traffic and non-traffic need to be identified and incorporated with meteorology, as their absence may not be ideal for capturing the more regional emission sources that are better characterized by satellite observations [
33] that might be an issue for more sprawling cities, and/or (2) VMT along with specific traffic volume and classification analysis from platforms like StreetLight may be a more robust metric for extrapolating local impacts of NO
2 emissions from vehicle sources. A much denser array of high-quality, ground-based sensors would likely have to be in place to address option (1) above, but with option (2), we can, at least for one of the cities (Indianapolis), compare NO
2 to actual vehicle count and classification data for several locations to address the issue.
Since VMT may not be the best indicator of pollution impacts, we can use traffic counts and vehicle classifications in addition to VMT to create localized indices that can assist local governments to plan and/or to adjust traffic flows to address the impacts of high NO
2 values. In future studies, placement of NO
2 sensors in relation to the NO
2 sources, which would also impact the sensors readings, should be considered. This NO
2/VMT ratio (
Table 5) should be tested in other cities in different seasons, which could be then used as a proxy in examining NO
2 production in different regions while gauging the impact of transportation changes. This can assist in classifying the impact of traffic changes in regions from the most sensitive to the least. In addition to sensor placement, meteorological conditions, like temperature, wind speed, relative humidity, and precipitation, also play a role in the transport of atmospheric gases [
37], which were also not considered in this analysis. Such conditions are not uniform spatially and have shown to cause column NO
2 readings to differ by about 15% over monthly timescales [
33]; high winds in particular can play a role in dispersing NO
2 pollutant concentrations throughout the year [
38].
A deeper look into vehicle counts and classification in Indianapolis indicates that the drop in average total vehicles percentage is almost identical to the percentage drop in its NO
2 values (
Table 8). An 1876-unit reduction in proxy truck average in Indianapolis results in lowering VMT, which in turn should yield a decrease in average NO
2 values by 1.11 ppb (
Table 8). Building on this process in time and space, this calculation can be useful in examining regions that should be targeted first and would have the biggest impact of the reduction in NO
2 through traffic manipulation. In places like Houston, where there is a presence of other significant industrial emissions of NO
2, their emission impacts should also be incorporated for a more comprehensive understanding.
In qualitative terms, the observed substantial reductions in NO
2 would, all other things being equal, provide some benefits to human health. With the return to business-as-usual practices, these health benefits will be transitory. Satellite measurements of NO
2 are outstanding for capturing regional trends, but the heterogeneity of NO
2 at the ground level in a given city [
39] is not well-captured and thus pinpointing that emission sources that are proximal to population centers at the fine scale should be a high priority for city planners and transportation design. This latter point is critical in that the highest concentrations of NO
2 and many other criteria air pollutants are disproportionately located in lower-income communities [
25,
40]. The overlapping issues of poor air quality and particular susceptibility, likely via co-morbidities, of these same communities to severe COVID disease [
41] speaks to the need to better constrain ground-level air pollution levels with an eye toward applying health equity solutions in cities.
5. Conclusions
The pandemic-driven shutdown policies instituted in cities across the U.S. substantially decreased many harmful air pollutants, including NO
2 [
33,
42]. We found this stable reduction within cities using ground-based monitors, and it is largely tied to reduced traffic volume, with other factors, such as industrial emissions, playing a variable role. Although ground-based monitoring ties the concentration data much more closely to communities and local health impacts than does more regionally comprehensive satellite data, the paucity of monitors and likely disconnects between metrics that are meant to capture traffic volume reduces their effectiveness from a public health standpoint.
This observed reduction in urban NO2 concentrations ranging between 11% and 65%, a rare silver lining of the devastating pandemic, is likely temporary, but it does point to the tight connection between traffic-related pollution sources and local impacts. This connection highlights a two-fold issue: that local air-pollution hotspots may exacerbate diseases like COVID and are currently under-studied, especially when it comes to examining pollutant burden by taking vehicle classifications into account, as we illustrated in Indianapolis, where we accounted for an average of 1.11 ppb reduction in NO2. Two actions that city planners can take to promote health equity in their communities are to implement environmental-monitoring programs that link data points (i.e., monitors) more strategically to population density and to implement local transportation and zoning policies that examine and protect community health and build health equity into the system.


