Article

Spatio-Temporal Modelling of the Change of Residential-Induced PM10 Pollution through Substitution of Coal with Natural Gas in Domestic Heating

by
Muzeyyen Anil Senyel Kurkcuoglu
* and
Beyda Nur Zengin
City and Regional Planning, Middle East Technical University, Ankara 06800, Turkey
*
Author to whom correspondence should be addressed.
Sustainability 2021, 13(19), 10870; https://doi.org/10.3390/su131910870
Submission received: 11 August 2021 / Revised: 15 September 2021 / Accepted: 22 September 2021 / Published: 30 September 2021
(This article belongs to the Special Issue Urban Air Pollution: Monitoring, Impact, and Mitigation)

Abstract

:
Air pollution has been one of the most critical urban problems. Urban energy networks are among the major sources of air pollution, particularly in highly populated urban areas. Residential heating, which is the primary cause of particulate matter (PM) emissions, contributes to the problem through the use of low-quality fuels, such as coal. Natural gas, although a fossil fuel, is a modern, relatively clean, and more efficient alternative in residential energy use, which helps to reduce particulate matter emissions. Coal was widely used in residential heating in İzmir, Turkey, whereas natural gas is a relatively new alternative which started to be used domestically in 2006. Switching from coal and other highly polluting fossil fuels to natural gas in urban energy distribution network has contributed to the alleviation of air pollution in the city in the past decade. Spatiotemporal analyses of the PM10 concentrations, and their relation to the natural gas investments, have been conducted in geographical information systems (GIS). The spatial distribution of the change in PM10 levels has been modeled with ordinary kriging for the 2010–2011 and 2018–2019 winter seasons. Interpolated PM10 surfaces show that there is a significant decrease in the emissions throughout the city in the overall, while the highest levels of decrease are observed in the southern part of the city. Overlaying the interpolated PM10 surfaces and the natural gas pipeline investments enables the demonstration of the mutual relationship between the change in emission levels and the energy distribution network. Indeed, the spatial distribution of the pollution concentrations appears to be parallel to the natural gas investments. The pipeline investments were intensive during the 2010–2018 period in the southern districts when compared the rest of the city. The use of natural gas in residential heating contributed to the decrease in PM10 emissions.

1. Introduction

Sustainable development is viewed as comprising the environmental, sociocultural, and economic dimensions [1], while air pollution is one of the major concerns threatening global sustainability. Air pollution has environmental consequences besides its health effects and socioeconomic costs [2,3]. Air quality is considered as one of the major factors that contributes to the quality of life in densely populated urban areas [4]. The air pollution problems of the future are predicted on the use of more and more fossil and nuclear fuel as the population of the world increases [5]. Natural gas is one of the fossil fuels, but it is a more environmentally and economically conscious alternative to coal, oil and diesel. It is an efficient, relatively clean, and economic energy source [6], of which the global warming emissions from combustion are much lower than those from coal or oil [7,8]. The spatial distribution of the pollutants is important to reveal the impacts due to the level of exposure and take the necessary actions regarding that. Zhao et al. [9] assert that scientifically identifying the changing characteristics and patterns of the spatial distribution of the PM2.5 concentration and revealing the patterns of the population exposure risk of PM2.5, are of great significance to the coordinated development of regional environmental protection and economy. A determination of the variability of pollutants in time and space appears to be necessary in order to provide preparation towards measures to deal with their presence [10].
Replacing coal with relatively cleaner alternatives has been on the sustainability agenda of many countries, both in the generation and the distribution phases of the urban energy network. The literature on the environmental impacts of fuel sources in generation phase is quite massive. Switching fuel types in the distribution phase and its spatial distribution, particularly with regard to natural gas substituting for other urban energy alternatives, on the other hand, is overlooked in general. Residential coal consumption has decreased significantly since 1990 in most developed countries, due to fuel switching [11]. With the help of economic transformation, low–quality coal and wood were substituted mostly by gas in local heating in Central and Eastern European Countries [12]. Coal demand is still high in Asia [13]. However, it is declining in North America and Europe as power generators turn increasingly to cheaper and cleaner natural gas, wind, and solar power. Countries such as China, where air pollution is a critical issue, are taking steps to curb the use of coal and switching to cleaner alternatives, such as natural gas. Using natural gas instead of coal as a fuel for heating reflects the adjustment and transformation of the energy use structure in China towards the realization of specific projects [14], such as “coal–to–gas”. With the increasing emphasis on air pollution prevention, the issue of natural gas substitution for coal has been raised in many large Chinese cities [15]. Coal control is a critical part of the Air Pollution Prevention and Control Action Plan enacted in 2013 in China [16], which covers measures such as the replacement of coal with natural gas or electricity. Approximately 2.53 million households have completed the switch from coal–burning stoves to natural gas or electricity stoves in rural areas surrounding Beijing and Tianjin since 2017 [17].
Fossil fuels are still the primary source of energy in Turkey, although renewable energy has more to offer in terms of sustainability. Renewable energy production is a relatively new area [18], and Turkey as an energy–importing country [19]. Yet, renewable energy alternatives can be utilized to decrease the country’s energy dependency. Petroleum, gas, and coal constitute the highest share in energy consumption, while the country meets only 25% of its energy from domestic resources [20]. Improving air quality is another target. As a candidate country for EU membership, Turkey is expected to meet the air quality standards that set upper limits for pollutant concentrations (40 µg/m3 for PM10 annually). Member States are setting sustainability targets and implementing various strategies to meet the EU standards. Poland, for instance, set goals, such as reducing greenhouse gas emissions, increasing the share of renewables, and improving energy efficiency, not only to protect the environment but also to strengthen the economy [21]. It appears to be possible for the Czech Republic and Slovakia to reduce pollutant emissions and energy consumption with proper energy policies, although increasing the share of renewable energies to the planned levels seems unlikely to be achieved, like the other member States that have joined the EU after 2004 [22].
However, it is important to remember that developing the renewable energy sector requires extra financial resources [23] and a balance should be sought between environmental protection and economic development in order to achieve sustainability [21]. Since fossil fuels dominate the energy sector, and replacing them with renewable resources would require time and financial resources, it is important to minimize the negative effects of the fossil fuels first. Replacing coal–fired burners with gas or electricity as one of the strategies for reducing the amount of pollution [24]. Natural gas has played an important role in reducing carbon intensity and emissions in the past decade [25], while it is more efficient in terms of generating more energy for similar levels of emissions as coal, according to the U.S. data. At that point, natural gas can be considered as a relatively better alternative because of its advantages over the other fossil fuels, particularly in residential heating, in terms of economic efficiency and environmental concerns. Greenhouse gases are emitted during the generation stage of natural gas. Natural gas is responsible for the production of nearly half as much carbon dioxide per unit of energy compared to coal, but if the methane leaks are controlled during the production stage, it certainly has benefits over coal [17], and the pollutant emissions are the lowest at the distribution stage, when residential heating is considered.
The use of natural gas for space heating resulted in a significant improvement in air quality in most Turkish cities in the last 20 years [26]. Households substituting coal with natural gas resulted in 93.3 million tons of emission savings in three years from 2017 to 2019 in Turkey [27]. However, it can also be noted that PM levels are still a problem in large metropolitan areas because of the use of coal for heating by low–income households [26,28,29,30,31]. The studies consider the overall change in pollutant emissions without indicating the variations in space over time. In this study, a spatiotemporal analysis and a mapping of the effect of natural gas usage in residential heating intends to fill this gap.
The aim of this study is to show the change in the spatial distribution of the PM10 concentrations by replacing low–quality fossil fuels with natural gas. Air pollution levels are compared for the two periods, the 2010–2011 and 2018–2019 winter seasons, through interpolated surfaces of the city of İzmir, Turkey. The difference between two periods helps to identify how switching fuel types could contribute to environmental quality and, accordingly, sustainability in the overall. Kriging method is used to generate the interpolated pollution concentration surfaces. The method has become widely used in environmental pollution studies, in various fields, such as: the modelling and mapping of air pollution [32,33,34,35,36,37,38,39,40,41,42,43,44]; soil and mining contamination [45,46,47,48,49,50,51,52,53,54]; and noise pollution [55,56,57,58]. Utilizing spatial interpolation through the kriging method enables the prediction of pollution levels in areas where no monitoring stations or observations are present in these studies. Thus, larger surfaces can be evaluated in terms of the pollutant concentrations.
The study discusses the characteristics of the study area, İzmir, in the following part, and continues with the data and the method. In the fifth part, the results are presented, along with a critical discussion of the findings. In the last part, concluding remarks are given.

2. Study Area

Air pollution has been one of the most significant problems in İzmir. It is the third largest province of Turkey with a population of 4,394,694 in 2020 [59], being located in the western part of the country, having a long coastal line to the Aegean Sea. The province has 30 districts in total, while 70% of the population inhabits 11 central districts located along the gulf making up the City of İzmir, while 10 of them (Karabağlar, Buca, Bornova, Konak, Karşıyaka, Bayraklı, Çiğli, Gaziemir, Balçova, and Narlıdere) are within the study area.
The city has faced several environmental challenges, due to the rapid population growth resulting from rural–to–urban migration, uncontrolled urbanization along with unauthorized housing development, and intensive industrial activities. Air pollution ranked the third in İzmir among all environmental problems, following water pollution and waste pollution, in the priority rankings of environmental problems according to the 2017 statistics of the Environmental Problems and Priorities Assessment Report of Turkey released by the Environmental Impact Assessment, Permit and Inspection General Directorate [60]. In the report, it is also stated that residential heating is the number one source of air pollution, and PM10 emissions are the most significant source of air pollution. Households using lignite, imported coal, diesel, and fuel oil contribute to high levels of pollutant concentrations, while lack of institutional and regulatory frameworks double the problem. Switching to natural gas in domestic use has been a deliberate energy policy of the İzmir Greater Municipality to achieve sustainability, meet the energy needs in a much cleaner way, and reduce air pollution [61,62].
İzmir has a Mediterranean climate, with hot and humid summers, and mild and rainy winters, yet the average temperatures fall below 12 °C during the winter months, which necessitates heating, particularly in December, January and February. The winters in İzmir are generally characterized by meteorological conditions in which stable atmospheric stratification, calm (low wind speed) weather, and a ground–based inversion are present [63]. Hence, domestic–heating related pollution arises particularly during the winter season.
PM pollutants had the highest share in domestic heating [64], with 56% among all other pollutants in İzmir by 2004. Coal was utilized as the major source of residential heating with 74%, followed by electricity with 12%, natural gas with 6%, and geothermal with 2% in the city during the 2008–2009 winter season [65]. Natural gas, as a newly introduced urban energy system, was meant to replace coal over time, in İzmir. The investments started in 2005 by İzmirGaz, the only firm authorized to construct the pipeline network and distribute the service. After receiving the official license, natural gas was first served to residential customers in Mavişehir, Karşıyaka, in 2006. Natural gas pipelines were expanded to 25 districts until the end of 2018, along with increasing distribution line kilometers and the number of customers (Figure 1). The number of customers increased six–fold while total distribution lines increased threefold from 2010 to the end of 2018.
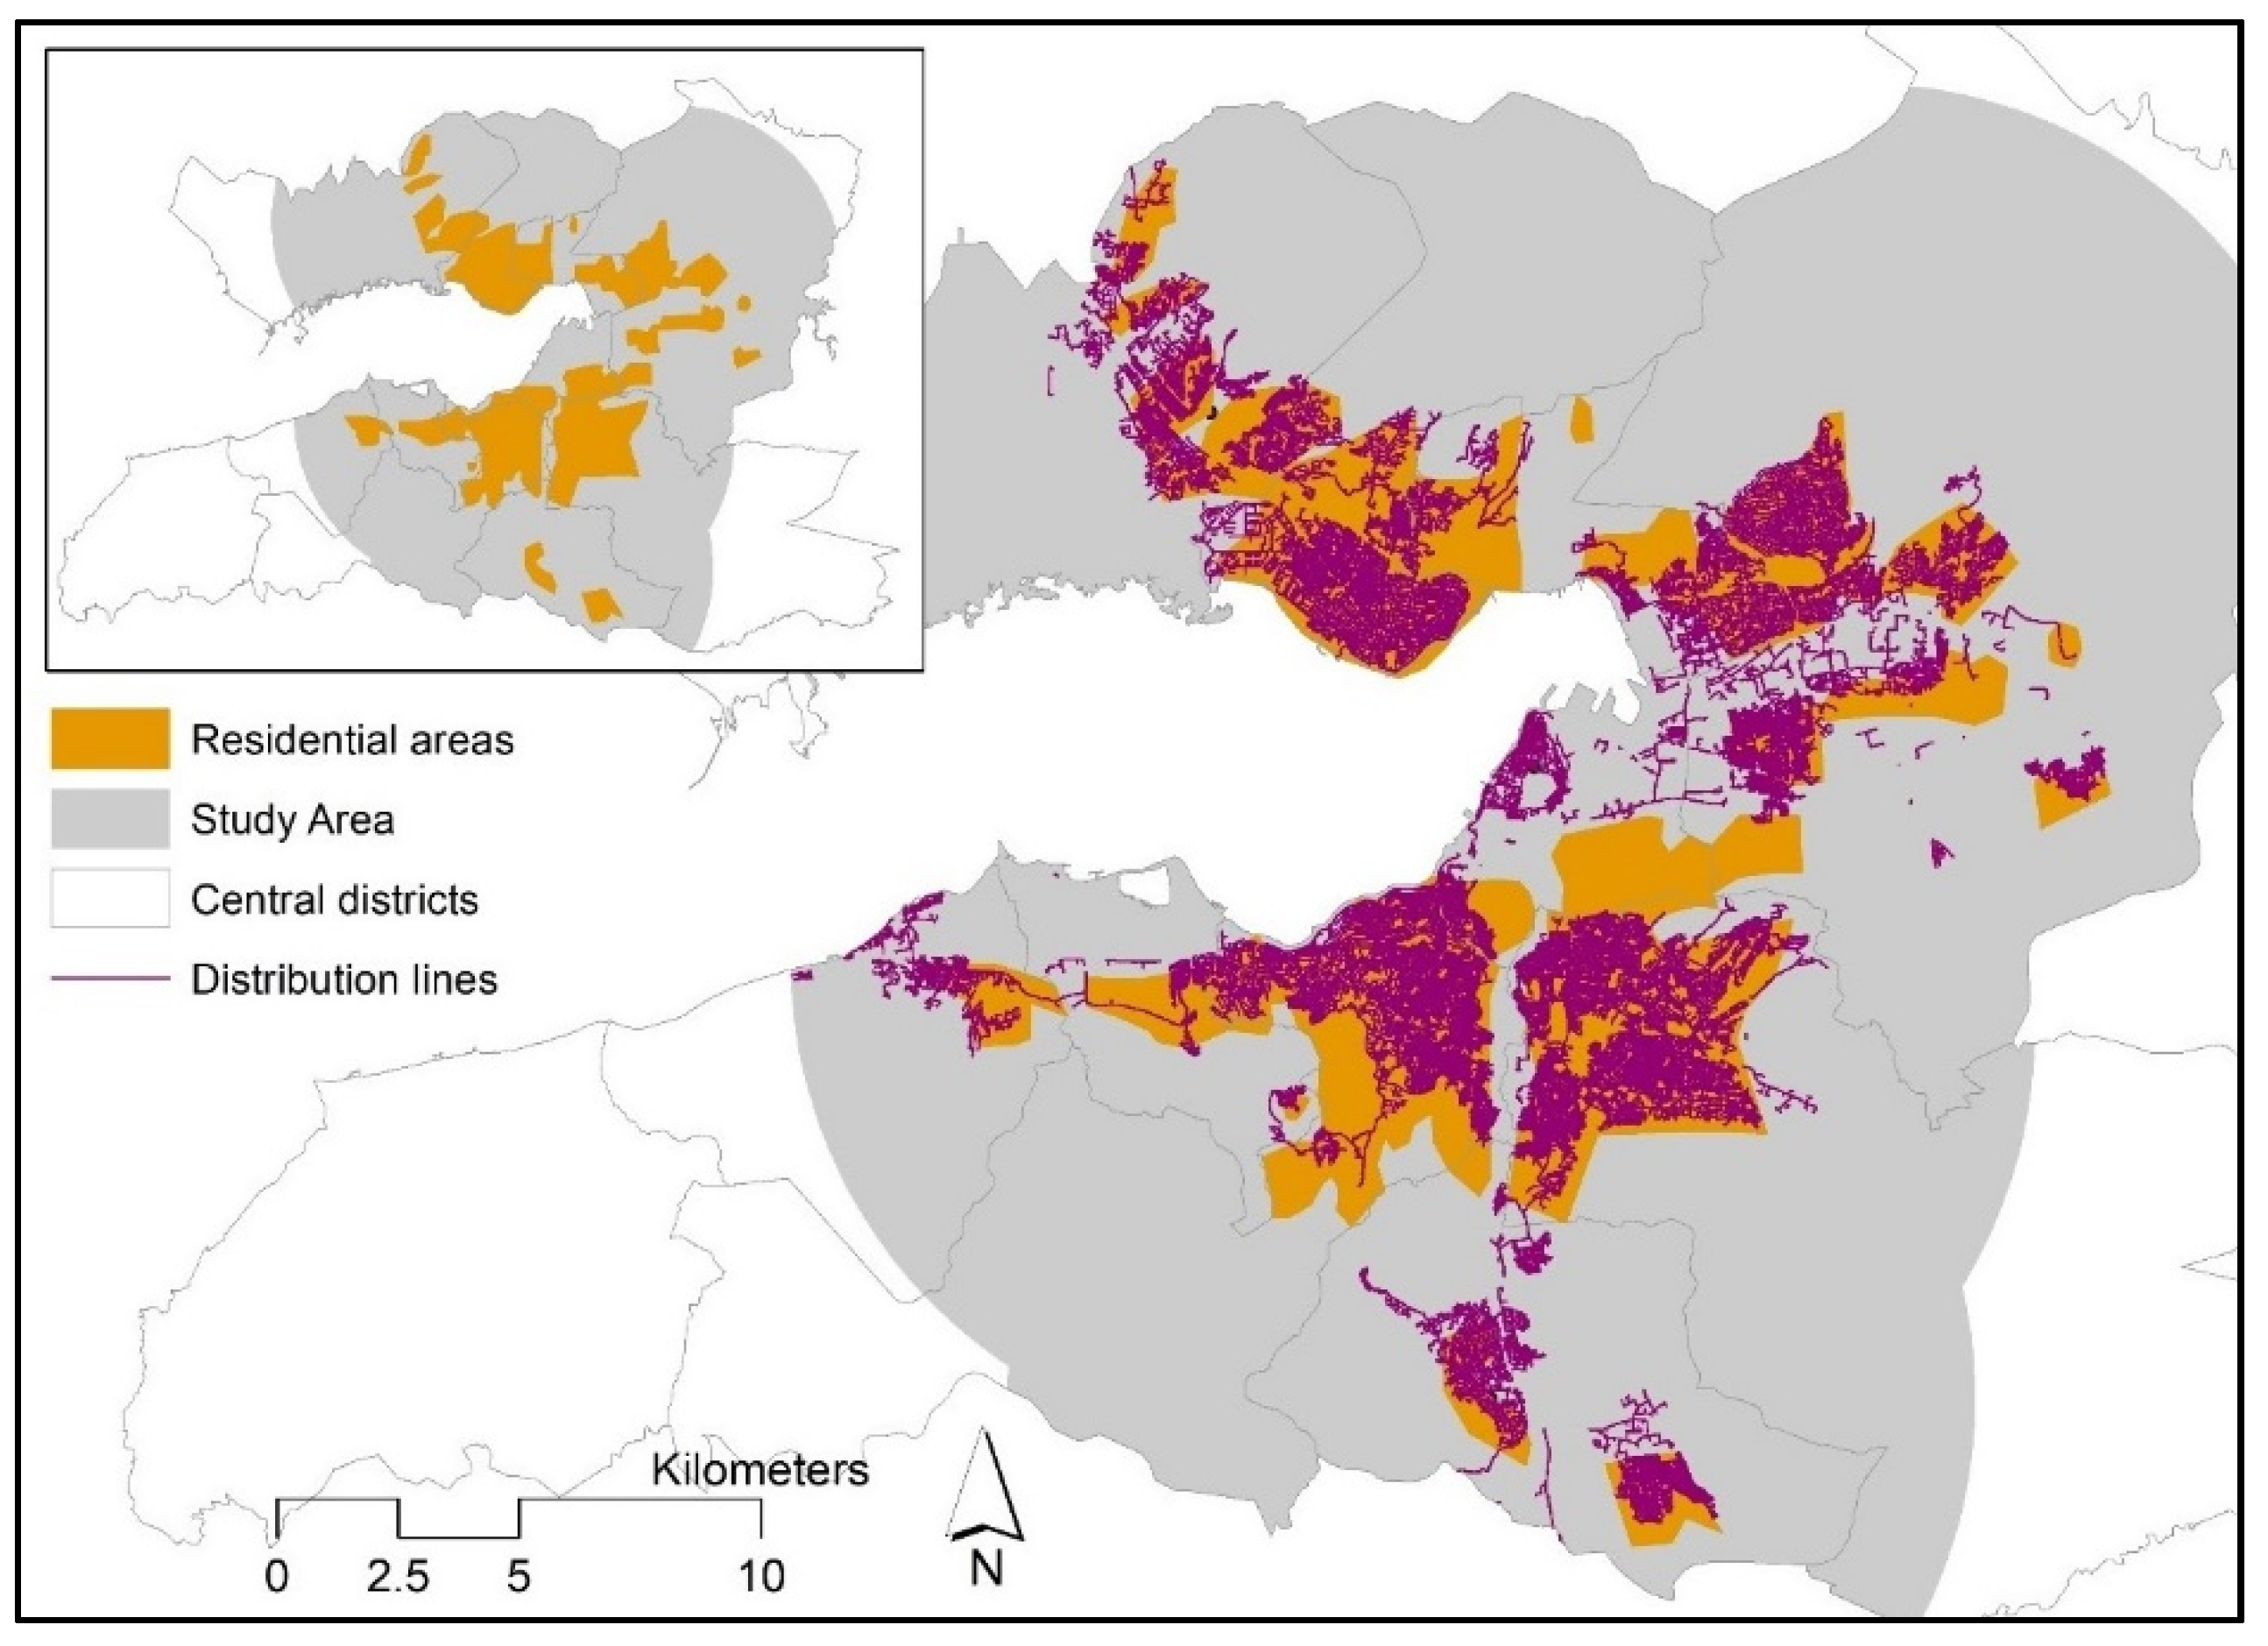
Distribution lines cover mostly the residential areas in the central districts (Figure 2). The residential areas not receiving the natural gas service mostly include unauthorized housing and physically declined areas that are awaiting, or in the process of, urban transformation.

3. Data

The research has two main datasets. The first one is the air pollution data, in terms of PM10 concentrations, measured in air pollution monitoring stations in İzmir. The second one is the natural gas distribution lines with regard to the investment years and locations.
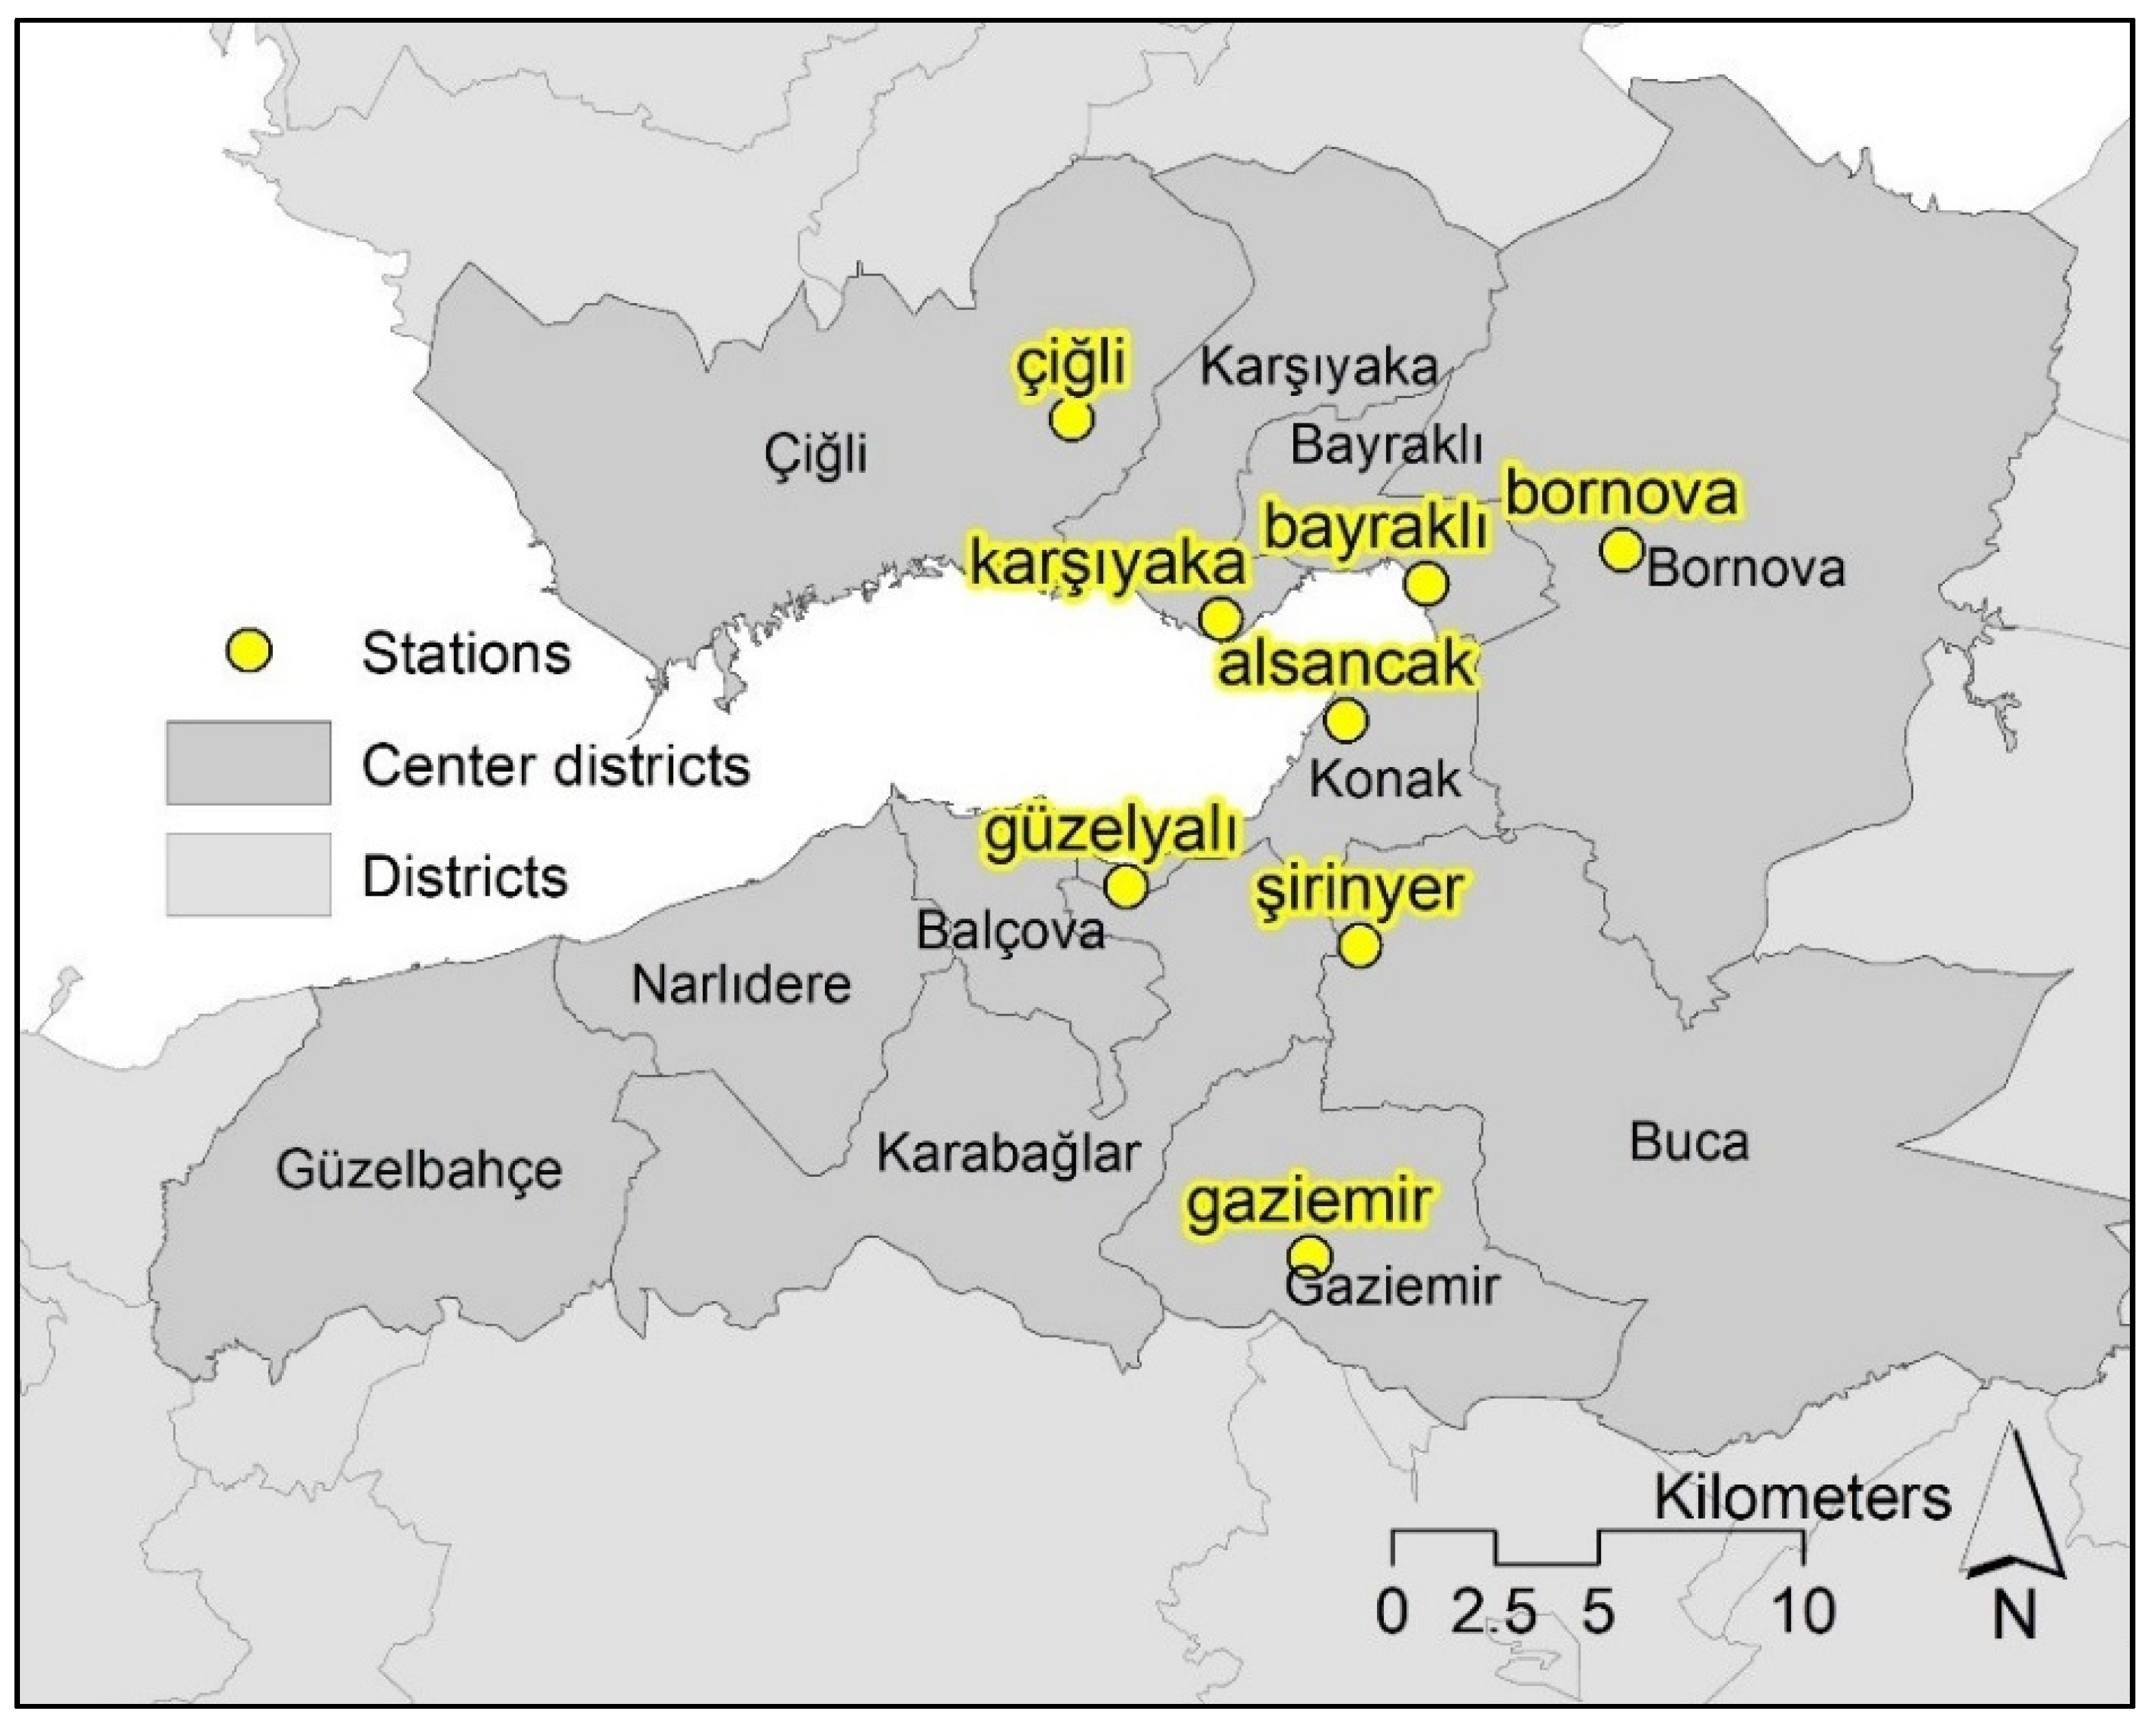
Air pollution data was retrieved from the Ministry of Environment and Urbanization’s National Network of Air Quality Monitoring. The monitoring and recording of hourly pollutant gas emissions, and compiling them in inventories, indeed became compulsory with the enactment of the Air Quality Assessment Directive in 2008. However, the directive took a few years to be implemented since setting up the system required time. There are 23 monitoring stations in İzmir recording different pollutants, yet not all of them are available at each station for each period. The most comprehensive data has been available since 2010 and, thus, the base period was taken as the 2010–2011 winter season. PM2.5 is not monitored regularly in any stations, whereas PM10 records are available in eight stations (Figure 3), all of which are located in the central districts. The closest station out of İzmir is located in Manisa, the neighboring city to İzmir which is located in the north–eastern part of the city. However, the geographical thresholds between the two cities, particularly the hilly and woodland areas, such as Mount Spil, a 1500 m tall mountain covered with forest, prevent PM10 flows to a certain degree. In addition, Manisa station is approximately 26 km away so that it is disregarded as a result of it being beyond the range of the model outputs. Although more observations are better in statistical terms, the number of stations were limited to 22 [41], 13 [35], 10 [34], 8 [31], 7 [33], and 6 [28].
Residential heating is activated when the outside temperature falls below 15 °C, according to the İzmir Governorship, the Provincial Directorate of Environment and Urbanization Decisions [66]. The Turkish State Meteorological Service releases long–term averages of the maximum, minimum, and mean temperatures in the long term (1938–2019). Even the average maximums do not exceed 15 °C in İzmir in December, January, and February [67]. The availability of monitoring stations with PM10 observations prior to 2010 are more limited, therefore, the base season is taken as the 2010–2011 winter season, covering December 2010, and January and February of 2011. The same months are also considered for the comparison period of 2018–2019. Averages of daily observations are calculated for each station in three months for both periods. The final dataset of PM10 averages for the 2010–2011 and the 2018–2019 winter seasons are given in Table 1.
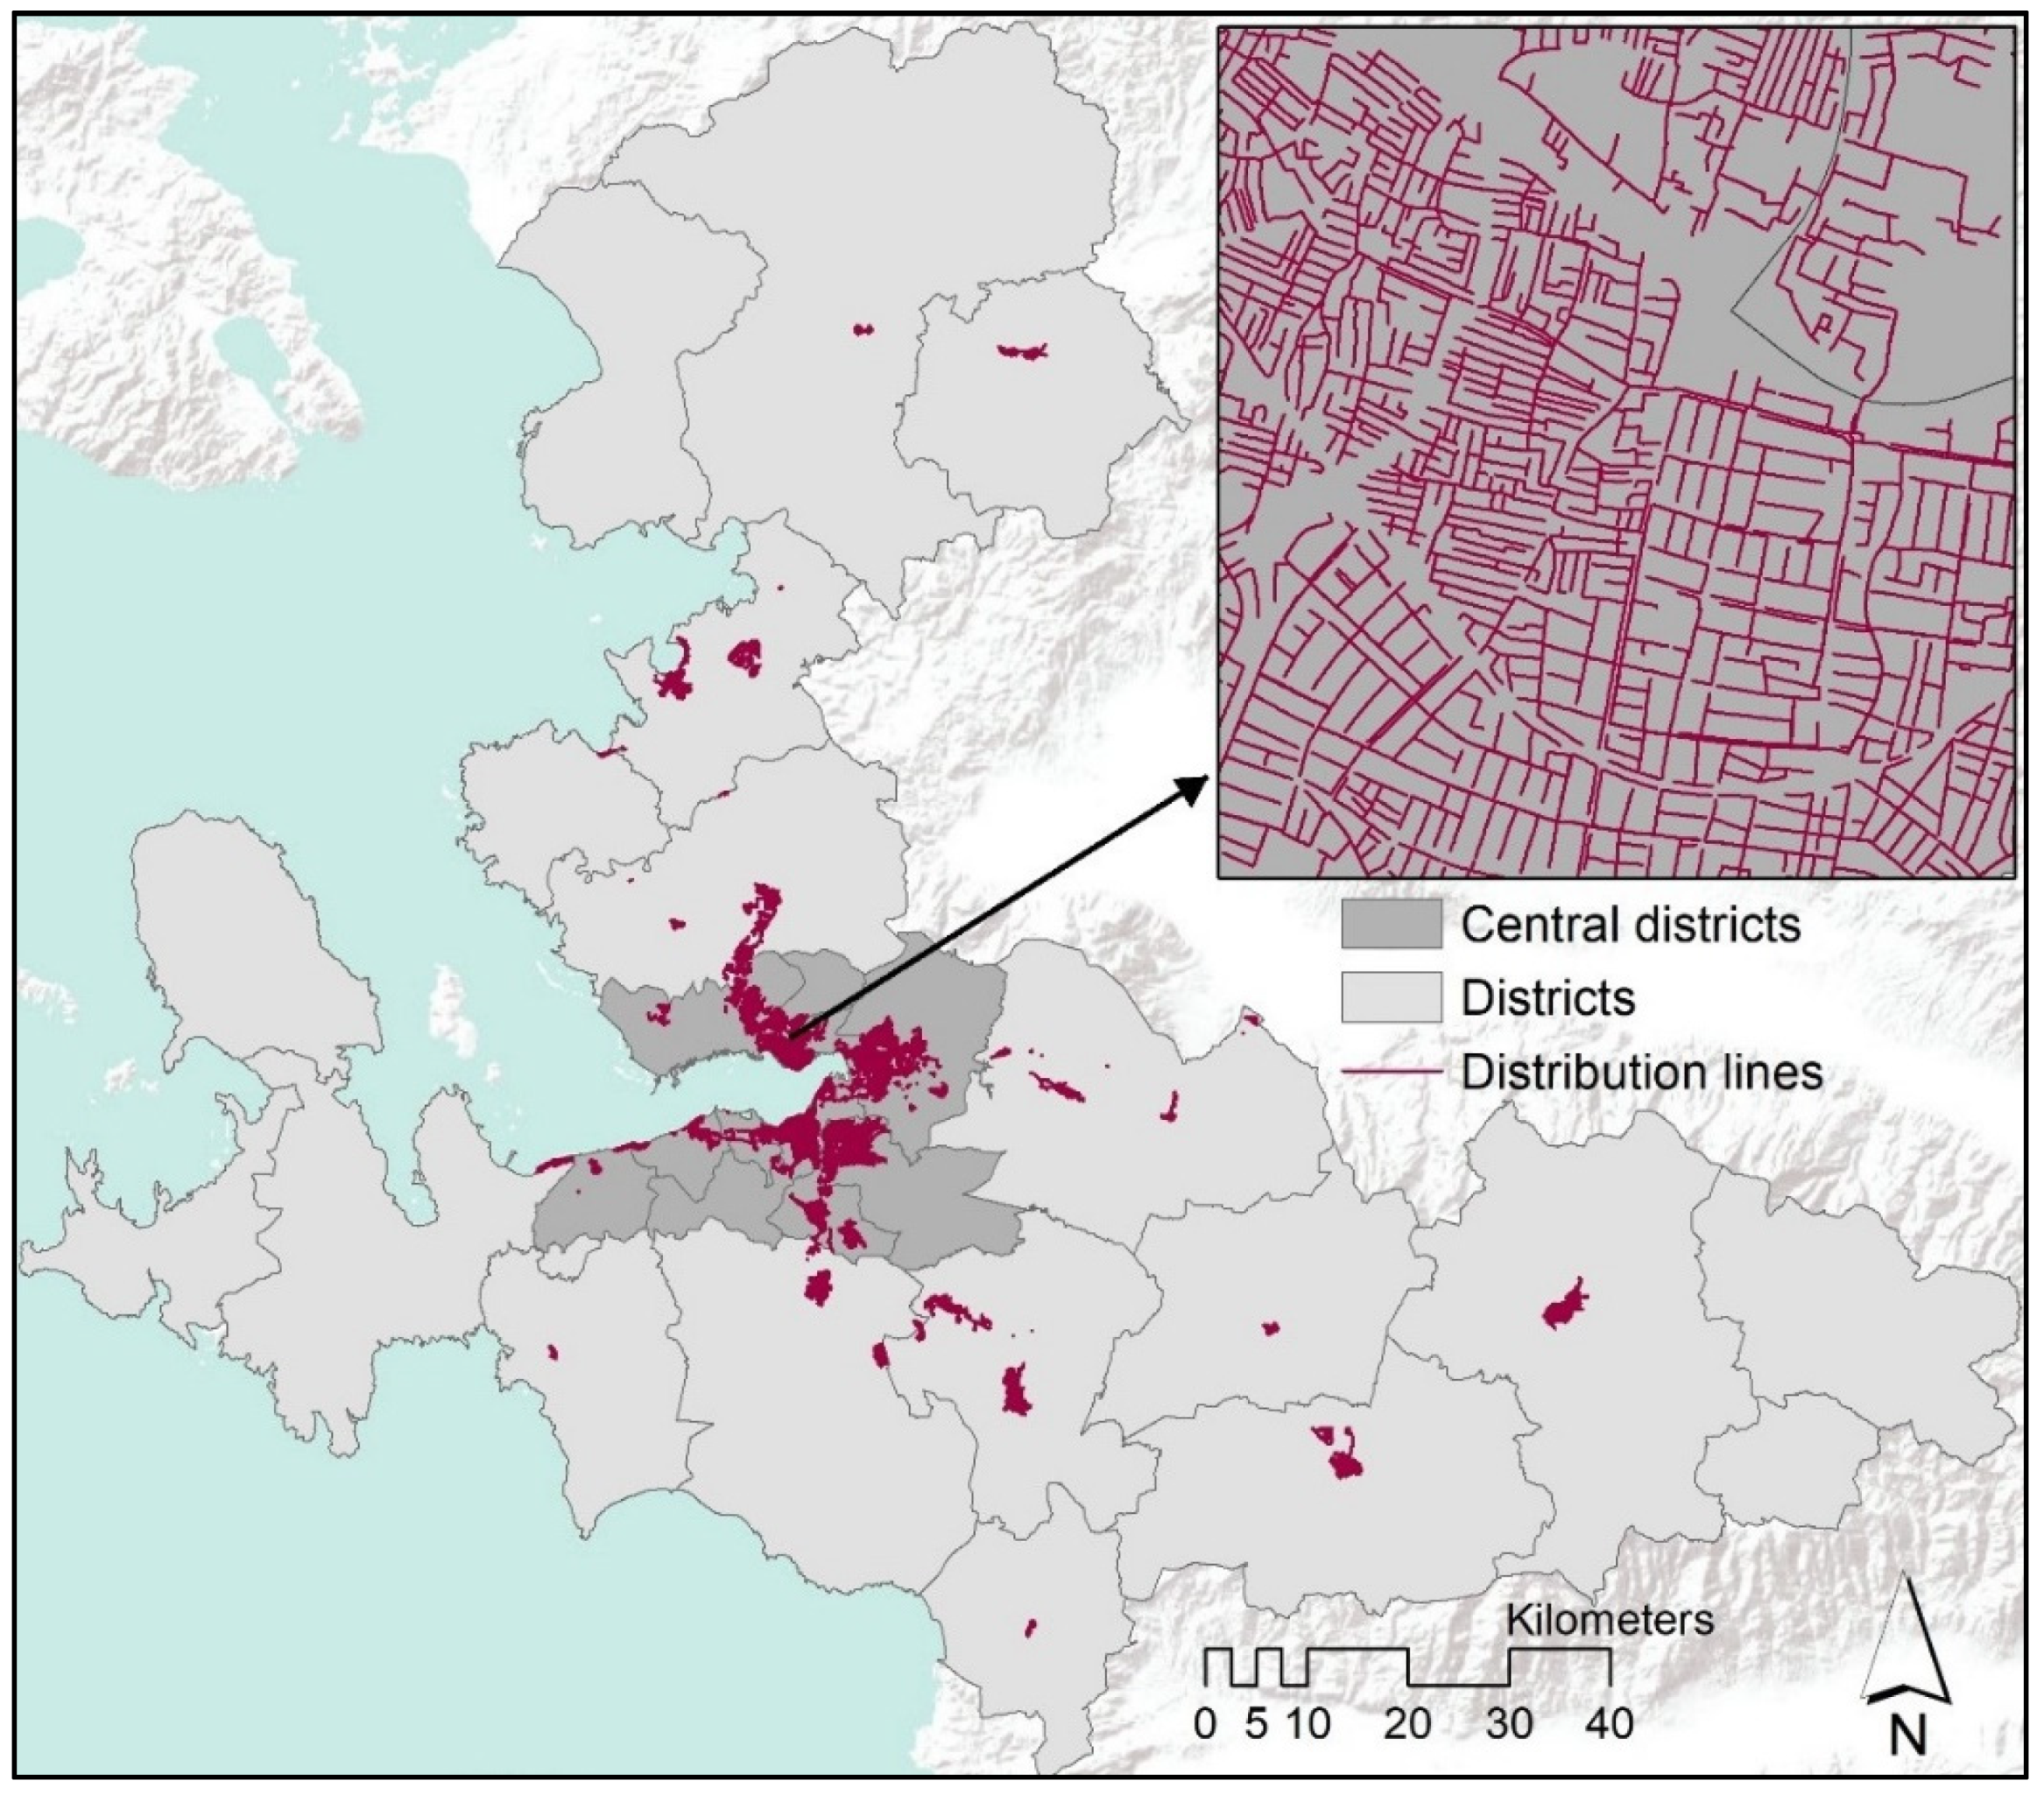
The distribution lines shapefile (Figure 4) is retrieved from İzmirGaz, the only authorized firm to distribute natural gas in İzmir. The shapefile is in vector format and the line attributes cover the investment year and the diameter of the pipelines. The investment year covers a period from 1 January 2005 to 19 December 2018.

4. Method

The analyses of the change of air pollution throughout the years, and its relation to the natural gas investments, are conducted via geographical information systems (GIS). The analyses have four main parts: (1) setting the study area; (2) the interpolation of PM10 emissions using the kriging tool in the geostatistical analyst of ArcMap 10.7 for the 2010–2011 and 2018–2019 winter periods; (3) generating the difference map showing the change in PM10 concentrations between the two periods; and (4) overlaying the natural gas distribution lines with interpolated surfaces in accordance with the study periods and investment years (Figure 5).

4.1. Setting the Study Area

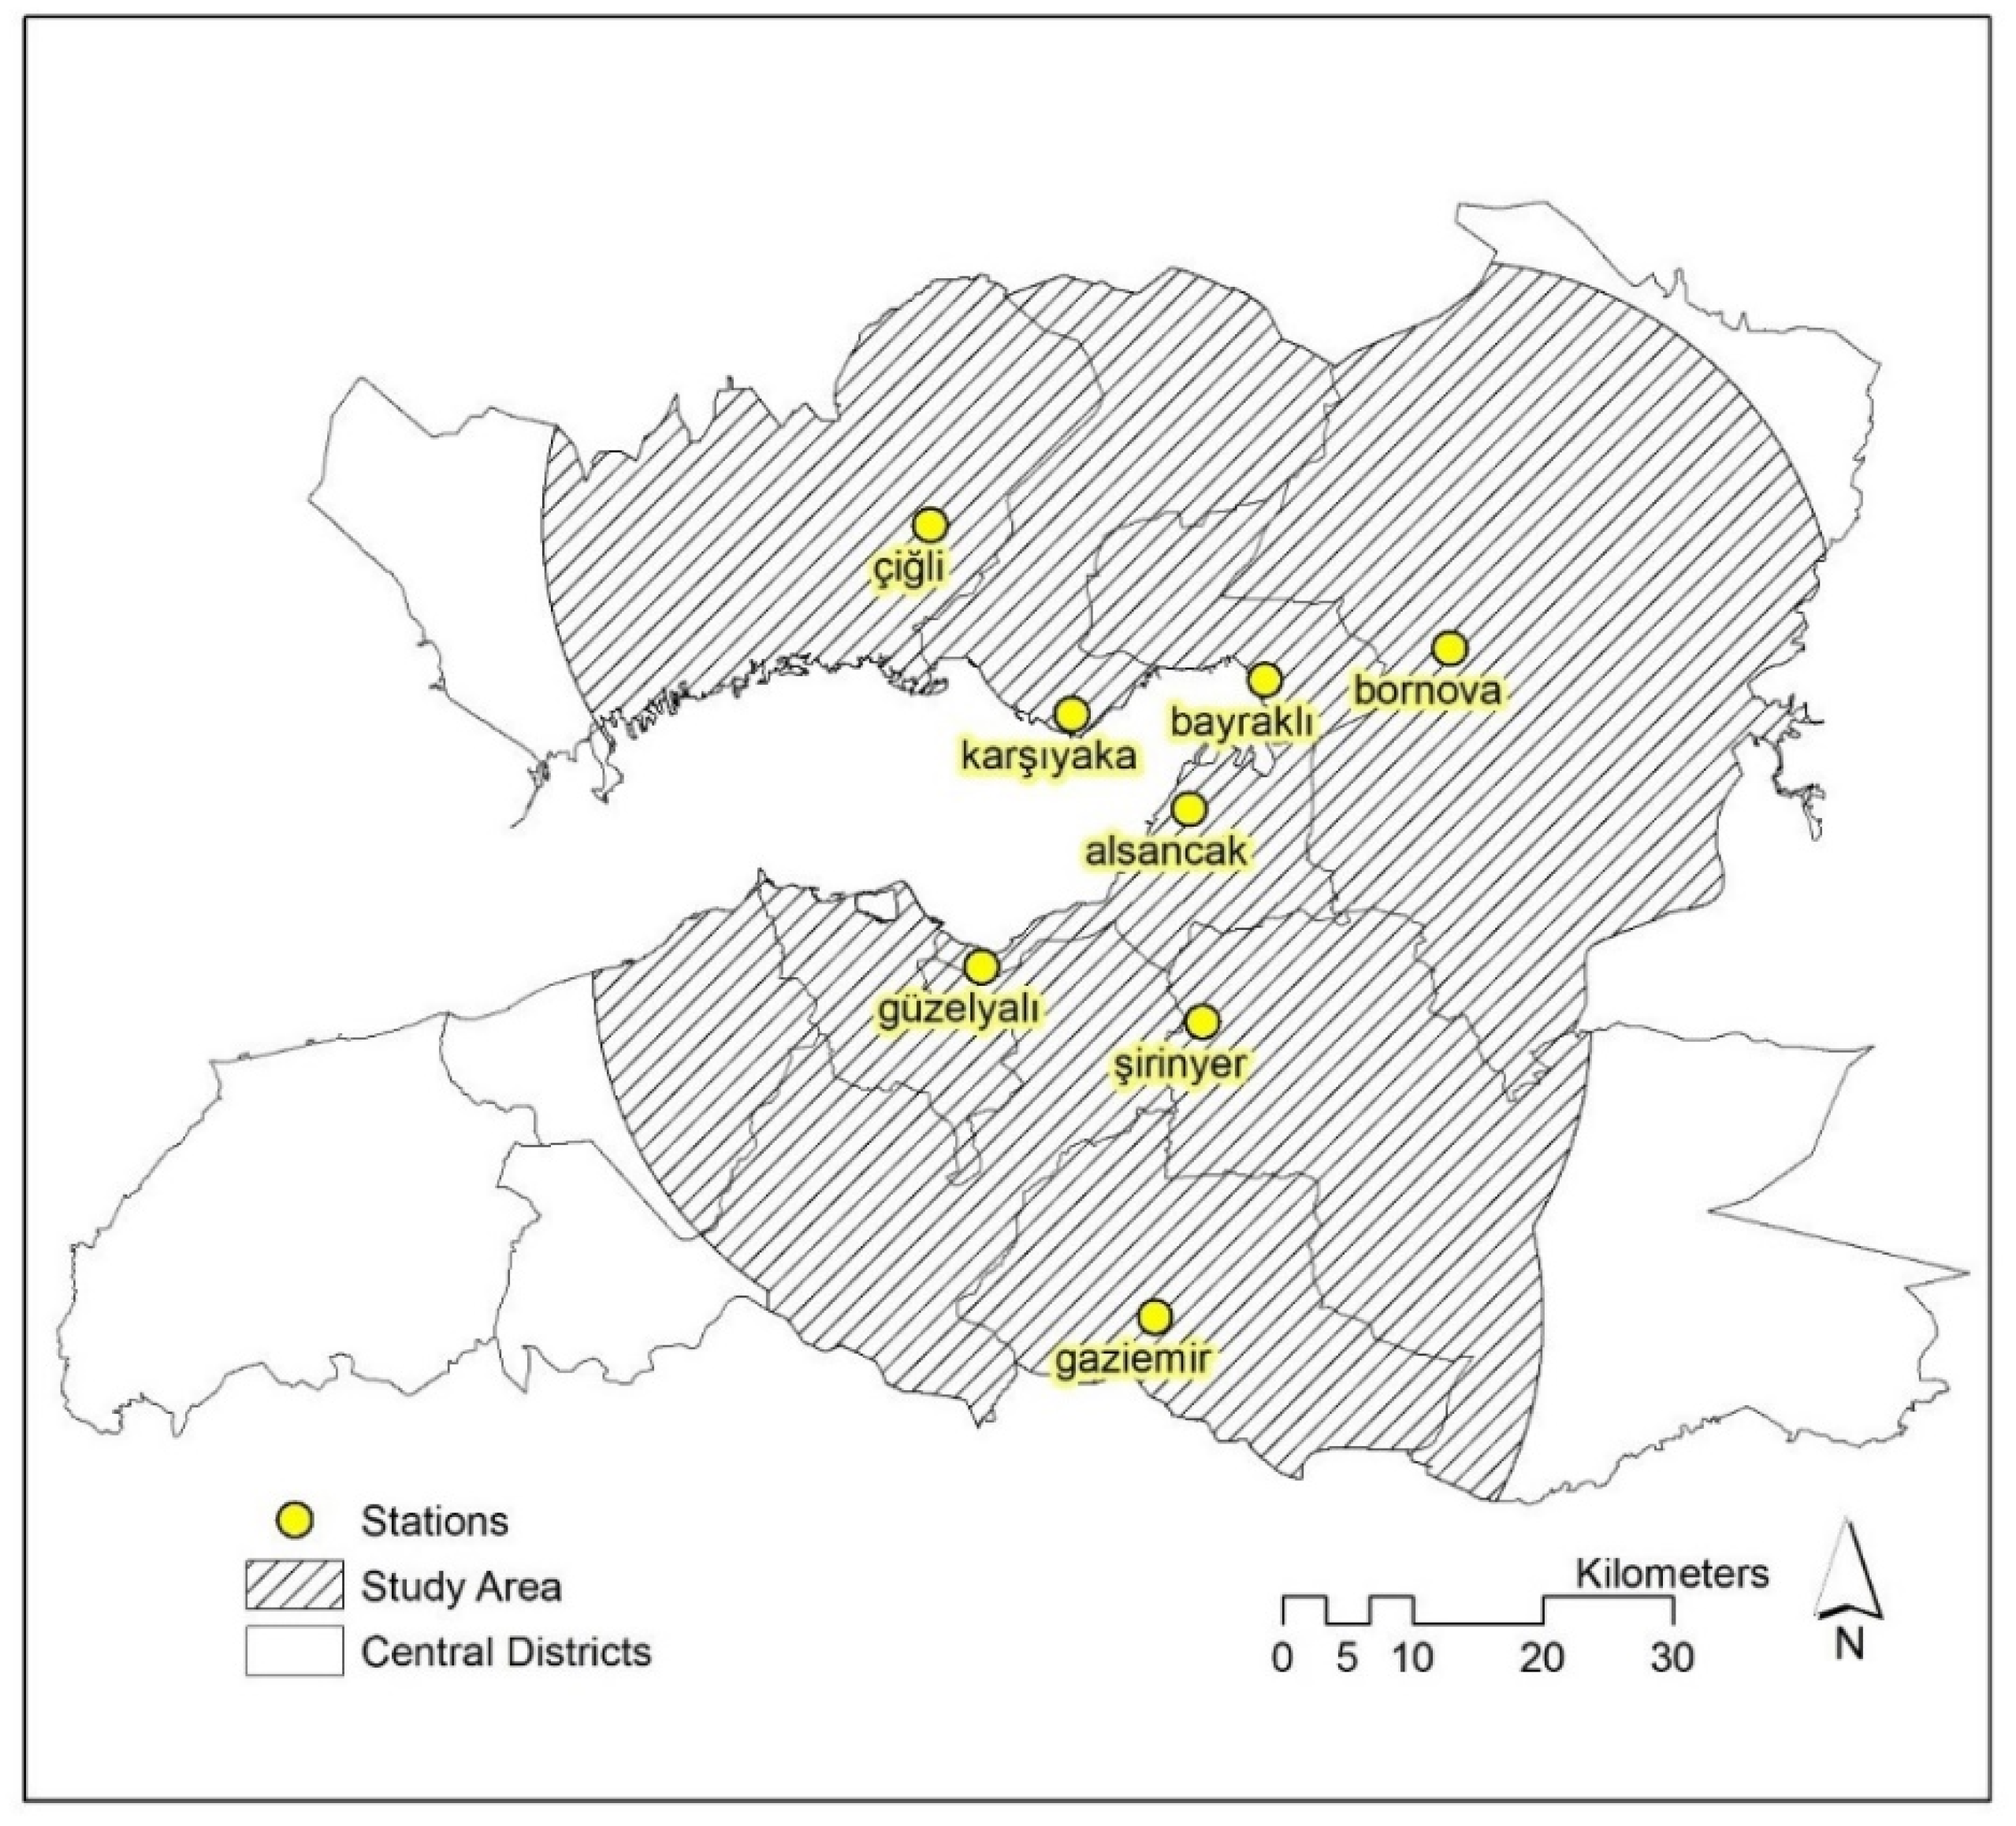
The focus is on the central districts of İzmir, constituting the urban core, due to the concentration of a limited number of observations in this part of the province. The study area is adjusted according to the average point distances of the monitoring stations to capture the immediate impact of the emissions recorded in the stations. The mean distance between stations is calculated as 10.11 km, so that a buffer of a 10.11 km radius (i.e., 20 km diameter) is created around the stations. Residential areas are located around the urban core in the central districts (Figure 2), which are better represented in this buffer zone. All generated surfaces are clipped with regard to the buffer zone, making up the study area (Figure 6) to get more precise results. The buffer zone also falls within the range values calculated for two periods in the semivariograms, so that the presence of spatial autocorrelation is guaranteed within the study area.

4.2. Interpolation of PM10 Emissions

Kriging, the optimum interpolation method to estimate the value of variables over a continuous space, was used in this study to find out the spatial distribution of air pollution in terms of PM10 emissions. Geostatistical analysis in terms of spatial interpolation was utilized to estimate unknown values where observations were not available. Kriging is one of the geostatistical analysis tools that interpolates the unknown data points with observed values through semivariograms [68]. The Kriging estimate is known as the best linear unbiased estimate (BLUE) because it is a linear combination of the weighted sample values, whose expected value for error equals zero, and whose variance is a minimum [69]. It is advantageous owing to the generation of an estimation surface along with an error surface.
The GIS kriging tool of the geostatistical analyst was utilized in the spatial interpolation of PM10 emissions in İzmir for the 2010–2011 and 2018–2019 winter seasons. Ordinary Kriging (OK), the most commonly used kriging method, was applied in the estimations. OK is utilized and cited by several researchers in air–pollution interpolations [33,34,35,37,41,42]. OK is based on the variance and distance between observation points, and assumes an unknown constant mean, µ (Equation (1)). Local variance of the data within the search ellipsoid is used for estimation, which is useful in the case of a small number of input data [70].
Z s = μ + ε s
where   Z s denotes the predicted value, μ is the trend or the mean, and ε s   is the residuals. In the OK, μ is a constant but an unknown value
Kriging requires an estimation through local weighed averaging. The optimal interpolation weights are determined by the semivariogram model that fits the data well [71,72]. A semivariogram is a measure of the variation of sample variance with distance. It is a graphical representation of the variance of data pairs with regard to distance. Samples that are close to each other show similar variance values compared to distant ones, and generally, the variance increases with the distance between samples. The experimental semivariogram is computed as follows:
γ ( h ) = 1 2 M ( h )   i = 1 M ( h ) [ ( z ( s i   ) z ( s i + h ) ) 2   ]
where γ(h) is the estimated semivariance at a separation distance, h is the lag reflecting the distance between two observations, z(si) is the value of a target variable at sampled location i, z(si+h) is the value of the neighbor at distance, and M(h) is the number of pairs of data considering the lag value. Three components—the nugget, the range, and the sill—are observed in a semivariogram. Range is the value where the model first flattens, and no spatial autocorrelation is observed beyond that value. The sill is the value on the y–axis that the semivariogram model touches at the range, where the model flattens out. If the separation distance is 0, the semivariogram value is also 0. However, in case of measurement errors or variations at distances smaller than the sampling interval, the model cuts the y–axis at a point called the nugget. The semivariogram model is used to fit the empirical data predicted at unsampled locations, and there are alternative models as well, such as the circular, exponential, Gaussian, and spherical. The best–fitting model is selected based on the prediction error values of the model output, where the mean (ME) and the standardized mean (SME) values are expected to be close to 0, the root–mean–squared (RMSE) and average standard error (ASE) values are expected to be as small as possible, and the root–mean–square–standardized (RMStdE) value is expected to be close to 1 [73,74,75,76,77].

4.3. Generating the Difference Map

The surfaces are exported to raster to provide the numeric values of PM10 in each location. The difference between the two periods is calculated with the raster calculator of Map Algebra, where the 2018–2019 values are subtracted from the 2010–2011 values, and a PM10 concentration difference surface is generated.

4.4. Overlay the Surfaces with the Distribution Lines

At the final stage, the PM10 concentrations and natural gas distribution lines are overlayed with regard to the observation periods and investment dates. The 2010–2011 period is overlayed with the lines invested before 2010, and the 2018–2019 period is overlayed with the lines invested before 2010. The selection is done with the “Select by Attributes” option with regard to the investment years. Finally, the difference surface is then overlayed with the natural gas distribution lines with regard to their investment years, as before and after 2010, in order to interpret the level of changes in emissions spatially at the local level.

5. Results and Discussion

Using the input data, PM10 concentrations are interpolated and the pollution surfaces are produced. The spherical model, the best–fitting one according to the model results, was utilized for both periods (Table 2).
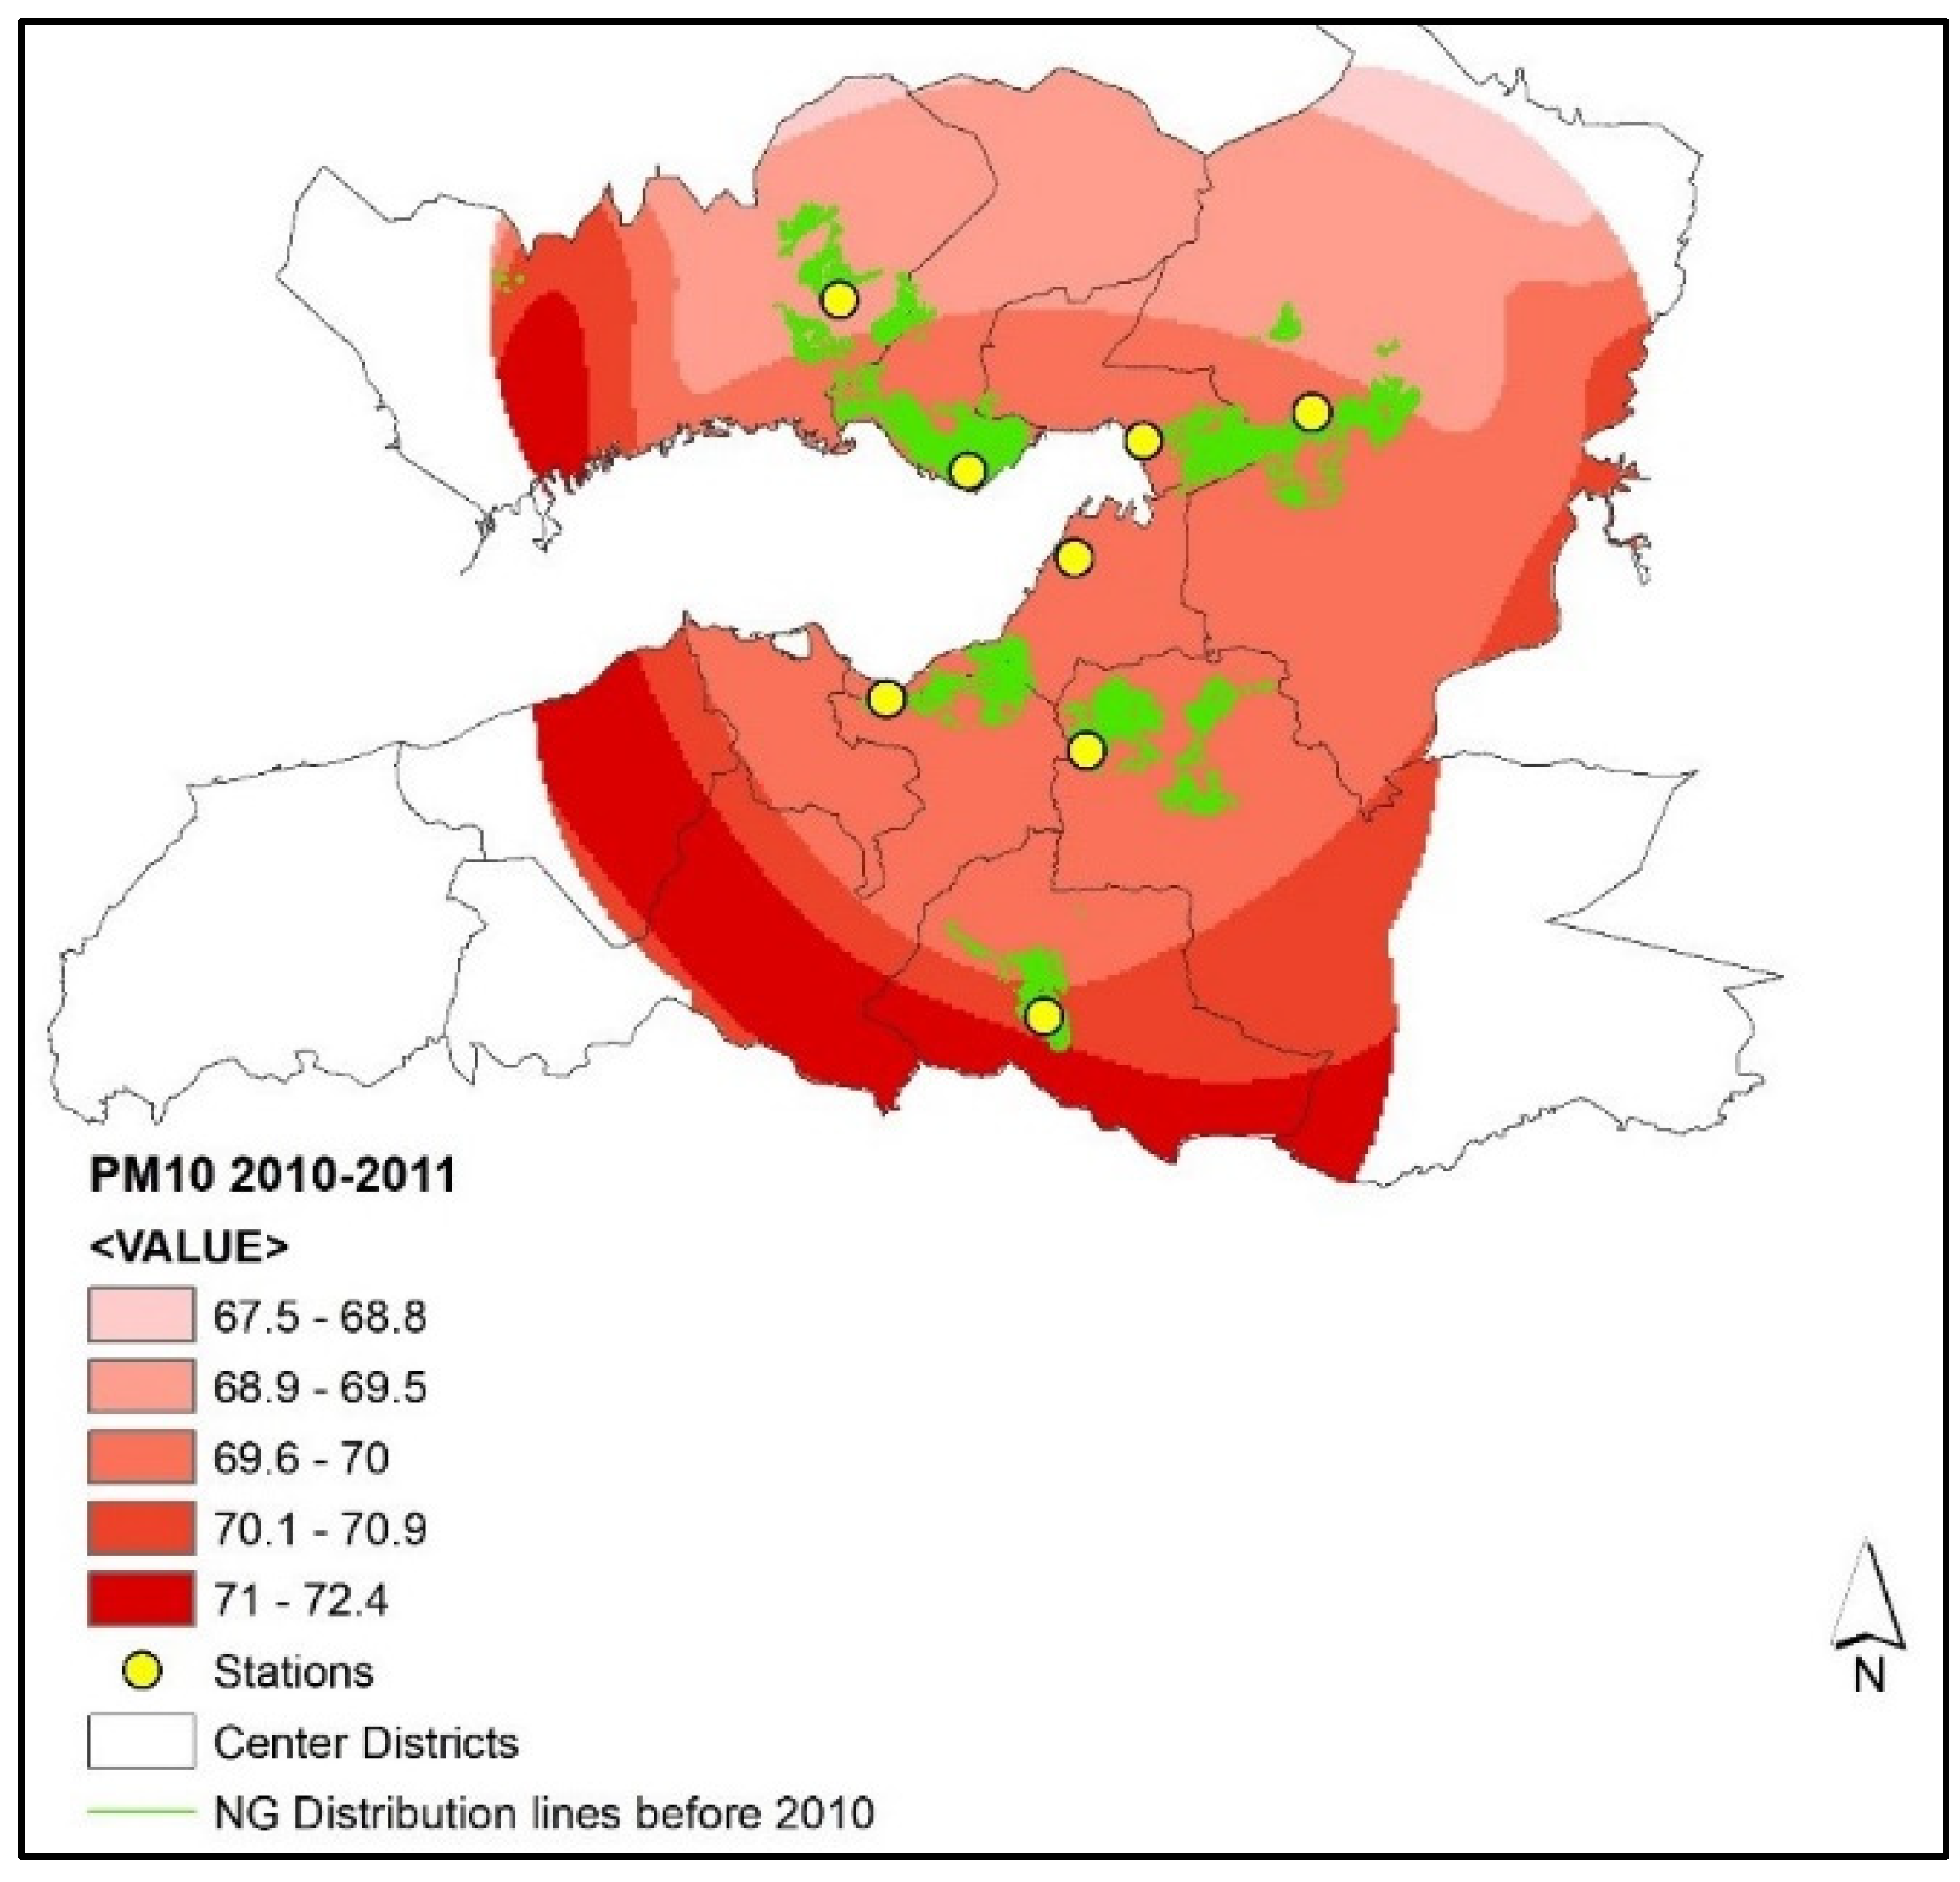
The surfaces demonstrate that PM10 concentrations differ between two periods. Pollution is observed to be higher in the close vicinity of the Gulf and the southern part of the city in the 2010–2011 winter, while the predicted PM10 values range between 67.5 µg/m3 and 72.4 µg/m3 (Figure 7). The values exceed the standards (40 µg/m3) set by the government by 68.75–81%.
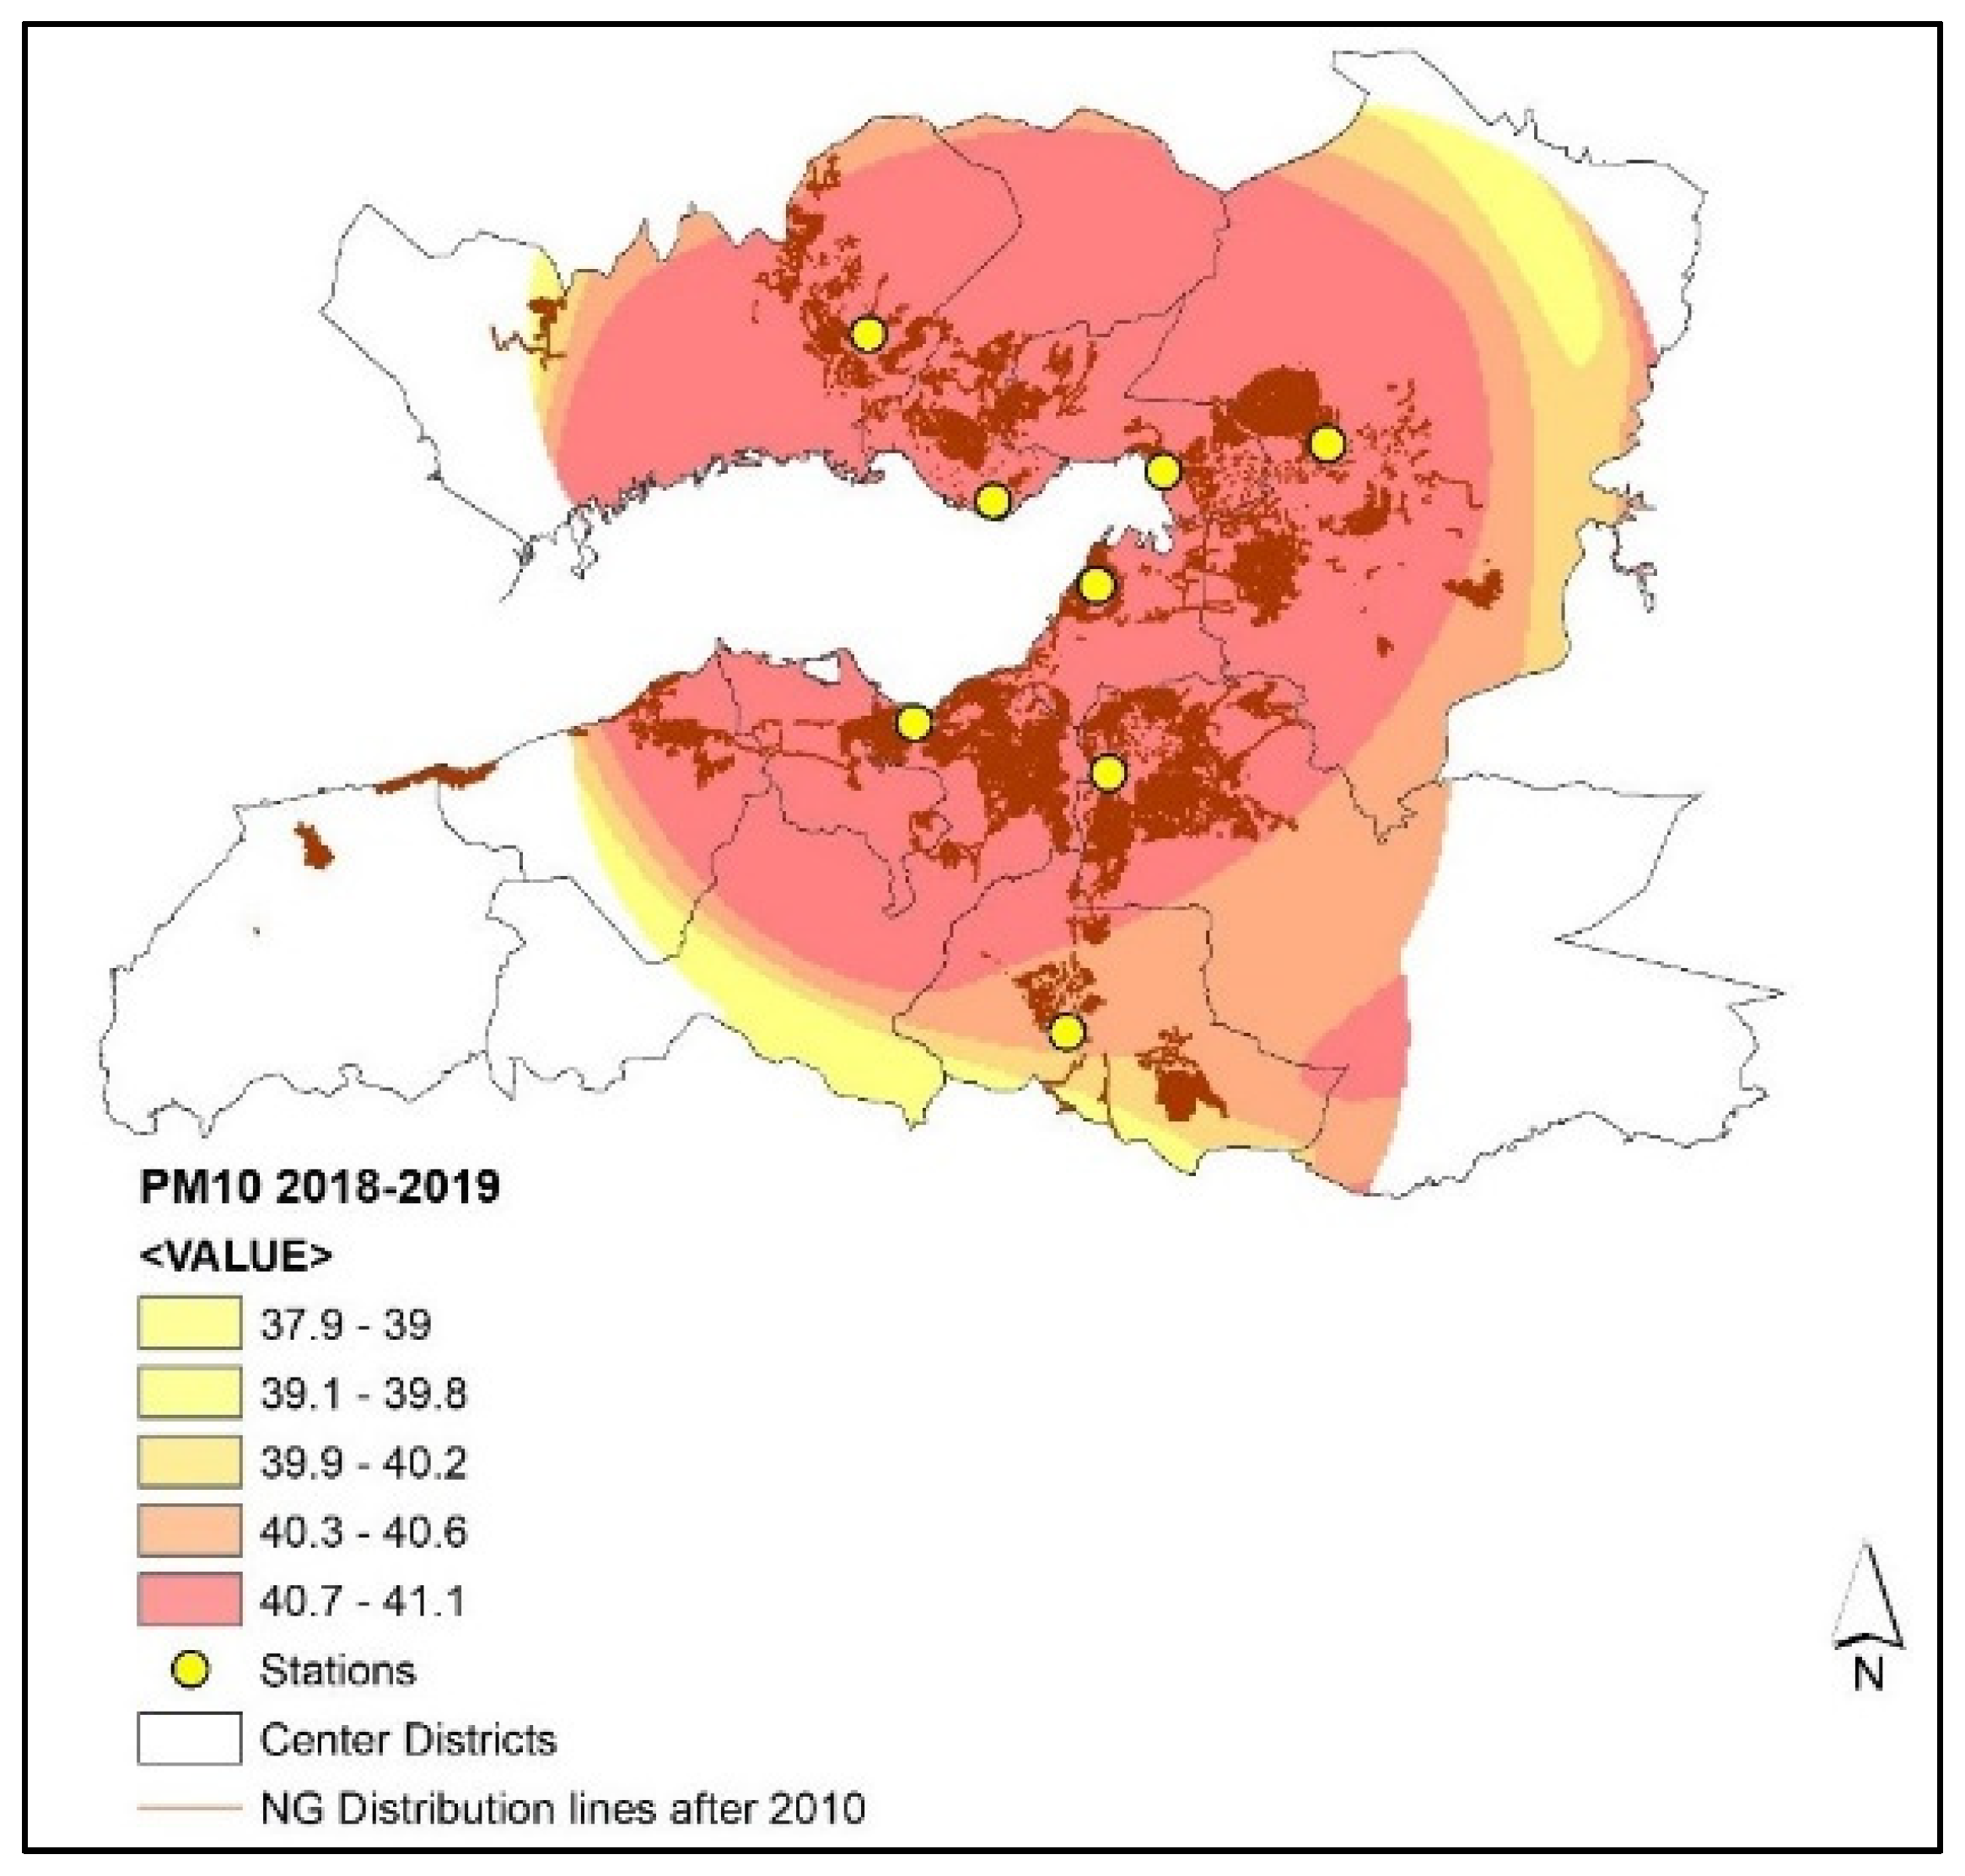
The pollution surface generated for the 2018–2019 season, on the other hand, show that the predicted PM10 concentrations either meet or slightly exceed (2.75% at most) the monthly and winter–season standards (40 µg/m3) set by the government (Figure 8).
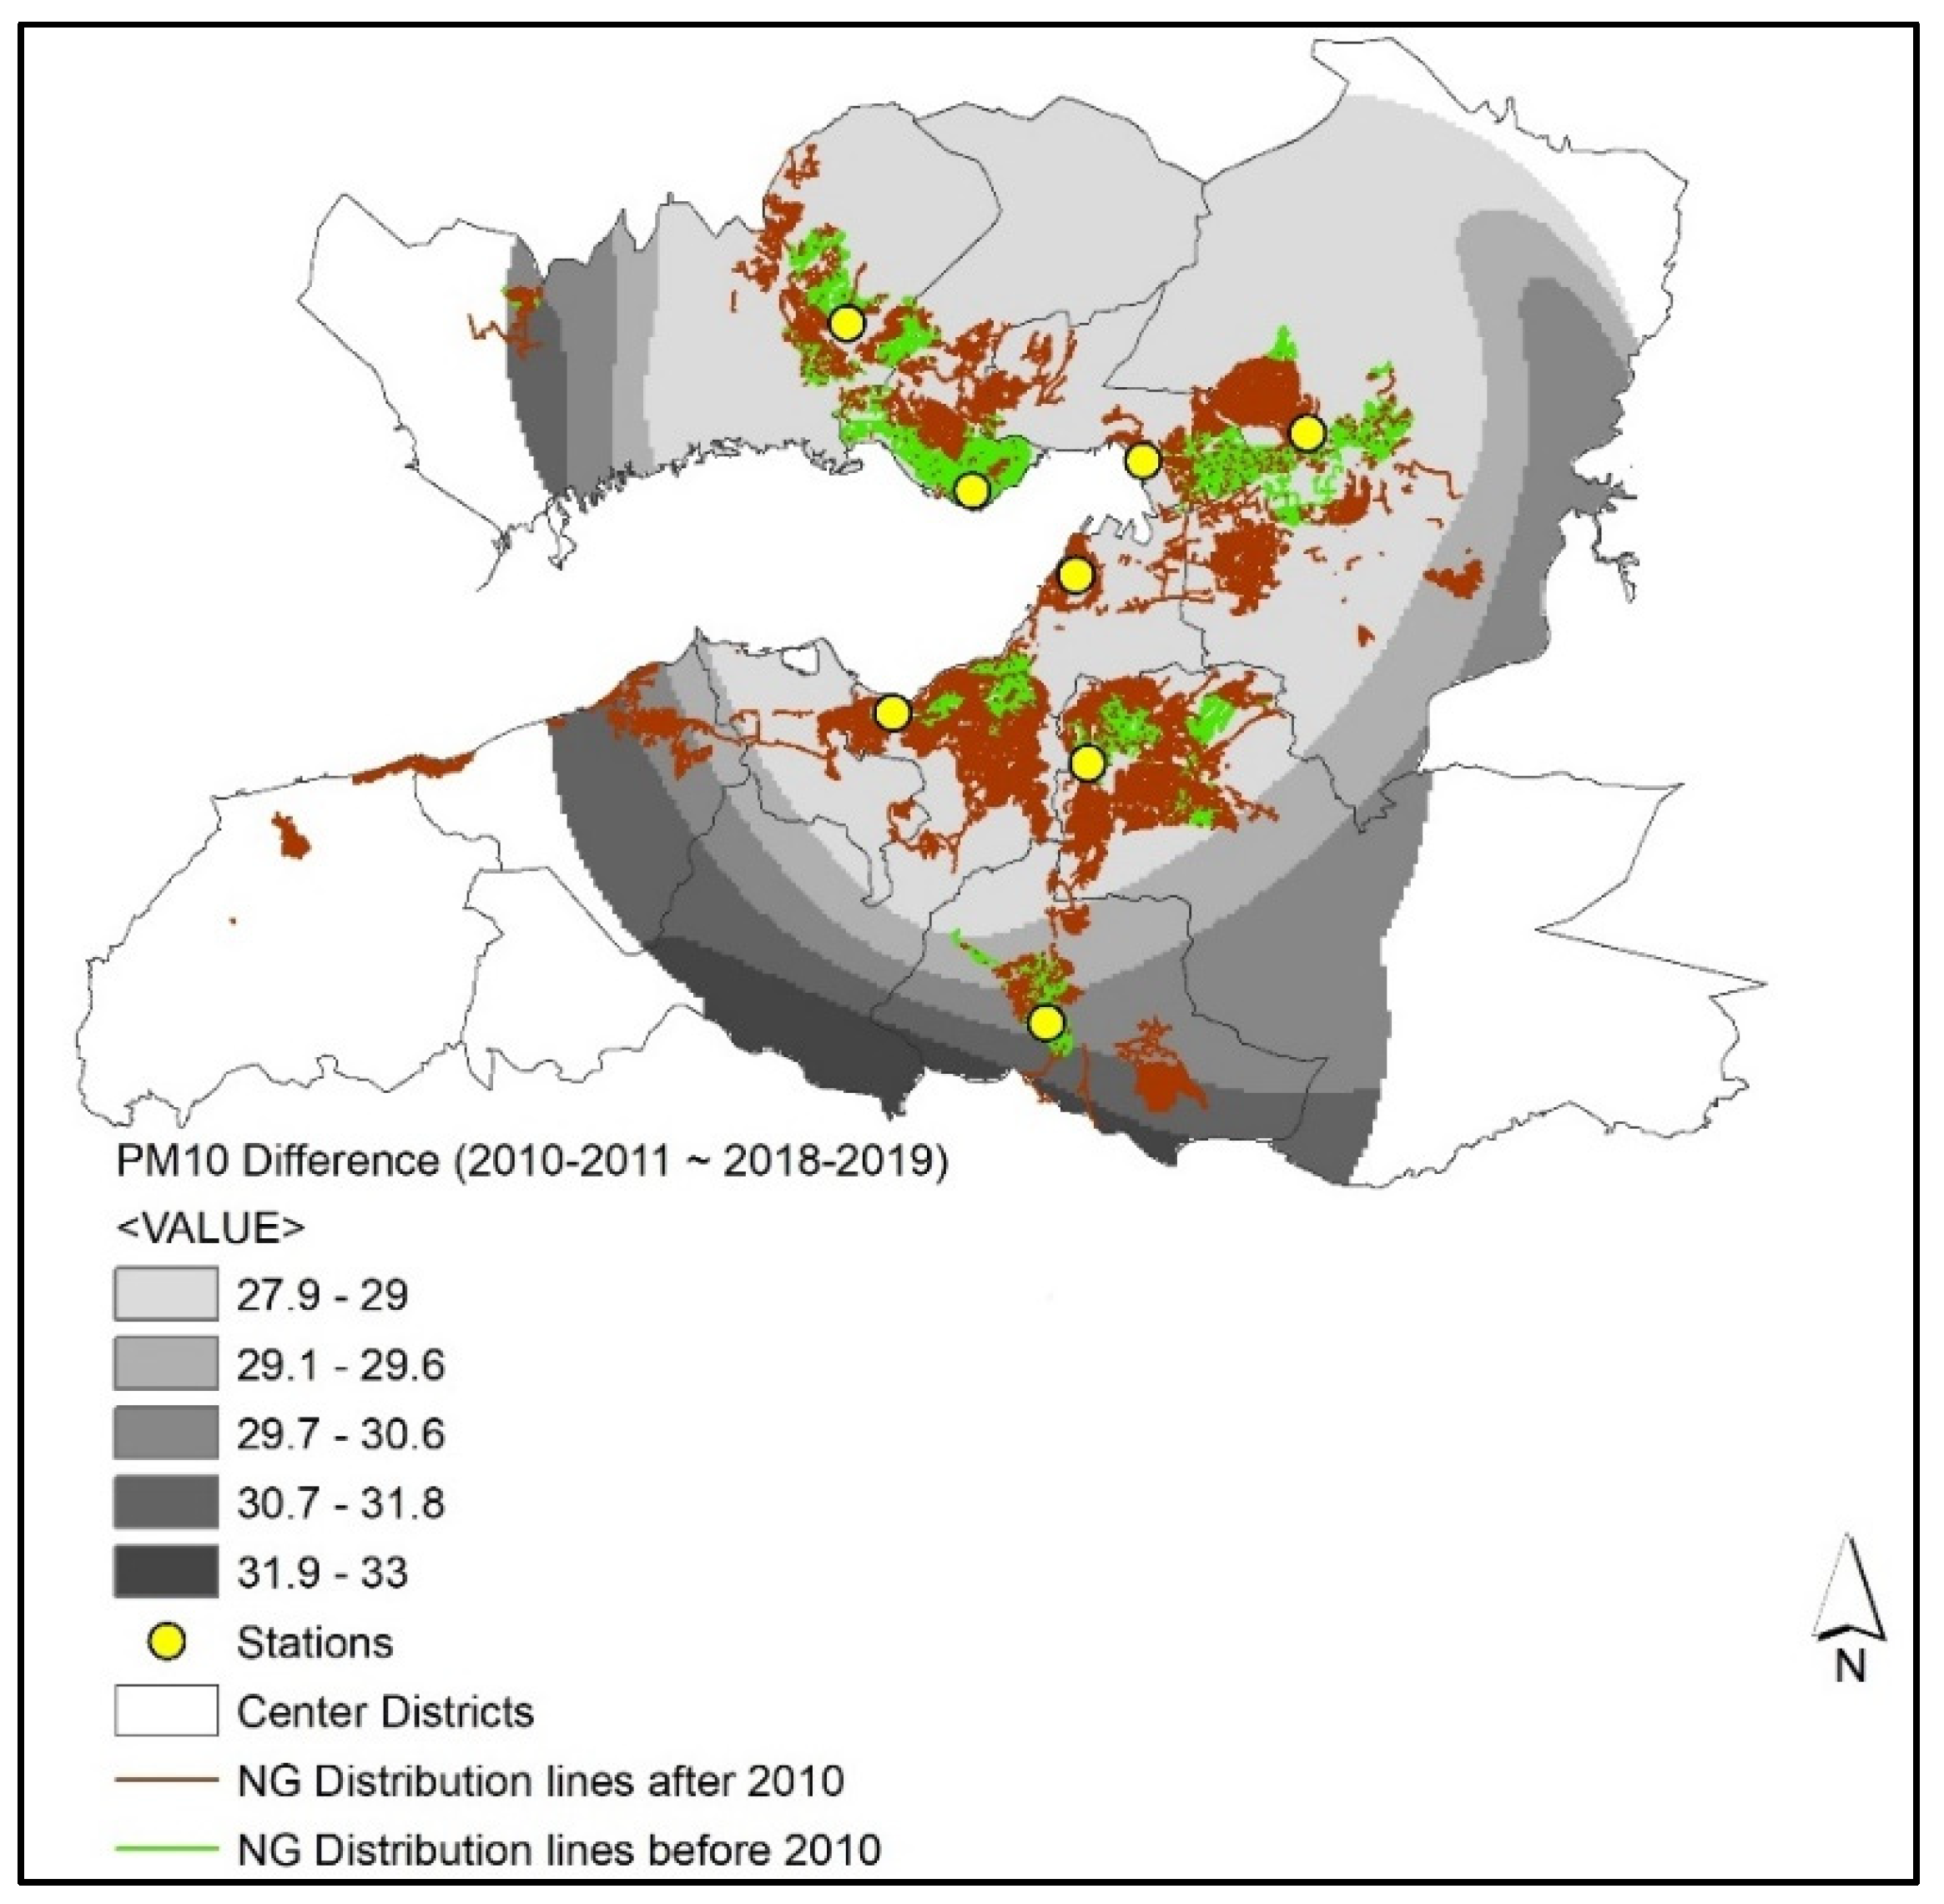
The difference map shows that the PM10 decrease between the two periods is within the range of 28µg/m3 and 33 µg/m3, while the most significant reduction is observed in the southern part of the city around Gaziemir station (Figure 9).
The overlay of the natural gas lines and the interpolated surfaces show that natural gas distribution lines targeted northern parts of the Gulf, while the investments in the Gaziemir region were relatively lower than the rest of the city until 2010. The total length of the natural gas distribution lines was 761.9 km at that time in the central districts. There were considerable amounts of natural gas distribution line expansions in the southern part of the city after 2010. More than half of the new lines (892.5 km out of 1616.4 km new lines) were added around the residential areas in Güzelyalı, Şirinyer, and Gaziemir.
The change of PM10 concentrations between two periods demonstrate that the density of the expansion of the natural gas network positively affected the decrease in air pollution. It can be expected that population dynamics may affect the spatial distribution of the changes in pollutant emissions. In that sense, the changes in the urban macroform and population are evaluated. The metropolitan core has started to show signs of urban shrinkage in İzmir [78]. Urban macroforms of 2010 and 2019 are in line with this argument since the built–up area of expansion remained almost stagnant from 2010 to 2019 (Figure 10).
Despite being below the national averages, the population increased from 2,786,836 to 2,972,900 (around 6.6%) in the 2010–2019 period in the study area, while population dynamics varied in districts (Figure 11). Although population increase is expected to result in higher pollution levels, population and PM10 were inversely related within the study period, since the former increased and the latter decreased.
While the population increased by 6.6% on average in the entire study area from 2010 to 2019, the highest growth was observed in Çiğli, Buca, and Karşıyaka with 27%, 20%, and 12%, respectively. Konak and Narlıdere, on the other hand, experienced negative population growth, so some part of the PM10 decrease may be explained by the decreasing population over time. The number of inhabitants increased in Balçova and Karabağlar, the districts located in the southwest, by 2.4% and 4.8%, respectively. In Gaziemir and Buca, the districts located in the south and the southeast, population increase was much higher (6.3% and 21%, respectively). Despite the significant population increase in the southern parts, the decline of the PM10 levels was more than the northern parts of the study area, which can be explained by the intensity of natural gas investments in the south after 2010 (Figure 9). At the southern fringe, almost no investment was observed prior to 2010. A similar case is evident for the eastern fringe and the northwestern fringe, where the Bornova and Çiğli districts are located. Although population increase was quite significant in the two districts (7.6% and 27%, respectively), PM10 decreases were observed to be higher, particularly at the fringe. There was almost no natural gas investment at the outskirts until 2010 in these two districts, so additional gas line extensions had a considerable impact on air quality within nine years. PM10 decrease is still observed in the north, where the Karşıyaka and Bayraklı districts are located, but slightly less than the southern and the eastern fringes of the study area. The urban core of the Gulf received natural gas service much earlier than the other parts of the city. Despite experiencing population increase, PM10 levels decreased in Karşıyaka and Bayraklı, but less than the rest of the city. As a matter of fact, these areas, and the urban core of the Gulf, were enjoying the air quality benefits of natural gas in the 2010–2011 winter season (Figure 7), as considerable amounts of investments had been made beforehand. Thus, the change in PM10 levels were still evident but not as high as the rest of the study area.
Another argument arises from the improvements in transportation, particularly in emission controls, which may contribute to the decrease in pollutant levels. The Exhaust Gas Emission Control Regulation was enacted in 2009, and it became mandatory to get all vehicles controlled in 2010. Thus, the study period covers the regulation period. The number of motor vehicles and accordingly, car ownerships, has been increasing gradually in Turkey, and İzmir is no exception. The most recent statistics show that passenger cars per inhabitant increased 8% from 2017 to 2020 in İzmir [79]. The increase in the number of motor vehicles is expected to result in higher PM10 emissions. On the contrary, an overall decrease in PM10 levels is observed, yet the level of decrease varies over space. Some of the air quality improvements may be due to the developments in the automotive industry, such as electric and hybrid vehicles. Nevertheless, these developments remain at very limited levels and prevalence. Therefore, it can still be argued that the most significant factor in reducing pollutant levels is switching from coal to natural gas in residential heating in the central districts of İzmir.
It is important to mention that the method used in this study is advantageous for making an assessment with the limited number of monitoring stations, and when there is no distinction among the sources of pollutants. Thus, it provides a snapshot of the change in PM10 concentrations between two periods and demonstrates the spatial variations of that change. However, it does not reflect the sector–based emissions due to the data limitations. More detailed data are required in order to get emissions from each sector, and to capture the contributions of residential heating, traffic, and industry (although industry is negligible in the urban core, since most of the facilities are located outside of the study area). A more precise analysis can also be conducted with an increased number of monitoring stations, especially with the mobile ones capturing traffic emissions.

6. Conclusions

İzmir has been experiencing air pollution problem for years and residential heating has been the number one source of the PM emissions. The reason for residentially induced pollution has been linked to the intensive use of low–quality coal for heating, particularly during the winter. Natural gas, as a cleaner and a more efficient alternative to other fossil fuels, was first provided in 2006 in residential areas, and the system has been expanded to serve a wider area since then. As the households switched to natural gas in domestic heating, air pollution decreased gradually in the city over time. Emission standards, which had been violated in the 2010–2011 winter season, were met in the 2018–2019 winter season in the entire study area. The results are in accordance with the literature, which suggests that replacing coal with natural gas improves the air quality, as in the cases of developed countries since the 1990s and, more recently, in Central and Eastern Europe, as well as in China.
Spatial interpolations of the PM10 concentrations in the winter seasons show that there has been an overall reduction in emission concentrations throughout the study area from 28 µg/m3 to 33 µg/m3 in eight years, corresponding to around a 56% decrease from 2010 to 2019. PM10 levels decreased in the entire study area despite the population increase and the increase in car ownership. The highest levels of decrease have been observed in the southern part of the city and the outskirts of the northwest and the east since the investments were quite intensive in those areas throughout the study period. It can be concluded that the provision of natural gas, although being a fossil fuel, has contributed to the alleviation of the air pollution problem in İzmir. Spatiotemporal analysis demonstrates the improvement in air quality through the emission variations both in different periods, and in different parts of the city. In case of improvements in the areas via urban transformation or urban renewal, further expansion of the system to all of the housing units would become possible, which likely reduce air pollution much more.
It should be noted that the study primarily focuses on the impact of the use of natural gas in residential heating on air quality. However, achieving sustainability in urban energy requires a broader discussion considering the economic and social aspects, as well as the supply characteristics of natural gas. Natural gas is an imported resource in Turkey, while local and renewable alternatives should be included in the discussion. Further research can focus on renewable alternatives and how to integrate them into the urban energy network. Switching to renewables can further improve air quality, and also contribute to the local and national economy. İzmir has significant potential for solar and wind powers, as well as geothermal, and there are considerable renewable investments, particularly in the rural parts of the province. Such efforts can also be sought in the dense urban core in order to take advantage of the socioeconomic and environmental benefits of renewable resources.

Author Contributions

Conceptualization, M.A.S.K. and B.N.Z.; methodology, M.A.S.K.; software, M.A.S.K.; validation, M.A.S.K. and B.N.Z.; formal analysis, M.A.S.K.; investigation, M.A.S.K.; resources, M.A.S.K.; data curation, B.N.Z.; writing—original draft preparation, M.A.S.K.; writing—review and editing, M.A.S.K.; visualization, M.A.S.K.; supervision, M.A.S.K.; project administration, M.A.S.K.; funding acquisition, M.A.S.K. All authors have read and agreed to the published version of the manuscript.

Funding

This work was supported by the Scientific and Technological Research Council of Turkey (TUBITAK) [grant number 117K824].

Institutional Review Board Statement

Not applicable.

Informed Consent Statement

Not applicable.

Data Availability Statement

Data is available on request due to privacy/ethical restrictions. The data that support the findings of this study are available on request from the corresponding author, M. A. Senyel Kurkcuoglu.

Conflicts of Interest

The authors declare no conflict of interest.

References

  1. Spiekermann, K.; Wegener, M. Modelling urban sustainability. Int. J. Urban Sci. 2011, 7, 47–64. [Google Scholar] [CrossRef]
  2. Burnett, R.T.; Pope, C.A.; Ezzati, M.; Olives, C.; Lim, S.S.; Mehta, S.; Cohen, A. An Integrated Risk Function for Estimating the Global Burden of Disease Attributable to Ambient Fine Particulate Matter Exposure. Environ. Health Perspect. 2014, 122, 397–403. [Google Scholar] [CrossRef] [PubMed]
  3. Nam, K.-M.; Li, M.; Wang, Y.; Wong, K.K.H. Spatio-temporal boundary effects on pollution-health costs estimation: The case of PM2.5 pollution in Hong Kong. Int. J. Urban Sci. 2018, 23, 498–518. [Google Scholar] [CrossRef]
  4. Kumar, A.; Pandey, A.C. Spatio-temporal assessment of urban environmental conditions in Ranchi Township, India using remote sensing and Geographical Information System techniques. Int. J. Urban Sci. 2013, 17, 117–141. [Google Scholar] [CrossRef]
  5. Boubel, R.W.; Fox, D.L.; Turner, D.B.; Stern, A.C. Fundamentals of Air Pollution, 3rd ed.; Academic Press: London, UK, 1994. [Google Scholar]
  6. EIA. Natural Gas Explained. From U.S. Energy Information Administration. 24 September 2020. Available online: https://www.eia.gov/energyexplained/natural-gas/natural-gas-and-the-environment.php (accessed on 21 January 2021).
  7. Fulton, M.; Mellquist, N.; Kitasei, S.; Bluestein, J.; Comparing Life-Cycle Greenhouse Gas Emissions from Natural Gas and Coal. Worldwatch Institute. 25 August 2011. Available online: https://www.westerngrid.net/wp-content/uploads/2012/08/Natural_Gas_LCA_Update_082511.pdf (accessed on 29 January 2021).
  8. Environmental Impacts of Natural Gas. From Union of Concerned Scientists. 19 June 2014. Available online: https://www.ucsusa.org/resources/environmental-impacts-natural-gas#:~:text=Air%20pollution-,Air%20pollution,diesel%20used%20for%20motor%20vehicles (accessed on 21 January 2021).
  9. Zhao, C.; Pan, J.; Zhang, L. Spatio-temporal patterns of global population exposure risk of PM2.5 from 2000–2016. Sustainability 2021, 13, 7427. [Google Scholar] [CrossRef]
  10. Bodor, M. A study on indoor particulate matter variation in time based on count and sizes and in relation to meteorological conditions. Sustainability 2021, 13, 8263. [Google Scholar] [CrossRef]
  11. Kerimray, A.; Rojas-Solorzano, L.; Torkmahalleh, M.A.; Hopke, P.K.; Gassachoir, B.P. Coal use for residential heating: Patterns, health implications and lessons learned. Energy Sustain. Dev. 2017, 40, 19–30. [Google Scholar] [CrossRef]
  12. Branis, M.; Domasova, M. PM10 and black smoke in a small settlement: Case study. Athmospheric Environ. 2003, 37, 83–92. [Google Scholar] [CrossRef]
  13. Bristow, M. World Oil. From Coal Being Replaced by Natural Gas to Generate Electricity. 8 September 2019. Available online: https://www.worldoil.com/news/2019/8/9/coal-being-replaced-by-natural-gas-to-generate-electricity (accessed on 8 September 2019).
  14. Chen, S.; Chi, H. Analysis of the environmental effects of clean heating policy in Northern China. Sustainability 2021, 13, 6695. [Google Scholar] [CrossRef]
  15. Mao, X.; Guo, X.; Chang, Y.; Peng, Y. Improving air quality in large cities by substituting natural gas forcoal in China: Changing idea and incentive policy implications. Energy Policy 2005, 33, 307–318. [Google Scholar] [CrossRef]
  16. Wu, S.; Zheng, X.; Khanna, N.; Feng, W. Fighting coal—Effectiveness of coal-replacement programs for residential heating in China: Empirical findings from a household survey. Energy Sustain. Dev. 2020, 55, 170–180. [Google Scholar] [CrossRef]
  17. Zhao, N.; Zhang, Y.; Li, B.; Hao, J.; Chen, D.; Zhou, Y.; Dong, R. Natural gas and electricity: Two perspective technologies of substituting coal-burning stoves for rural heating and cooking in Hebei Province of China. Energy Sci. Eng. 2018, 7, 131–210. [Google Scholar] [CrossRef]
  18. Bulut, U.; Muratoglu, G. Renewable energy in Turkey: Great potential, low but increasing utilization, and an empirical analysis on renewable energy-growth nexus. Energy Policy 2018, 123, 240–250. [Google Scholar] [CrossRef]
  19. Colak, M.; Kaya, İ. Prioritization of renewable energy alternatives by using an integrated fuzzy MCDM model: A real case application from Turkey. Energy Rev. 2017, 80, 840–853. [Google Scholar] [CrossRef]
  20. Kaygusuz, K.; Guney, M.S.; Kaygusuz, O. Renewable energy for rural development in Turkey. J. Eng. Res. Appl. Sci. 2019, 8, 1109–1118. [Google Scholar]
  21. Brozyna, J. Energy consumption and greenhouse gas emissions against the background of Polish economic growth. In Energy Transformation towards Sustainability; Tvaronaviciene, M., Slusarcyzk, S., Eds.; Elsevier: Amsterdam, The Netherlands, 2020; Volume 70, pp. 51–70. [Google Scholar] [CrossRef]
  22. Brozyna, J.; Strielkowski, W.; Fomina, A.; Nikitina, N. Renewable energy and EU 2020 target for energy efficiency in the Czech Republic and Slovakia. Energies 2020, 13, 956. [Google Scholar] [CrossRef] [Green Version]
  23. Bilan, Y.; Streimikiene, D.; Vasliyeva, T.; Lyulyov, O.; Pimonenko, T.; Pavlyk, A. Linking between renewable energy, CO2 emissions, and economic growth: Challenges for candidates and potential candidates for the EU membership. Sustainability 2019, 11, 1528. [Google Scholar] [CrossRef] [Green Version]
  24. Cichowicz, R.; Dobrzanski, M. Modeling pollutant emissions: Influence of two heat and power plants on urban air quality. Energies 2021, 14, 5218. [Google Scholar] [CrossRef]
  25. Stirelkowski, W.; Volkova, E.; Pushkareva, L.; Streimikiene, D. Innovative policies for energy efficiency and the use of renewables in households. Energies 2019, 12, 1392. [Google Scholar] [CrossRef] [Green Version]
  26. Genc, D.D.; Yesilyurt, C.; Tuncel, G. Air pollution forecasting in Ankara, Turkey using air pollution index and its relation to assimilative capacity of the atmosphere. Environ. Monit. Assess. 2010, 166, 11–27. [Google Scholar] [CrossRef]
  27. Gazbir. Natural Gas Distribution Sector Annual Report (Turkish). 2019. Available online: https://www.gazbir.org.tr/2019-dogalgaz-sektor-raporu/files/downloads/2019_YILI_DOGAL_GAZ_DAGITIM_SEKTOOR_RAPORU.pdf (accessed on 22 March 2020).
  28. Turalıoğlu, F.S. An assessment on variation of sulphur dioxide and particulate matter in Erzurum (Turkey). Environ. Monit. Assess. 2005, 104, 119–130. [Google Scholar] [CrossRef] [PubMed]
  29. Akay, M.E.; Yıldız, O. Assessing winter-type PM10 pollution in the city of Kırıkkale, Turkey: A case study. Fresnius Environ. Bull. 2007, 16, 57–62. [Google Scholar]
  30. Tayanç, Y.; Berçin, F. SO2 modeling in İzmit Gulf, Turkey during the winter 1997:3 cases. Environ. Monit. Assess. 2007, 12, 119–129. [Google Scholar] [CrossRef]
  31. Özden, Ö.; Döğeroğlu, T.; Kara, S. Assessment of ambient air quality in Eskişehir, Turkey. Environ. Int. 2008, 34, 678–687. [Google Scholar] [CrossRef]
  32. Buzelli, M.; Jerrett, M.; Burnett, R.; Finklestein, N. Spatiotemporal Perspectives on Air Pollution and Environmental Justice in Hamilton, Canada, 1985–1996. Ann. Assoc. Am. Geogr. 2003, 93, 557–573. [Google Scholar] [CrossRef]
  33. Bayraktar, H.; Turalioğlu, F.S. A Kriging-based approach for locating a sampling site—In the assessment of air quality. Stoch. Environ. Res. Risk Assess. 2005, 19, 301–305. [Google Scholar] [CrossRef]
  34. Shad, R.; Mesgari, M.S.; Akbar, A.; Shad, A. Predicting air pollution using fuzzy genetic linear membership kriging in GIS. Comput. Environ. Urban Syst. 2009, 33, 472–481. [Google Scholar] [CrossRef]
  35. Son, J.Y.; Bell, M.L.; Lee, J.T. Individual exposuure to air polluiton and lung function in Korea: Spatial analysis using multiple exposure approaches. Environ. Res. 2010, 110, 739–749. [Google Scholar] [CrossRef]
  36. Vicedo-Cabrera, A.M.; Biggeri, A.; Grisotto, L.; Barbone, F.; Catelan, D. A Bayesian kriging model for estimating residential exposureto air pollution of children living in a high-risk area in Italy. Geospat. Health 2013, 8, 87–95. [Google Scholar] [CrossRef] [Green Version]
  37. Kim, S.-Y.; Yi, S.-J.; Eum, Y.S.; Choi, H.-J.; Shin, H.; Ryou, H.G.; Kim, H. Ordinary kriging approach to predicting long-term particulate matter concentrations in seven major Korean cities. Environ. Health Toxicol. 2014, 29, 1–8. [Google Scholar] [CrossRef]
  38. Wang, W.; Ying, Y.; Quanyuan, W.; Zhang, H.; Ma, D.; Xiao, W. A GIS-based spatial correlation analysis for ambient air pollution and AECOPD hospitalizations in Jinan, China. Respir. Med. 2015, 109, 372–378. [Google Scholar] [CrossRef] [PubMed] [Green Version]
  39. Montero, J.-M.; Fernandez-Aviles, G. Functional kriging prediction of atmospheric particulate matter concentrations in Madrid, Spain: Is the new monitoring system masking potential public health problems? J. Clean. Prod. 2018, 175, 283–293. [Google Scholar] [CrossRef]
  40. Wu, C.-D.; Zeng, Y.-T.; Lung, S.-C.C. A hybrid kriging/land-use regression model to assess PM2.5 spatial-temporal variability. Sci. Total. Environ. 2018, 645, 1456–1464. [Google Scholar] [CrossRef] [PubMed]
  41. Nunez-Alonso, D.; Perez-Arribas, L.V.; Manzoor, S.; Caceres, J.O. Statistical Tools for Air Pollution Assessment: Multivariate and Spatial Analysis Studies in the Madrid Region. J. Anal. Methods Chem. 2019, 2019, 9753927. [Google Scholar] [CrossRef]
  42. Huang, S.; Xiang, H.; Yang, W.; Zhu, Z.; Tian, L.; Deng, S.; Liu, S. Short-Term Effect of Air Pollution on Tuberculosis Based on Kriged Data: A Time-Series Analysis. Int. J. Environ. Res. Public Health 2020, 17, 1522. [Google Scholar] [CrossRef] [PubMed] [Green Version]
  43. Kumar, A.; Mishra, R.K.; Sarma, K. Mapping spatial distribution of traffic induced criteria pollutants and associated health risks using kriging interpolation tool in Delhi. J. Transp. Health 2020, 18, 100879. [Google Scholar] [CrossRef]
  44. Shukla, K.; Kumar, P.; Mann, G.S.; Khare, M. Mapping spatial distribution of particulate matter using Kriging and Inverse Distance Weighting at supersites of megacity Delhi. Sustain. Cities Soc. 2020, 54, 101997. [Google Scholar] [CrossRef]
  45. Von Steiger, B.; Webster, R.; Schulin, R.; Lehmann, R. Mapping heavy metals in polluted soil by disjunctive kriging. Environ. Pollut. 1996, 94, 205–215. [Google Scholar] [CrossRef]
  46. Benmostefa Largueche, F.-Z. Estimating Soil Contamination with Kriging Interpolation Method. Am. J. Appl. Sci. 2006, 3, 1894–1898. [Google Scholar]
  47. Tavares, M.T.; Sousa, A.J.; Abreu, M.M. Ordinary kriging and indicator kriging in the cartography of trace elements contamination in São Domingos mining site (Alentejo, Portugal). J. Geochem. Explor. 2008, 98, 43–56. [Google Scholar] [CrossRef]
  48. Güney, M.; Onay, T.; Copty, N. Impact of overland traffic on heavy metal levels in highway dust and soils of Istanbul, Turkey. Environ. Monit. Assess. 2010, 164, 101–110. [Google Scholar] [CrossRef]
  49. Antunes, I.; Albuquerque, M. Using indicator kriging for the evaluation of arsenic potential contamination in an abandoned mining area (Portugal). Sci. Total. Environ. 2013, 442, 545–552. [Google Scholar] [CrossRef]
  50. Ha, H.; Olson, J.R.; Bian, L.; Rogerson, P.A. Analysis of Heavy Metal Sources in Soil Using Kriging Interpolation on Principal Components. Environ. Sci. Technol. 2014, 48, 4999–5007. [Google Scholar] [CrossRef]
  51. Chakraborty, S.; Man, T.; Paulette, L.; Deb, S.; Li, B.; Weindorf, D.C.; Fraizer, M. Rapid assessment of smelter/mining soil contamination via portable X-ray fluorescence spectrometry and indicator kriging. Geoderma 2017, 306, 108–119. [Google Scholar] [CrossRef]
  52. Qiao, P.; Lei, M.; Yang, S.; Yang, J.; Guo, G.; Zhou, X. Comparing ordinary kriging and inverse distance weighting for soil as pollution in Beijing. Environ. Sci. Pollut. Res. 2018, 25, 15597–15608. [Google Scholar] [CrossRef] [PubMed]
  53. Johnbull, O.; Abbassi, B.; Zytner, R.G. Risk assessment of heavy metals in soil based on the geographic information system-Kriging technique in Anka, Nigeria. Environ. Eng. Res. 2018, 24, 150–158. [Google Scholar] [CrossRef] [Green Version]
  54. Razanamahandry, L.C.; Digbeu, P.M.; Andrianisa, H.A.; Karoui, H.; Podgorski, J.; Manikandan, E.; Yacouba, H. Comparative methods for predicting cyanide pollution in artisanal small-scale gold mining catchment by using logistic regression and kriging with GIS. Afr. J. Sci. Technol. Innov. Dev. 2020, 12, 287–295. [Google Scholar] [CrossRef]
  55. Doygun, H.; Gurun, D.K. Analysis and mapping spatial and temporal dynamics of urban traffic noise pollution: A case study in Kahramanmaraş, Turkey. Environ. Monit. Assess. 2008, 142, 65–72. [Google Scholar] [CrossRef]
  56. Taghizadeh-Mehrjardi, R.; Zare, M.; Zare, S. Mapping of noise pollution by different interpolation methods in recovery section of Ghandi telecommunication Cables Company. J. Occup. Health Epidemiol. 2013, 2, 1–11. [Google Scholar] [CrossRef]
  57. Harman, B.İ.; Koseoglu, H.; Yigit, C.O. Performance evaluation of IDW, Kriging and multiquadric interpolation methods in producing noise mapping: A case study at the city of Isparta, Turkey. Appl. Acousitcs 2016, 112, 147–157. [Google Scholar] [CrossRef]
  58. Aumond, P.; Can, A.; De Coensel, B.; Ribeiro, C.; Botteldooren, D.; Lavandier, C. Kriging-based spatial interpolation from measurements for sound level mapping in urban areas. J. Acoust. Soc. Am. 2018, 143, 2847–2857. [Google Scholar] [CrossRef] [Green Version]
  59. TURKSTAT Adressed Based Population Registration System. Turkish Statistical Institute. Available online: https://data.tuik.gov.tr/Kategori/GetKategori?p=nufus-ve-demografi-109&dil=1 (accessed on 8 January 2021).
  60. Ministry of Environment and Urbanization. Environmental Problems and and Priorities Assessment Report of Turkey. Ankara, Turkey. 2019. Available online: https://webdosya.csb.gov.tr/db/ced/icerikler/2017-cevre-sorunlari-ve-oncel-kler-20190628084520.pdf (accessed on 21 December 2020).
  61. İzmir Greater Municipality. 1/25000 Scale İzmir Metropolitan Area Master Plan Report. 2012. Available online: http://izmimod.org.tr/docs/RAPOR_IBSBCDP.pdf (accessed on 21 January 2021).
  62. İzmir Greater Municipality. İzmir Greater Municipality Sustainable Energy Action Plan. İzmir, Turkey. 2016. Available online: http://www.skb.gov.tr/wp-content/uploads/2017/01/Izmir-Buyuksehir-Belediyesi-Surdurulebilir-Enerji-Eylem-Plani.pdf (accessed on 21 January 2021).
  63. Elbir, T. Comparison of model predictions with the data of an urban air quality monitoring network in Izmir, Turkey. Atmos. Environ. 2003, 37, 2149–2157. [Google Scholar] [CrossRef]
  64. Elbir, T.; Muezzinoğlu, A. Estimation of emission strengths of primary air pollutants in the city of Izmir, Turkey. Atmos. Environ. 2004, 38, 1851–1857. [Google Scholar] [CrossRef]
  65. Sari, D.; Bayram, A. Quantification of emissions from domestic heating in residential areas of İzmir, Turkey and assessment of the impact on local/regional air-quality. Sci. Total. Environ. 2014, 488, 429–436. [Google Scholar] [CrossRef] [PubMed]
  66. Regulation Regarding Residential Heating Hours. From İzmir Provincial Directorate of Environment and Urbanization. 4 October 2017. Available online: https://izmir.csb.gov.tr/kalorifer-yakma-saatleri-ile-ilgili-duzenleme-haber-220309 (accessed on 20 January 2021).
  67. Seasonal Averages of the Provinces, İzmir. From Turkish State Meteorological Service. Available online: https://www.mgm.gov.tr/veridegerlendirme/il-ve-ilceler-istatistik.aspx?m=IZMIR (accessed on 17 January 2021).
  68. Cressie, N. Spatial Prediction and Ordinary Kriging. Math. Geol. 1988, 20, 405–421. [Google Scholar] [CrossRef]
  69. Caruso, C.; Quarta, F. Interpolation Methods Comparison. Comput. Math. Appl. 1998, 35, 109–126. [Google Scholar] [CrossRef] [Green Version]
  70. Kis, I.M. Comparison of Ordinary and Universal Kriging interpolation techniques on a depth variable (a case of linear spatial trend), case study of the Šandrovac Field. Min.-Geol.-Pet. Eng. Bull. 2016, 31, 41–58. [Google Scholar] [CrossRef]
  71. Burrough, P.A. Principles of Geographical Information Systems for Land Resources Assessment; Clarendon Press: Oxford, UK, 1987. [Google Scholar]
  72. Tang, Y.-b. Comparison of semivariogram models for Kriging monthly rainfall in Eastern China. J. Zhejiang Univ. Sci. 2002, 3, 584–590. [Google Scholar]
  73. Pardo-Iguzquiza, E. Comparison of geostatistical methods for estimating the areal average climatological rainfall mean using information of precipitation and topography. Int. J. Climatol. 1998, 18, 1031–1047. [Google Scholar] [CrossRef]
  74. Robinson, T.P.; Metternicht, G. Testing the performance of spatial interpolation techniques for mapping soil properties. Comput. Electron. Agric. 2006, 50, 97–108. [Google Scholar] [CrossRef]
  75. Asa, E.; Saafi, M.; Membah, J.; Billa, A. Comparison of linear and nonlinear kriging methods for characterization and interpolation of soil data. J. Comput. Civ. Eng. 2012, 26, 11–18. [Google Scholar] [CrossRef]
  76. Shamo, B.; Asa, E.; Membah, J. Linear spatial interpolation and analysis of annual average daily traffic data. J. Comput. Civ. Eng. 2015, 29, 04014022. [Google Scholar] [CrossRef]
  77. Cross Validation. Retrieved from ESRI ArcGIS for Desktop. Available online: https://desktop.arcgis.com/en/arcmap/10.3/tools/geostatistical-analyst-toolbox/cross-validation.htm (accessed on 12 January 2020).
  78. Özatağan, G.; Eraydın, A. The role of government policies and strategies behind the shrinking urban core in an expanding city region: The Case of İzmir. Eur. Plan. Stud. 2014, 22, 1027–1047. [Google Scholar] [CrossRef] [Green Version]
  79. İzmir Governorship. Turkish Statistical Institute, İzmir Statistics. 2020. Available online: http://www.izmir.gov.tr/izmir-istatistikleri (accessed on 11 September 2021).
Figure 1. Expansion of the natural gas distribution system by years in terms of pipeline length and the number of customers.
Sustainability 13 10870 g001
Figure 2. Natural gas distribution lines and residential areas in the study area. Source for the residential areas: İzmir Metropolitan Area Master Plan [39].
Sustainability 13 10870 g002
Figure 3. Monitoring stations where PM10 data is collected.
Sustainability 13 10870 g003
Figure 4. Natural gas distribution lines in İzmir.
Sustainability 13 10870 g004
Figure 5. Analysis framework.
Sustainability 13 10870 g005
Figure 6. Boundaries of the study area.
Sustainability 13 10870 g006
Figure 7. PM10 concentrations (µg/m3) and natural gas distribution lines in the 2010–2011 winter season.
Sustainability 13 10870 g007
Figure 8. PM10 (µg/m3) concentrations and natural gas distribution lines in the 2018–2019 winter season.
Sustainability 13 10870 g008
Figure 9. Difference of PM10 (µg/m3) concentrations and natural gas distribution lines between the 2010–2011 and 2018–2019 winter seasons.
Sustainability 13 10870 g009
Figure 10. The change in the urban macroform in the study area from 2010 to 2019. Source: Google Earth Pro V 7.3.4.8248 Landsat/Copernicus.
Sustainability 13 10870 g010
Figure 11. Population changes in districts in the 2010–2019 period. Source: Turkish Statistical Institute.
Sustainability 13 10870 g011
Table 1. Average PM10 concentrations in the 2010–2011 and 2018–2019 winter seasons.
StationsLatitudeLongitudePM10 2010–2011 (µg/m3)PM10 2018–2019
(µg/m3)
Alsancak38°25′55″27°08′39″64.1728.82
Bayraklı38°27′43″27°10′00″94.6956.35
Bornova38°28′09″27°13′17″52.2939.41
Çiğli38°29′53″27°04′04″65.2844.99
Gaziemir38°18′51″27°08′02″71.9640.12
Güzelyalı38°23′44″27°04′58″68.6143.02
Karşıyaka38°27′15″27°06′34″58.1628.48
Şirinyer38°22′57″27°08′53″81.6845.23
Table 2. Method report and prediction errors of the two periods.
PeriodMethodModel Range (m)MEMStdERMSERMS
StdE
ASE
2010–2011Ordinary KrigingSpherical21,1490.0880.00614.3190.99814.366
2018–2019Ordinary KrigingSpherical20,143−0.065−0.0069.7410.9999.769
Publisher’s Note: MDPI stays neutral with regard to jurisdictional claims in published maps and institutional affiliations.