1. Introduction
In the U.S., several Department of Transportations (DOTs) implemented road diet designs, especially in urban corridors, to enhance traffic safety and encourage economic growth [
1,
2,
3,
4,
5,
6,
7,
8]. A road diet design is introduced to protect vulnerable road users from severe crashes or to give residents/visitors more parking spaces when needed. The use of a road diet means that less road width is present, which makes it easier for vulnerable road users to cross the major road at both signalized and unsignalized intersections and thus increases both pedestrian and bicyclist traffic [
9]. Other benefits include the expected reduction in travel speeds, which results in reducing crash severity, and having extra spaces that can be allocated to other use purposes, such as on-street parking, bicycle lanes, or bus stops [
4].
In this study, a new road diet application is introduced in the corridor of New Jersey Avenue, northwest (N.W.), in the City of Washington, District of Columbia (D.C.). The new application aims to convert a 4-lane two-way road to a 2-lane two-way road with two parking lanes in both directions to accommodate the high parking demands from both visitors and residents.
2. Background
A before-and-after study, which was conducted by the Iowa Department of Transportation’s office of Traffic and Safety, discussed the impact of a road diet design on crash reduction. In the study, the road diet design converted a four-lane two-way road into a three-lane road with a center two-way left-turn lane (TWLTL). In addition, the study considered adding a bicycle lane in both directions. The use of a road diet design resulted in a 25.2% reduction in crash frequency per mile and an 18.8% reduction in crash rate [
1]. Another study supported the safety benefits that resulted from applying the road diet design in Minnesota [
2]. In the study, authors also converted a four-lane two-way road into a TWLTL for the sake of improving traffic safety and operations. They collected speed and crash data for multiple years of before-and-after the road diet implementation. Results showed that the road diet design improved the traffic safety as the number of crashes was reduced by 44.2%. However, in [
10], authors implemented a “before” and “after” analysis using a “yoked comparison” study design in which they found that the percent of a road diet crashes occurring during the “after” period was about 6% lower than that of the matched comparison sites using data from twelve road diets and 25 comparison sites in California and Washington cities.
A study conducted by Noland et al. [
3] discussed the costs and benefits of using a road diet design (from four-lanes two-ways to TWLTL) in an urban arterial corridor in New Jersey, USA. The study found that the traffic travel time was increased due to capacity reduction, and thus the study recommended to modify the signal timings to overcome the travel time increment. In addition, the study demonstrated the safety benefits of using the road diet design: a crash rate reduction of 19%. Another study led by the Federal Highway Administration (FHWA) evaluated the conversion of a four-lane two-way road to TWLTL. The study illustrated other safety benefits of using the road diet, including the reduction in crossing distance for pedestrians and travel speeds that lead to mitigating crash severity. In addition, the study demonstrated that applying the road diet will result in having extra spaces that can be allocated to other use purposes such as on-street parking, bicycle lanes, or bus stops [
4]. Knapp et al. [
4] investigated the sensitivity of applying a road diet design to various factors including traffic demand levels, left-turn traffic demands, access point densities, percentage of heavy vehicles, and bus stop activities. The authors found that the road convergence can be successfully operated if the roadway environment remains stable; traffic counts will not increase drastically.
Recently, a study analyzed traffic impacts of implementing a road diet design on Lincoln Avenue in the City of San Jose, California. The study compared data on traffic speeds and volumes from before-and-after the road diet implementation. Results illustrated a reduction in both traffic speeds and volumes due to capacity reduction [
5]. Kim et al. [
6] identified the impact of implementing the road diet using various factors such as roadway characteristics to estimate crash modification factors (CMFs) for different crash types.
As it is believed that there is insufficient road space to dedicate a portion exclusively for cyclists without negatively affecting existing motorists in most of the metropolitan areas, a study done by Sohn [
11] attempted to find an efficient way to implement a road diet plan that both maximizes the utility for cyclists and minimizes the negative effect on motorists. The study utilized a network design problem (NDP), which is usually used to find the best option for providing extra road capacity, to derive the best solution for limiting road capacity. A case study was presented to guarantee a robust approximate Pareto optimal front and showed that the proposed methodology could be adopted in the design of a road diet plan in a real transportation network.
Moreover, a study was executed by Gudz et al. [
12] to show that road diets can introduce benefits for pedestrians and bicyclists. The study examined the effects of a road diet project in Davis, California. Results showed that there was a statistically significant increase in the number of bicyclists during the morning or the evening peak period or during both in all study areas. The study also showed that road diets can benefit bicyclists without negative effects on automobile travelers.
Previous studies have only focused on evaluating the use of a road diet design, converting the road from four-lane two-ways to three-lane road with a center two-way left-turn lane (TWLTL). The road diet design used in this study extends the state-of-the-practice by converting an urban corridor with a four-lane two-way road into a two-lane two-way road with full-time parking lanes in both directions. In addition, the study tests the impact of the road diet design on the side streets performance for both signalized and unsignalized intersections. The study also compares existing scenarios (AM and PM peak), proposed road diet scenarios, and proposed road diet scenarios including re-optimizing existing signal timings as well as improving lane configurations. The study uses a case study of New Jersey Avenue, N.W. in Washington, D.C.
3. Network Configuration
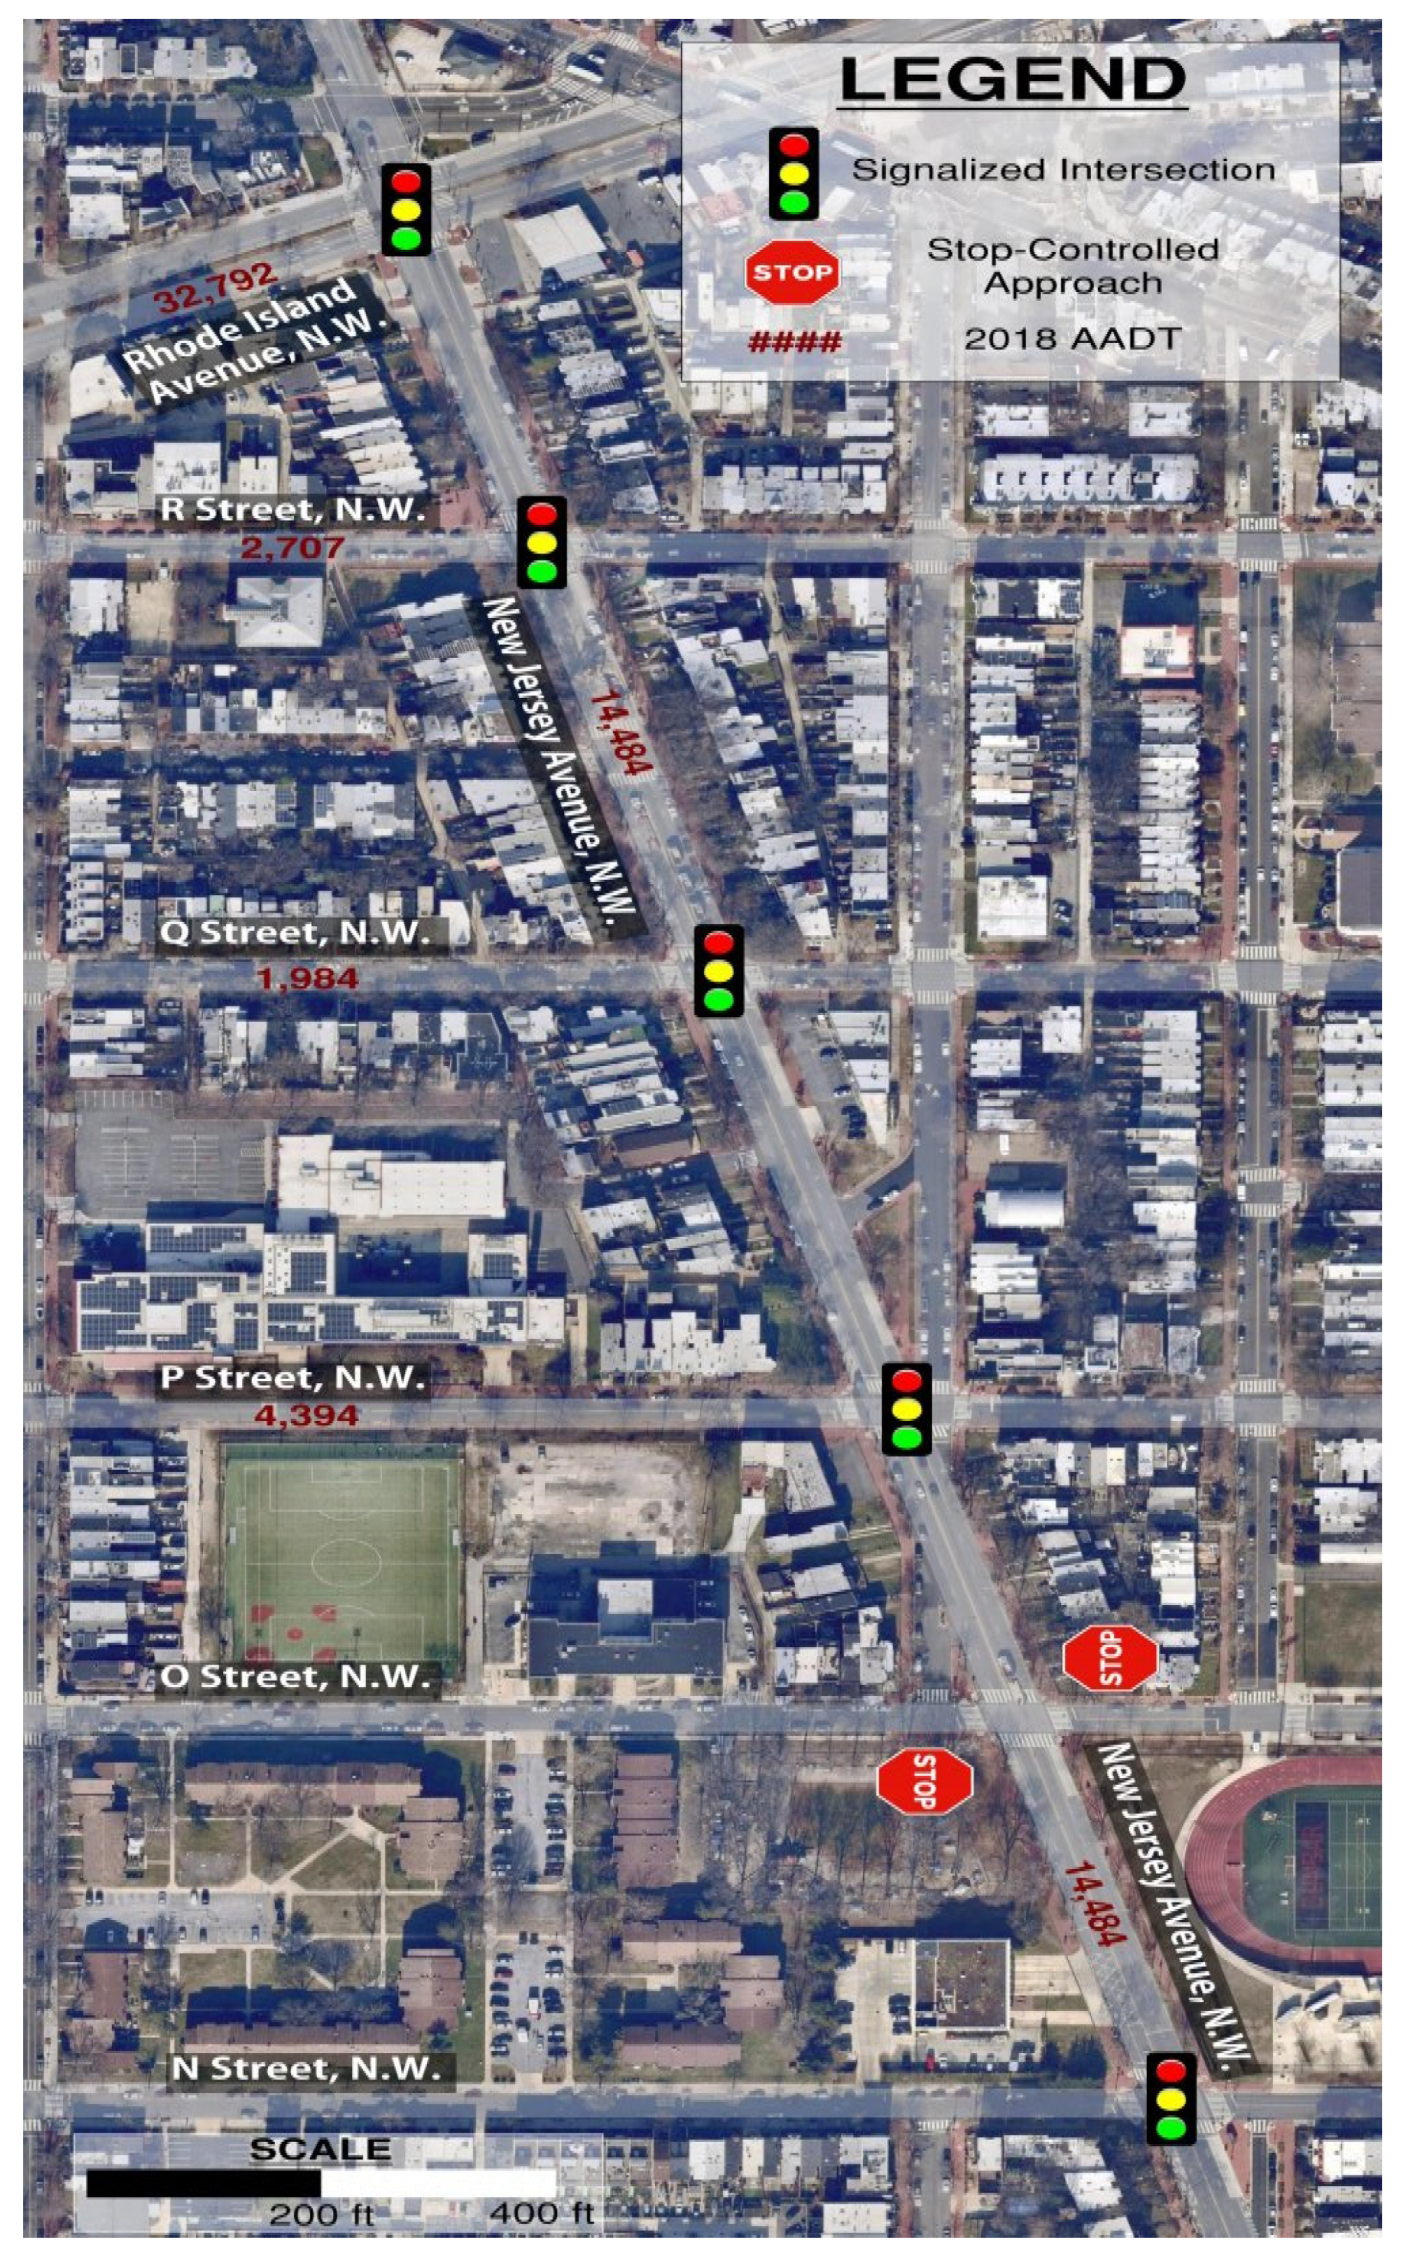
The New Jersey Avenue, N.W. in Washington, D.C., was developed according to the L’Enfant/Ellicott plans of the city and is interrupted by the Capitol Grounds, and most places on the avenue in both Northwest and Southeast quadrants offer views of the U.S. Capitol dome. The avenue is a critical street that links important neighborhoods in the city and provides accessibility to many governmental and industrial building and facilities. This study tests the proposed road diet design on an arterial corridor located in Washington, D.C. as shown in
Figure 1. The New Jersey Avenue corridor extends from Rhode Island Avenue to N Street. The corridor currently contains 4-lanes two-ways, five signalized intersections, and one side street stop-controlled intersection at O Street; all of these have a speed limit of 25 mph. The surrounding areas are mostly zoned for residential use.
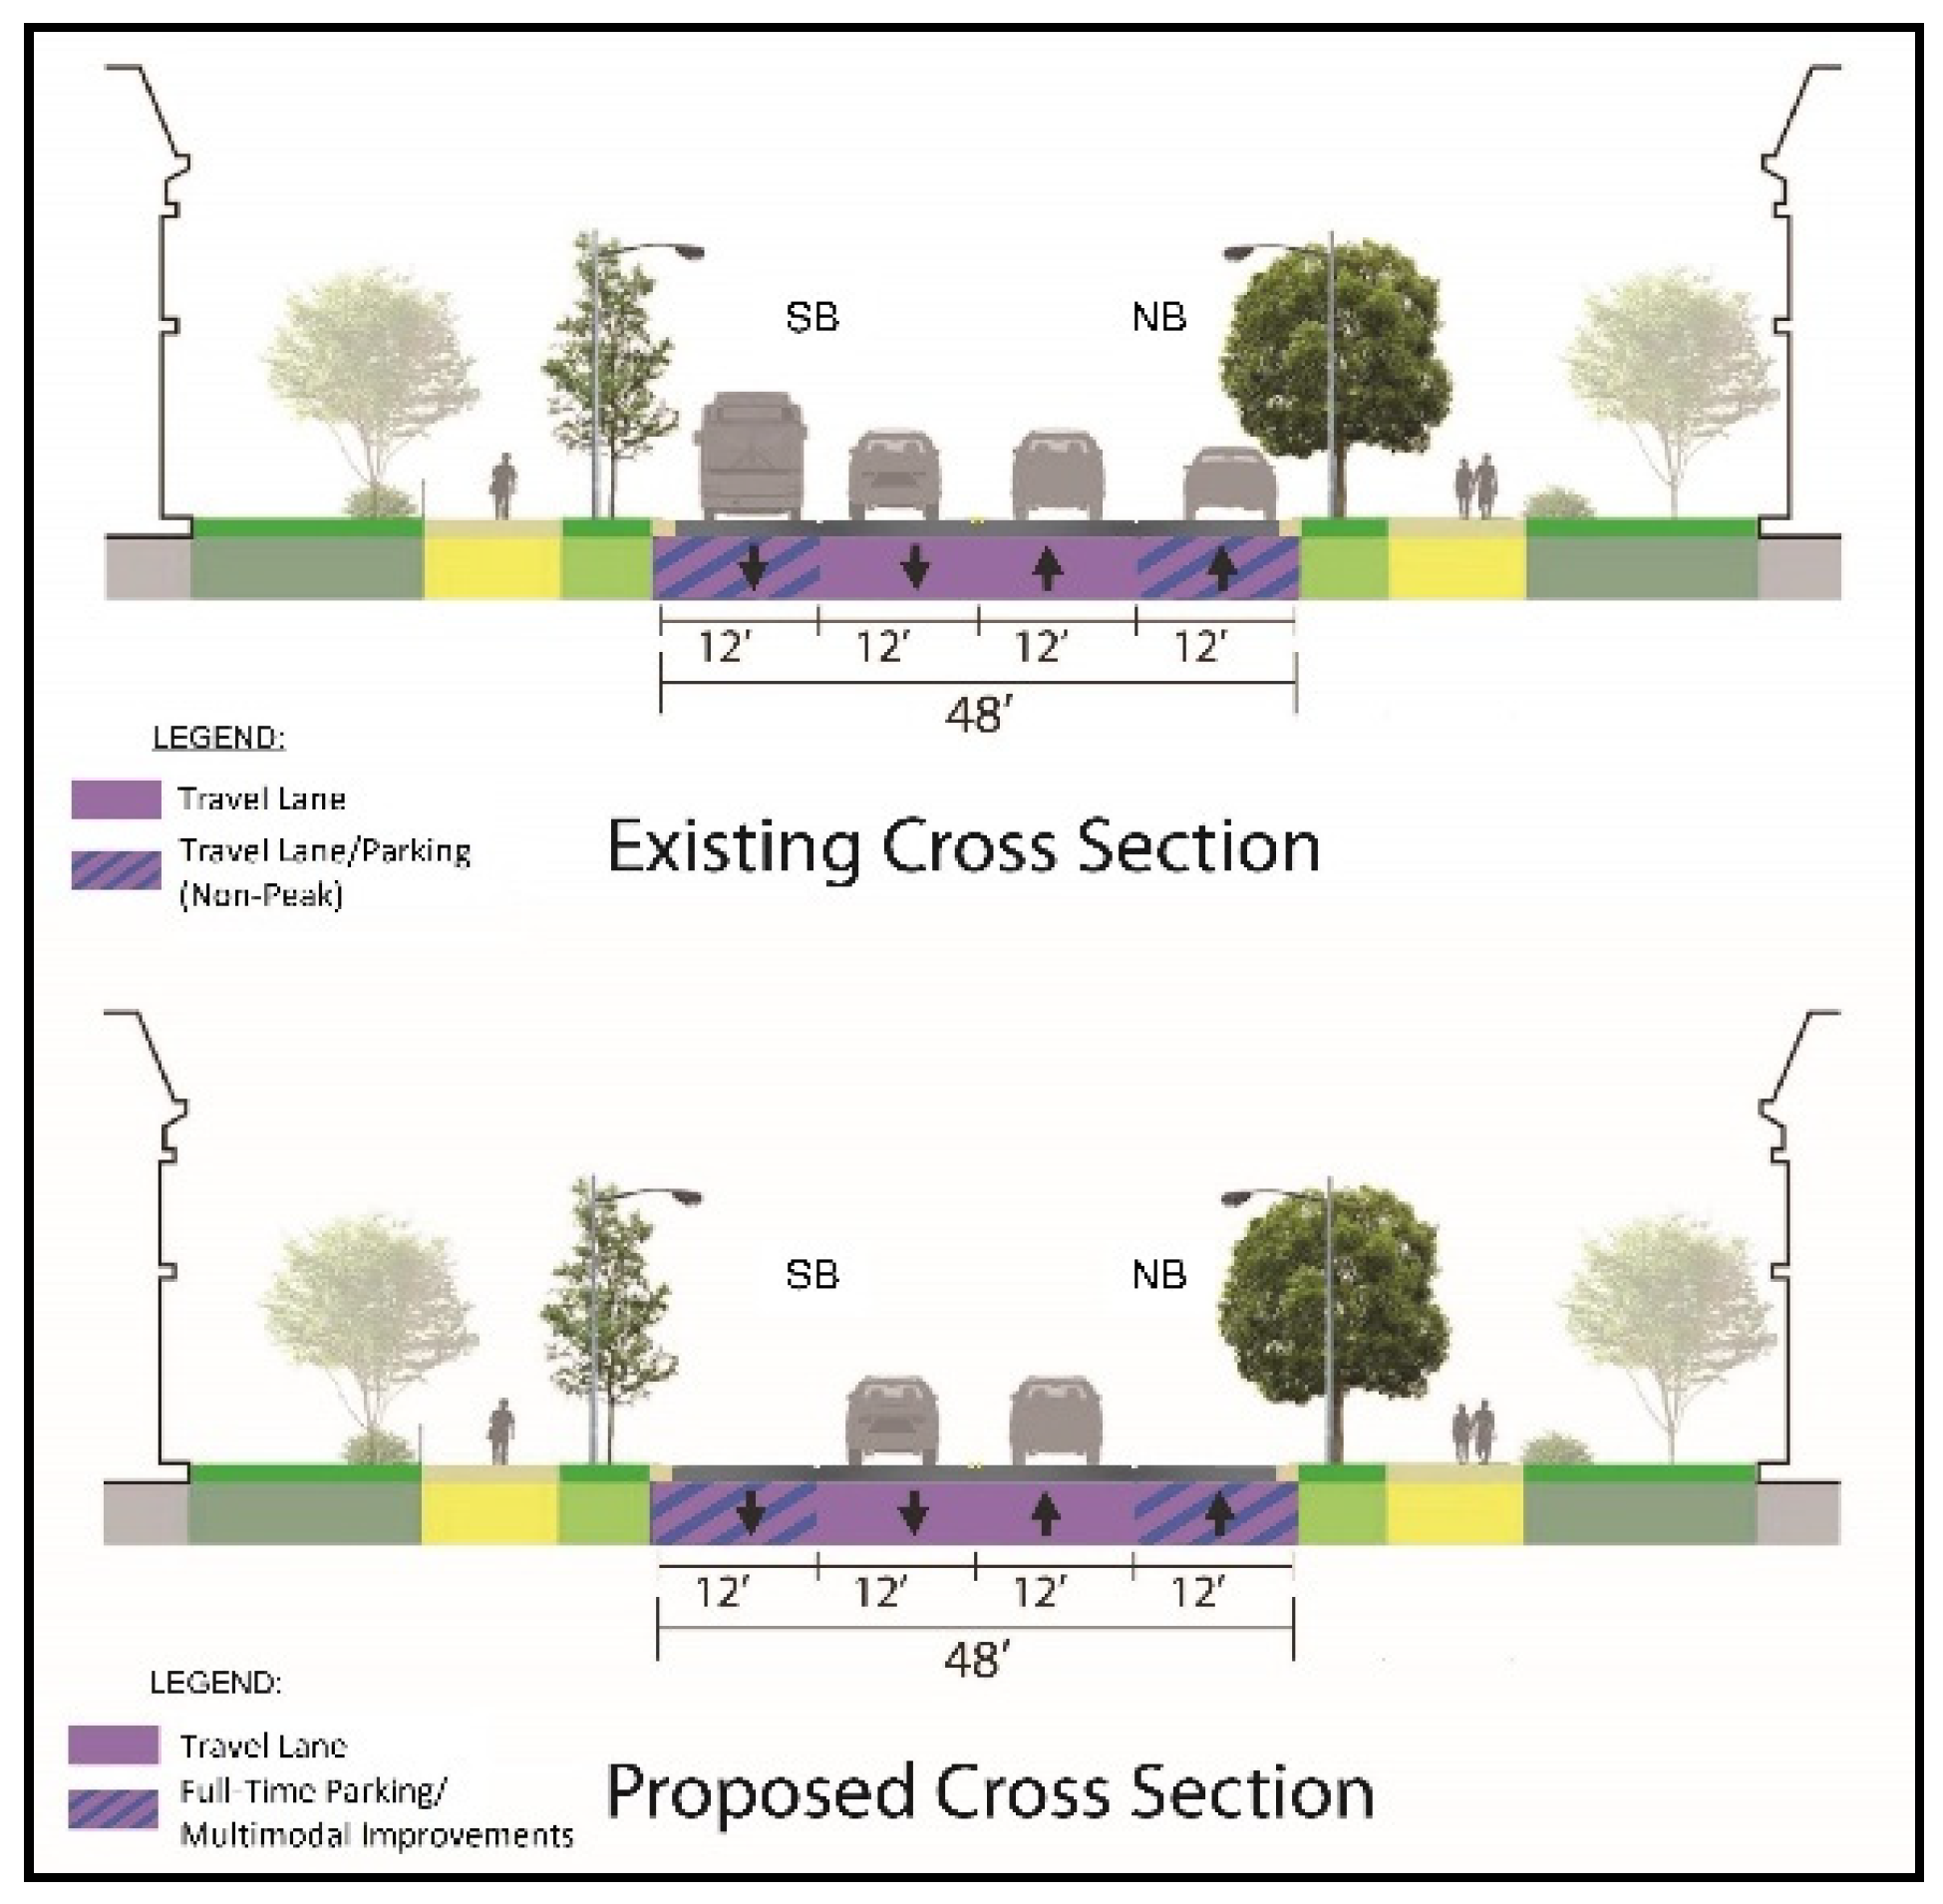
The District Department of Transportation’s records (DDOT) showed that there is a safety issue in this corridor due to having frequent bus stops, speeding, and high pedestrian activities. Consequently, the DDOT put an effort to promote a safe environment for both vehicles and pedestrians. To achieve that, we proposed to have a single traffic lane rather than two-lanes in both directions along the corridor. This change considered having a full-time parking lane in both directions to accommodate parking demands. The corridor’s existing condition dedicated a single parking lane in both directions during non-peak hours only. In the proposed section, a single parking lane is dedicated all the time in the corridor’s northbound and southbound lanes.
Figure 2 illustrates the corridor’s cross sections for existing and proposed road diet scenarios.
A crash data analysis for the unsignalized O Street intersection illustrated that most of the intersection crashes were caused by through and left-turning vehicles coming from minor streets (eastbound (EB) and westbound (WB)). These crashes could be mitigated without signalizing the intersection by restricting the through and left-turn movements from O Street N.W. and by allowing only turn-right movements to turn right at New Jersey Avenue NW. Thus, it was suggested to divert the restricted movements to the nearby parallel streets of P Street N.W. and N Street N.W., both of which are signalized at New Jersey Avenue N.W.
This study is part of a wider study that extends beyond the one road mentioned as a case study in the paper. The simulation model using Synchro included all the affected roads and intersections surrounding the case study, which is the focus of this paper. We found that the effect of this design on the LOS of the surrounding roads and intersections is acceptable (many roads and intersections showed minimal effects). We believe the results of the surrounding areas are beyond the scope of this paper. Moreover, the main motivation of this study is to increase the safety and accessibility on the New Jersey Avenue NW with relatively low-cost design. We will show in the next sections that our proposed design could be an optimal option for many Departments of Transportation nationwide to redesign major urban roads with many intersections if a low-cost design is needed.
As mentioned previously, the main motivation of this proposed study is to increase the safety and accessibility on New Jersey Avenue with relatively low-cost design. We understand that a road diet design might have an impact on the surrounding area. To address this, here is the logic that we followed during implementing the study. First, we investigated New Jersey Avenue spatially considering the traffic in the nearby roads in terms of the volume and origin and destination. We found that we can fairly assume that the corridor is an isolated entity. This assumption was validated through experts and engineers in the DDOT. As such, it was assumed that the proposed improvements shall not introduce major changes in the performance of the larger system. This is because most of the people who usually use the road are not expected to change route due to the changes because the road itself is a critical street that links important neighborhoods in the city and provides accessibility to many governmental and industrial building and facilities in the same road. Second, as shown in
Table 1 and
Table 2, we have carefully studied the impact on the minor roads connected to New Jersey Avenue and found that the minor roads have a relatively low traffic volume. Finally, during the simulation, we performed a crash data analysis for the unsignalized O Street intersection, and it was illustrated that most of the intersection crashes were caused by through and left-turning vehicles coming from minor streets (eastbound (EB) and westbound (WB)), which means that O Street was the only minor road that was impacted heavily by the proposed design. As such, these crashes could be mitigated without signalizing the intersection by restricting the through and left-turn movements from O Street N.W. and allowing only turn-right movements to turn right at New Jersey Avenue NW. Thus, it was suggested to divert the restricted movements to the nearby parallel streets of P Street N.W. and N Street N.W., both of which are signalized at New Jersey Avenue N.W. DDOT might implement new operation restrictions to force this suggested divergent.
A road diet design is a relatively low-cost safety countermeasure, which has many benefits including improving safety, calming traffic, and providing better mobility and accessibility for all road users. These benefits and others can increase and enhance business activity by accommodating pedestrians, bicyclists, and other road users. Our proposed version of a road diet could be beneficial in many cases including critical streets that link important neighborhoods with governmental and industrial buildings.
3.1. Traffic Data
Traffic counts data were obtained from the DDOT. Traffic counts were collected at different locations along the corridor including turning movement counts at all intersections. Two existing traffic scenarios, AM peak and PM peak, are introduced. The AM and PM data were collected between 7:15 a.m. and 08:15 a.m. and from 4:15 p.m. to 5:15 p.m., respectively.
Table 1 and
Table 2 present the traffic counts at different locations for the AM and PM peak scenarios, respectively.
3.2. Signal Timing
The existing traffic signals at the intersections of Rhode Island Avenue, R Street, Q Street, P Street, and N Street are coded using pretimed control type. Moreover, the AM peak and PM peak scenarios have different signal phase timings that capture the variation in traffic demands. The cycle length that is used in all signal controllers is equal to 110 s. Different offset values are also coded to ensure smooth flows along the corridor.
4. Results and Discussions
This section describes the simulation software and discusses the findings from using the road diet design along the New Jersey Avenue corridor.
4.1. Synchro Simulation Software
Synchro is a macroscopic traffic optimization and simulation tool that assists engineers and planners in design, simulation, and optimization of signalized and unsignalized intersections. The Synchro identifies under- and over-saturated signalized intersections based on the ratio of traffic lane volumes to traffic lane capacity (v/c). This study includes a wide network of several roads and intersections that extends beyond the one road mentioned as a case study in the paper. Synchro 11 is a well-known and approved (sometimes, required) traffic simulation software in many Departments of Transportation across the United States including DDOT. It allows engineers/policymakers to analyze signal timing; include multiple scenarios such as AM peak, PM peak, and existing and future traffic; modify the timing plans for each scenario separately; change the volumes for each scenario separately; update geometry in different scenarios; and switch between scenarios to easily compare analysis results with different volumes and timings. Synchro 11 also has a feature (namely, SimTraffic) that could be as a microsimulation tool. Synchro 11 and SimTraffic work as companion models. Macroscopic is used to determine macro level LOS and delays analysis, which it is believed to be sufficient for a high-level planning study. Moreover, Synchro 11 is still very widely used for many transportation agencies in the USA including DDOT for these kinds of studies. As an efficient and accurate macromodel, our simulation model using Synchro 11 included all the affected roads and intersections surrounding the case study, which is the focus of this paper.
Synchro 11 applies the 2000 Highway Capacity Manual (HCM) methodology to report the level of service (LOS) for each lane at both signalized and unsignalized intersections. The HCM has six LOS categories based on average vehicle delay experienced by vehicles entering an intersection [
13].
Table 3 presents the six LOS categories for signalized and unsignalized intersections.
4.2. Existing and Proposed Road Diet Scenarios
This section tests the existing scenario and the proposed road diet scenario that assumes a single shared traffic lane to be utilized in both directions along the New Jersey Avenue corridor between Rhode Island Avenue and N Street intersections. To reduce right-angle crashes, the proposed scenario includes restricting left and through traffic movements on the EB and WB approaches to the O Street intersection and allowing only right-turn movements. Using Synchro 11 simulation, we assessed the existing road network, determined traffic and travel characteristics, identified transport system requirements of the study area, and prepared the O-D matrix of the area. We used the O-D matrix to check the assumption using sensitive analysis and found that the restricted O Street left and through traffic volumes will be diverted to P Street and N Street by about 60% and 40% split, respectively.
Synchro 11 simulation software is also used to test and compare the existing scenario and the proposed scenario.
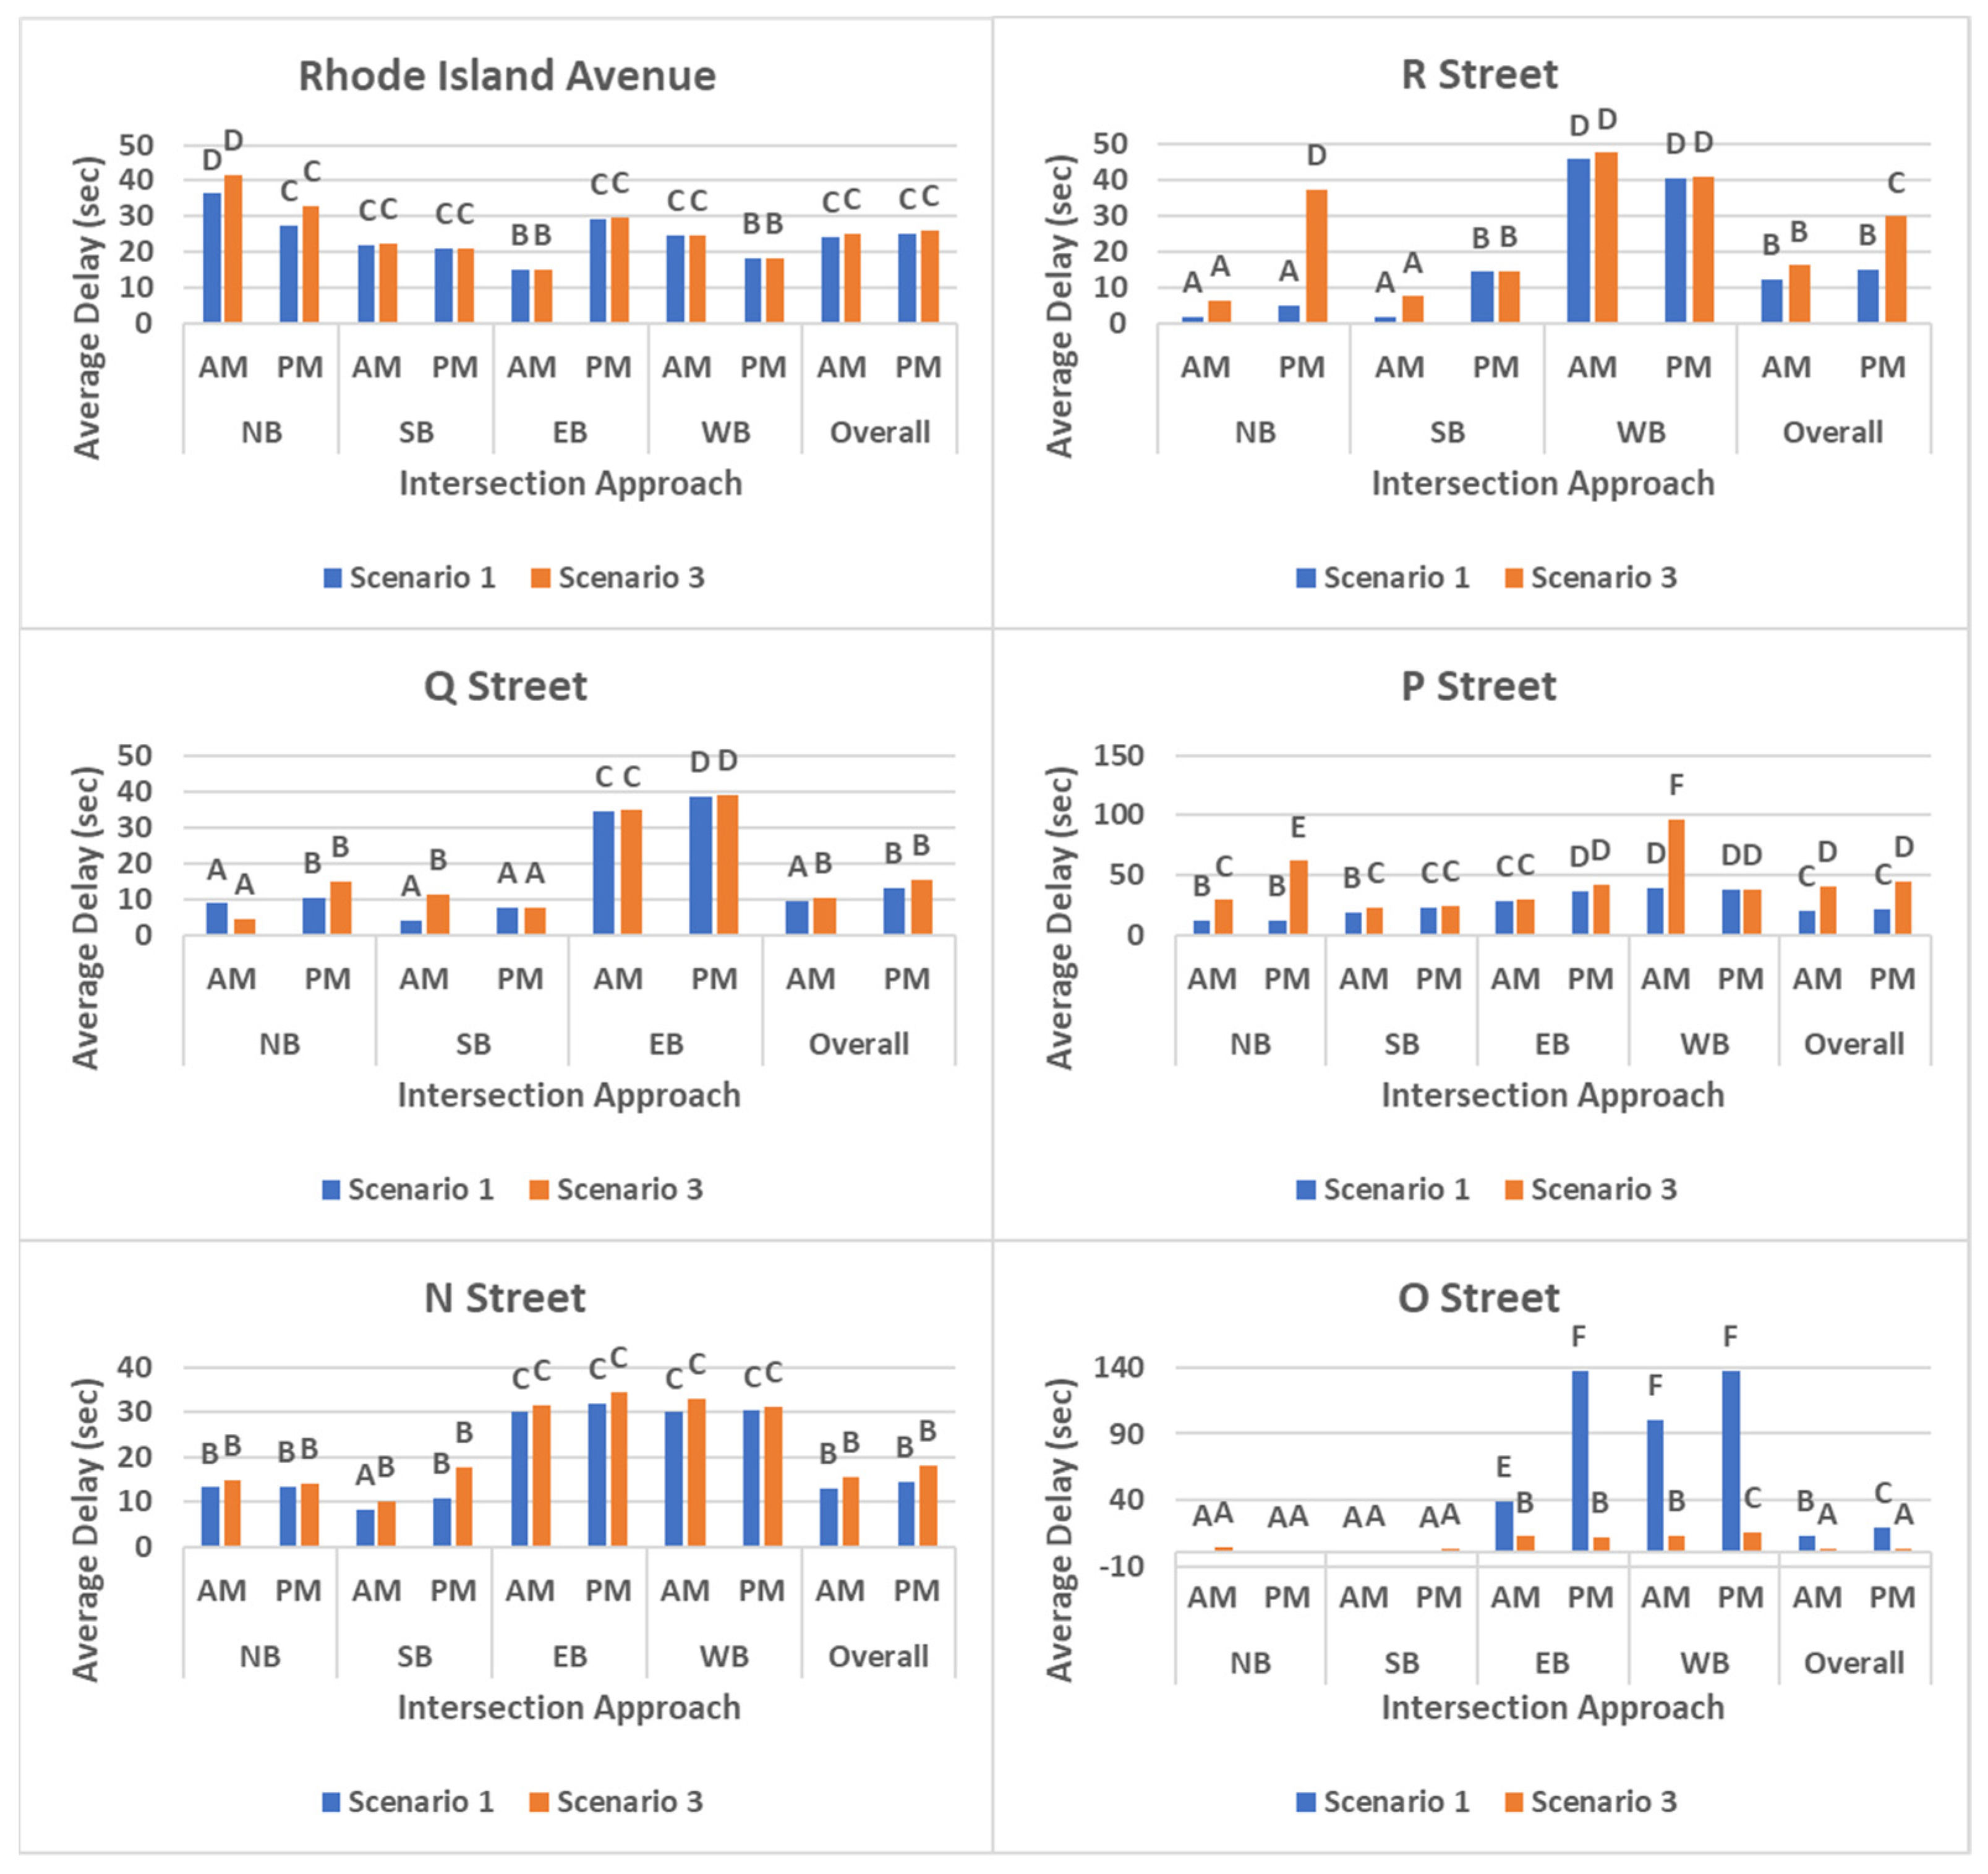
Figure 3 presents the average traffic delay values and level of service (LOS) during the AM and PM peak scenarios for signalized and unsignalized intersections. For the AM peak scenario, the figure demonstrates that having a road diet will significantly increase the average delays for the intersection of P Street due to the significant reduction of traffic capacity, namely, the reduction of the number of traffic lanes from two to one lane in New Jersey Avenue. In addition, this intersection was assumed to have additional traffic demands that were diverted from O Street minor streets for both left and through movements. The figure also shows that the rest of signalized intersections are slightly impacted by the road diet application. In contrast, the road diet improves the performance of the O Street unsignalized intersection due to improvement occurred at EB and WB minor approaches after diverting the left and through traffic movements to P Street and N Street to mitigate right-angle crashes.
For the PM peak scenario, two signalized intersections were negatively impacted from the use of a road diet (R Street went from a LOS of B to C; P Street went from a LOS of C to D). The other two signalized intersections did not have LOS changes. Moreover, implementing the road diet resulted in mitigating the average delay of O Street unsignalized intersection.
At this stage, the intersection of P Street is still the only intersection in the corridor that is significantly impacted by the road diet implementation. This study went in depth in analyzing the P Street intersection for the sake of improving the intersection’s performance. It was found that the WB approach has a lane configuration problem as the approach dedicates the left lane to both left and through movements (high volumes) and the right lane to right movement (low volumes) only. Next, we will discuss an alternative improvement that can enhance the P Street intersection’s performance.
However, in terms of the benefits of the pedestrians from the road diet design, in general, a road diet design can enhance the safety and accessibility for pedestrian users of the road in several ways including harmonizing traffic speed to calm traffic and providing more parking for vehicles, thus making it a more community-focused environment. There are also other secondary effects that benefit pedestrians, such as the opportunity to install pedestrian refuge islands, bicycle lanes, and transit stops. The use of a road diet means that less road width is present, which makes it easier for vulnerable road users to cross the major road at both signalized and unsignalized intersections and thus increases both pedestrian and bicyclist traffic. Specifically, the study illustrated some of these safety benefits from using the road diet, including the reduction in crossing distance for pedestrians and travel speeds that lead to mitigating crash severity. It should also be noted that all phasings’ timings in the proposed design were set to be greater than the minimum time required for pedestrians to cross the intersection safely.
4.3. An Alternative Improvement for P Street Intersection
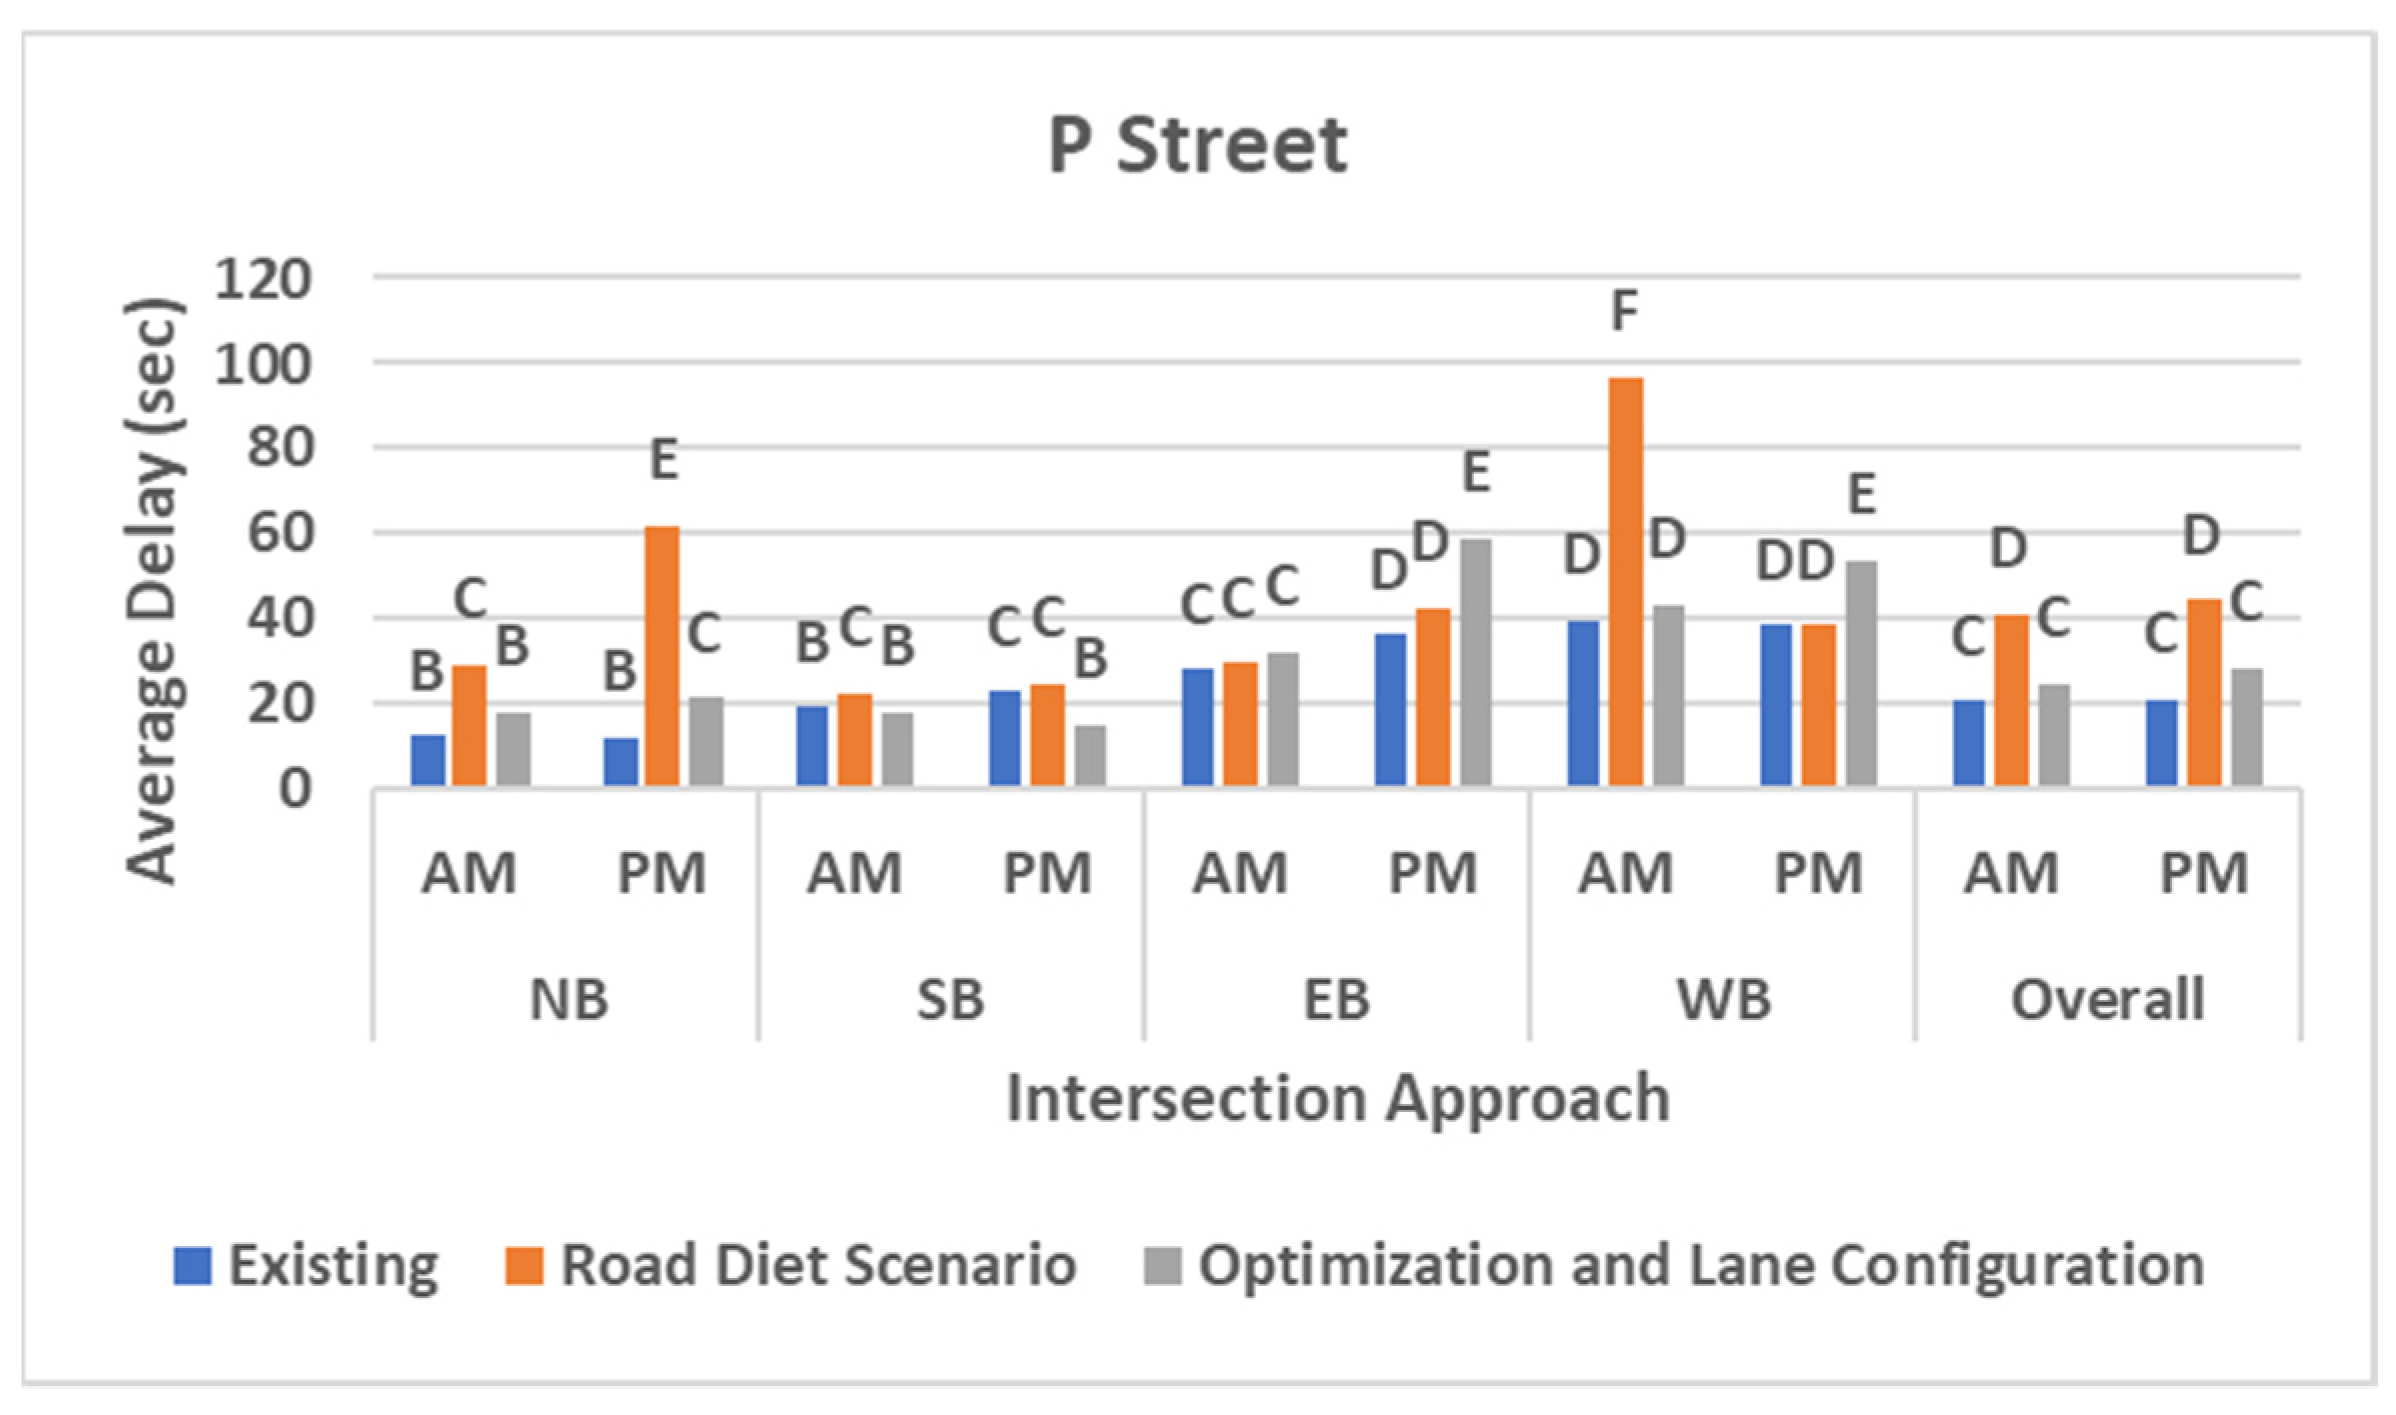
In this study, we looked at the existing lane configuration dedication. Specifically, the WB approach of the intersection of P Street has two lanes: the left lane is shared between left and through movements while the right lane is dedicated for right-turn movements. The left lane has high traffic volumes while the right lane has low traffic volumes. It should be noted that the increased volume of permissive left turns, coming from the traffic demand divergence of O Street, increases the delay significantly on the WB approach due to low gap acceptance that can be found from the opposing movements. Consequently, we recommend changing the lane configuration for the WB approach to accommodate the traffic volumes. Results show that the cycle length was increased about 10%, reflecting the needed increase in the green time for the WB approach. The proposed scenario will modify lane configuration for the WB approach: the left lane will be dedicated for left-turn movements while the right turn will be shared for through and right movements.
In addition, it is suggested to perform a signal timing optimization for the intersection of P Street. The signal timing optimization was performed to better reflect the change in traffic demands. Synchro 11 was used to optimize the signal phasing timings. It should be noted that all phasings’ timings are set to be greater than the minimum time required for pedestrians to cross the intersection safely.
Figure 4 presents the results for existing, road diet, and optimization and lane configuration scenarios. The figure demonstrates that the optimization and lane configuration improvement was urgent, as it would improve the performance of the P Street intersection. The overall LOS for existing, road diet, and optimization and lane configuration scenarios are C, D, and C, respectively. This means that the proposed alternative improvement protects the P Street intersection from being negatively impacted by the road diet.
4.4. Left-Turn Bay Analysis
Left-turn Bay analysis is crucial when a road diet design is introduced, especially when moving from having two-lanes to single shared lane for all movements (left, though, and right). If an approach has high left-turn volumes, then this could result in disturbing other movements which can perform a queue behind a left-turn vehicle that is trying to find a gap to cross the intersection. In this section, three locations with the highest left-turn volumes are evaluated to see if there is a need to add an exclusive left-turn bay. The evaluation uses Exhibit 11-2 in the FHWA guidelines [
14]. A rule-of-thumb is used to determine whether a left-turn bay is needed. The rule-of-thumb demonstrates that an exclusive left-turn lane is needed when a left-turn volume is greater than 20 percent of total approach volume or when a left-turn volume is greater than 100 vehicles per hour in peak periods.
Table 4 demonstrates that no exclusive left-turn bay is needed in the three locations.
4.5. Crash Risk Analysis
Crash risk analysis has been conducted using the Site-Specific Empirical Bayes (EB) predictive modeling method for urban and suburban arterials as contained in the Highway Safety Manual (HSM) [
15]. The HSM predictive method was used to compare between the predicted average crash frequency for the existing design of New Jersey Avenue and the proposed design (i.e., road diet design).
Table 5 depicts the results of the number of predicted crashes per year for each segment in the study area divided by the collision type and crash severity. There are two crash types included in the analysis: multiple-vehicle and single-vehicle crashes. Moreover, there are two crash severities included in the analysis: fatal and injury (FI) and property damage only (PDO) crashes. Results show that implementing a road diet design will decrease the frequency of multiple-vehicle crashes with an average of about 30%. Both types of crash severity will be decreased in the multiple-vehicle crashes. Although results show that the number of predicted single-vehicle crashes will be increased, the total crashes regardless of the collision type will be decreased by an average of about 14%. The potential of a single-vehicle crash occurring in the study area is estimated to be third of a multiple vehicle crash. In addition to improving the operation and accessibility in the study area, a road diet design will also improve the safety of the traffic on New Jersey Avenue.
5. Conclusions
This study aims to enhance traffic operations and safety along the corridor of New Jersey Avenue N. W. in Washington, D.C. The study introduces and evaluates the implementation of a road diet design along the corridor. This proposed design converts a 4-lane road into a 2-lane road and includes single through traffic lane and a full-time parking lane in each direction along the corridor (NB and SB). Furthermore, the new road diet scenario assumes that all left and through traffic volumes in EB and WB approaches at the unsignalized O Street intersection are diverted to P Street and N Street. Results show that the proposed a road diet design improves the safety and performance of the avenue but produces high delay values at the intersection of P Street due to high diverting traffic volumes coming from the O Street intersection. In contrast, the performance of unsignalized intersection is enhanced due to the prohibition design obtained for left and through movements in WB and EB approaches. In addition to improving the operation and accessibility in the study area, a road diet design has also improved the safety of the traffic in New Jersey Avenue by decreasing the total number of predicted crashes yearly in the area. An additional alternative scenario is introduced to mitigate traffic delays for the intersection of P Street. The alternative scenario suggests performing lane configuration improvement and signal timing optimization for the P Street intersection. Results illustrate the need for performing signal optimization and lane configuration improvement to produce the highest performance for P Street.
As a relatively low-cost safety countermeasure, a road diet has many benefits, including improving safety; decreasing and harmonizing traffic speed to calm traffic; providing better mobility and accessibility for all road users, especially Vulnerable Road Users; making it a more community-focused environment; and enhancing overall quality of life. There are other secondary effects, such as the opportunity to install pedestrian refuge islands, bicycle lanes, on-street parking, and transit stops. These benefits can increase and enhance business activity by accommodating pedestrians and bicyclists. Specifically, our proposed version of a road diet could be beneficial in many cases, including in critical streets that link important neighborhoods that include business activities in the city and provide accessibility to many governmental and industrial buildings and facilities.
Author Contributions
The work described in this article is the collaborative development of all authors. Conceptualization, M.A.A., J.G., J.W. and D.V.; methodology, M.A.A., J.G., J.W., D.V. and H.I.A.; software, M.A.A., J.G. and J.W.; validation, M.A.A., J.G., J.W. and D.V.; formal analysis, M.A.A., J.G., J.W., D.V. and H.I.A.; investigation, M.A.A., J.G., J.W. and D.V.; writing—original draft preparation, M.A.A., J.G., J.W. and H.I.A.; writing—review and editing, M.A.A., J.G., J.W., D.V. and H.I.A. All authors have read and agreed to the published version of the manuscript.
Funding
This research was funded by the District Department of Transportation (DDOT) under Contract No. OCPTO190052.
Institutional Review Board Statement
Not applicable.
Informed Consent Statement
Not applicable.
Data Availability Statement
Data is available upon request.
Conflicts of Interest
The authors declare no conflict of interest.
References
- Pawlovich, M.D.; Li, W.; Carriquiry, A.; Welch, T. Iowa’s experience with road diet measures: Use of Bayesian approach to assess impacts on crash frequencies and crash rates. Transp. Res. Rec. 2006, 1953, 163–171. [Google Scholar] [CrossRef]
- Gates, T.J.; Noyce, D.A.; Talada, V.; Hill, L. The Safety and Operational Effects of “Road Diet” Conversions in Minnesota. In Proceedings of the Transportation Research Board 86th Annual Meeting, Washington, DC, USA, 21–25 January 2007. [Google Scholar]
- Noland, R.B.; Gao, D.; Gonzales, E.J.; Brown, C. Costs and benefits of a road diet conversion. Case Stud. Transp. Policy 2015, 3, 449–458. [Google Scholar] [CrossRef]
- Knapp, K.; Chandler, B.; Atkinson, J.; Welch, T.; Rigdon, H.; Retting, R.; Meekins, S.; Widstrand, E.; Porter, R.J. Road Diet Informational Guide; Federal Highway Administration, Office of Safety: Washington, DC, USA, 2014.
- Nixon, H.; Agrawal, A.W.; Simons, C. Designing Road Diet Evaluations: Lessons Learned from San Jose’s Lincoln Avenue Road Diet; Mineta Transportation Institute: San Jose, CA, USA, 2017. [Google Scholar]
- Kim, S.; Park, J.; Abdel-Aty, M.; Lee, S.; Kim, S. Influence of road lane reductions on motorised and non-motorised traffic safety. In Proceedings of the Institution of Civil Engineers-Municipal Engineer; Thomas Telford Ltd.: London, UK, 2019; Volume 172, pp. 233–238. [Google Scholar]
- Davis, C.H.; Yang, R.; Gkritza, K.; Fricker, J.D. Economic Development Impact of Corridor Improvements; Purdue University Press: West Lafayette, IN, USA, 2018. [Google Scholar]
- Stamatiadis, N.; Kirk, A.; Wang, C.; Cull, A.; Agarwal, N. Guidelines for Road Diet Conversions; Kentucky Transportation Center: Lexington, LY, USA, 2011. [Google Scholar]
- Rosales, J.A.; Knapp, K.K. Livability impacts of geometric design cross-section changes from road diets. In Proceedings of the 3rd International Symposium on Highway Geometric Design Transportation Research Board American Association of State Highway and Transportation Officials (AASHTO) Federal Highway Administration American Society of Civil Engineers Association Mondiale de la Route International Road Federation Institute of Transportation Engineers (ITE) National Association of County Engineers Transportation Association of Canada (TAC) Chicago Department of Transportation Illinois Department of Transportation Illinois State Toll Highway Authority, Chicago, IL, USA, 29 June–1 July 2005. [Google Scholar]
- Huang, H.F.; Stewart, J.R.; Zegeer, C.V. Evaluation of lane reduction “road diet” measures on crashes and injuries. Transp. Res. Rec. 2002, 1784, 80–90. [Google Scholar] [CrossRef]
- Sohn, K. Multi-objective optimization of a road diet network design. Transp. Res. Part A Policy Pract. 2011, 45, 499–511. [Google Scholar] [CrossRef]
- Gudz, E.M.; Fang, K.; Handy, S.L. When a diet prompts a gain: Impact of a road diet on bicycling in Davis, California. Transp. Res. Rec. 2016, 2587, 61–67. [Google Scholar] [CrossRef]
- Highway Capacity Manual. Highway Capacity Manual; TR News: Washington, DC, USA, 2000. [Google Scholar]
- Chandler, B.E.; Myers, M.; Atkinson, J.E.; Bryer, T.; Retting, R.; Smithline, J.; Trim, J.; Wojtkiewicz, P.; Thomas, G.B.; Venglar, S.P.; et al. Signalized Intersections Informational Guide; Federal Highway Administration, Office of Safety: Washington, DC, USA, 2013.
- Part, D. Highway Safety Manual; American Association of State Highway and Transportation Officials: Washington, DC, USA, 2010. [Google Scholar]
| Publisher’s Note: MDPI stays neutral with regard to jurisdictional claims in published maps and institutional affiliations. |
© 2021 by the authors. Licensee MDPI, Basel, Switzerland. This article is an open access article distributed under the terms and conditions of the Creative Commons Attribution (CC BY) license (https://creativecommons.org/licenses/by/4.0/).


