Abstract
The influence of government policies on the selection of recycling channels has been widely discussed, but there are few studies from the perspective of product Eco-design. This paper examines the recycling channel options for a manufacturer applying Eco-design under government environmental regulation. We consider a system that includes a retailer, a manufacturer, and a government, and develop a three-stage Stackelberg game model. The government firstly decides whether to impose environmental regulations. Next, the manufacturer decides whether to recycle by himself or delegate the recycling task to the retailer, deciding both the wholesale price of the product and the collected price (recycled by the manufacturer) or the recycling compensation to the retailer (recycled by the retailer), and the retailer decides the retail price of new products and the collection price (recycled by the retailer). Our study finds that for the regulator, the optimal policy is not to implement environmental regulation because the manufacturer has implemented the product Eco-design. For the manufacturer, the choice of recycling channel depends on the recycling cost of the manufacturer and the retailer. When the manufacturer’s recycling cost is below a certain threshold, he will prefer to recycle the waste products by himself, and when the cost increases beyond this threshold, the manufacturer will transfer the recycling task to the retailer.
1. Introduction
The rapid development of the manufacturing industry in recent years has not only brought about economic growth, but also environmental degradation, which has made the human living environment worse. To improve the living environment while increasing sustainability, the Extended Producer Responsibility (EPR) system was used to encourage manufacturers to produce greener products and apply cleaner systems, not only during the production process but also throughout the lifecycle of a product [1]. As a response, several environmental regulations have been developed, such as cap-and-trade [2,3], carbon tax [4,5,6], tax subsidy [7,8,9], reward–penalty (joint tax/subsidy) [10,11,12,13], take-back [14,15,16], etc. In practice, manufacturers mainly respond to EPR regulations in two ways: product recycling and product Eco-design.
The approach to product recycling has been a major target of EPR regulations [17]. In this way, the manufacturers are actively building reverse channels and seeking optimal strategies for reverse recycling [18], as well as incorporating the production of eco-friendly products into their production plans. Reverse supply chains are the process of recycling products at the end of their lifecycle [19], and various industries have invested more effort in a reverse supply chain. When selecting the recycling channel, manufacturers often consider costs, benefits, energy efficiency, and government incentives and penalties. The three traditional reverse recycling channels include recycling by the manufacturer, recycling by the retailer, and recycling by the third party [20]. For example, Hewlett-Packard has chosen to work with retailers, entrusting them with the responsibility of recycling discarded products [21].
The concept of Eco-design was first introduced in the 1990s and has been in development for over 30 years [22]. Eco-design, also known as green design or environmental design, is the process of incorporating environmental factors into product design to make products cleaner [23]. Eco-design can improve product cleanliness and reduces environmental pollution at the source, and reduces the treatment cost of recycled products [24]. The concept of Eco-design is an important concept for sustainable supply chains, which considers the active participation of every stakeholder in creating sustainability [25].
Despite being discussed in depth separately, product recycling and Eco-design are not taken into account as two effective and feasible strategies to choose from in the sustainable operation management framework. The issue of product recovery has been widely discussed, and most of the existing studies show that when the manufacturer carries out product recovery under the take-back regulation, it is beneficial to the supply chain members and the whole supply chain. However, there are insufficient studies on the impact of recycling regulation on product Eco-design. In particular, there is no academic research on the relationship between recycling regulation, product recycling, and product ecological design. However, different from the existing literature, we consider that the product ecological design will not only reduce the waste discharge but also reduce the recovery cost. In other words, we focus on the disposability of recycled products. Moreover, the manufacturer needs to choose between two recycling channels in this paper: (1) recycling by himself and (2) delegating the recycling task to a retailer and paying a certain amount of subsidy. At the same time, the government will decide on whether to regulate or not with take-back regulation. Further, we explore how take-back regulation can incentivize the manufacturer to actively participate in the recycling process and how the manufacturer can respond to the regulation to reduce penalties while increasing profits. Based on the above, this paper attempts to address the following issues:
- (1)
- When the manufacturer performs the product Eco-design, how does the implementation or non-implementation of environmental regulations affect a manufacturer’s decision about recycling practices?
- (2)
- How should the manufacturer respond to environmental regulations?
- (3)
- Given the different options available to manufacturers, what should be the government’s environmental regulation response to maximize social welfare, and whether the implementation of government recycling regulations has motivated the level of Eco-design of the manufacturer’s product?
To address the above issues, we consider a system that includes a retailer, a manufacturer, and a government. Firstly, the government decides whether to regulate recycling, and the entire system of recycling regulation is in place. Next, the manufacturer responds to the government’s policy by deciding whether to entrust the retailer with the recycling of the used products or to recycle himself directly. If the decision is made to entrust recycling to a retailer, the retailer will be paid a subsidy. In this process, the government is the one that seeks to maximize social welfare, and the manufacturer is the one that seeks to minimize penalties and maximize profits.
The remainder of the article is structured as follows. Section 2 reviews the research literature in the related field. Section 3 presents basic symbolic references, assumptions, and formulas, and lists the model and each of the scenarios. Section 4 is an equilibrium for the subgame of the previous scenario. Section 5 summarizes and makes management recommendations. All proofs of this paper are provided in the Appendix A.
2. Literature Review
In recent years, the research on recycling channel selection under recycling policies has yielded promising results. This paper examines how a manufacturer implements Eco-design in a supply chain with regulation and chooses recycling channels, and how the government formulates regulatory policies. Therefore, this paper focuses on three streams of literature: recycling channels, Eco-design, and environmental regulation on recycling.
With respect to the recycling channels, previous literature has focused on decisions regarding the selection of the reverse channel. There are three recycling channels through which manufacturers can collect the used products: recycling by the manufacturer, recycling by the retailer, and recycling by the third party. In the three recycling channels, Savaskan et al. [26] looked at the retailer having the advantage of being closer to the consumer and therefore more efficient, and Choi et al. [27] showed that the recycling channel for the retailer is optimal by considering a manufacturer–collector–retailer supply chain. Based on these studies, Panda et al. [28] concluded that the manufacturer uses the socially responsible act of recycling as a profit-making tool, it cannot do recycling arbitrarily. Competitive factors in the recycling channel also affect recycling efficiency. By assessing the effects of the intensity of competition between retailers and the third party, it can be concluded that a decentralized model oriented by retailers tends to be most effective in maximizing social welfare [29]. Under certain conditions, manufacturers are willing to take back the discarded products from collectors. If the collector and the recycler have symmetrical information and make decisions at the same time, this is more favorable to the manufacturer [30]. However, this statement is not absolute. Even under two symmetrical supply chains, asymmetries persist when performing reverse recycling channel selection [31]. Besides, in a closed-loop supply chain (CLSC) model for high-tech products, the choice of the manufacturer’s recycling channel is closely related to the collection method deployed by the CLSC [20], and when manufacturing costs are unstable, the indirect channel is the optimal choice for robust production planning [32]. With the development of electronic commerce and its application deepening, the online and offline dual-channel recycling mode has become a new research focus in this field. Huang et al. [33] found that the manufacturer-oriented dual-recycling channel supply chain outperforms the single-recycling channel supply chain. In the same line, Feng et al. [34] deduced that the dual-recycling mode is tactically superior. Taleizadeh et al. [35] explored two competitive reverse supply chains in collecting and refurbishing the used products after their useful life. However, the above studies have only focused on the choice of recycling channels, and with the popularization of the Extended Producer Responsibility (EPR), the government’s intervention is an important factor influencing decision-makers. Therefore, this paper considers the influence of government regulatory policy on the manufacturer’s choice.
Eco-design helps a company to reduce the environmental impact at the source of the supply chain, thereby improving sustainability. The concept of Eco-design was introduced in the 1970s, and it is also called product design and environment design. The earth may be overburdened by overconsumption of resources, and designers should take responsibility for environmental protection and actively participate in environmental activities [36]. Some discarded parts of large manufacturing products such as aircrafts and other high-tech products still have great value, and proper Eco-design in the design phase can improve the utilization of the discarded parts [37]. Despite some difficulties in achieving sustainability, some limitations can be overcome with stakeholder collaboration, such as the use of collaborative Eco-design approaches to address the relationship between sustainability and new composite materials [38]. Khor et al. [39] explored the structural paths of Eco-design, reverse logistics, design for disassembly, and business performance outcomes, and they suggested that reverse logistics is positively associated with environmental outcome and profitability, while Eco-design did not appear to derive a similar outcome. Pazoki and Samarghandi [16] discussed the influence of take-back regulation on manufacturers’ product Eco-design strategies. Green technology has been fully developed with the application of Eco-design. Products produced using green technology will have a lower carbon footprint, and although they may cost slightly more than ordinary products, eco-conscious consumers will be more willing to buy them. With equity in mind, a fair supply chain applying green technology innovations can have a positive impact on the development of green technologies, and equity in a supply chain structure can provide incentives for supply chain members to invest in green technologies [40]. This effect still works under environmental taxes. Further investigation reveals that the higher the spillover effect of clean technology on the supply chain, the more likely it is that green technology will be adopted [41]. The above studies revolve around Eco-design and green technology, but they do not consider the impact of the selection of recycling channels and government environmental regulation. Different from these studies, this paper focuses on the selection of recycling channels and government environmental regulation under product Eco-design.
Environmental regulation is also a focus of this study. The government has implemented various regulatory measures regarding the EPR [42]. Fargnoli et al. [43] systematically discussed the impact of environmental regulations on industrial products. The appropriate intervention of the government in recycling through making regulations and using financial instruments can have a positive impact on recycling [44,45]. Trading caps, recovery penalties, and subsidies are common and effective methods [46,47,48]. Zhao and Chen [49] showed that the financial subsidy is an effective way for the government to encourage and support the development of green products. However, in a two-period model with two recyclers, Zhou et al. [50] showed that the implementation of regulation may sometimes not maximize social welfare. A joint tax subsidy mechanism can incentivize manufacturers to innovate ecologically, and suggested incorporating recycling considerations into their production and eco-innovation decisions [9]. The government should implement different recycling policies at different times in order to regulate the recycling market [12]. Liu et al. [51] explored the impact of the dual regulation (including a deposit–refund policy and minimal collection rate) on CLSC. Different from the above studies, which did not consider Eco-design, this important factor is taken into account in this paper. While some recent studies have examined the impact of government environmental regulations on manufacturers’ adoption of product Eco-design strategies [16,52], this paper relates take-back regulations to the choice of recycling channels and explores what regulatory strategies governments should develop when the manufacturer has chosen a product Eco-design strategy.
This paper focuses on the following three aspects and extends the related research. Firstly, we study the decision of recycling channels under the leadership of the manufacturer, who decides whether to entrust the recycling of the used products to the retailer or to directly recover himself. Secondly, the products we study are based on the premise that the manufacturer has employed Eco-design. Such clean technologies can help the manufacturer to reduce regulatory penalties and improve waste disposal efficiency. Lastly, our study also addresses government decisions that consider social welfare maximization. The government decides on whether to impose an environmental regulation on the manufacturer.
3. Model Development
We proceed by describing the assumptions, scenarios, and models in detail. The notations used in our models are presented in Table 1.

Table 1.
Summary of basic notations.
Consider a three-stage supply chain system consisting of a government, a manufacturer, and a retailer, where both the manufacturer and the retailer are risk-neutral and perfectly rational, and the government as a leader considers implementing an environmental regulation, which will be imposed on manufacturers for products that are not collected. In response to environmental pressure, the manufacturer will design its products to be Eco-designed, which can reduce environmental pollution and the disposal cost of the collected product [16]. After the manufacturer gives the level of Eco-design, , he will decide whether it will be responsible for collecting or entrusting a downstream retailer to recovery, then decides its collection price, (when collecting by manufacturer), or compensation paid, , to the retailer when entrusting the retailer with collecting, as well as the wholesale price of the product, , for the retailer. Finally, the retailer decides the retail price of the product, , and the collection price, (when collecting by the retailer).
Meanwhile, we discuss some assumptions which are considered in this paper as follows.
Demand function: The market demand is deterministic, and the demand function is , where is the size of the total market demand and is the price sensitivity of the demand.
Product acquisitions: The quantity of the collected product is related only to the collection price, and the quantity function is , where is the price sensitivity of collecting. The used products still have the net residual value [53], and this value is denoted by . During the recycling process, there are also disposal costs. In the absence of applied Eco-design, the disposal costs for the manufacturer and retailer are and , respectively. According to [26], since the retailer is closer to the consumer in the supply chain, the collecting costs will be lower ().
Design for the environment: As mentioned earlier, the manufacturer uses Eco-design to reduce environmental pollution and the disposal cost of the collected product. The costs of Eco-design are , where represents the cost coefficient of Eco-design, where the higher the value, the lower the efficiency [54]. The disposal costs for the manufacturer and retailer are and with Eco-design respectively, and is the cost reduction effectiveness of Eco-design for the collected product [24].
Take-back regulation: As a result of the EPR, we consider a government that implements a regulatory policy to penalize the used products that are not fully recycled on a per-unit basis. Therefore, the regulation is added as a cost function, , and the is the per-unit take-back penalty.
Performance indicators and collectability: The government’s goal in implementing the legislation is to maximize social welfare. The social welfare function is composed of the profit of supply chain members and collected penalties. It is common to assume that not all products are recyclable. To address this issue, we use the recycling price as an incentive for customers to recycle used products [16].
The game models are as follows: The government decides to impose a take-back regulation or not. Upon observing the take-back regulation, the manufacturer reacts by performing collecting by himself or entrusting the retailer. If collecting the used products by himself is selected, he makes decisions on the level of Eco-design, the price of the used products, and the wholesale price to maximize the profit. If entrusting the retailer to collect is the best strategy for the manufacturer, the decisions are made on the level of Eco-design, the wholesale price, and take-back compensation price. Finally, the retailer decides the retail price of the product and the collection price (when collecting by the retailer).
The four scenarios are presented in Table 2.
Table 2.
Different strategy pairs and four scenarios.
3.1. Scenario 1
In this scenario, the environmental regulation is not imposed, and the manufacturer chooses to collect the used products by himself as a response strategy. The manufacturer’s profit comes from the new product produced and from recycled scraps. At the same time, the Eco-design costs influence profitability.
The maximum profit of the manufacturer can be expressed as follows:
In Equation (1), the first two items are wholesale profit and recovery profit respectively, and the last item is the invested cost of the product Eco-design.
The retailer maximizes a profit which can be presented as follows:
Lemma 1.
The objective function (1) is concave if and only if
Proof of Lemma 1 as well as the proofs of the other propositions are provided in Appendix A.
The retailer determines the retail price, and the manufacturer determines the level of Eco-design, the price of the used product, and the wholesale price. We obtain equilibrium strategies, which are provided in Proposition 1.
Proposition 1.
If a take-back regulation is not imposed and the manufacturer decides to collect the used product himself as a response strategy, the equilibrium strategies are:
Proposition 1 shows that the level of Eco-design and the price of the collected product increase with the salvage value of the collected product and decrease with the manufacturer’s per unit recycle processing costs. In other words, it is very important to control the salvage value of the collected product and the disposal cost during the recycling process. Proposition 1 also shows that sales and wholesale prices are only related to market size, price sensitivity, and unit production cost, and are independent of other parameters.
3.2. Scenario 2
In this scenario, the environmental regulation is not imposed, and the manufacturer chooses to entrust the retailer to collect the used products. The maximized profit of the manufacturer can be presented as follows:
In Equation (7), the first two items are wholesale profit and recovery profit respectively, and the last item is the invested cost of the product Eco-design.
The retailer maximizes a profit, which can be presented as follows:
In Equation (8), the first item is selling profit and the last item is recovery profit.
Lemma 2.
The objective function (7) is concave if and only if
The retailer determines the retail price and the price of the used products, and the manufacturer determines the level of application of Eco-design, the wholesale price, and the take-back compensation price. We obtain equilibrium strategies, which are provided in Proposition 2.
Proposition 2.
If a take-back regulation is not imposed and the manufacturer decides to entrust the retailer to collect the used products as a response strategy, the equilibrium strategies are:
According to the comparative analysis of Propositions 1 and 2, we can find that the salvage values of the collected product and the recycle processing costs have a smaller impact on the level of Eco-design and the price of the collected product in Scenario 2. In addition, an interesting finding is that the sale price and the wholesale price are the same in Scenarios 1 and 2.
3.3. Scenario 3
This scenario describes that the government decides to impose the take-back regulation, and the manufacturer decides to collect the used product by himself. In this scenario, the manufacturer would be penalized by the government for products that were not recalled, and the per-unit penalty to the manufacturer will decrease relatively because of Eco-design. The maximized profit of the manufacturer can be presented as follows:
In Equation (14), the first two items are wholesale profit and recovery profit respectively, and the last two items are the invested cost of product Eco-design and the penalty cost of take-back regulation, respectively.
The maximized profit of the retailer can be presented as follows:
Lemma 3.
The objective function (14) is concave if and only if
The retailer determines the retail price, and the manufacturer determines the level of Eco-design, the price of the used product, and the wholesale price to maximize the profit. We obtain equilibrium strategies, which are provided in Proposition 3.
Proposition 3.
If a take-back regulation is imposed and the manufacturer decides to collect the used product himself as a response strategy, the equilibrium strategies are:
Proposition 3 shows that the intensity of take-back regulation has a positive impact on the recovery price, but the influence of the intensity of take-back regulation on other decision variables is uncertain. On the one hand, if the product design has a high impact on the recovery cost, the level of Eco-design will be improved with the increase of take-back regulation; on the other hand, if the level of Eco-design has a high impact on the environment, the level of Eco-design will be reduced with the increase of take-back regulation. Moreover, the relationship between the take-back regulation and the sales price or wholesale price is related to market size and the Eco-design cost coefficient.
3.4. Scenario 4
This scenario describes that the government decides to offer a take-back regulation, and the manufacturer decides to choose to entrust the retailer to collect the used products. In this case, the manufacturer would be penalized by the government for products that were not recalled, and the per-unit penalty to manufacturers because of Eco-design will decrease relatively. The maximized profit of the manufacturer can be presented as follows:
In Equation (20), the first two items are wholesale profit and recovery profit respectively, and the last two items are the invested cost of product Eco-design and the penalty cost of take-back regulation, respectively.
The maximized profit of the retailer can be presented as follows:
In Equation (21), the first item is selling profit and the last item is recovery profit.
Lemma 4.
The objective function (20) is concave if and only if
The retailer determines the retail price and the price of the used product. The manufacturer determines the emission reduction, the wholesale price, and take-back compensation price. We obtain equilibrium strategies, which are provided in proposition 4.
Proposition 4.
If a take-back regulation is imposed and the manufacturer decides to entrust the retailer to collect the used product as a response strategy, the equilibrium strategies are:
According to the comparative analysis of Propositions 3 and 4, we can find that the take-back regulation has a smaller impact on the level of Eco-design and the price of the collected product in Scenario 4. In addition, unlike in Scenarios 1 and 2, the selling price and the wholesale price are not the same in Scenarios 3 and 4.
4. Sub-Game Perfect Equilibrium
In Section 3, we analyzed four scenarios. Scenarios 1 and 2 are built assuming that government intervention does not exist, while the regulator decides to impose an EPR regulation in Scenarios 3 and 4. The equilibrium between the manufacturer choosing to take back by himself or through the retailer is shown in each of the two scenarios. In this section, we intend to find the scenario which is selected by the Stackelberg competition between manufacturer and regulator. To find the perfect equilibrium of the subgame, we first analyze each possible strategy of the manufacturer in dealing with the government. Then, we compare and analyze different scenarios of social welfare to explore the strategies of leader and follower.
4.1. Manufacturer
Unregulated Manufacturer: The regulator decides not to stipulate a take-back regulation. The choice of the manufacturer is either collecting the used product himself or entrusting the retailer to collect. For this purpose, total profit functions for Scenarios 1 and 2 are compared.
Proposition 5.
The manufacturer prefers to choose to collect the used products himself if:
Proposition 5 sets an upper bound on the price of the retailer in collecting the used products. Obviously, when the manufacturer’s recycling disposal cost is below a certain threshold, the manufacturer will recycle the waste product himself. If the collecting cost is higher than this threshold, entrusting the retailer to collect is the best option for the manufacturer.
Regulated Manufacturer: In this case, the manufacturer is regulated, and there is a fine for non-compliance with recycling standards. To examine the best strategy for the manufacturer when the government decides on two different take-back policies, we present the impact of the collecting costs of the manufacturer on the manufacturer’s profits in each scenario by a numerical example.
Example 1.
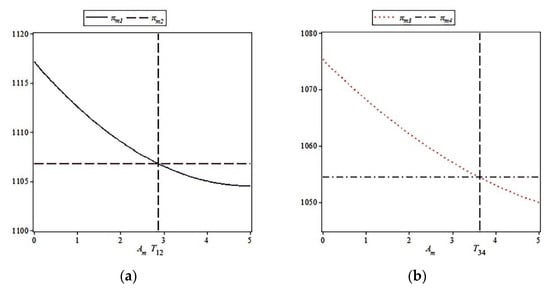
In this example, let the salvage value of the collected product, and the total market demand size. We let the Eco-design cost efficiency be as large as possible since a larger value of this parameter represents a less efficient Eco-design. Considering the Eco-design efficiency, we let,,,,,, and. Let the per-unit take-back penalty. We get Figure 1. Figure 1 depicts the regions where the manufacturer shifts from one strategy to another.
Figure 1.
(a) Manufacturer’s profit without regulation, and (b) manufacturer’s profit under regulation.
We further get and . From Figure 1, if , the manufacturer will just choose to carry on with collecting by himself for whichever take-back policy is in place, and if , the manufacturer will just choose to carry on entrusting the retailer for any take-back policy. Within the same idea, in Figure 1b, is the threshold to change the manufacturer’s strategy from take-back by himself to entrust the retailer under a take-back penalty.
The choice of a manufacturer’s strategy changes with the increase of the manufacturer’s recovery cost. As shown in Figure 1, in the case of the government not regulating, as the manufacturer’s recycling costs, , increase, the manufacturer’s strategy is changing. Figure 1b shows, in the same way, under the policy of the government regulation, with the increase of the manufacturer’s recycling costs, the strategy of the manufacturer from collecting by himself to entrusting the retailer, , as a turning point.
4.2. Regulator
For the government, whether to impose regulations or not is based on overall social welfare. The higher the social welfare in whichever case, the more the government will prioritize such a policy. From the analysis of manufacturers in Section 4.1, we can conclude that in and , regardless of whether the government imposes regulations or not, the manufacturer will choose to recycle the end-of-life products himself, which we call region . Similarly, in cases and , regardless of whether the government imposes regulations or not, the manufacturer will choose to entrust the recycling of the used product to the retailer, and the government considers the regulatory policy in this case while maximizing social welfare, which we refer to as the region . In addition to these two cases, there is another case, and , or and , which we will call the region . To facilitate analysis, we denote the social welfare in each case by , , , and , respectively.
4.2.1. Region A1
In this region, the manufacturer decides to collect the used product by himself. The choice of the regulator is to either impose regulations or not.
Example 2.
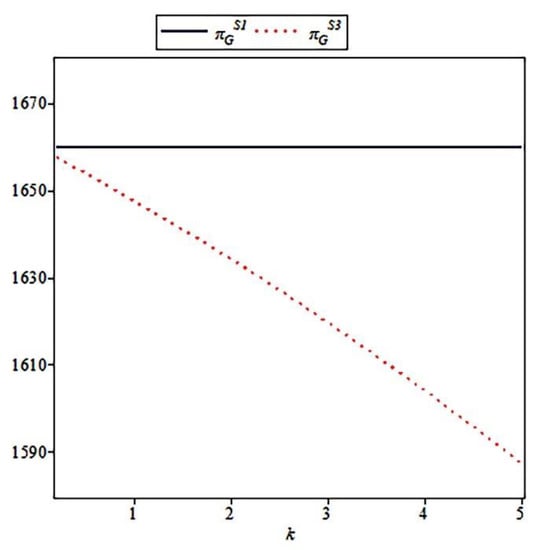
In this example, we will examine the impact of penalty intensity on government decisions. Consistent with the parameter values assumed in example 1, let’s further assume that. The relevant result is shown in Figure 2.
Figure 2.
The impact of penalty intensity on social welfare in the region .
Figure 2 shows that government policy of no regulation is optimal when the manufacturer decides to recycle the used products himself. In this scenario, social welfare under easing is greater than social welfare with regulation. According to Figure 2, the subgame perfect equilibrium results can be obtained for the government without supervision and recycling channels built by the manufacturer in the region . This equilibrium result is different from previous research. The existing research usually suggests that the government should implement an environmental regulation or even an aggressive environmental regulation. The main reason for the difference may be that this paper considers that the manufacturer has implemented product Eco-design, and there is only literature that mainly analyzes the influence of environmental regulations on product Eco-design.
4.2.2. Region A2
In the region , due to the structural complexity of equilibrium decisions in , and consequently the comparison of the optimal social welfare, we analyze by presenting numerical simulations. It is important to note that, after calculation, we conclude that the value is constantly greater than at . Therefore, the region includes only one case, which is and .
Example 3.
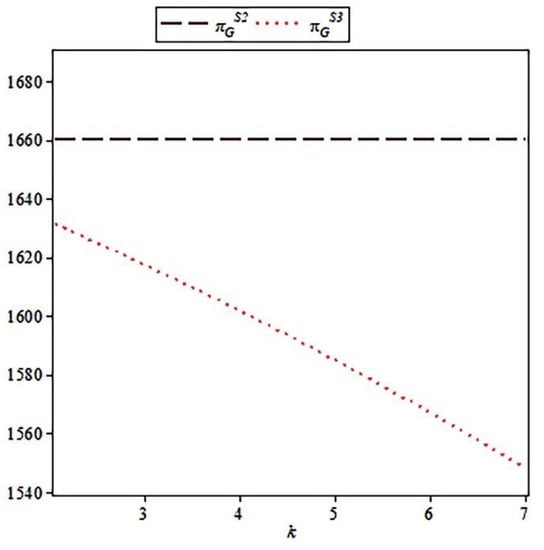
In this example, we will examine the impact of penalty intensity on government decisions. Consistent with the parameter values assumed in example 1, let’s further assume that. The relevant result is shown in Figure 3.
Figure 3.
The impact of penalty intensity on social welfare in the region .
Figure 3 shows that whether the government chooses environmental regulations does not depend on the intensity of the penalty and the manufacturer’s recycling disposal cost. Specifically, when the manufacturer’s disposal cost is relatively small, the government’s choice, as in the region , is not to impose environmental regulations. Similarly, when the manufacturer’s recycling costs are large, the government will also not impose environmental regulations, but then the manufacturer chooses to entrust the retailer with establishing a recycling channel. Thus, in the region , the equilibrium of the game is that the government does not apply environmental regulations and the manufacturer chooses to establish a recycling channel by entrusting the retailer.
4.2.3. Region A3
In this scenario, the manufacturer always decides on entrusting the retailer to collect the used products, not considering the take-back policy.
Example 4.
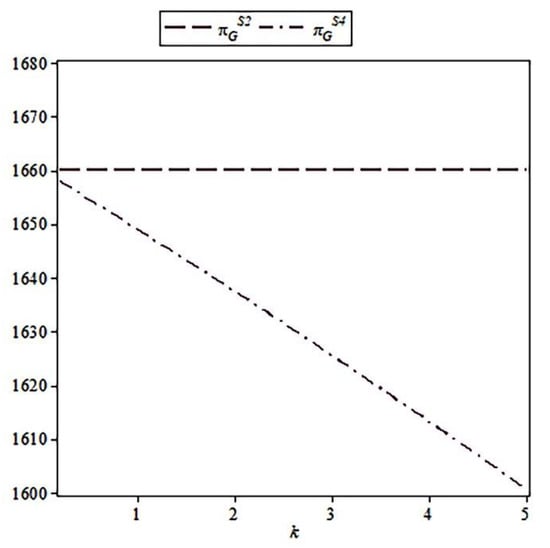
In this example, we will examine the impact of intensity on government decisions, consistent with the parameter values assumed in example 1. Unlike the previous ones, let’s further assume that. The relevant result is shown in Figure 4.
Figure 4.
The impact of penalty intensity on social welfare in the region .
In this region, no regulation is still the preferred strategy. For the government, imposing regulations reduces total social welfare. The reason for this may be the cost of implementing regulations. Therefore, the government chooses not to impose environmental regulations, while manufacturers choose to entrust retailers with the task of recycling waste products.
5. Conclusions
This paper considered a supply chain system consisting of a manufacturer and a retailer, while the government acts as a regulator to set a take-back regulation to influence the supply chain. Firstly, the government decides whether to implement a regulatory policy from the perspective of seeking to maximize social welfare. If the policy is implemented, it has to decide the optimal penalty level for manufacturers due to the not collected products. Secondly, the manufacturer, as a follower, applying Eco-design to reduce environmental pollution and disposal costs, has to respond to the take-back regulation by choosing recycling channels. The manufacturer decides whether to recycle the used products by himself or to entrust this task to the retailer in terms of maximum profit. We compared the equilibrium solutions by modeling the four following scenarios: {No Regulation, Manufacturer}, {No regulation, Retailer}, {Regulation, Manufacturer}, {Regulation, Retailer}. Next, we derived the government’s take-back regulation and optimal penalty level by comparing social welfare and the manufacturer’s response decision in response to regulation.
We obtained some new findings that are different from earlier studies. We found that take-back regulation strongly influences the manufacturer’s product Eco-design strategy. However, the take-back regulation has little influence on recycling channel selection. Specifically, whether for the manufacturer or the government, the take-back regulation will lead to lose-lose results when the manufacturer carries out Eco-design of the product. However, which recycling channel the manufacturer adopts mainly depends on the cost of the corresponding channel, and is not significantly affected by recycling regulations. Our results show that the government should change its take-back regulation if the manufacturer takes the initiative in product Eco-design and product recycling. In other words, for some manufacturers who do not adopt product Eco-design and product recycling, the government should implement take-back regulation. Otherwise, for other manufacturers who do adopt product Eco-design and product recycling, the government should not use a single take-back regulation, and should use a combination of regulations, such as adding tax subsidies or financial subsidies. Thus, our findings add to the previous literature while providing practical recommendations of take-back regulation and corporate governance.
Our analysis might also have some limitations. This paper assumed that all information is known to both the government and the manufacturer. However, information could be asymmetric. Therefore, further research may need to be extended to the information asymmetry case. In addition, it is necessary to consider other government regulations in the product Eco-design, such as tax subsidies and carbon trading.
Author Contributions
S.X. raised the research question and wrote the manuscript; H.L. performed some theoretical derivations and numerical analyses; G.X. supervised the whole research work. All authors have read and agreed to the published version of the manuscript.
Funding
This work is supported by the Nanjing University of Posts and Telecommunications research Fund project for Introducing Talents (high-level teachers) (No. NYY219002). This work is also supported by the National Social Science Foundation of China (No. RZ1900001103).
Institutional Review Board Statement
The study was conducted according to the guidelines of the Declara-tion of Helsinki, and following the academic ethics.
Informed Consent Statement
Informed consent was obtained from all subjects involved in the study.
Data Availability Statement
Not applicable.
Acknowledgments
The authors especially thank the editors and anonymous referees for their kind reviews and helpful comments.
Conflicts of Interest
The authors declare no conflict of interest.
Appendix A
Proof of Proposition 1.
It is easy to determine that (2) is a concave function of . The response function of the retail price is given by . The Hesse matrix of the subjective function (1) can be obtained by substitution:
The leading principal components are , , and , which are negative, positive, and negative, respectively. Therefore, the objective function (1) is concave in , , and . Applying the first-order conditions results in the equilibrium strategies presented in the proposition.□
Proof of Proposition 2.
It is easy to determine that (8) is a concave function of and . The response functions of the retail price and the price of the used products are given by and . The Hesse matrix of the subjective function (7) can be obtained by substitution:
The leading principal components are , , and , which are negative, positive, and negative, respectively. Therefore, the objective function (7) is concave in , , and . Applying the first-order conditions results in the equilibrium strategies presented in the proposition.□
Proof of Proposition 3.
It is easy to determine that (15) is a concave function of . The response function of the retail price is given by . The Hesse matrix of the subjective function (14) can be obtained by substitution:
The leading principal components are , , and , which are negative, positive, and negative, respectively. Therefore, the objective function (14) is concave in , , and . Applying the first-order conditions results in the equilibrium strategies presented in the proposition.□
Proof of Proposition 4.
It is easy to determine that (20) is a concave function of . The response functions of the retail price and the price of the used products are given by and . The Hesse matrix of the subjective function (21) can be obtained by substitution:
The leading principal components are , , and , which are negative, positive, and negative, respectively. Therefore, the objective function (20) is concave in , , and . Applying the first-order conditions results in the equilibrium strategies presented in the proposition.□
Proof of Proposition 5.
Substituting (4)–(6) in (1), and (10)–(12) in (7), we obtain (27).□
References
- Lindhqvist, T. Extended Producer Responsibility in Cleaner Production: Policy Principle to Promote Environmental Improvements of Product Systems; Lund University: Lund, Sweden, 2000. [Google Scholar]
- Stavins, R.N. A meaningful US cap-and-trade system to address climate change. Harv. Environ. Law Rev. 2008, 32, 293. [Google Scholar]
- Murray, B.C.; Newell, R.G.; Pizer, W.A. Balancing Cost and Emissions Certainty: An Allowance Reserve for Cap-and-Trade. Rev. Environ. Econ. Policy 2009, 3, 84–103. [Google Scholar] [CrossRef] [Green Version]
- Choi, T.-M. Optimal apparel supplier selection with forecast updates under carbon emission taxation scheme. Comput. Oper. Res. 2013, 40, 2646–2655. [Google Scholar] [CrossRef]
- Yang, H.; Chen, W. Retailer-driven carbon emission abatement with consumer environmental awareness and carbon tax: Revenue-sharing versus Cost-sharing. Omega 2018, 78, 179–191. [Google Scholar] [CrossRef]
- Wang, M.; Liu, K.; Choi, T.-M.; Yue, X. Effects of Carbon Emission Taxes on Transportation Mode Selections and Social Welfare. IEEE Trans. Syst. Man Cybern. Syst. 2015, 45, 1413–1423. [Google Scholar] [CrossRef]
- Bansal., S.; Gangopadhyay, S. Tax/subsidy policies in the presence of environmentally aware consumers. J. Environ. Econ. Manag. 2003, 45, 333–355. [Google Scholar] [CrossRef]
- Galinato, G.I.; Yoder, J.K. An integrated tax-subsidy policy for carbon emission reduction. Resour. Energy Econ. 2010, 32, 310–326. [Google Scholar] [CrossRef]
- Chang, X.; Wu, J.; Li, T.; Fan, T.-J. The joint tax-subsidy mechanism incorporating extended producer responsibility in a manufacturing-recycling system. J. Clean. Prod. 2019, 210, 821–836. [Google Scholar] [CrossRef]
- Wang, W.; Zhang, Y.; Zhang, K.; Bai, T.; Shang, J. Reward–penalty mechanism for closed-loop supply chains under responsibility-sharing and different power structures. Int. J. Prod. Econ. 2015, 170, 178–190. [Google Scholar] [CrossRef]
- Chen, C.-K.; Akmalul’Ulya, M. Analyses of the reward-penalty mechanism in green closed-loop supply chains with product remanufacturing. Int. J. Prod. Econ. 2019, 210, 211–223. [Google Scholar] [CrossRef]
- Wang, Z.; Wang, Q.; Chen, B.; Wang, Y. Evolutionary game analysis on behavioral strategies of multiple stakeholders in E-waste recycling industry. Resour. Conserv. Recycl. 2020, 155, 104618. [Google Scholar] [CrossRef]
- Wang, Y.; Yu, Z.; Shen, L.; Dong, W. Impacts of altruistic preference and reward-penalty mechanism on decisions of E-commerce closed-loop supply chain. J. Clean. Prod. 2021, 315, 128132. [Google Scholar] [CrossRef]
- Heese, H.S.; Cattani, K.; Ferrer, G.; Gilland, W.; Roth, A.V. Competitive advantage through take-back of used products. Eur. J. Oper. Res. 2005, 164, 143–157. [Google Scholar] [CrossRef]
- Esenduran, G.; Kemahlıoğlu-Ziya, E.; Swaminathan, J.M. Take-Back Legislation: Consequences for Remanufacturing and Environment. Decis. Sci. 2016, 47, 219–256. [Google Scholar] [CrossRef]
- Pazoki, M.; Samarghandi, H. Take-back regulation: Remanufacturing or Eco-design? Int. J. Prod. Econ. 2020, 227, 107674. [Google Scholar] [CrossRef]
- Pazoki, M.; Zaccour, G. A mechanism to promote product recovery and environmental performance. Eur. J. Oper. Res. 2018, 274, 601–614. [Google Scholar] [CrossRef]
- Wu, C.-H. Price and service competition between new and remanufactured products in a two-echelon supply chain. Int. J. Prod. Econ. 2012, 140, 496–507. [Google Scholar] [CrossRef]
- Kim, K.; Song, I.; Kim, J.; Jeong, B. Supply planning model for remanufacturing system in reverse logistics environment. Comput. Ind. Eng. 2006, 51, 279–287. [Google Scholar] [CrossRef]
- Chuang, C.-H.; Wang, C.X.; Zhao, Y. Closed-loop supply chain models for a high-tech product under alternative reverse channel and collection cost structures. Int. J. Prod. Econ. 2014, 156, 108–123. [Google Scholar] [CrossRef]
- Liu, L.; Wang, Z.; Xu, L.; Hong, X.; Govindan, K. Collection effort and reverse channel choices in a closed-loop supply chain. J. Clean. Prod. 2017, 144, 492–500. [Google Scholar] [CrossRef]
- Hauschild, M.Z.; Jeswiet, J.; Alting, L. From Life Cycle Assessment to Sustainable Production: Status and Perspectives. CIRP Ann. 2005, 54, 1–21. [Google Scholar] [CrossRef]
- Tyl, B.; Legardeur, J.; Millet, D.; Falchi, A.; Ranvier, B. A New Approach for the Development of a Creative Method to Stimulate Responsible Innovation. Glob. Prod. Dev. 2011, 93–104. [Google Scholar] [CrossRef]
- Raz, G.; Druehl, C.T.; Blass, V. Design for the Environment: Life-Cycle Approach Using a Newsvendor Model. Prod. Oper. Manag. 2013, 22, 940–957. [Google Scholar] [CrossRef]
- Karlsson, R.; Luttropp, C. EcoDesign: What’s happening? An overview of the subject area of EcoDesign and of the papers in this special issue. J. Clean. Prod. 2006, 14, 1291–1298. [Google Scholar]
- Savaskan, R.C.; Bhattacharya, S.; Van Wassenhove, L.N. Closed-Loop Supply Chain Models with Product Remanufacturing. Manag. Sci. 2004, 50, 239–252. [Google Scholar] [CrossRef] [Green Version]
- Choi, T.-M.; Li, Y.; Xu, L. Channel leadership, performance and coordination in closed loop supply chains. Int. J. Prod. Econ. 2013, 146, 371–380. [Google Scholar] [CrossRef]
- Panda, S.; Modak, N.; Cárdenas-Barrón, L.E. Coordinating a socially responsible closed-loop supply chain with product recycling. Int. J. Prod. Econ. 2017, 188, 11–21. [Google Scholar] [CrossRef]
- Ranjbar, Y.; Sahebi, H.; Ashayeri, J.; Teymouri, A. A competitive dual recycling channel in a three-level closed loop supply chain under different power structures: Pricing and collecting decisions. J. Clean. Prod. 2020, 272, 122623. [Google Scholar] [CrossRef]
- Jafari, H.; Hejazi, S.R.; Rasti-Barzoki, M. Sustainable development by waste recycling under a three-echelon supply chain: A game-theoretic approach. J. Clean. Prod. 2017, 142, 2252–2261. [Google Scholar] [CrossRef]
- Wu, X.; Zhou, Y. The optimal reverse channel choice under supply chain competition. Eur. J. Oper. Res. 2017, 259, 63–66. [Google Scholar] [CrossRef]
- Han, X.; Wu, H.; Yang, Q.; Shang, J. Reverse channel selection under remanufacturing risks: Balancing profitability and robustness. Int. J. Prod. Econ. 2016, 182, 63–72. [Google Scholar] [CrossRef]
- Huang, M.; Song, M.; Lee, L.H.; Ching, W.K. Analysis for strategy of closed-loop supply chain with dual recycling channel. Int. J. Prod. Econ. 2013, 144, 510–520. [Google Scholar] [CrossRef]
- Feng, L.; Govindan, K.; Li, C. Strategic planning: Design and coordination for dual-recycling channel reverse supply chain considering consumer behavior. Eur. J. Oper. Res. 2017, 260, 601–612. [Google Scholar] [CrossRef]
- Taleizadeh, A.A.; Sadeghi, R. Pricing strategies in the competitive reverse supply chains with traditional and e-channels: A game theoretic approach. Int. J. Prod. Econ. 2019, 215, 48–60. [Google Scholar] [CrossRef]
- Meadows, D.H.; Meadows, D.L.; Randers, J. Los Límites Del Crecimiento: Informe Al Club De Roma Sobre El Predicamento De La Humanidad. 1972. Available online: http://habitat.aq.upm.es/gi/mve/daee/tmzapiain.pdf?origin=publicat (accessed on 9 August 2021).
- Sabaghi, M.; Mascle, C.; Baptiste, P. Evaluation of products at design phase for an efficient disassembly at end-of-life. J. Clean. Prod. 2016, 116, 177–186. [Google Scholar] [CrossRef]
- Cicconi, P. Eco-design and Eco-materials: An interactive and collaborative approach. Sustain. Mater. Technol. 2019, 23, e00135. [Google Scholar] [CrossRef]
- Khor, K.S.; Ramayah, T.; Fouladgaran, H.R.P. Managing eco-design for reverse logistics. Int. J. Environ. Waste Manag. 2020, 26, 125–146. [Google Scholar] [CrossRef]
- Du, B.; Liu, Q.; Li, G. Coordinating Leader-Follower Supply Chain with Sustainable Green Technology Innovation on Their Fairness Concerns. Int. J. Environ. Res. Public Heal. 2017, 14, 1357. [Google Scholar] [CrossRef] [Green Version]
- Shen, B.; Li, Q. Green Technology Adoption in Textile Supply Chains with Environmental Taxes: Production, Pricing, and Competition. IFAC-PapersOnLine 2019, 52, 379–384. [Google Scholar] [CrossRef]
- Pazoki, M.; Zaccour, G. A Mechanism to Promote Product Recovery and Remanufacturing; GERAD, École Des Hautes Études Commerciales: Montréal, QC, Canada, 2017. [Google Scholar]
- Fargnoli, M.; Costantino, F.; Tronci, M.; Bisillo, S. Ecological profile of industrial products over the environmental compliance. Int. J. Sustain. Eng. 2013, 6, 117–130. [Google Scholar] [CrossRef]
- Cao, J.; Zhang, X.; Hu, L.; Xu, J.; Zhao, Y.; Zhou, G.; Schnoor, J.L. EPR regulation and reverse supply chain strategy on remanufacturing. Comput. Ind. Eng. 2018, 125, 279–297. [Google Scholar] [CrossRef]
- Peng, B.; Tu, Y.; Elahi, E.; Wei, G. Extended Producer Responsibility and corporate performance: Effects of environmental regulation and environmental strategy. J. Environ. Manag. 2018, 218, 181–189. [Google Scholar] [CrossRef] [PubMed]
- Gu, Y.; Wu, Y.; Xu, M.; Wang, H.; Zuo, T. To realize better extended producer responsibility: Redesign of WEEE fund mode in China. J. Clean. Prod. 2017, 164, 347–356. [Google Scholar] [CrossRef]
- Kushwaha, S.; Ghosh, A.; Rao, A. Collection activity channels selection in a reverse supply chain under a carbon cap-and-trade regulation. J. Clean. Prod. 2020, 260, 121034. [Google Scholar] [CrossRef]
- Xu, X.; He, P.; Xu, H.; Zhang, Q. Supply chain coordination with green technology under cap-and-trade regulation. Int. J. Prod. Econ. 2017, 183, 433–442. [Google Scholar] [CrossRef]
- Zhao, L.; Chen, Y. Optimal Subsidies for Green Products: A Maximal Policy Benefit Perspective. Symmetry 2019, 11, 63. [Google Scholar] [CrossRef] [Green Version]
- Zhou, W.; Zheng, Y.; Huang, W. Competitive advantage of qualified WEEE recyclers through EPR legislation. Eur. J. Oper. Res. 2017, 257, 641–655. [Google Scholar] [CrossRef]
- Liu, Z.; Li, K.W.; Tang, J.; Gong, B.-G.; Huang, J. Optimal operations of a closed-loop supply chain under a dual regulation. Int. J. Prod. Econ. 2021, 233, 107991. [Google Scholar] [CrossRef]
- Liu, J.; Nie, J.; Yuan, H. Interactive decisions of the waste producer and the recycler in construction waste recycling. J. Clean. Prod. 2020, 256, 120403. [Google Scholar] [CrossRef]
- Lund, R.; Hauser, W. Remanufacturing—An American perspective. In Proceedings of the 5th International Conference on Responsive Manufacturing—Green Manufacturing (ICRM 2010), Ningbo, China, 11–13 January 2010; pp. 1–6. [Google Scholar] [CrossRef]
- Zu, Y.; Chen, L.; Fan, Y. Research on low-carbon strategies in supply chain with environmental regulations based on differential game. J. Clean. Prod. 2018, 177, 527–546. [Google Scholar] [CrossRef]
Publisher’s Note: MDPI stays neutral with regard to jurisdictional claims in published maps and institutional affiliations. |
© 2021 by the authors. Licensee MDPI, Basel, Switzerland. This article is an open access article distributed under the terms and conditions of the Creative Commons Attribution (CC BY) license (https://creativecommons.org/licenses/by/4.0/).