Article

Vegetation Changes in Response to Climatic Factors and Human Activities in Jilin Province, China, 2000–2019

1
College of Earth Sciences, Jilin University, Changchun 130061, China
2
Faculty of Built Environment, University of Malaya, Kuala Lumpur 50603, Malaysia
3
Key Laboratory of Mineral Resources Evaluation in Northeast Asia, Ministry of Land and Resources, Changchun 130061, China
*
Author to whom correspondence should be addressed.
Sustainability 2021, 13(16), 8956; https://doi.org/10.3390/su13168956
Submission received: 22 July 2021 / Revised: 6 August 2021 / Accepted: 8 August 2021 / Published: 10 August 2021

Abstract

:
Dynamic change in vegetation is an integral component of terrestrial ecosystems, which has become a significant research area in the current context of global climate warming. Jilin Province in northeast China is an ecologically fragile area, and there is an urgent need to understand its vegetation changes and responses to both climatic factors and human activities. The normalized difference vegetation index (NDVI) was used to analyze trends in vegetation growth, and indicated significant growth overall. The NDVI of different vegetation cover types is increasing, indicating that the vegetation is continuously greening, and in descending order, the growth trends were grassland (0.0035/year) > permanent wetland (0.0028/year) > cropland (0.0027/year) > forest land (0.0022/year) > barren land (−0.0001/year). Grassland and cropland vegetation types included the most severely degraded areas, with fluctuating NDVI values. Precipitation was the main positive controlling climatic factor of NDVI in the western regions of the study area, while average temperature was the main factor in the eastern regions. Precipitation was the main climatic control factor for grassland and cropland, while forest land was limited by precipitation and average temperature. Barren land and permanent wetland were slightly negatively correlated with precipitation. From 2000 to 2019, the residual values for NDVI increased from −0.0121 to 0.0116, and the impact of human activities on vegetation changed from negative to positive. By 2019, the proportion of positively affected zones was as high as 94.01%, and the negatively affected zones were mainly distributed across transitional areas of cropland and grassland, and urban and built-up land and forest land.

1. Introduction

As an integral component of terrestrial ecosystems, vegetation is a natural link between the soil, atmosphere, moisture, and other elements [1,2]. Dynamic changes in vegetation comprise an important research topic in the context of current global climate warming [3]. During the past half century, global climate change and human disturbances have become the main drivers of ecosystem change, and have had a huge impact on vegetation ecosystems [4,5,6]. Therefore, understanding vegetation changes and their internal relationships with climatic factors and human activities can help us to predict the evolution of ecosystems under conditions of future climate change, and provide a basis for ecological sustainability, ecosystem protection, and management planning [7,8,9].
Undoubtedly, vegetation changes are affected by multiple factors, and the vegetation response to climate change is spatially heterogeneous [10]. As attested by many studies, detailed research on vegetation change is needed at a regional level [11]. In China, temperature has a greater influence than precipitation on the normalized difference vegetation index (NDVI) in the southern region of Gansu, the northwest region of Sichuan [12], the Yangtze River basin [13], and northern China [14], while precipitation is the main factor influencing NDVI values in the Taibai Mountain area [15].The vegetation types in the Shaanxi segment of the Qinling Mountains and on the northern slopes of the Tianshan Mountain clearly respond to moisture change in the middle phase of the growing season, as they are more sensitive to moisture change than vegetation types growing on the southern slopes [16,17]. In addition to climatic factors, human activities also play significant roles in vegetation change, as evident by the increase in vegetation types on the upper and middle reaches of the Yangtze River, which are benefiting from the restoration of forest land from farmland and other socioeconomic activities [18]. In Sichuan, studies have shown that both soil type and elevation accounted for more than 30% of the influencing factors of the NDVI [19]. Along the Qinghai-Tibet Railway, the vegetation is affected significantly by engineering activities [20].
In order to study vegetation changes effectively, NDVI data are invaluable. The NDVI is an index that represents surface vegetation cover and growth status [21], by using a normalized ratio of near-infrared (NIR) and red-light band widths, and has been widely applied in studies of large-scale dynamic vegetation changes over longer time periods [22]. NDVI values range from −1 to +1 after normalization, where negative values correspond to an absence of vegetation [23]. The relationship between the NDVI and vegetation productivity has been well established, and the link between this index and the fraction of absorbed photosynthetic active radiation intercepted (FAPAR) has been well documented [23,24]. When the NDVI trend values are less than zero, it means that the vegetation is degraded, otherwise, it means vegetation greening. The NDVI is successful as a vegetation measure because it is sufficiently reliable to permit meaningful comparisons of seasonal and interannual changes in vegetation growth and activity [25]. NDVI data are commonly obtained from AVHRR GIMMS, SPOT-VGT, and MODIS sensors [26]. Compared with SPOT-VGT and MODIS NDVI data, GIMMS data are less sensitive to changes in vegetation types with a high degree of cover [27], and overall MODIS NDVI data are the most suitable for studying vegetation change by virtue of having a higher spatial resolution and a broader dynamic range.
On the basis of satellite data, many methods have been used to research vegetation change via NDVI. Tian et al. analyzed the correlations among climatic factors (temperature and precipitation) and the NDVI in the Three Gorges Reservoir Region, China, and the surrounding area, by using a partial correlation coefficient method [4]. Piao et al. also used a partial correlation coefficient method to reveal evidence of a weakening relationship between interannual temperature variability and northern vegetation activity [28]. Chu et al. used a residual trend analysis to show that human activities can lead to vegetation degradation in the farming region of the Amur-Heilongjiang River Basin, China [29]. Using a modified Mann–Kendall method, Zhao et al. found a significantly increasing trend in the seasonal NDVI for vegetation in the Jing River and Beiluo River Basins in China [30]. Barbosa et al. used a coefficient of variation method to find strong seasonal oscillations during the growing season (February–May) for vegetation in the northeast region of Brazil, with seasonal variations ranging from 14% to 32% [31].
Vegetation change studies usually focus on a single vegetation type, such as grassland [32,33], or on the overall vegetation change [34], and the impact of climatic factors such as precipitation and temperature. There is a lack of comparative analyses of changes in different vegetation types within the same region, and of the impact of both climatic and human influences. Research on vegetation change and its driving factors are also scarce for the ecologically sensitive region of northeast China. Therefore, we used Sen + Mann–Kendall, coefficient of variation (CV), partial correlation, and residual analyses to carry out an in-depth study of vegetation change in Jilin Province. The time period studied was from 2000 to 2019, and the vegetation response to temperature, precipitation, and human activities was examined, in order to provide a basis for future ecosystem management and protection, and sustainable development of the area.

2. Materials and Methods

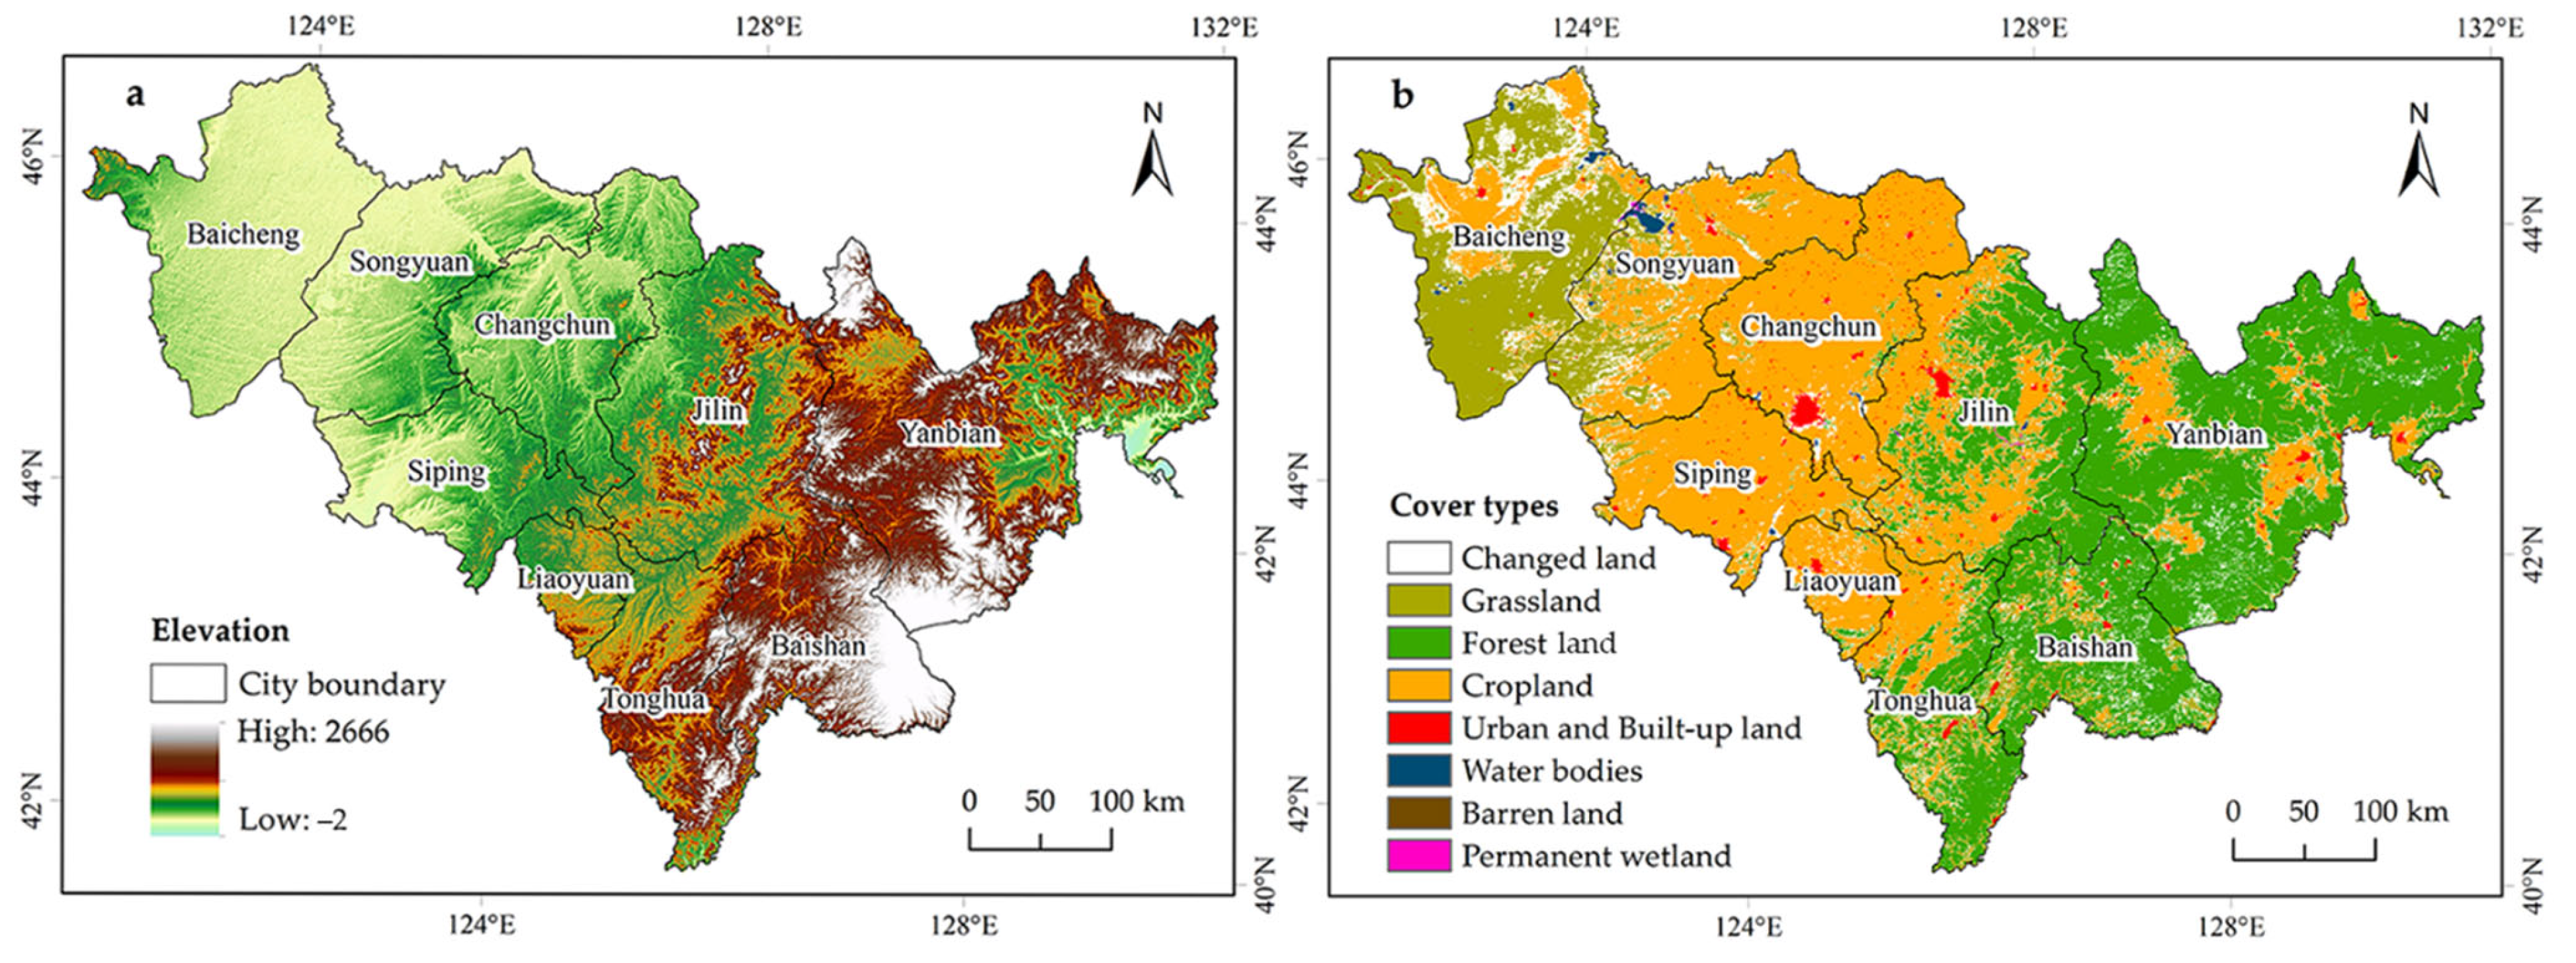
2.1. Description of the Study Area

Located in the hinterland of northeast China (40°50′–46°19′ N and 121°38′–131°19′ E), Jilin Province covers the geographic geometric center of northeast Asia, encompassing a total area of about 187,400 km2. The province has jurisdiction over 60 counties (cities and districts), including Changchun City, Jilin City, and Siping City. The area has higher altitudes in the southeastern regions and lower altitudes in the northwestern regions, with an average altitude range of 300–500 m (Figure 1a). The area is characterized by a temperate monsoon climate, with an annual average temperature range from 2 to 6 °C, and an annual precipitation range from 400 to 600 mm, of which 80% is concentrated in the summer, and rainfall is most plentiful in the east. It is rich in natural resources and characterized by diverse land cover types, including cropland, forest land, grassland and permanent wetland areas of 70,300 km2 (37%), 82,200 km2 (44.2%), 6900 km2 (3.7%), and 17,280 km2 (9.2%), respectively.

2.2. Data Sources

The NDVI data were obtained from the MOD13Q1 product developed by the National Aeronautics and Space Administration (NASA) of America, using the time series of April 2000–October 2019, at a time resolution of 16 days and spatial resolution of 250 m. The monthly data values were obtained using the maximum value composite (MVC) method, after projection transformation (WGS 1984 Albers), splicing, and clipping using MODIS Reprojection Tools (MRT) and ArcGIS 10.5. Digital elevation model (DEM) data derived from the Shuttle Radar Topography Mission (SRTM) and data from the American Endeavour space shuttle (resolution ratio 90 m) were also used, and the WGS84 elliptical projection was adopted. The MCD12Q1 product developed by NASA was used to provide land cover data, at a spatial resolution and time resolution of 500 m and 1 year, respectively.
A dataset of monthly values for ground climatological data was provided by The China Meteorological Data Service Center (http://data.cma.cn/) (accessed on 25 December 2020). The annual average temperature and precipitation data for the growing season were derived by data processing. Taking elevation as a covariable, the meteorological interpolation software Anusplin (which applies a thin plate smoothing spline method) was used to interpolate the data at a spatial resolution of 250 m. The land cover type output for the study area was clipped to obtain the annual meteorological data for the overall area during the growing seasons.
Using the MODIS NDVI time series data in combination with DEM, average temperature and precipitation data for the growing seasons (April–October) in Jilin Province for the period 2000–2019, spatial-temporal changes in NDVI, and the factors driving those changes, were analyzed using Sen + Mann–Kendall, coefficient of variation (CV), partial correlation, and residual error tests.

2.3. Methods

2.3.1. Trend Analysis Based on the Sen + Mann–Kendall Test

The formula for the Sen trend is:
β = mean x j x i j i ,   2000 i < j 2019
where x j and x i are serial data, β > 0   represents a rising trend, and β < 0 denotes a declining trend.
The Mann–Kendall test, a nonparametric statistical test, has frequently been used to quantify the significance of trends in hydro-meteorological time series data [34,35,36], and the formula is [37]:
S = i = 1 n 1 j = i + 1 n s i g n ( x j x i )
V a r s = n n 1 2 n + 5 18
sign θ = 1   ( θ > 0 ) 0   θ = 0 1   ( θ < 0 )
where S is the test statistic ( Z is the test statistic after standardization), x j and x i are both serial data, and n is the number of samples. When n 8 , S presents an approximately normal distribution, and its variance is calculated with the following formula:
Z =   S 1 V a r s   ( S > 0 )   0   S = 0 S + 1   V a r s   ( S < 0 )
The standardized Z follows a standard normal distribution. If Z > Z 1 a / 2 , a significant change in trend exists. Z 1 a / 2 represents the value from a distribution table for standard normal function with a confidence level of α.

2.3.2. Coefficient of Variation (CV)

The CV were used as a measure of NDVI variability [38,39]. If the CV value is smaller than 0.15, then the NDVI values have only fluctuated slightly. When the CV value is greater than 0.15 [40], the NDVI values have fluctuated greatly. The formula is:
Cv = 1 N D V I ¯ 1 n 1 i = 1 n N D V I i N D V I ¯ 2
where N D V I i . is the NDVI value for the year i and N D V I ¯ is the average value of the NDVI for April–October from 2000–2019.

2.3.3. Partial Correlation Analysis

A partial correlation analysis was used to explore the link between the NDVI and a single climatic factor while eliminating the effects of the remaining climatic factors [41]. The formula is:
r x y , z = r x y r x z r y z 1 r x z 2 1 r y z 2
where r x y , r x z , and r y z represent the linear correlation coefficient between x and y , between x and z , and between y and z , respectively; r x y , z is the partial correlation coefficient between x and y after the variable z is fixed. Then, a t-test was carried out for partial correlation coefficients, using the formula:
t = r x y , z 1 r x y , z 2 n m 1
where r x y , z is the partial correlation coefficient between x and y after the variable z is fixed, n is the number of samples, and m is the number of independent variables.

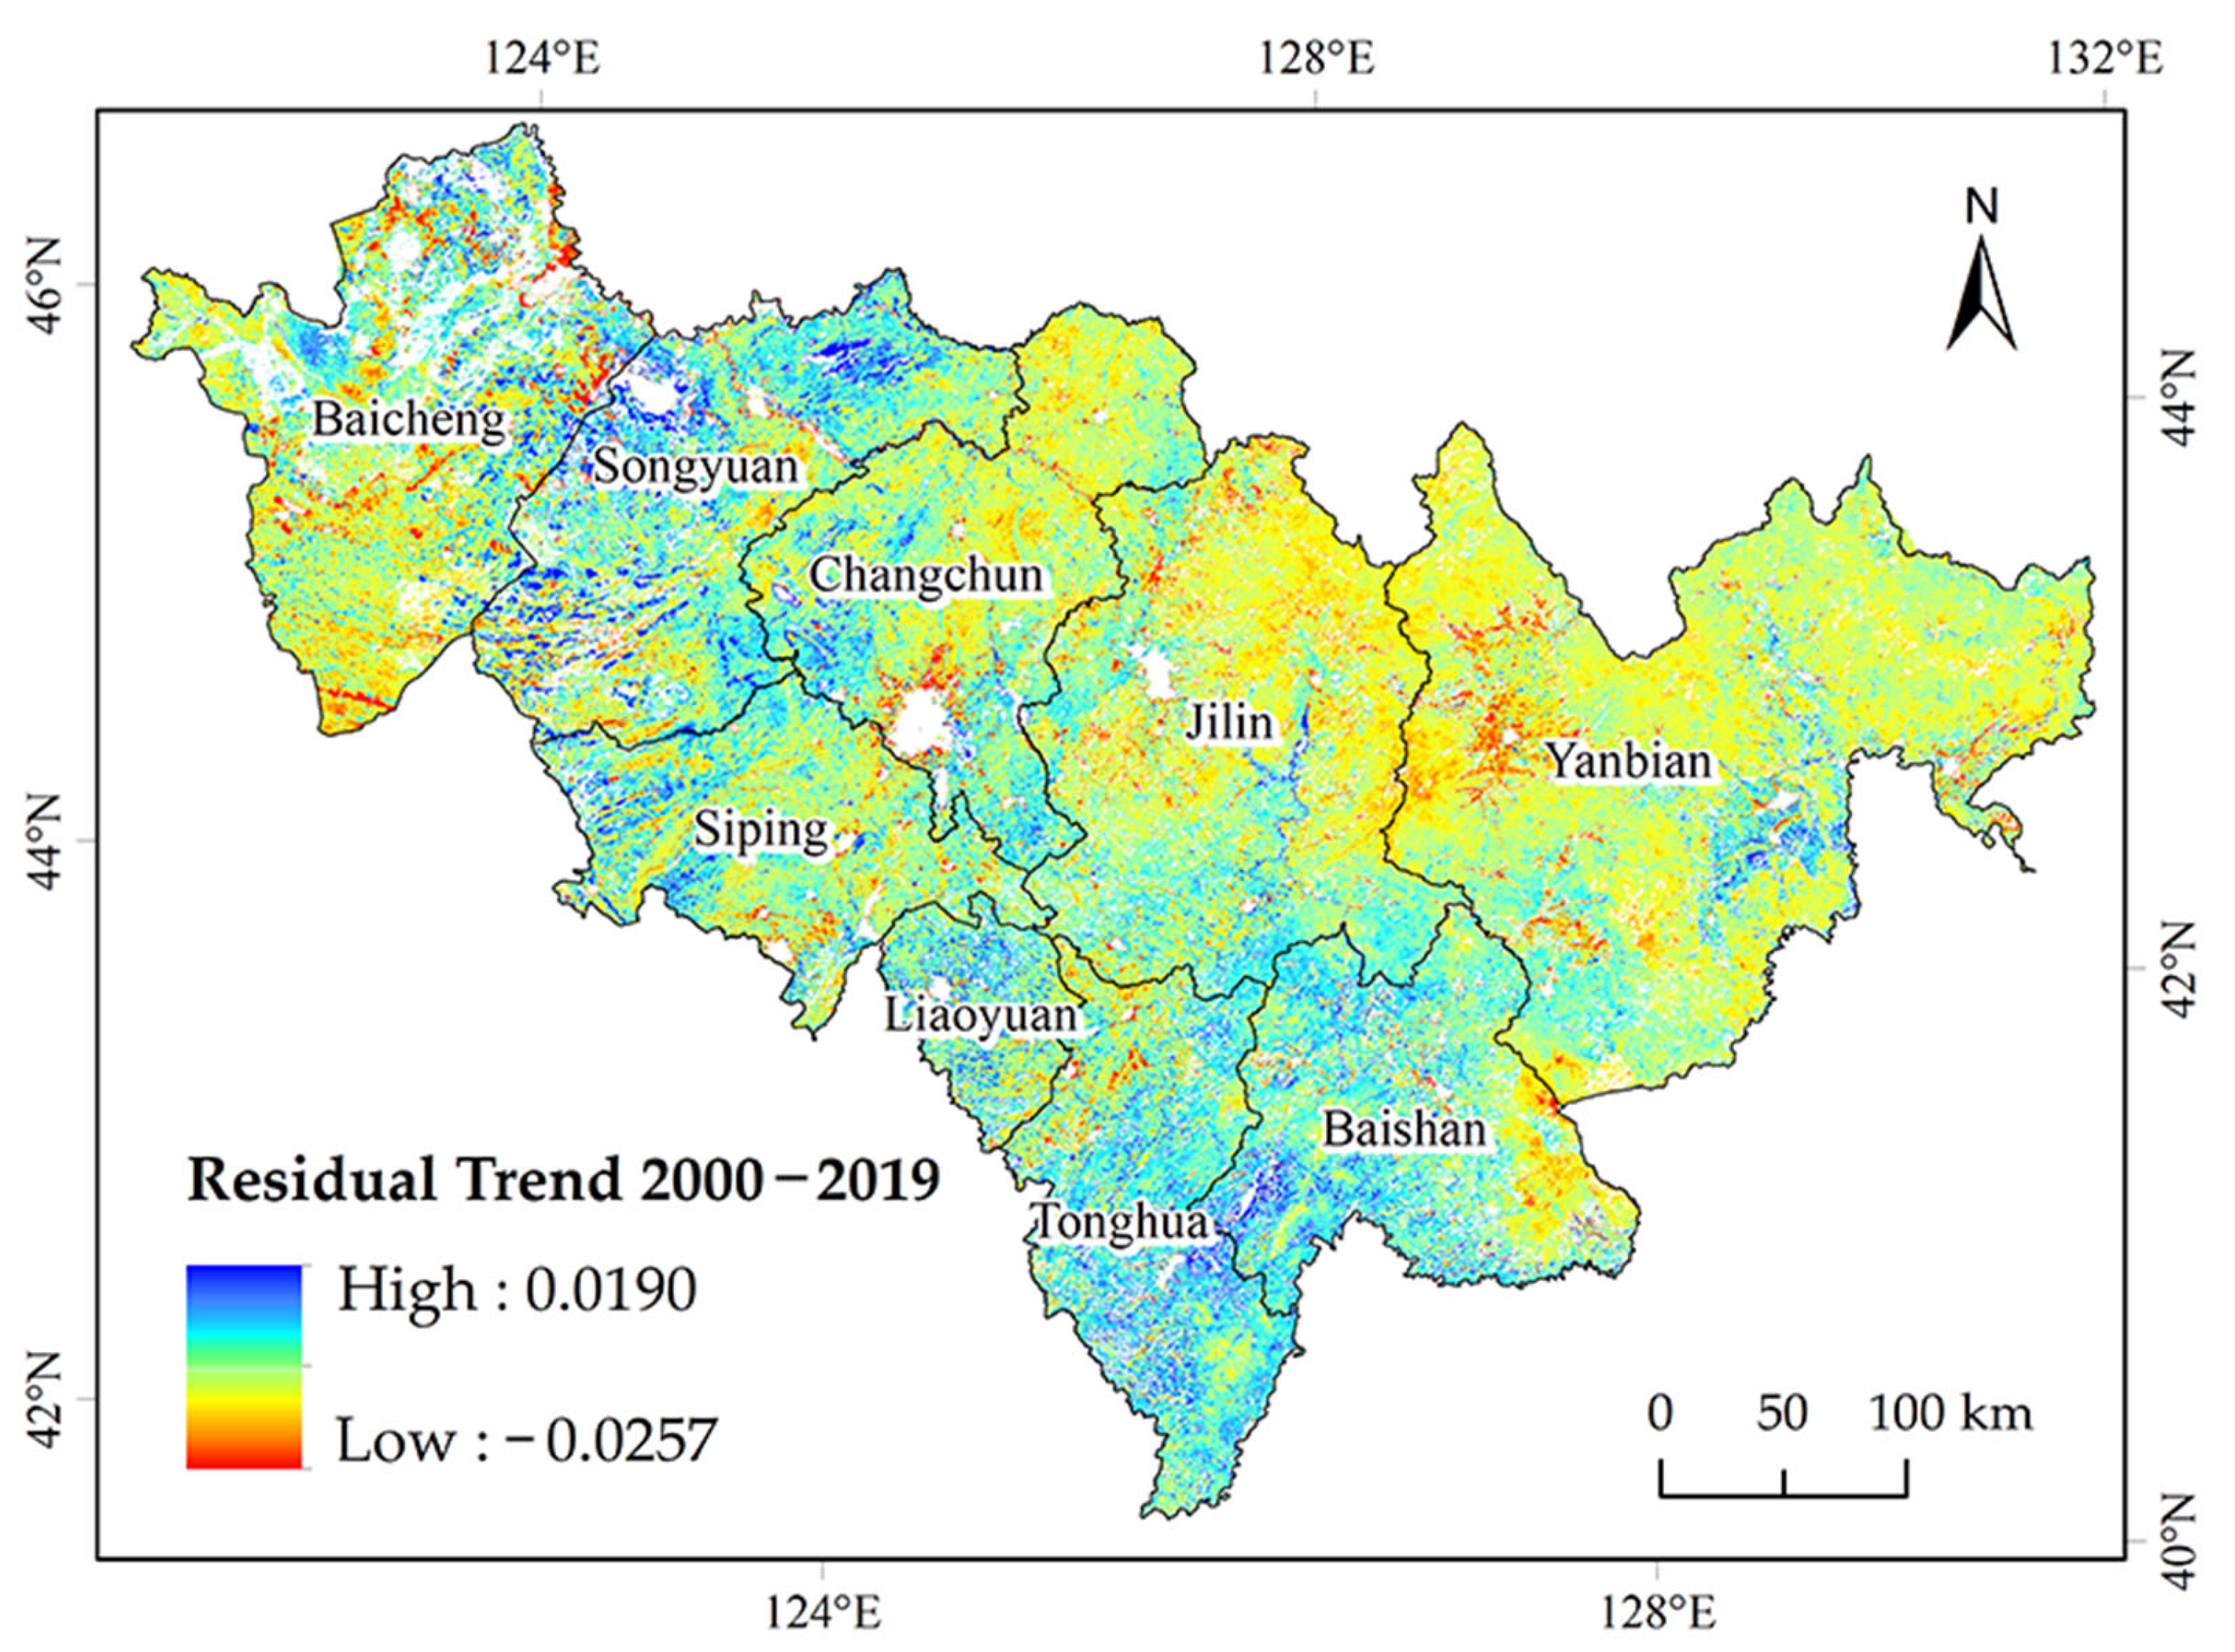
2.3.4. Residual Analysis

A residual analysis approach was used to separate changes in the NDVI caused by human activities from those resulting from climatic variations [4,5,42]. As described by Herrmann and Wessels [43,44], the NDVI residuals were calculated for each pixel. The best relationship between the mean NDVI and climatic factors was acquired by using a multiple correlation regression analysis. The predicted NDVI could, then, be computed using this relationship. The NDVI residuals were determined from the differences between the predicted and the observed NDVI values. The residuals were also analyzed to detect trends over time. When changes in the NDVI residuals were insignificant, they could be explained by climatic trends. In contrast, when changes in the NDVI residuals were significant, they could not be explained by climatic trends and may have been caused by human activities, based on the following formula:
ε i = N D V I α i N D V I β i
where ε i is the residual error of the NDVI in the year i , N D V I α i is the true NDVI value for the year i , and N D V I β i is the predicted NDVI value for the year i . When ε i > 0 , human activities have exerted a positive influence on the NDVI values, and when ε i < 0 , the NDVI has been negatively influenced by human activities. When ε i = 0 , human activities have had no bearing on the NDVI values.

3. Results

3.1. Temporal and Spatial Variation in the NDVI during the Growing Seasons

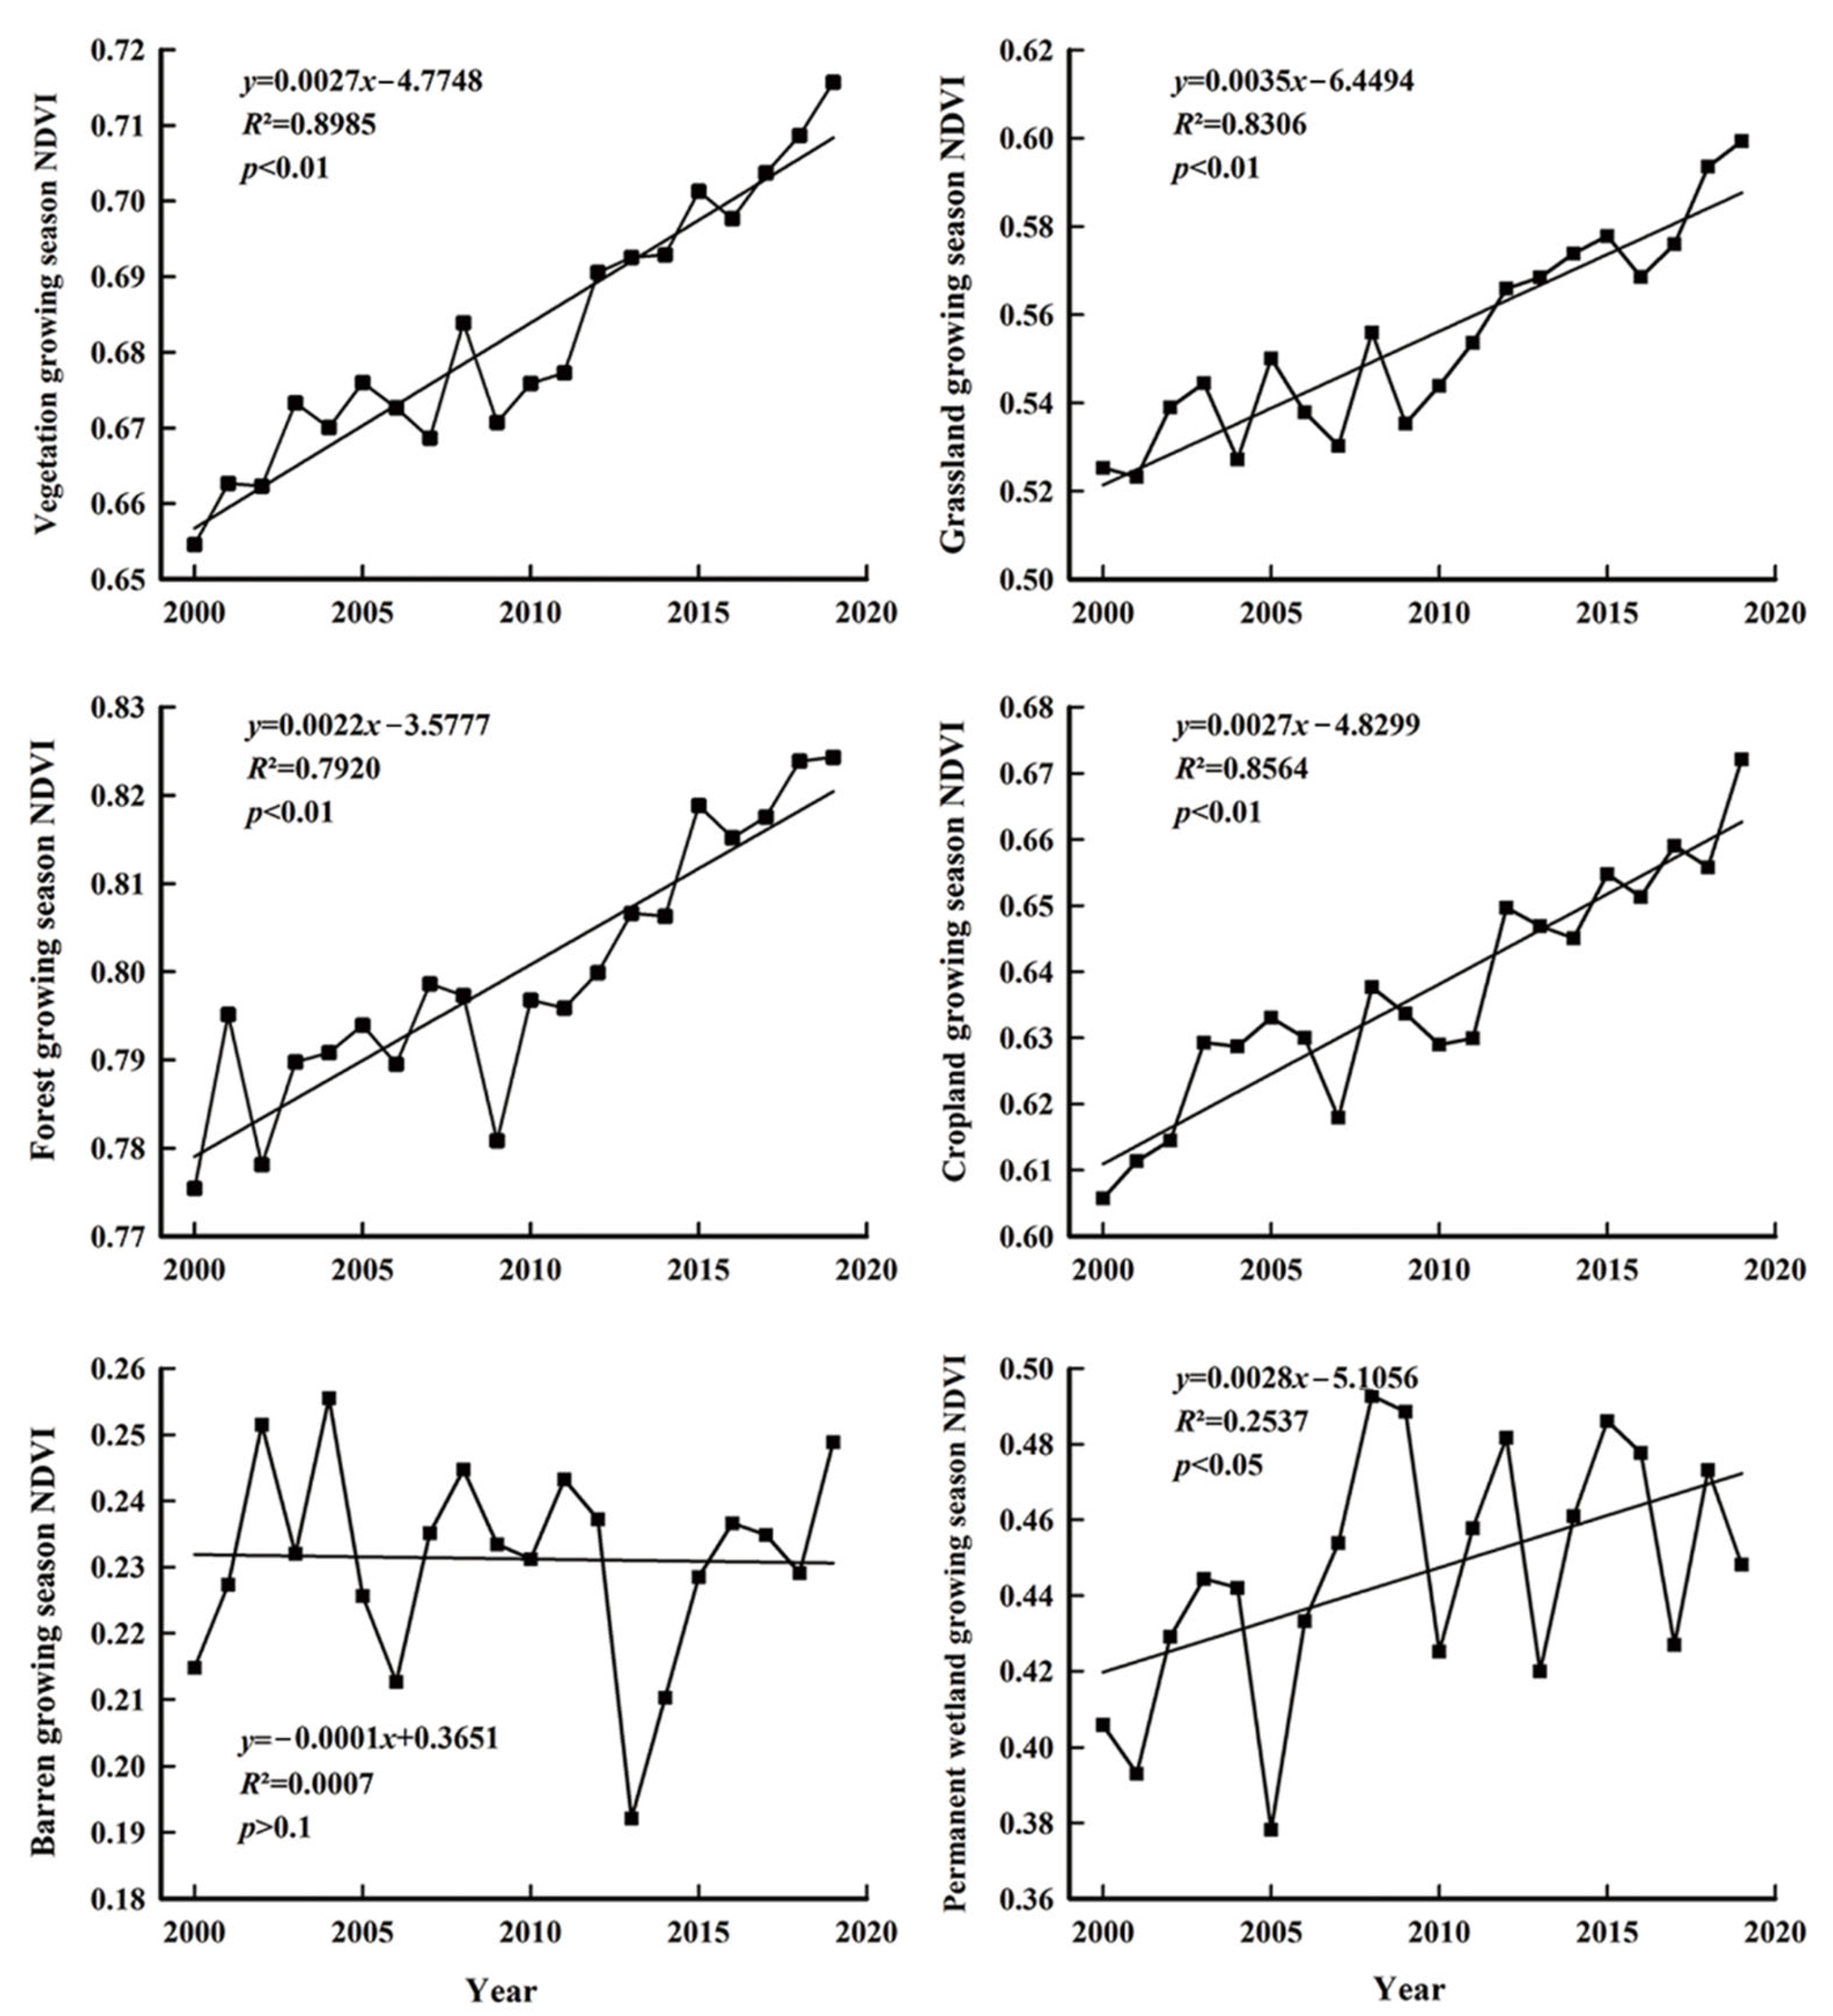
3.1.1. Annual Variation in the NDVI during the Growing Seasons

The NDVI for the period 2000–2019 ranged from 0.0378 to 0.8842 (average value 0.6826), indicating that the values were within an acceptable range. The NDVI in 2000 was the lowest at 0.655, while, in 2019, it was the highest at 0.716. The NDVI increased by 0.061 over the 20 years, the trend in growth rate being 0.0027/year with p values < 0.01, indicating a significant trend.
Regarding cover type, the NDVI values for grassland, forest land, cropland, and permanent wetland during the growing seasons all presented a rising trend, albeit with fluctuations. All the cover types showed a significant growth trend with p-values < 0.01, apart from the NDVI for permanent wetland, which increased significantly with p-values < 0.05. The NDVI for barren land, during the growing season in 2019, was larger than that for 2000, but the overall change was weak, and no significant growth was found. The growth trends for the different cover types in descending order were grassland (0.0035/year) > permanent wetland (0.0028/year) > cropland (0.0027/year) > forest land (0.0022/year) > barren land (−0.0001/year) (see Figure 2).

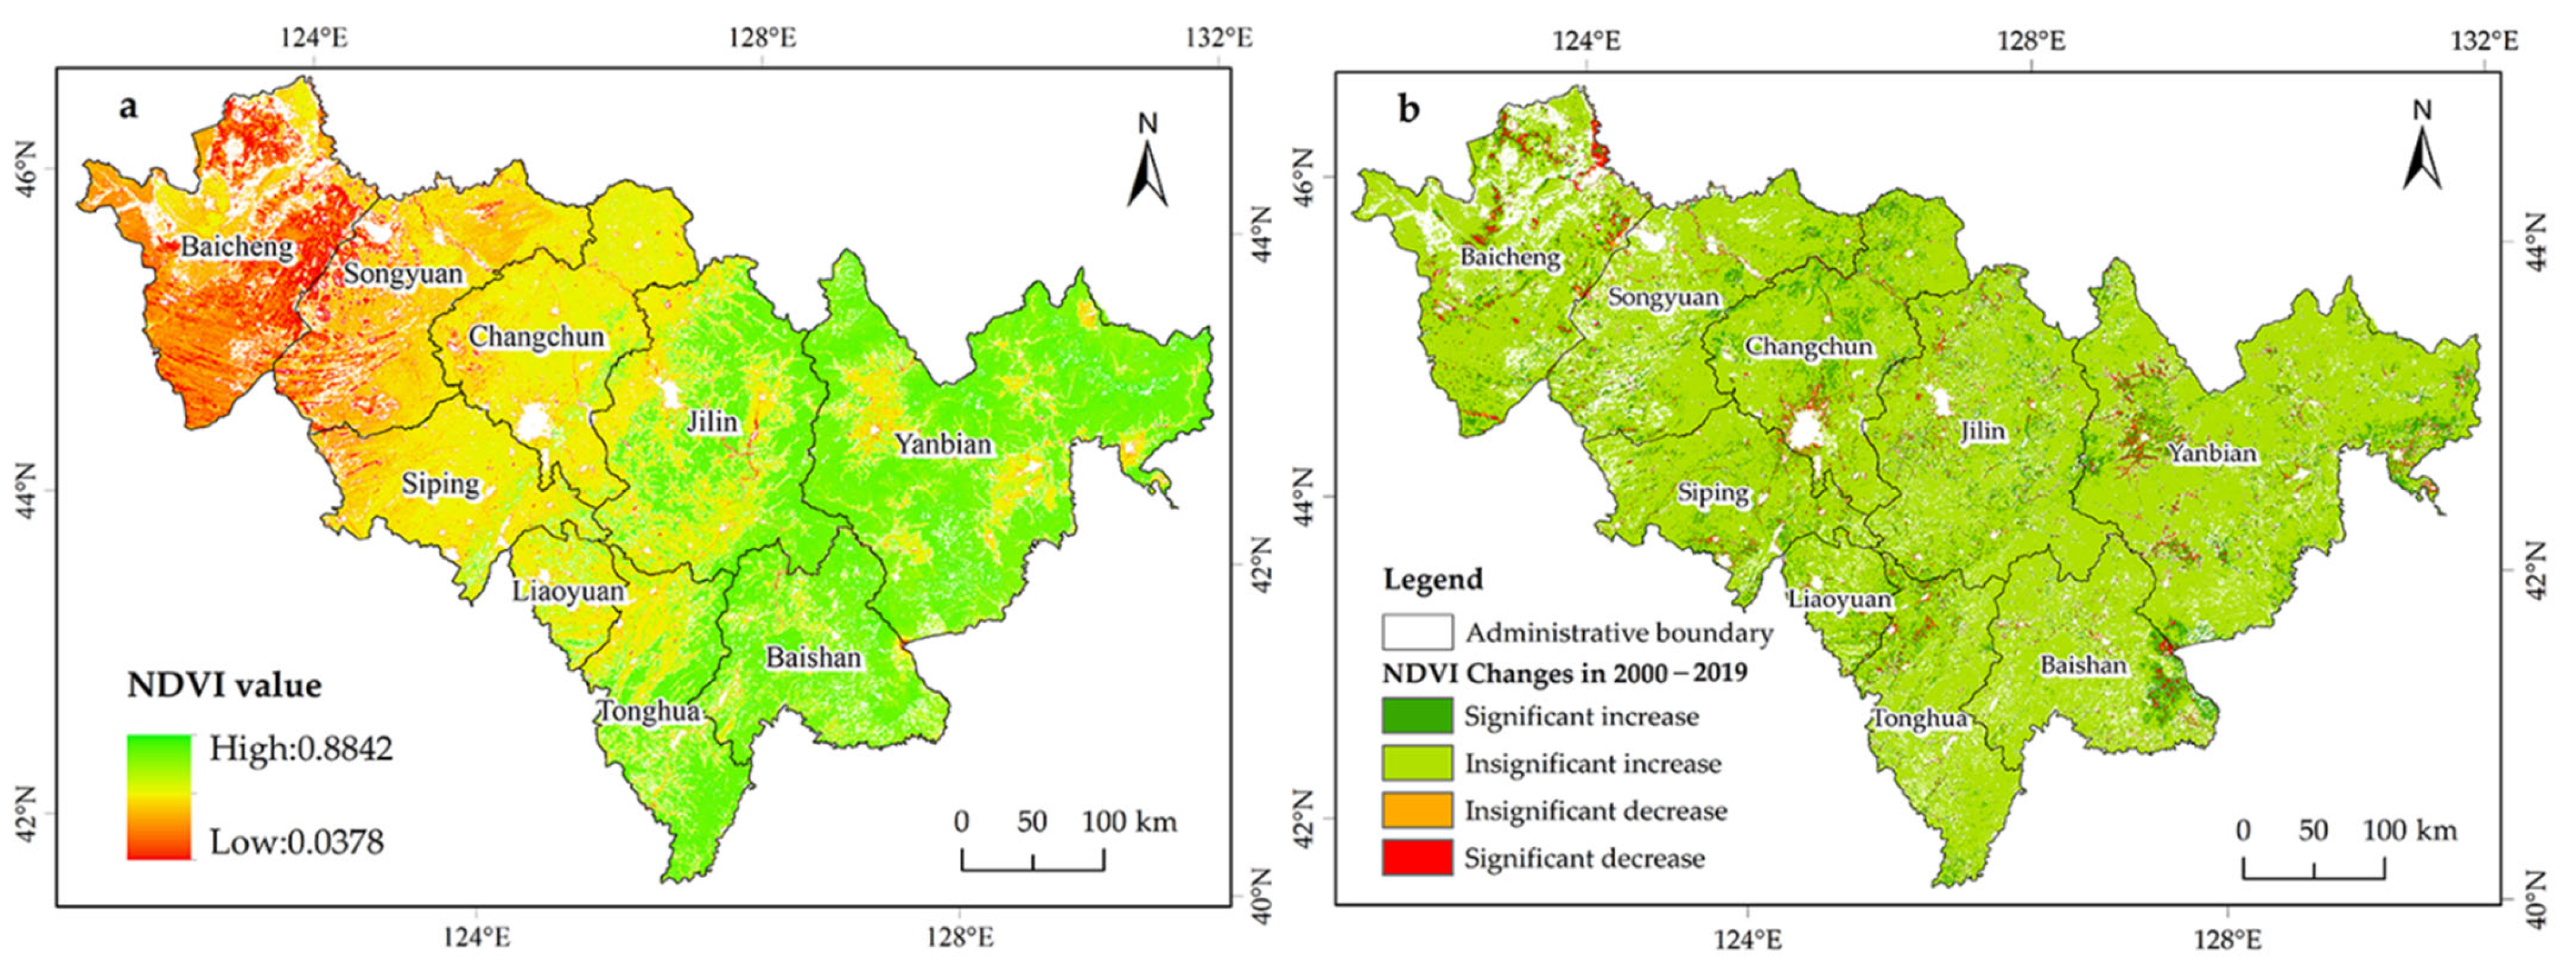
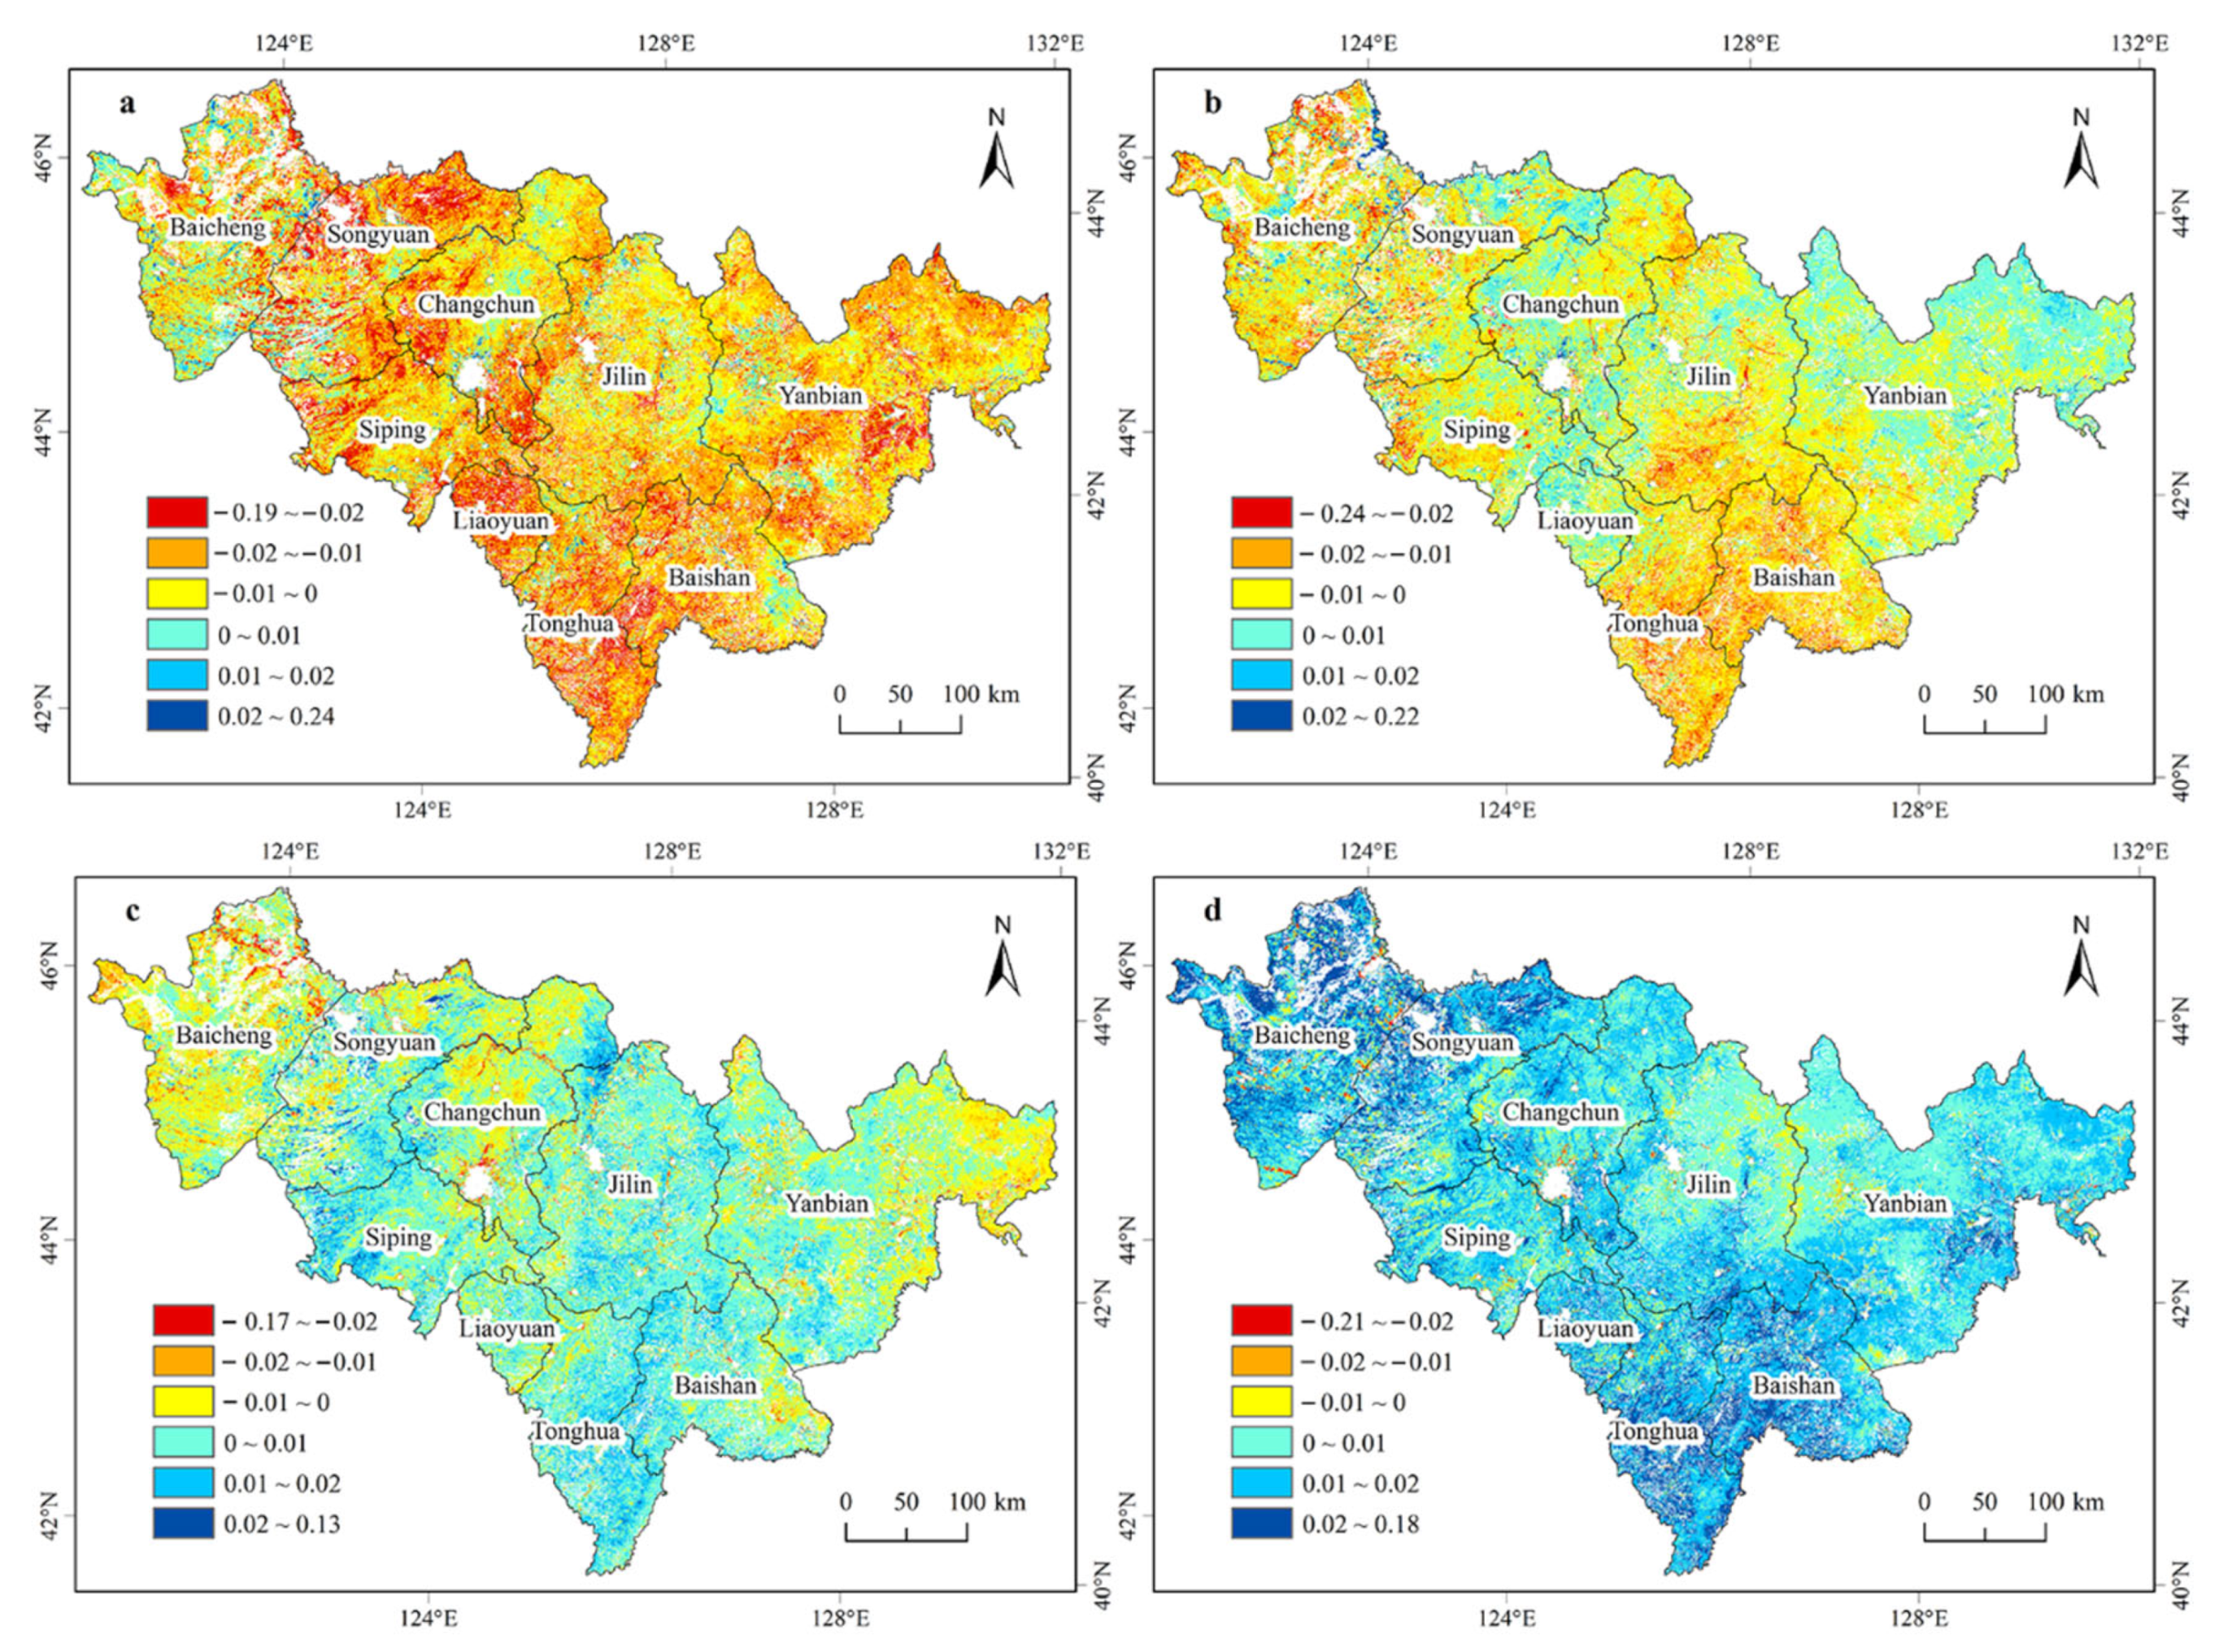
3.1.2. Spatial Variation in the NDVI during the Growing Seasons

The NDVI values for the period from 2000 to 2019 generally increased, indicating that the vegetation coverage was improving. As shown in Figure 1 and Figure 3a, zones with high NDVI values were mainly distributed across the eastern mountain regions, and the main cover type was forest land. The medium-value zones were mainly distributed across the central plains, and the main cover type was agricultural land. The low-value zones were mainly distributed across the western plains, and the main cover type was grassland.
As shown in Figure 3b, over the last 20 years, the NDVI values have shown an overall rising trend; zones with an insignificant increase represented 84.02% of the total vegetation cover of the study area, while those with a significant increase represented 12.66% of the total vegetation cover. Zones displaying vegetation degeneration represented 3.32% of the total vegetation cover, of which grassland and agricultural land represented 32.83% and 56.85%, respectively. The areas experiencing a significant reduction in NDVI values represented 2.63% of the total study area, and were mainly concentrated in the middle of Baicheng City and the west of Yanbian Prefecture. As indicated by the NDVI of the different cover types (Table 1), forest land showed the largest increase in cover, i.e., 99.18%, while barren land and permanent wetland showed the largest degradation, accounting for 40.95% and 18.21% of their total area, respectively. Cropland and grassland cover were significantly reduced, by 3.20% and 5.04%, respectively, and were the vegetation types with the largest degraded areas of 3122.75 km2 and 1803.25 km2, respectively.

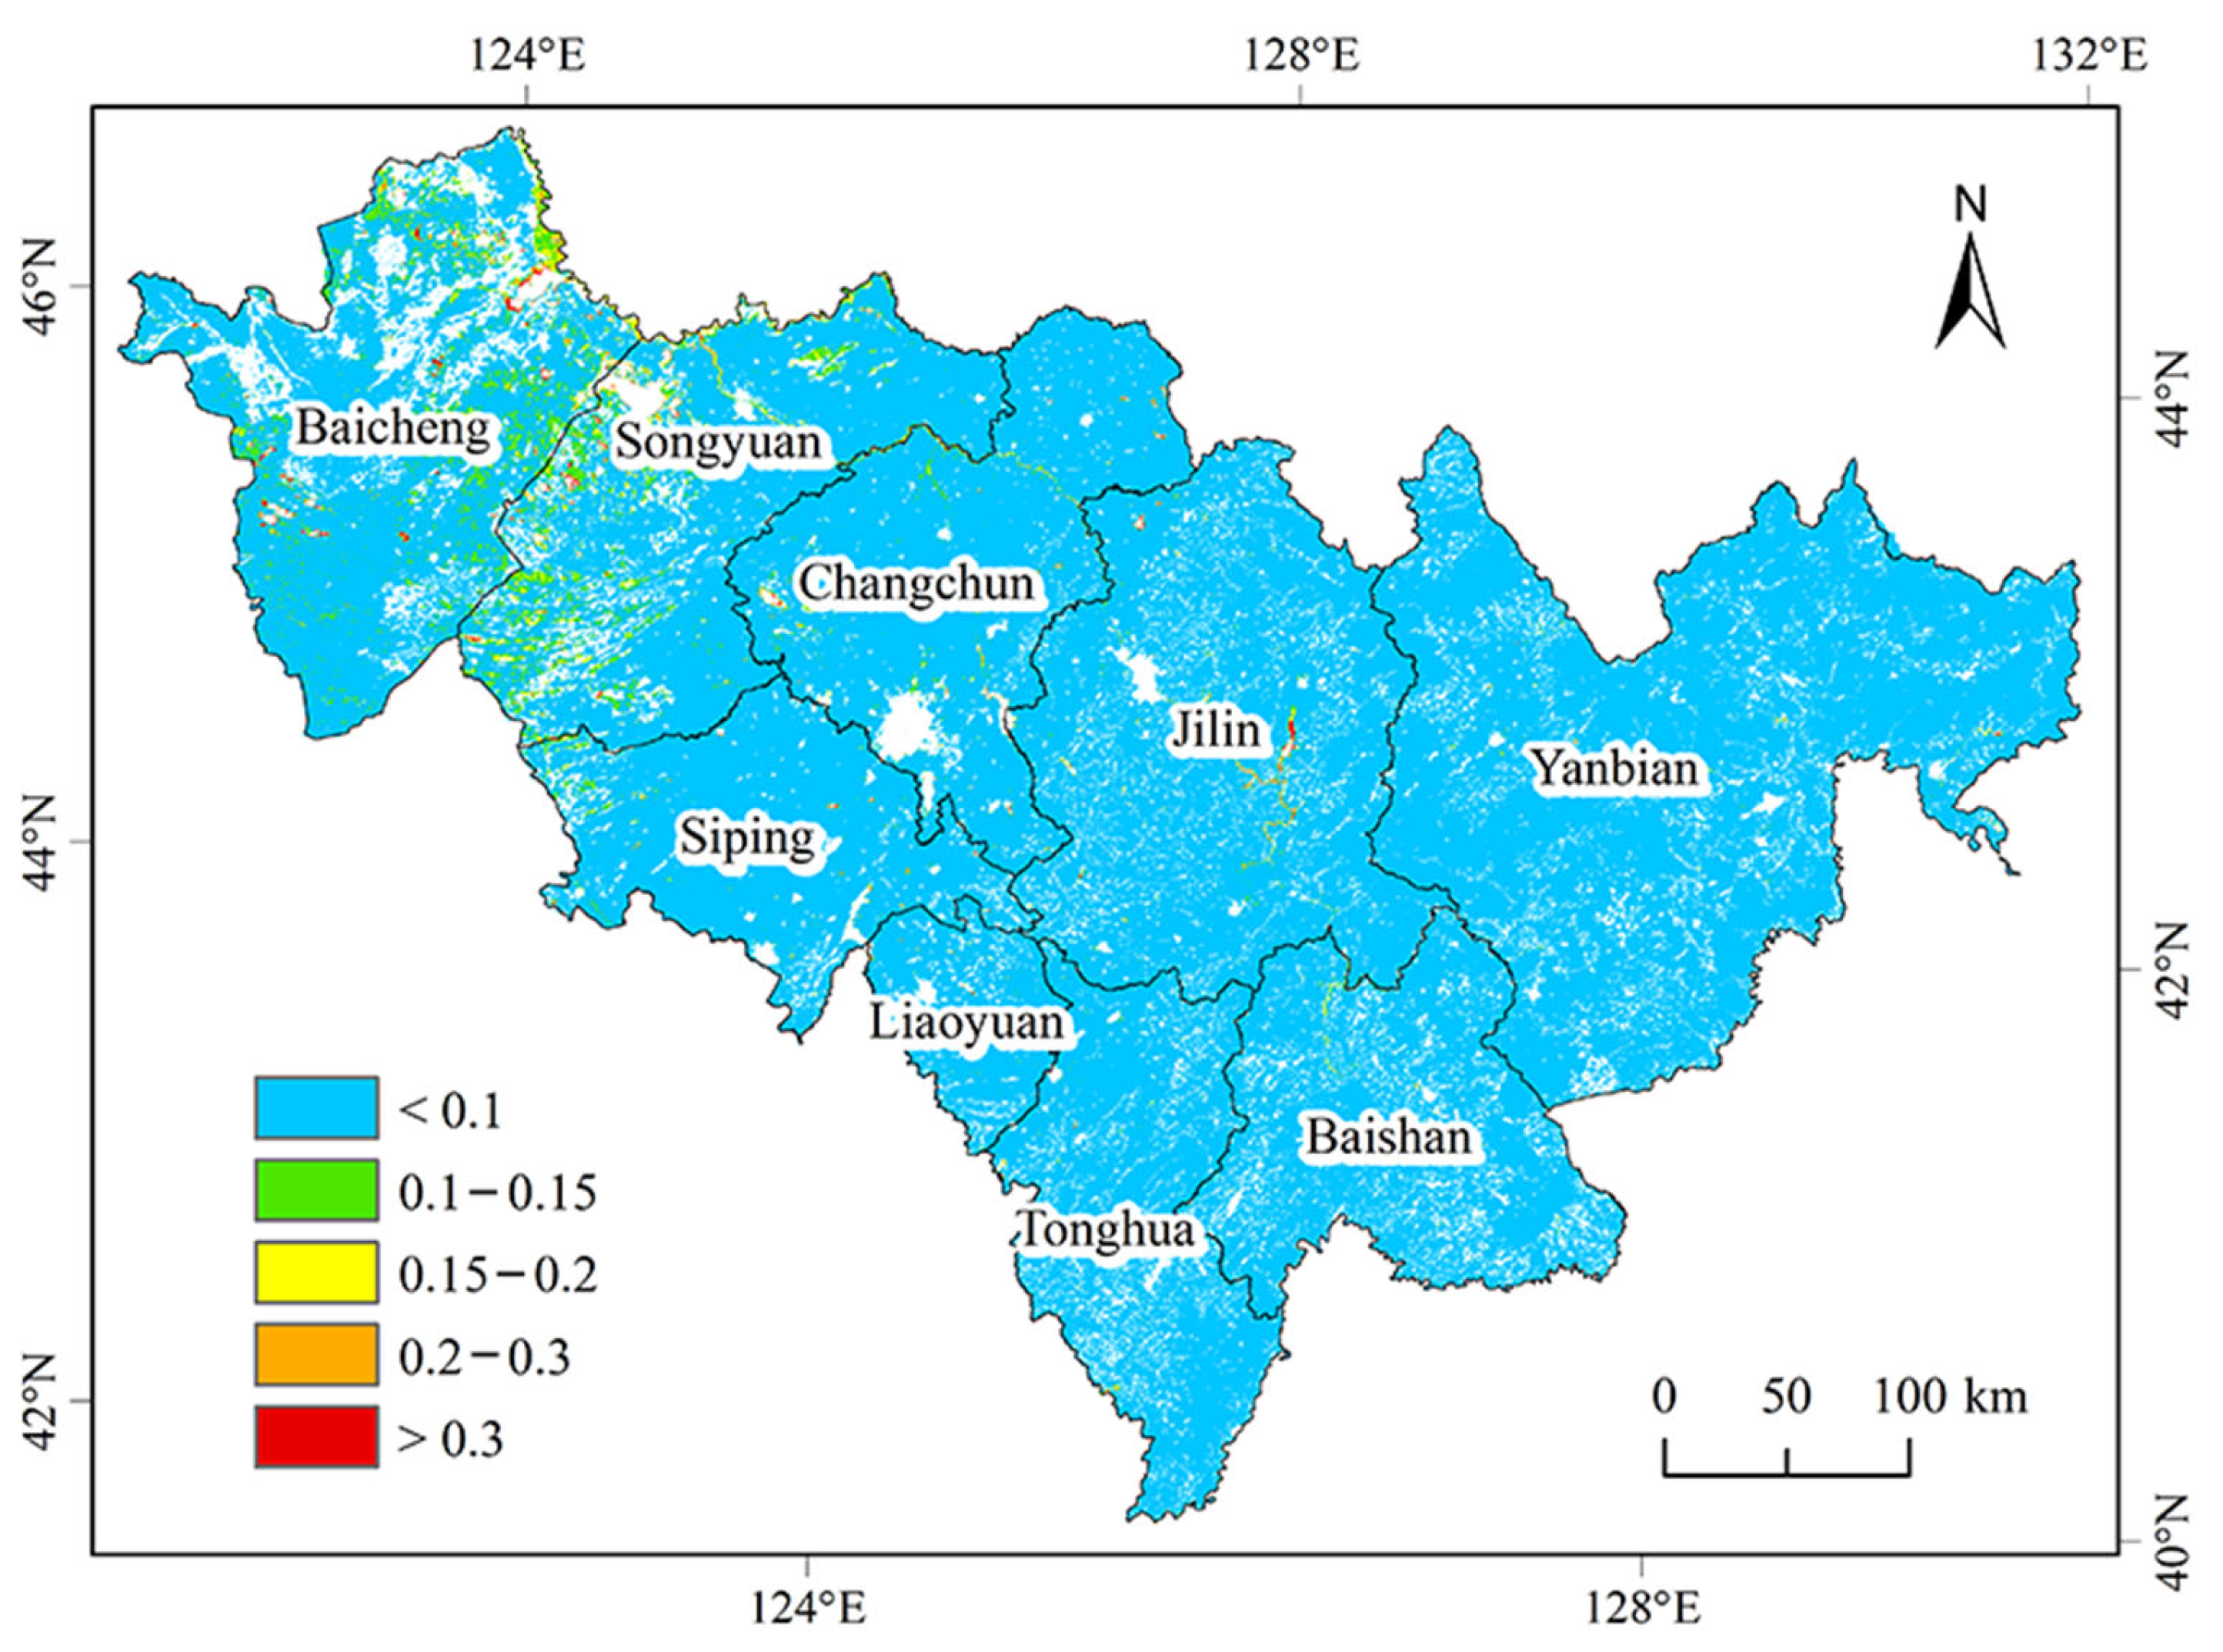
3.2. Stability Analysis of the Vegetation NDVI Values in the Growing Seasons

The CV for the NDVI values during the growing seasons is shown in Figure 4. During the period 2000–2019, the overall NDVI values fluctuated only slightly within the study area, and zones with a CV < 0.15 represented 99.19% of the study area, covering an area of 167,200 km2. Zones with a CV < 0.1 represented 97.20% of the study area, while those with 0.1 < CV < 0.15 represented 1.99% of the study area. Zones with larger NDVI fluctuations (CV > 0.15) were mainly distributed across transition regions between grassland and agricultural land, accounting for 0.81% of the total vegetation area (Baicheng City and Songyuan City were the largest of these areas). The zones with the larger fluctuations in NDVI (CV > 0.15) occurred mainly in regions where the NDVI was significantly reduced, indicating that the fluctuations tended to represent vegetation degradation (Figure 3b). As shown in Table 2, grassland represented 74.45% of the zones with NDVI CV values > 0.15, with an area of 952.63 km2, and cropland represented 12.36%, with an area of 158.19 km2. Although barren land and permanent wetland represented only 6.6% and 6.26%, with areas of 84.5 km2 and 80.06 km2, their relative proportions within their total area reached 76.08% and 52.78%, respectively, indicating that barren land and permanent wetland displayed a relatively high degree of fluctuation. Zones with a CV < 0.15 were mainly represented by those with increased NDVI values, but there were more areas with reduced NDVI values in localized regions such as southern Changchun City, western Yanbian Prefecture, and eastern Baishan City, indicating that there may have been a slight vegetation degradation in these areas over a longer period of time.

3.3. Analysis of Influencing Factors

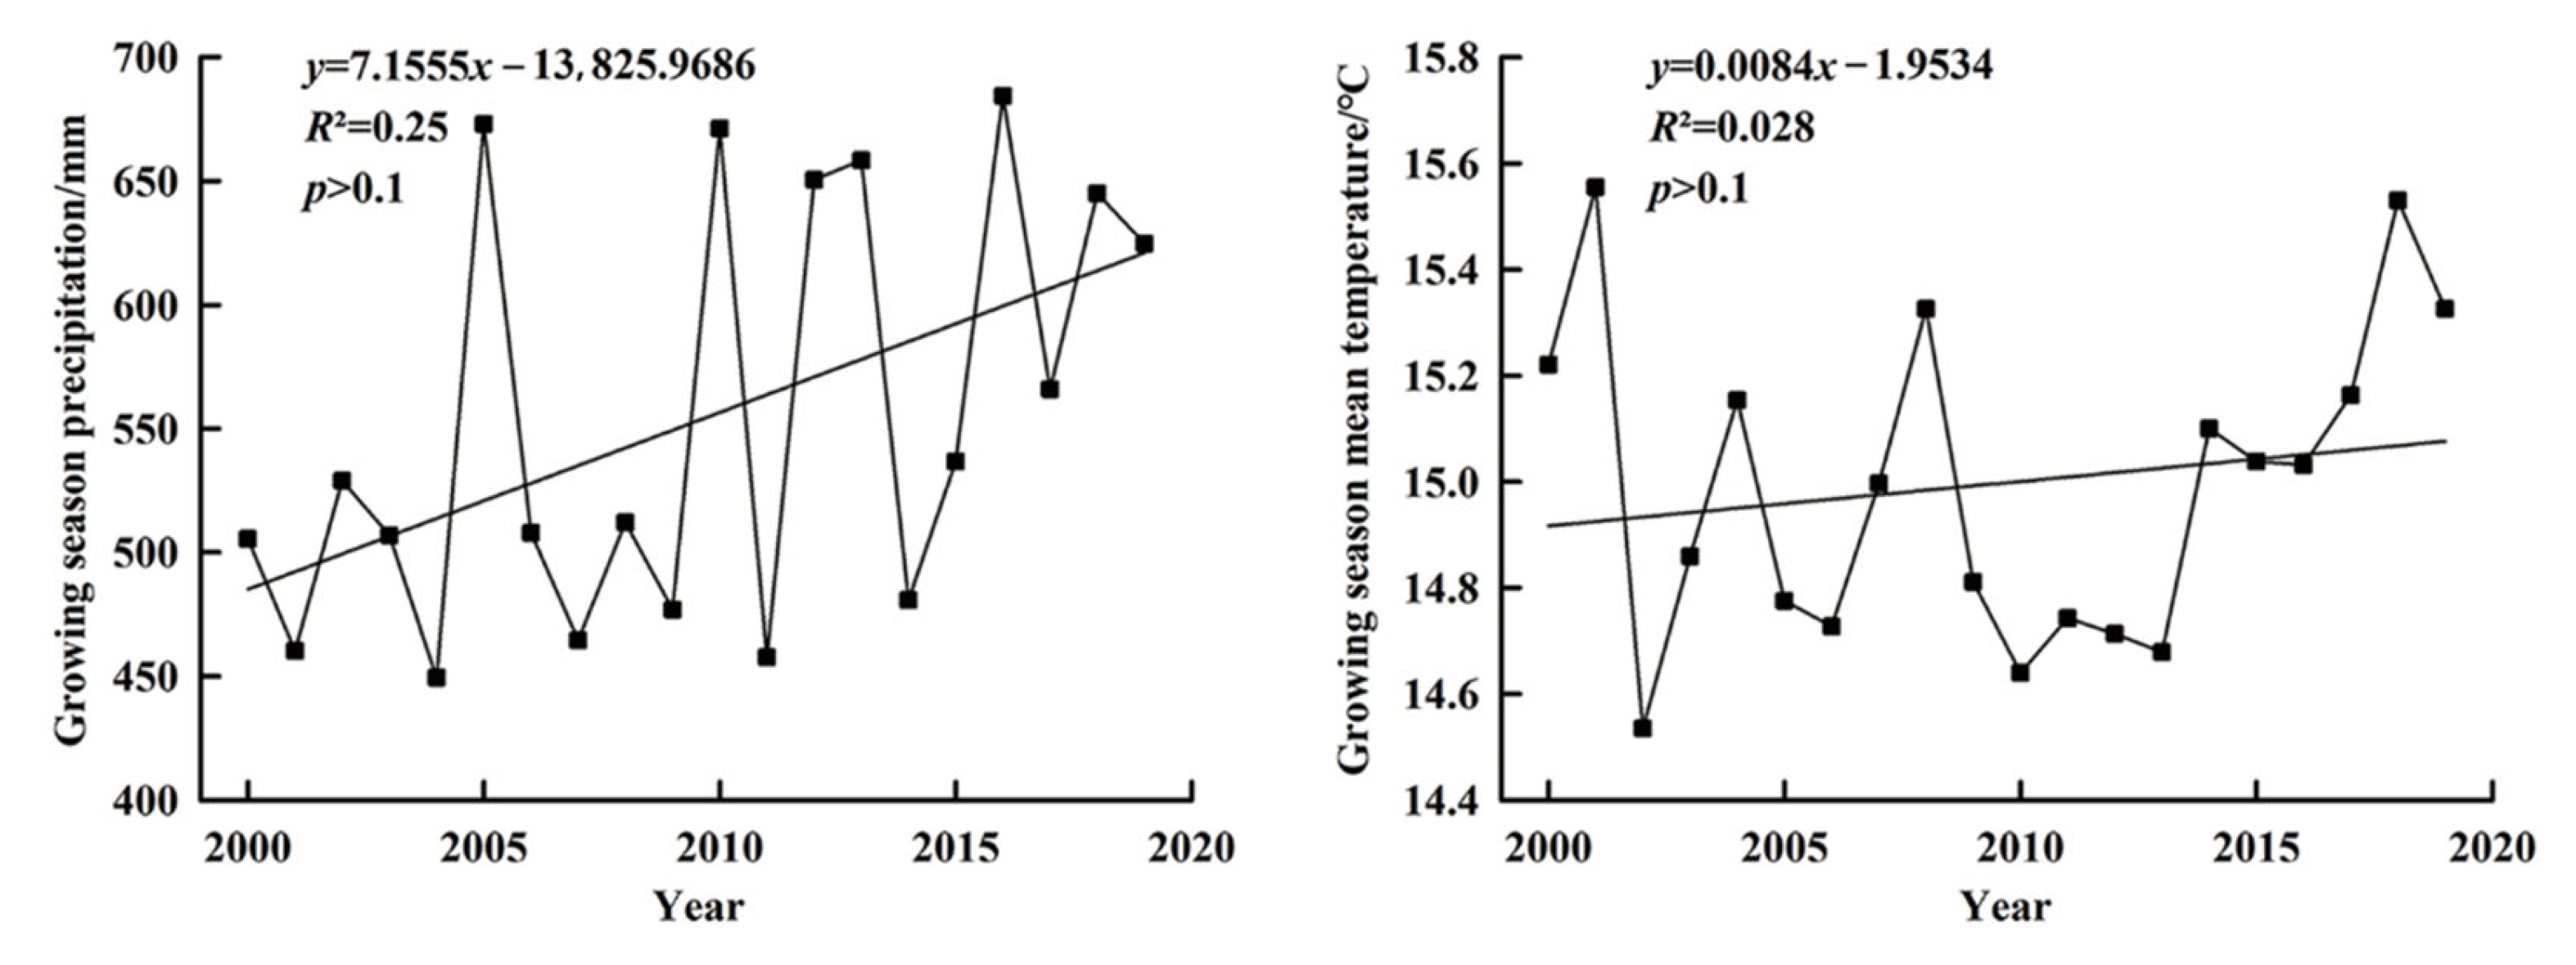
3.3.1. Partial Correlation Analysis between the NDVI Values during the Growing Seasons and Meteorological Factors

As shown in Figure 5, the total precipitation during the growing seasons was between 449 and 684 mm, with an average of 553 mm; 2014 had the lowest precipitation levels (449 mm), while 2013 had the highest precipitation levels (658 mm). The rate of increase was 7.16 mm/year, but p-values > 0.1 indicated an insignificant increase. Interannual changes in precipitation were large and fluctuations were obvious. The average temperatures of the growing seasons ranged between 14.54 and 15.56 °C, with an average of 14.99 °C; the lowest temperature was 14.54 °C in 2002, while the highest was 15.56 °C in 2001. The average rate of change was 0.0084 °C/year, with a p-value > 0.1.
As shown in Figure 6, 78.78% and 97.39% of the zones showed an increase in average temperature and precipitation, respectively. Zones with an increase in average temperature greater than 0.03 °C represented 18.87% of the study area, mainly distributed in the northeastern part of the area, while zones with an increase in average precipitation greater than 10.5 mm represented 20.89% of the total area, mainly distributed in the central part of the area. The proportion of the overall area showing an increasing trend in average temperature was 21.22%, distributed across Baicheng City and Songyuan City in the northwest of the study area, while the proportion of the overall area showing a decreasing trend in precipitation was 2.61%, distributed in the south of Tonghua City.
As shown in Figure 7a, the partial correlation coefficient between the NDVI and average temperature for the period 2000–2019 ranged from −0.8642 to 0.9269 (average value 0.2897). Zones where the average temperature was positively correlated with the NDVI during the growing seasons represented 87.87% of the total area, while zones displaying a significant partial positive correlation according to a t-test represented 26.81% of the overall area, mainly distributed across the Yanbian Prefecture and Jilin City, where the main vegetation type was forest. The average temperature of the growing seasons in this region showed an upward trend, indicating that the temperature increase had a promoting effect on the growth of forest vegetation (Figure 6a). Zones where the average temperature of the growing seasons was negatively correlated with the NDVI of the growing seasons represented 12.13% of the overall area, distributed mainly across the borders of Changchun City, Songyuan City, and Siping City, as well as the central part of Liaoyuan City and the eastern part of Baicheng City. The main cover type was cropland, and the average temperature in these areas was increasing, indicating that the increase in temperature may have caused excessive evaporation, and subsequently drought had inhibited vegetation growth.
As shown in Figure 7b, the partial correlation coefficient between NDVI and precipitation in the study area ranged from −0.8695 to 0.9713 (average value 0.3437). The zones with a positive correlation between precipitation and NDVI during the growing seasons represented 87.24% of the total area, while zones with a significant partial positive correlation according to a t-test represented 40.15% of the overall area, mainly characterized by grassland and cropland distributed across Baicheng City, Liaoyuan City, Songyuan City, Changchun City, and Siping City. Precipitation in these areas was increasing, suggesting that the increase in precipitation mitigated the limitations caused by water shortages during the growing seasons (Figure 6a). Zones with a negative correlation between precipitation and NDVI during the growing seasons represented 12.76% of the overall area, mainly characterized by forest distributed across Tonghua City and Yanbian Prefecture. The precipitation in the eastern part of Yanbian Prefecture was increasing, and the terrain was relatively high, suggesting that the increase in precipitation may have been caused by more surface runoff and infiltration, which removes more organic matter and is not conducive to forest growth. However, the precipitation in the southern part of Tonghua City showed a decreasing trend, indicating that the lack of water during the growing seasons was inhibiting the growth of forest. As shown in Figure 7c,d and Table 3, precipitation is the main climatic controlling factor in the west of the study area, while average temperature is the main climatic controlling factor in the east. Precipitation is the main climatic controlling factor for grassland and cropland. Forest land is limited by precipitation and average temperature, while barren land and permanent wetland are slightly negatively correlated with precipitation.

3.3.2. Influence of Human Factors on NDVI during the Growing Seasons in the Study Area

As shown in Figure 8, human activities had a positive impact on the NDVI values across 94.44% of the study area, while negative impacts were found in only 5.56% of the study area, mainly in Baicheng City, central Changchun City, northern Jilin City, and western Yanbian Prefecture. This indicated that human activities such as overgrazing of grassland, the encroachment of other land by agricultural activities, and the expansion of urban construction were hindering the growth of vegetation and leading to vegetation degradation.
As shown in Figure 9a, the residuals of NDVI values in Jilin Province during the period 2000–2004 ranged from −0.19 to 0.24 (average value −0.0121), indicating that within this time period human factors had an overall negative influence on the NDVI values. Zones displaying such a negative influence represented 89.15% of the total area, while those displaying a positive influence only represented 10.85%. As shown in Figure 9b, the residual errors of NDVI values for the period 2005–2009 were between −0.24 and 0.22 (average value −0.0047), again indicating that the NDVI was negatively influenced by human factors. Zones representing a negative influence represented 68.12% of the total vegetation area, while those with a positive influence represented 31.88% of the total vegetation area. Figure 9c shows that the residual errors of the NDVI values for the period 2010–2014 were between −0.17 and 0.13 (average value 0.0021), indicating that human factors were positively affecting the overall NDVI values during this time period. The zones displaying a positive influence represented 66.12% of the total vegetation area, while those with a negative influence represented 33.88% of the total vegetation area. Figure 9d shows that the residual errors of NDVI values for the period 2015–2019 were between −0.21 and 0.18 (average value 0.0116), also indicating that human factors had exerted an overall positive influence on the NDVI values within this time period. The zones displaying a positive influence represented 94.01% of the total vegetation area, while those displaying a negative influence represented 5.89% of the total vegetation area. According to the NDVI values, since 2000 the area of vegetation negatively impacted by human activities has gradually decreased from 89.15% to 5.89%. Since 2010, the area positively impacted by human activities has gradually expanded, reaching 94.01% by 2019.

4. Discussion

4.1. Methods of Data Processing and Analysis

This study used the Sen + Mann–Kendall test to analyze trends in NDVI values for the period 2000–2019. As compared with a traditional regression model, the significance test was performed while removing interference values, and thus the results are more credible [34,37]. In order to eliminate nonlinear influences between climatic factors, we used a partial correlation analysis to reveal the impact of climatic factors on NDVI.
We superimposed the vegetation data for each of the 20 years to eliminate vegetation types that had changed. The final analysis, therefore, used vegetation types that had not changed over the study period, because we could not determine whether those changes had been caused by human activities or natural phenomena. For example, if a forest with a higher NDVI value was converted to grassland with a lower NDVI value, there would be large interannual fluctuations in the NDVI value of the pixel. We also decided to use NDVI data from the growing season (from April to October) to avoid the slow vegetation growth during the long winter period affecting the accuracy of the data.
Traditional interpolation methods such as the Kriging and trend surface tests can cause large errors and affect the results, therefore, we chose the Anusplin software, which is based on the application of thin-plate spline function theory and is widely used in meteorology to interpolate meteorological data. Anusplin introduces altitude as a covariate and as compared with ordinary Kriging and reverse distance weighting methods, the difference error is smaller, which is more suitable for meteorological elements of a time series [45,46].

4.2. Vegetation Changes and Influencing Factors

In general, the NDVI values for Jilin Province displayed a significant growth trend, and the vegetation status had obviously improved, which accords with conclusions drawn by Zhang et al. (2011) and Wang et al. (2011) that the overall vegetation coverage in northeast China has improved significantly [1,41]. In contrast, with rapid economic development, the process of urbanization is accelerating, and urban expansion has promoted the conversion of cropland and grassland in lower altitude areas to construction land, and has accelerated the degradation of vegetation near the town boundaries [47]. This phenomenon explains why grassland and cropland are the main types of degraded vegetation and account for 30% and 70% of the degraded vegetation regions, respectively. Therefore, future urbanization needs to consider protecting these vegetation types. Barren land and permanent wetland showed the greatest degree of degradation and fluctuation, which accords with the results of Ma et al. that barren land is the most vulnerable [48]. These cover types also have a negative correlation with precipitation. Figure 1b and Figure 8 show that human activities are correlated with degradation, indicating that long-term drought conditions and human activities have led to varying degrees of degradation of permanent wetland and barren land. Forest land is less affected by human activities, and significantly positively correlated with average temperature and precipitation, indicating that the implementation of forest land protection policies and favorable climatic conditions have enabled stable growth of this type of vegetation cover. This is consistent with Wang et al., who showed that NDVI values increased rapidly during the growing season in the northeast forests of China [49]. Our findings that precipitation and average temperature are increasing are consistent with the conclusions of Lin et al. [37], while the findings that grassland, barren land, and permanent wetland have been degraded are consistent with Wang et al., who determined that the landscape elements of grassland, wetland, forest land, and water have shrunk rapidly [50]. Our results also show that vegetation coverage in the study area has improved over the past 20 years, and human activities have gradually had some positive effects such as water conservancy projects, afforestation, and ecological protection areas which has promoted ecological restoration. This gives us confidence that there will be positive future vegetation greening, but highlights the urgency of protecting vegetation in degraded areas.

4.3. Limitations and Future Perspectives

Trend analysis, coefficient of variation, partial correlation analysis and residual analysis based on the Sen + Mann–Kendall test were all used to analyze tends and fluctuations in vegetation change over the past 20 years, and responses to climatic factors and human activities in detail. However, in addition to average temperature, precipitation, and human activities, other factors that can affect NDVI values include terrain, altitude, CO2 concentration, nitrogen deposition, and solar radiation [10,51]. In the future, more influencing factors should be included within the scope of the research, with an in-depth study of the mechanisms of vegetation change.
The “Comprehensive Report” of the Fifth Assessment Report released by the Intergovernmental Panel on Climate Chang (IPCC) in 2014 pointed out that global warming is unquestionable [52]; the temperature trend seen in our study area is consistent with this, and climate change is already affecting living systems [53]. Rising temperatures will lead to drought, which will hinder the normal growth of vegetation. To cope with the ecological pressure that will be caused by global warming in the future, vegetation, as an important natural resource for regulating the climate, should be protected and restored, with the implementation of measures appropriate to the changing characteristics of different vegetation types. Improving facilities for water conservation in degraded farmland areas to alleviate the limitation of a lack of water during the growing season should be prioritized. Ecological protection areas, such as wetland protection parks, should be built in permanent wetlands. Strict implementation of rotational grazing systems in degraded grassland areas should be applied, and vegetation suitable for arid environments cultivated. Efforts should be made to restore vegetation in areas with barren land, fire prevention measures should be strengthened, and felling within forests should be prevented. In this way, we can promote the growth of vegetation, maintain the stability of the ecological environment, and promote sustainable development.

5. Conclusions

The NDVI values across the study area showed significant growth trends, indicating that the vegetation is continuously greening, and for the different vegetation cover types, in descending order, the growth trends were grassland (0.0035/year) > permanent wetland (0.0028/year) > cropland (0.0027/year) > forest land (0.0022/year) > barren land (−0.0001/year). Grassland and cropland NDVI values can fluctuate greatly and include the most severely degraded areas.
The average temperature and precipitation values showed no significant increase. Precipitation is the main climatic controlling factor in the west of the study area, while average temperature is the main climatic controlling factor in the east. Precipitation is the main climatic controlling factor for grassland and cropland. Forest land is limited by precipitation and average temperature, while barren land and permanent wetland are slightly negatively correlated with precipitation.
From 2000 to 2019, the residual values for the NDVI increased from −0.0121 to 0.0116, and the impact of human activities on vegetation changed from negative to positive. By 2019, the proportion of positively affected zones was as high as 94.01%, and the negatively affected zones were mainly distributed across transitional areas of cropland and grassland, and urban and built-up land and forest land.

Author Contributions

Y.L. (Ying Li), L.W. and Y.L. (Yuefen Li) conceived and designed the study; Y.L. (Ying Li) and G.L. collected samples and tested samples; Z.Z. and L.C. analyzed the data; Y.L. (Ying Li) and Y.L. (Yuefen Li) wrote the manuscript, and Y.L. (Yuefen Li) edited it. All authors have read and agreed to the published version of the manuscript.

Funding

This work was supported by the Science and Technology Strategy and Planning Research Project of the Jilin Province Science and Technology Department (grant no. 20200101119FG).

Institutional Review Board Statement

Not applicable.

Informed Consent Statement

Not applicable.

Data Availability Statement

The data presented in this study are available on request from the corresponding author.

Conflicts of Interest

The authors declare no conflict of interest.

References

  1. Wang, Q.; Zhang, B.; Dai, S.P.; Zhou, Y.; MA, Z.H.; Zhang, N.Y. Dynamic changes of vegetation coverage in the Three North Shelterbelt Project Area based on GIMMS AVHRR NDVI data. Res. Sci. 2011, 33, 1613–1620. [Google Scholar]
  2. Cui, L.L.; Shi, J.; Yang, M.Y.; Fan, W.Y. Ten-day response characteristics of vegetation NDVI in eastern China to temperature and precipitation. J. Geogr. Sci. 2009, 64, 850–860. [Google Scholar]
  3. Li, M.H.; Du, J.K.; Li, W.T.; Li, R.J.; Wu, S.Y.; Wang, S.S. Global vegetation change and its relationship with precipitation and temperature based on GLASS-LAI in 1982–2015. Sci. Geogr. Sin. 2020, 40, 823–832. [Google Scholar]
  4. Tian, M.; Zhou, J.; Jia, B.; Lou, S.; Wu, H. Impact of Three Gorges Reservoir Water Impoundment on Vegetation–Climate Response Relationship. Remote Sens. 2020, 12, 2860. [Google Scholar] [CrossRef]
  5. Jiang, L.; Gu, J.; Bao, A.; Guo, H.; Ndayisaba, F. Vegetation dynamics and responses to climate change and human activities in Central Asia. Sci. Total Environ. 2017, 599–600, 967–980. [Google Scholar] [CrossRef]
  6. Hilker, T.; Lyapustin, A.I.; Tucker, C.J.; Hall, F.G.; Myneni, R.B.; Wang, Y. Vegetation dynamics and rainfall sensitivity of the Amazon. Proc. Natl. Acad. Sci. USA 2014, 111, 16041–16046. [Google Scholar] [CrossRef] [PubMed] [Green Version]
  7. Zhao, L.; Dai, A.; Dong, B. Changes in global vegetation activity and its driving factors during 1982–2013. Agric. For. Meteorol. 2018, 249, 198–209. [Google Scholar] [CrossRef]
  8. Piao, S.; Wang, X.; Ciais, P.; Zhu, B.; Wang, T.; Liu, J. Changes in satellite-derived vegetation growth trend in temperate and boreal Eurasia from 1982 to 2006. Glob. Chang. Biol. 2011, 17, 3228–3239. [Google Scholar] [CrossRef]
  9. Hmimina, G.; Dufrêne, E.; Pontailler, J.Y.; Delpierre, N.; Aubinet, M.; Caquet, B. Evaluation of the potential of MODIS satellite data to predict vegetation phenology in different biomes: An investigation using ground-based NDVI measurements. Remote Sens. Environ. 2013, 132, 145–158. [Google Scholar] [CrossRef]
  10. Piao, S.; Cui, M.; Chen, A.; Wang, X.; Ciais, P.; Liu, J. Altitude and temperature dependence of change in the spring vegetation green-up date from 1982 to 2006 in the Qinghai-Xizang Plateau. Agric. For. Meteorol. 2011, 151, 1599–1608. [Google Scholar] [CrossRef]
  11. Li, J.; Peng, S.; Li, Z. Detecting and attributing vegetation changes on China’s Loess Plateau. Agric. For. Meteorol. 2017, 247, 260–270. [Google Scholar] [CrossRef]
  12. Li, Y.C.; Hou, M.J.; Ge, J.; Feng, Q.S.; Liang, T.G. Study on NDVI Changes and Driving Factors of Grassland Vegetation in Southern Gansu and Northwest Sichuan. Acta Agrestia Sin. 2020, 28, 1690–1701. [Google Scholar]
  13. Cui, L.F.; Wang, L.C.; Qu, S.; Deng, L.H.; Wang, Z.D. Impacts of temperature, precipitation and human activity on vegetation NDVI in Yangtze River Basin, China. Geogr. Sci. 2020, 45, 1905–1917. [Google Scholar]
  14. Zhang, C.H.; Li, S.H.; Bai, H.Y.; Zhu, X.L.; Yang, Q. Multi-scale periodic variation of NDVI in July and its response to climatic factors in the Taibai Mountain area. Res. Sci. 2019, 41, 2131–2143. [Google Scholar]
  15. Qi, G.Z.; Bai, H.Y.; Zhao, T.; Meng, Q.; Zahng, S.H. The response sensitivity and spatial difference of vegetation on the north and south slopes of the Shaanxi section of the Qinling Mountains. J. Geogr. Sci. 2021, 76, 44–56. [Google Scholar]
  16. Liu, C.; Yan, X.Y.; Jiang, F.Q. The Influence of Precipitation Distribution Patterns on the Desert Vegetation in the Piedmont Belt of the Northern Slope of the Tianshan Mountains—Based on the Analysis of Daily Precipitation Data and NDVI. Acta Ecol. Sin. 2020, 40, 7790–7804. [Google Scholar]
  17. Deng, Y.J.; Yao, S.B.; Hou, M.Y.; Zhang, T.Y. Spatial and Temporal Variation of Vegetation NDVI in the Upper and Middle Yangtze River Basin and Its Topographic Differentiation Effects. Res. Environ. Yangtze Basin 2020, 29, 66–78. [Google Scholar]
  18. Peng, W.F.; Zhang, D.M.; Luo, Y.M.; Tao, S.; Xu, X.L. Geographical Exploration of Natural Factors on NDVI Changes of Sichuan Vegetation. J. Geogr. Sci. 2019, 74, 1758–1776. [Google Scholar]
  19. Ma, C.; Cui, B.B.; Zhong, G.R.; Cui, M.; Yang, C.; Ma, W.S. The impact of climate change and engineering activities on the spatiotemporal changes of vegetation index along the Qinghai-Tibet Railway. Geogr. Res. 2021, 40, 35–51. [Google Scholar]
  20. Dagnachew, M.; Kebede, A.; Moges, A.; Abebe, A. Effects of Climate Variability on Normalized Difference Vegetation Index (NDVI) in the Gojeb River Catchment, Omo-Gibe Basin, Ethiopia. Adv. Meteorol. 2020, 2020, 8263246. [Google Scholar] [CrossRef]
  21. Shi, Y.; Jin, N.; Ma, X.; Wu, B.; He, Q.; Yue, C. Attribution of climate and human activities to vegetation change in China using machine learning techniques. Agric. For. Meteorol. 2020, 294, 108146. [Google Scholar] [CrossRef]
  22. Myneni, R.B.; Hall, F.G.; Sellers, P.J.; Marshak, A.L. The interpretation of spectral vegetation indexes. IEEE Trans. Geosci. Remote Sens. 1995, 33, 481–486. [Google Scholar] [CrossRef]
  23. Sellers, P.J. Canopy reflectance, photosynthesis, and transpiration. III. A reanalysis using improved leaf models and a new canopy integration scheme. Remote Sens. Environ. 1985, 42, 187–216. [Google Scholar] [CrossRef]
  24. Asrar, G.; Fuchs, M.; Kanemasu, E.T.; Hatfield, J.L. Estimating absorbed photosynthetic radiation and leaf area index from spectral reflectance in wheat. Agron. J. 1984, 76, 300–306. [Google Scholar] [CrossRef]
  25. Huete, A.; Didan, K.; Miura, T.; Rodriguez, E.P.; Gao, X.; Ferreira, L.G. Overview of the radiometric and biophysical performance of the MODIS vegetation indices. Remote Sens. Environ. 2002, 83, 195–213. [Google Scholar] [CrossRef]
  26. Jin, K.; Wang, F.; Han, J.Q.; Shi, S.Y.; Ding, W.B. 1982–2015 China’s climate change and the impact of human activities on vegetation NDVI changes. J. Geogr. Sci. 2020, 75, 961–974. [Google Scholar]
  27. Song, F.Q.; Kang, M.Y.; Yang, P.; Chen, Y.R.; Liu, Y.; Xing, K.X. Comparison and validation of GIMMS, SPOT-VGT and MODIS global NDVI products in the Loess Plateau of northern Shaanxi Province, northwestern China. Trans. Chin. Soc. Agric. Eng. 2011, 27, 316–324. [Google Scholar]
  28. Piao, S.; Nan, H.; Huntingford, C.; Ciais, P.; Friedlingstein, P.; Sitch, S. Evidence for a weakening relationship between interannual temperature variability and northern vegetation activity. Nat. Commun. 2014, 5, 5018. [Google Scholar] [CrossRef] [PubMed] [Green Version]
  29. Chu, H.; Venevsky, S.; Wu, C.; Wang, M. NDVI-based vegetation dynamics and its response to climate changes at Amur-Heilongjiang River Basin from 1982 to 2015. Sci. Total Environ. 2019, 650, 2051–2062. [Google Scholar] [CrossRef]
  30. Zhao, J.; Huang, S.; Huang, Q.; Wang, H.; Leng, G.; Fang, W. Time-lagged response of vegetation dynamics to climatic and teleconnection factors. Catena 2020, 189, 104474. [Google Scholar] [CrossRef]
  31. Barbosa, H.A.; Huete, A.R.; Baethgen, W.E. A 20-year study of NDVI variability over the Northeast Region of Brazil. J. Arid Environ. 2006, 67, 288–307. [Google Scholar] [CrossRef]
  32. Shen, M.; Tang, Y.; Chen, J.; Zhu, X.; Zheng, Y. Influences of temperature and precipitation before the growing season on spring phenology in grasslands of the central and eastern Qinghai-Tibetan Plateau. Agric. For. Meteorol. 2011, 151, 1711–1722. [Google Scholar] [CrossRef]
  33. Baeza, S.; Paruelo, J.M. Land Use/Land Cover Change (2000–2014) in the Rio de la Plata Grasslands: An Analysis Based on MODIS NDVI Time Series. Remote Sens. 2020, 12, 381. [Google Scholar] [CrossRef] [Green Version]
  34. Shen, M.; Zhang, G.; Cong, N.; Wang, S.; Kong, W.; Piao, S. Increasing altitudinal gradient of spring vegetation phenology during the last decade on the Qinghai–Tibetan Plateau. Agric. For. Meteorol. 2014, 189, 71–80. [Google Scholar] [CrossRef]
  35. Partal, T.; Kahya, E. Trend analysis in Turkish precipitation data. Hydrol. Process. 2006, 20, 2011–2026. [Google Scholar] [CrossRef]
  36. Tabari, H.; Marofi, S.; Aeini, A.; Talaee, P.H.; Mohammadi, K. Trend analysis of reference evapotranspiration in the western half of Iran. Agric. For. Meteorol. 2011, 151, 128–136. [Google Scholar] [CrossRef]
  37. Lin, X.; Tang, J.; Li, Z.; Li, H. Vegetation greenness modelling in response to interannual precipitation and temperature changes between 2001 and 2012 in Liao River Basin in Jilin Province, China. SpringerPlus 2016, 5, 1173. [Google Scholar] [CrossRef] [Green Version]
  38. Kross, A.; McNairn, H.; Lapen, D.; Sunohara, M.; Champagne, C. Assessment of RapidEye vegetation indices for estimation of leaf area index and biomass in corn and soybean crops. Int. J. Appl. Earth Obs. Geoinf. 2015, 34, 235–248. [Google Scholar] [CrossRef] [Green Version]
  39. Zarco-Tejada, P.J.; Morales, A.; Testi, L.; Villalobos, F.J. Spatio-temporal patterns of chlorophyll fluorescence and physiological and structural indices acquired from hyperspectral imagery as compared with carbon fluxes measured with eddy covariance. Remote Sens. Environ. 2013, 133, 102–115. [Google Scholar] [CrossRef]
  40. Liu, Q.; Fu, Y.; Zeng, Z.; Huang, M.; Li, X.; Piao, S. Temperature, precipitation, and insolation effects on autumn vegetation phenology in temperate China. Glob. Chang. Biol. 2016, 22, 644–655. [Google Scholar] [CrossRef]
  41. Zhang, L.Z.; Li, M.; Wu, F.Z.; Liu, Y.J. Research on Dynamic Changes and Mechanism of Surface Vegetation Coverage in Northeast China Based on SPOT NDVI. Arid Land Res. Environ. 2011, 25, 171–175. [Google Scholar]
  42. Shi, S.Y.; Yu, J.J.; Wang, F.; Wang, P.; Zhang, Y.C.; Jin, K. Quantitative contributions of climate change and human activities to vegetation changes over multiple time scales on the Loess Plateau. Sci. Total Environ. 2020, 755, 142419. [Google Scholar] [CrossRef]
  43. Herrmann, S.M.; Anyamba, A.; Tucker, C.J. Recent trends in vegetation dynamics in the African Sahel and their relationship to climate. Glob. Environ. Chang. 2005, 15, 394–404. [Google Scholar] [CrossRef]
  44. Wessels, K.J.; Bergh, F.; Scholes, R.J. Limits to detectability of land degradation by trend analysis of vegetation index data. Remote Sens. Environ. 2012, 125, 10–22. [Google Scholar] [CrossRef]
  45. Liu, Z.; Li, L.; Tim, R. Special climate data spatial interpolation software ANUSPLIN and its application. Meterol. Mon. 2008, 34, 92–100. [Google Scholar]
  46. Qian, L.; Lv, H.; Zhang, Y. Application and evaluation of interpolation method of daily meteorological elements based on ANUSPLIN software. J. Meteorol. Environ. 2010, 26, 7–15. [Google Scholar]
  47. Zhang, H.; Xu, C.G.; Wang, H. The response of vegetation changes to meteorological drought in Northwest China from 2001 to 2018. Scen. Geogr. Sin. 2020, 40, 1029–1038. [Google Scholar]
  48. Ma, J.; Zhang, C.; Guo, H.; Chen, W.; Yun, W.; Gao, L.; Wang, H. Analyzing Ecological Vulnerability and Vegetation Phenology Response Using NDVI Time Series Data and the BFAST Algorithm. Remote Sens. 2020, 12, 3371. [Google Scholar] [CrossRef]
  49. Wang, X.X.; Liu, Z.W.; Jiao, K.W. Spatiotemporal dynamics and driving factors of forest NDVI in Northeast China from 2000 to 2017. Chin. J. Eco 2020, 39, 2878–2886. [Google Scholar]
  50. Wang, Z.; Zhang, B.; Yang, G.; Wang, Z.; Zhang, S. response of wetland eco-security to land use change in western Jilin Province, China. Chin. Geogr. Sci. 2005, 15, 330–336. [Google Scholar] [CrossRef]
  51. Donohue, R.J.; Roderick, M.L.; McVicar, T.R.; Farquhar, G.D. Impact of CO2 fertilization on maximum foliage cover across the globe’s warm, arid environments. Geophys. Res. Lett. 2013, 40, 3031–3035. [Google Scholar] [CrossRef] [Green Version]
  52. IPCC. Climate Change 2014: Mitigation of Climate Change. Contribution of Working Group III to the Fifth Assessment Report of the Intergovernmental Panel on Climate Change; Edenhofer, O., Pichs-Madruga, R., Sokona, Y., Farahani, E., Kadner, S., Seyboth, K., Adler, A., Baum, I., Brunner, S., Eickemeier, P., et al., Eds.; Cambridge University Press: Cambridge, UK; New York, NY, USA, 2014. [Google Scholar]
  53. Camille, P.; Gary, Y. A globally coherent fingerprint of climate change impacts across natural systems. Nature 2003, 421, 37–42. [Google Scholar]
Figure 1. The elevation (a) and land cover type (b) of the study area. We used the MCD12Q1 product to reclass land cover type into seven types, and then figure out changed land in 20 years. In this paper, we focus on five vegetation types that did not change which included grassland, forest land, cropland, permanent wetland, and barren land.
Sustainability 13 08956 g001
Figure 2. Interannual variation in the NDVI values during the growing seasons for the different vegetation types in the study area.
Sustainability 13 08956 g002
Figure 3. Variations in parameters during the growing seasons: (a) Average NDVI values; (b) variation in the average NDVI values.
Sustainability 13 08956 g003
Figure 4. Coefficient of variation for the NDVI values during the growing seasons.
Sustainability 13 08956 g004
Figure 5. Annual variation in growing season precipitation and mean temperature.
Sustainability 13 08956 g005
Figure 6. The annual variation in average temperature and precipitation during the growing seasons; (a) Average temperature; (b) precipitation.
Sustainability 13 08956 g006
Figure 7. Partial correlation analysis between NDVI values and climatic factors; (a) Partial correlation coefficient of the NDVI with average temperature; (b) partial correlation coefficient of the NDVI with precipitation; (c) partial correlation between the NDVI and average temperature; (d) partial correlation between the NDVI and precipitation. In the legend of (c,d), significant correlation represents a partial correlation coefficient > 0 and p-value < 0.05, insignificant correlation represents a partial correlation coefficient < 0 and p-value < 0.05, significant negative correlation represents a partial correlation coefficient < 0 and p-value < 0.05, insignificant negative correlation represents a partial correlation coefficient < 0 and p-value > 0.05.
Sustainability 13 08956 g007
Figure 8. Trends in NDVI residual values for the period 2000–2019.
Sustainability 13 08956 g008
Figure 9. Average NDVI residual values across the study area: (a) 2000–2004; (b) 2005–2009; (c) 2010–2014; (d) 2015–2019.
Sustainability 13 08956 g009
Table 1. Relative changes in different cover types across the study area.
TrendGrasslandForest LandCroplandBarren LandPermanent Wetland
Significant increase14.73%8.18%15.43%40.78%48.75%
Insignificant increase78.82%91.01%80.47%18.27%33.04%
Insignificant reduction1.41%0.07%0.90%12.53%4.42%
Significant reduction5.04%0.74%3.20%28.42%13.79%
Table 2. Variation of different cover types.
TypesGrasslandForest LandCroplandPermanent LandBarren Land
Proportion of CV > 0.1574.45%0.32%12.36%6.26%6.61%
CV > 0.15 in own area3.24%0.01%0.2%52.78%76.08%
Acreage (km2)952.634.125158.1980.0684.5
Table 3. Correlation analysis of climatic factors and NDVI values for different vegetation cover types (* means p-value < 0.05).
Correlation CoefficientForest LandGrasslandCroplandBarren LandPermanent Wetland
Average temperature0.532 *0.3550.2880.10.015
Precipitation0.544 *0.539 *0.508 *−0.153−0.07
Publisher’s Note: MDPI stays neutral with regard to jurisdictional claims in published maps and institutional affiliations.

