1. Introduction
Scholars and politicians generally agree that knowledge is a key resource for innovation, which in turn is one of the main drivers of long-term economic growth. In the 19th National Congress of the Communist Party of China, President Xi called for unswervingly implementing the new development philosophy of innovative, coordinated, green, open and shared development, so as to support high-quality development. Innovation, the first of the five concepts, is the primary driving force for China’s development. As the Chinese economy enters the New Normal, the traditional advantages of growth drivers are gradually disappearing. As a combination of innovation-driven and green development, green technology innovation is an effective channel to burst through environmental and resource constraints and promote sustainable development. According to the definition of the World Intellectual Property Organization (WIPO), green technology innovation includes environment-related pollutant disposal technologies and technologies related to climate change mitigation. Different from traditional innovation, green technology innovation is an activity that aims to achieve coordinated development with resources and the environment, save resource consumption and reduce environmental pollution with the help of new ideas and new technologies, and obtain corresponding economic effects at the same time. Therefore, under the New Normal situation, China’s government how to achieve the goal of “innovation-driven and green development” has become an issue of great value to the times.
Academic works on innovation economics and economic geography have emphasized the path-dependent and spatially constrained nature of innovation for a long time [
1,
2,
3]. Knowledge creation is explained as the result of knowledge spillover caused by firm agglomeration. They believe that regional innovation output is bound to be related to local characteristics such as local economic level, scientific and technological level, institutional conditions and social culture. But there are other scholars who break the spatial limitations and emphasize the spatial correlation between regions. They point out that establishing external connections will facilitate regional access to new knowledge and play a key role in innovation [
4,
5,
6]. However, this part of the research is usually based on the theory of multinational corporations, focusing on the study of how firms establish global network connections through foreign investment and the knowledge flow in the value chain. It is clear that both the agglomeration within the local economic system and the global economic activities of multinational corporations can promote innovation. It can be said that the formation of innovation is actually the result of two processes: one is through the interaction within the local economic system, and the other is through the connection and interaction between local and external creators [
7]. However, at present, most of the literature focuses on the impact of domestic agglomeration and international connection on innovation in the context of globalization, while there is almost no literature that focuses on the impact of internal agglomeration and external network connection on innovation activities at the city level.
Based on the city level, this article applies the data of 263 prefecture-level cities in China to analyze the impact of intra-city industrial collaborative agglomeration and inter-city network connectivity on green technology innovation. Specifically, this article aims to clarify the interactions between them and under what circumstances intra-city industrial collaborative agglomeration and inter-city network connectivity create the most propitious or unpropitious conditions for local green technology innovation activities. A small number of existing studies on the regional level are focused on spatial spillover. Therefore, this article is helpful to understand the key factors influencing green technology innovation, especially for a developing country that is facing economic advance stress and environmental limitations and is striving to achieve sustainable development. The main conclusions of this article are as follows: Firstly, the intra-city collaborative agglomeration of manufacturing and producer services and the inter-city network connectivity are both important factors for local cities to realize green technology innovation and development. However, the influence of intra-city industrial collaborative agglomeration is heterogeneous, and it only shows a significant promoting effect in the eastern, central and medium-level cities of China. Secondly, there is a negative moderating relationship between intra-city industrial collaborative agglomeration and inter-city network connectivity. Inter-city network connectivity will weaken or even offset the benefits of green technology innovation brought by industrial collaborative agglomeration. At the same time, intra-city industrial collaborative agglomeration also greatly weakens the positive impact of connectivity. However, in the analysis of heterogeneity, it is found that this negative moderating effect is particularly serious in the eastern, high and low-level cities, while it is not significant for the central, western and medium-level cities.
The structure of this article is as follows: The second part is a literature review on the role of intra-city collaborative agglomeration and inter-city linkage in shaping local green technology innovation; The third part is the theoretical analysis and main assumptions of this article; The fourth part is the measurement method and data description of key indicators; The fifth part is the research method and econometric model; The sixth part discusses and analyzes the empirical results; The seventh part puts forward some policy suggestions on developing green technology innovation based on the main conclusions.
2. Literature Review
In recent years, an industrial agglomeration pattern with manufacturing and producer services co-developed has become popular across China, aiming to promote regional economic growth and productivity while promoting green technology innovation in the region. In fact, in the field of regional development and urban planning, scholars have always believed that industrial agglomeration is one of the key roles in explaining technological innovation and economic development. They hold the view that successful regional economic performance is mostly the result of the gradual and accumulative process of regional specialization of several activities or tasks. Regions focusing on related activities are inclined to be more innovative than those characterized by a large number of irrelevant industries [
8,
9]. Many studies have confirmed that industrial agglomeration makes innovation subjects close in space, which is conducive to knowledge sharing among firms and the construction of stable and strong cooperative innovation relationships [
10,
11,
12]. They claim industrial agglomeration stimulate the formation of various forms of innovation. However, with the continuous rationalization and upgrading of industrial structure, more scholars point out that the collaborative agglomeration between manufacturing and producer services is the key to sustainable green innovation [
13,
14,
15,
16,
17]. Firstly, the spatial agglomeration of the two industries can lead to a larger local market, which is conducive to the refinement of the division of labour between the upstream and downstream industry chains and the integrated development between the industries. Different types of knowledge and technology can conduct extensive and in-depth interaction and learning, which is beneficial to the refinement of technological innovation and the promotion of city green technology innovation [
18]. Secondly, manufacturing and producer services with industrial linkages can considerably increase productivity and management level, thus improving regional green technology innovation level [
19,
20]. On one hand, the manufacturing industry can promote the development of producer services. The manufacturing industry can not only effectively drive the market demand that is co-distributed with producer services but also has the function of location-based lock-in for producer services. On the other hand, the agglomeration of producer services can further activate the evolution of the manufacturing industry owing to the output of knowledge and human capital. The joint development of the two industries can enable the firms in the agglomeration area to obtain more innovation returns through complementary advantages [
21], thus promoting the overall green innovation development of the region.
However, an increasing number of scholars have found that establishing network connections between the local city and outside cities can stimulate deep learning and produce fundamental and revolutionary knowledge changes. It affects the formation of local innovation ability directly [
22,
23]. Intuitively, establishing a network between cities is like connecting pipes. It can accelerate the transmission and diffusion of information and help regions integrate diverse and complementary technological environments [
24]. Meanwhile, through close connections, local firms have the opportunity to access the support of outside experts, which enhancing organizational, managerial, and technical capabilities. This has laid the foundation for the firms to fight against lock-in dilemma and further product innovation and differentiation [
25]. Hence, inter-city linkages are seen to play a key role in improving the quality of local innovation. At present, the literature on the impact of city network on local innovation mainly focuses on analyzing the network structure characteristics of innovation space or studying the impact of spatial proximity on city’s innovation-related activities such as technology trading, innovation cooperation and knowledge transfer [
26,
27,
28,
29]. They believe that the nature of knowledge flow between cities is actually influenced by the collaborative effects of local and external regions in terms of cognition, technology, institutions and society [
4,
12,
30]. Local cities have a positive impact on technological innovation ability by establishing network connections with external cities [
31,
32,
33]. There are also some scholars who have studied the impact of cross-regional network connectivity on innovation from the perspective of firms. They found that the formation of alliance network through various forms of cooperation among firms, or ownership network within firms through transnational corporations, will improve the innovation ability of firms [
34,
35,
36,
37,
38,
39]. Networks can direct the flow of information and resources from one location in the social structure to another. Additionally, firms that are at the confluence of information and resource flow networks would gain more strategic benefits, thereby promoting the output of their various innovations [
40,
41,
42,
43]. Therefore, it can claim that inner-city network connectivity is crucial for improving the green technology innovation capacity. However, only a small number of articles focus on green technology innovation. Liu et al. [
44] tried to conduct a social network analysis to test the spatial correlation and spillover effects of green innovation development at the provincial level and emphasized the significant promoting effects of geographical proximity, cognitive proximity, institutional proximity and technological proximity on green innovation.
In summary, innovation in a region can be generated either through the intra-city industrial collaborative agglomeration or inter-city network connectivity. If there is only an intra-city industrial collaborative agglomeration, knowledge will be locked within a certain range of flow. As time goes on, the interactions between firms within the region become ossified and fail to stimulate innovation [
45]. Some firms may even place their hopes on the wrong technology, thus losing their competitive advantage and leading to the reduction of the local agglomeration effect. Similarly, although access to external resources can strengthen the internal capabilities of the agglomeration and stimulate internal restructuring. The improvement of a region’s innovation ability depends not only on its connections level with the outside but also on its capability to learn and internalize the new knowledge [
46,
47,
48,
49]. It can be said that both intra-city industrial collaborative agglomeration and inter-city network connectivity are indispensable for local green technology innovation.
At present, the joint effect of intra-city and inter-city forces on innovation has been recognized by the academic community, who believe that regional innovation is the result of close communication and long-distance interaction. A region’s ability to acquire, understand, absorb and reuse external knowledge is considered as essential to maintaining and improving its local industrial structure and competitiveness. Most scholars believe that intra-city activities and inter-city activities should be collaborative and complementary. Inter-city networks can provide diverse and relevant information sources for a specific city and stimulate explicit and externalization of tacit knowledge. Then, the city upgrades its level of agglomeration by integrating internal and external knowledge resources [
23]. However, for now, this kind of article mainly focuses on the firms. They point out that the innovation firms can decode the coded knowledge and tacit knowledge from multiple regions and countries by combining the local knowledge capital with the knowledge resources of similar regions in the international economy, thus generating a virtuous circle of knowledge, innovation, competitiveness and export [
48,
49]. Based on a high degree of local specialization, transnational firms use global network connectivity to obtain foreign capital and technology support, thus having a positive impact on the economic system in which the parent company is located [
50]. It can be argued that local forces and external networks complement each other to promote regional innovation success [
51]. However, establishing networking with the outside world, as a means of intervention, would have some impacts on the local balance. Some scholars believe that there is heterogeneity in the collaborative and complementary relationship between intra-city agglomeration activities and inter-city network connectivity. For some cities, external connectivity may offset the benefits of intra-city collaborative agglomeration. For instance, Blanc and Sierra [
52] point out that while acquiring and directing external knowledge in a regional economy can enrich local innovation capacity, it may also damage the role of internal industrial agglomeration in determining the direction of technological development. Burger and Meijers [
53] acknowledge that the existence of inner-city networks can produce collaboration and complementarity but they point out that not every city benefits equally from a high level of Internet embeddedness. Only small and medium-sized cities that are well-positioned can absorb the benefits of larger cities.
3. Theoretical Analysis and Research Hypothesis
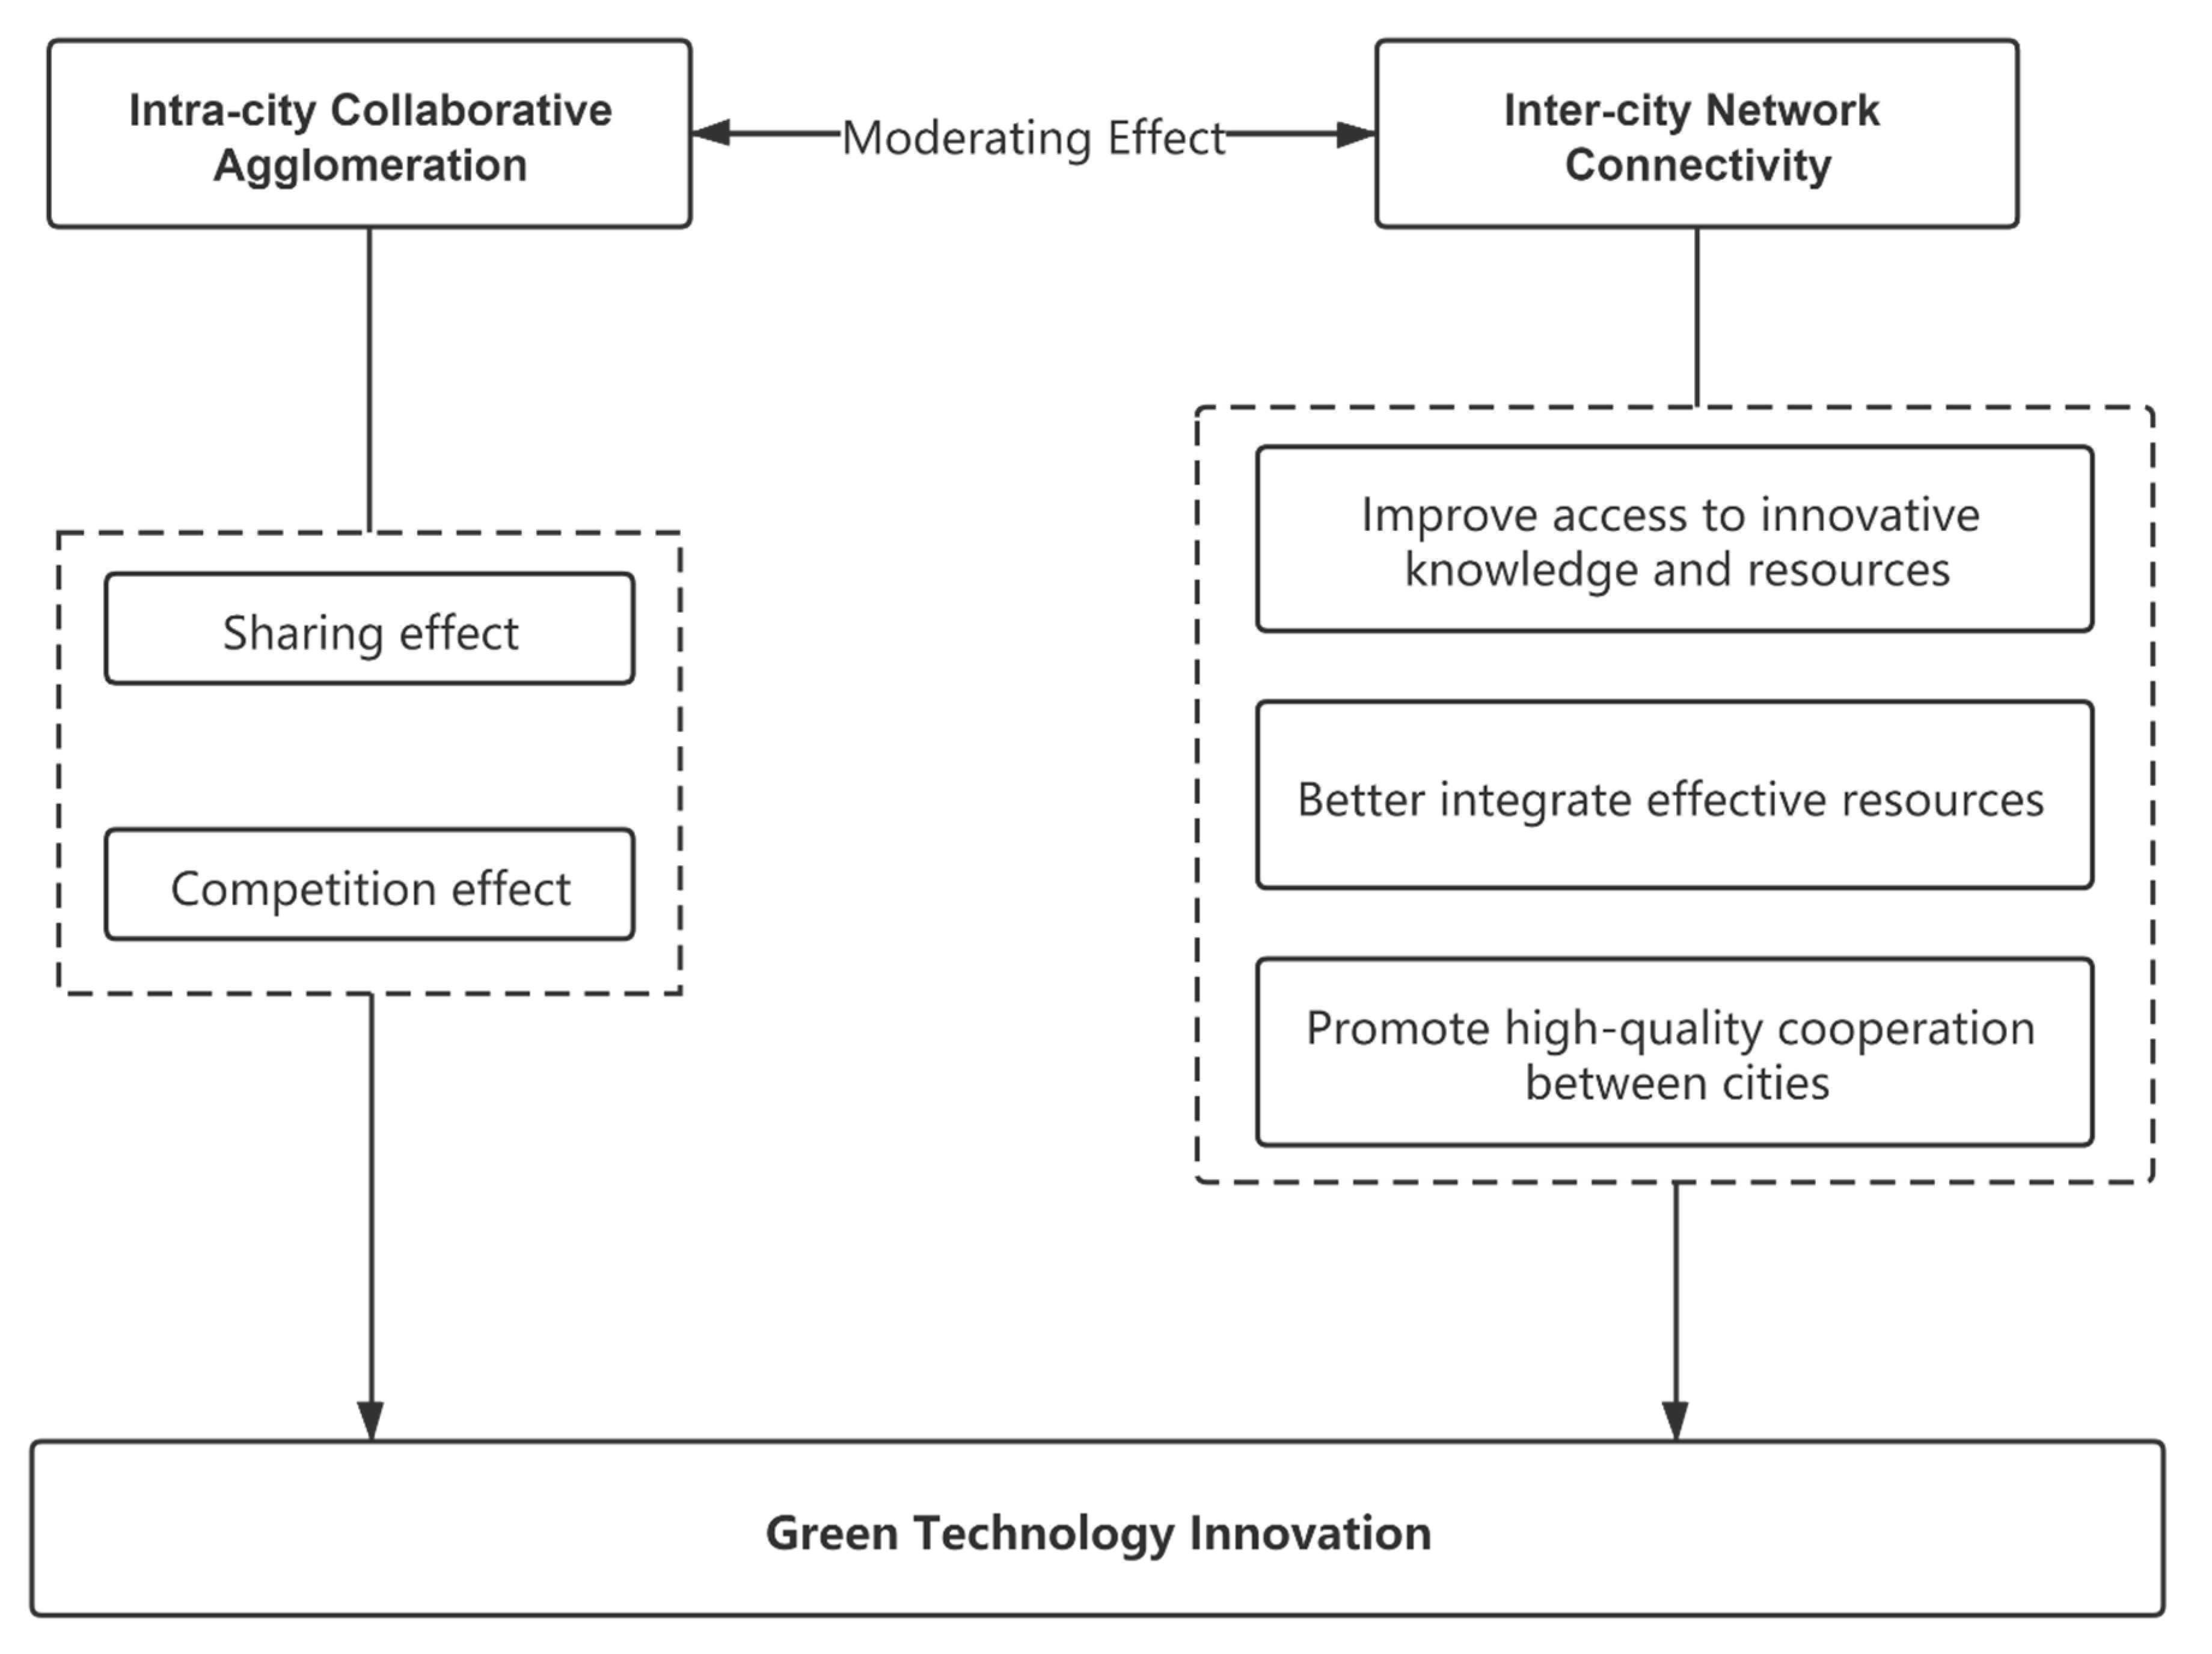
Combined with economic intuition and the literature analysis above, this article argues that the green technology innovation of a city is actually the result of knowledge transfer and sharing within and between cities. Hence, this article focuses on analyzing the influence of both intra-city collaborative agglomeration and inter-city network connectivity on the level of green technology innovation in the local city. The logical mind mapping of this article is shown in
Figure 1.
This article argues that the intra-city collaborative agglomeration of manufacturing and producer services produce an effect on local green technology innovation mainly through sharing effect and competition effect [
16,
54]. Firstly, the agglomeration of the two industries represents a high degree of concentration and sharing of knowledge elements and professional human resources, which creates abundant employment opportunities and increases economic income for the city. It plays a strategic role in the transformation of the urban development model, the enhancement of innovation ability and the improvement of the environment. Simultaneously, the positive externality of industrial agglomeration makes it easy for firms to share resources, complement each other’s advantages and share risks and costs. This will help firms to form a cooperative relationship of mutual learning. Additionally, accelerating the speed of knowledge production, transmission and accumulation will improve the innovation ability of firms and produce group performance. Secondly, the agglomeration of the two major industries can stimulate the flow of professional information within the region that reduce the cost of information search and communication. Thus, the crowding-out effect of cost restrictions on green innovation will be reduced. Low-cost sharing among firms will encourage them to take the path of differentiated competition. For getting excess returns, firms can only seek innovation breakthroughs. The formation of such a benign competitive environment will promote industrial optimization and structural upgrading eventually. In conclusion, in the context of environmental pollution and resource shortage, focusing on green technology innovation will be the finest selection for firms to obtain excess returns. Based on the above analysis, this paper suggests the following hypothesis:
Hypothesis 1 (H1): The intra-city collaborative agglomeration of manufacturing and producer services can promote the innovation of green technology. The higher the degree of industrial collaborative aggregation in a city, the stronger the green technology innovation ability of the city.
In addition, a city’s connectivity in the inter-city network depends on the breadth and depth of its connections with other cities. The more nodes and convenient contact a city has with other cities, the higher its connectivity will be. High connectivity allows the city to access a wider range of innovative resources and information. This article claims that inter-city network connectivity affects green technology innovation from three aspects [
43,
44]. Firstly, embedding into the city network can improve the city’s access to innovative knowledge and resources, which will help the city accumulating knowledge related to green technology innovation. Having a high level of connectivity means that the city is at the centre of a huge information and knowledge network, giving it access to a wealth of green innovative knowledge and resources. This will help to reduce the information cost of firms within the city so that firms have obvious competitive advantages. Secondly, cities will have opportunities to get in touch with multiple sources of information through the city network. They can not only access the critical resources and knowledge that flow in, but also have the relative right to control the direction of the diffusion and dissemination of these resources and knowledge. So, the high connectivity a city is, the more power it has to control and dictate the elements of green innovation. High connectivity means a leading position in the acquisition of green innovation resources, which enables a city to better integrate effective resources related to green technology innovation and improve innovation efficiency. Finally, inter-city network connectivity can promote high-quality cooperation between cities and facilitate knowledge sharing and complementarity. Collaborations between cities will facilitate the flow of innovation elements and the diffusion of innovation, thus greatly increasing the capacity of green technology innovation. In summary, inter-city network connectivity gives cities the ability to acquire and utilize external knowledge and accelerates the generation of green technology innovation knowledge. Meanwhile, it can enhance the attractiveness of cities to promote a high level of green technology innovation cooperation between cities. Therefore, this article draws a hypothesis about the relationship between inter-city network connectivity and city green technology innovation capability as follow:
Hypothesis 2 (H2): Inter-city network connectivity makes a positive difference to green technology innovation. The higher the inter-city network connectivity of a city, the stronger the green technology innovation ability of the city.
As mentioned above, inter-city connections will affect the role of intra-city industrial collaborative agglomeration in the green technology innovation process of the local city. Generally, the connection with external cities increases the inflow channel of innovative elements for the local city, which contribute to the inflow and integration of complementary knowledge and provide information resource advantages for internal firms. Meanwhile, firms in the local city can effectively absorb and use the knowledge from the outside city and transform it into local green technology innovation capacity, thus helping the local city to breed new ideas and new knowledge [
51]. It is believed that inter-city network connectivity and intra-city industrial collaborative agglomeration are synergistic in terms of green technology innovation returns of the local city. Inter-city network connectivity has an optimistic moderating influence on industrial collaborative agglomeration, which can greatly enhance its promoting impact on green technology innovation. Nevertheless, some scholars point out that external connections will replace internal communication. It means that inter-city network connectivity can destroy the internal collaboration of the local city, block the spread of knowledge within the city, increase information asymmetry, and increase the cost of searching and obtaining information for firms [
53]. Under these circumstances, it is argued that inter-city network connectivity produces a negative moderating impact on intra-city industrial collaborative agglomeration, thus forcing the local city to lose the advantages brought by collaborative agglomeration. Therefore, this article formulated the following two hypotheses to discuss the moderating effect of inter-city network connectivity on intra-city industrial collaborative agglomeration:
Hypothesis 3a (H3a): The higher the inter-city network connectivity of a city, the higher the green technology innovation benefits it can obtain through the intra-city collaborative agglomeration of manufacturing and producer services. Because the inter-city network connectivity produces an optimistic moderating impact on the intra-city industrial collaborative agglomeration.
Hypothesis 3b (H3b): The higher the inter-city network connectivity of a city, the lower the green technology innovation benefits it can obtain through the intra-city collaborative agglomeration of manufacturing and producer services. Because the inter-city network connectivity produces a negative moderating impact on the intra-city industrial collaborative agglomeration.
On the contrary, though, connecting to the city network can introduce a variety of green innovative elements to the local city and enhance its capacity for green technology innovation. However, the degree of intra-city industrial collaborative agglomeration will also affect the ability of local firms to absorb and transfer foreign knowledge, thus affecting the green technology innovation of the local city. Generally, the collaborative agglomeration of manufacturing and producer services means that firms within the city have a high degree of industrial relevance, and they have an almost homogeneous cognitive basis [
19]. It helps local firms to improve the efficiency of acquiring, absorbing and using external knowledge, thus reducing the cost of collecting information and knowledge. Therefore, it can be concluded that intra-city industrial collaborative agglomeration has a positive moderating impact on the connectivity of the inter-city network, which can increase the local city’s green technology innovation obtained by the inter-city network. However, some scholars have found that ineffective industrial collaborative agglomeration will aggravate the unbalanced development among firms instead of bringing about scale effect. Disadvantaged firms in the local city will face difficulties in technology, capital and market [
54]. The higher the degree of this ineffective agglomeration, the larger the gap between the leading firms and the marginal firms. The inflow of external innovation resources will be absorbed by leading firms, whereas the situation of firms without information resource advantages will become more difficult. As a result, marginal firms are likely to give up innovation. This situation will lead to a reduction in the overall competitiveness of the local city, which will further inhibit the output of green technology innovation. Based on the above analysis, this article puts forward the following hypotheses:
Hypothesis 4a (H4a): The higher the intra-city collaborative agglomeration of manufacturing and producer services in a city, the higher the green technology innovation benefits obtained through inter-city network connectivity. Because intra-city industrial collaborative agglomeration plays a positive moderating role.
Hypothesis 4b (H4b): The higher the intra-city collaborative agglomeration of manufacturing and producer services in a city, the lower the green technology innovation benefits obtained through inter-city network connectivity. Because intra-city industrial collaborative agglomeration plays a negative moderating role.
6. Analysis of Empirical Results
Before the regression analysis of all models, this article carried out a multicollinearity test on the panel data. The results show that the maximum variance inflation factor is 1.94 (as shown in
Table 2), less than 10, so there is no need to worry about the existence of multicollinearity. Moreover, the results of the likelihood-ratio test and Hausman test strongly suggest the panel negative binomial regression model with fixed effects should be used.
6.1. Baseline Regression Analysis
The results of baseline regression (Equation (6)) are shown in
Table 3. Under the premise of using the city fixed-effect model, each variable was tested one by one to ensure the robustness of the regression results. In general, the intra-city collaborative agglomeration of manufacturing and producer services and the inter-city network connectivity are two key factors affecting green technology innovation. According to the regression results, no matter how many control variables are added, the coefficients of industrial collaborative agglomeration (Coag) and connectivity (Access) are significantly positive at the confidence level of 1%. This is consistent with Hypotheses 1 and 2, that is, both intra-city industrial collaborative agglomeration and inter-city network connectivity can promote the improvement of green technology innovation ability. In the case of Column (8), the coefficient of intra-city collaborative agglomeration between manufacturing and producer services is 0.318, which means that every 1% increase in collaborative agglomeration will increase the green technology innovation output of the city by 137.4% (=exp (0.318)). This means that the industrial clusters in Chinese cities are currently in an effective agglomeration state, which strongly stimulates the growth of green technology innovation through the sharing effect and the competition effect. Meanwhile, the coefficient of inter-city network connectivity is higher, which is 1.61. It indicates that every 1% increase in network connectivity will increase the green technology innovation output of a city by 500.3% (=exp(1.610)). High inter-city network connectivity endows the city with the ability to acquire and utilize external knowledge, accelerates the generation of innovative knowledge and promotes green technology innovation. Moreover, it is found that the positive impacts of industrial collaborative agglomeration and network connectivity on green technology innovation is basically stronger than other control variables.
Furthermore, it is found that the number of green patents (Green) has a significant positive correlation with government support (Sci_GDP), human capital (hiStudent_Pop), communication technology development level (Internet) and air quality (PM25). It shows that the government’s investment in science and technology produces a driving influence on green innovation activities in society. The larger the investment of scientific research funds, the more favourable it is to the cultivation of technical innovation talents and the improvement of the scale of technological innovation. Manpower, as the carrier of knowledge and technology, is the source of green technology innovation and is also an important reason for the agglomeration of highly skilled personnel and high-tech industries. The high human capital stock is obviously beneficial to improving the green technology innovation of the city. Meanwhile, the development of the Internet breaks the limitation of time and space, which can realize long-distance non-face-to-face real-time communication. It plays a role in promoting the dissemination and diffusion of some knowledge, thus exerting a positive impact on green technology innovation. In addition, PM 2.5 also has a significant boost to green technology innovation, although the impact coefficient is low. It shows that air quality issues can arouse the attention of governments and firms to green technology innovation. However, the result suggests that the influence of opening to the outside world is low, negative but not significant. There are some possible explanations. Firstly, the inflow of external capital may bring about polluting industries. Some cities, that seek economic development, would try to attract foreign capital by lowering environmental standards.
In order to seek economic development, some cities try to attract foreign capital by lowering environmental standards, which would aggravate environmental pollution and makes FDI fail to exert the effect of green innovation. In this case, the inflow of FDI aggravates environmental pollution, instead of exerting a green innovation effect. Secondly, the new knowledge and technology that come with the inflow of external capital may be concentrated in a few core foreign firms. Most of these firms are profit-oriented and do not spend too much manpower and money on environmental protection. Besides, they absorb most of the excellent technical personnel because of their high salaries. This leads to the brain drain of the inferior firms and further inhibits the green innovation behaviour of the inferior firms.
6.2. Moderating Effect Analysis
By adding interaction terms (as shown in Equation (7)) to the baseline regression, this article verifies whether there is a moderating effect between the intra-city industrial collaborative agglomeration of manufacturing and producer services and the inter-city network connectivity. The variables Coag and Access are both centralized before the multiplication. As shown in
Table 4, column (1), as a reference frame, does not add interaction terms, while column (2) shows the regression results of the moderating effect model. It is observed that the value of Log-likelihood increases from −6141 in column (1) to −6129 in column (2). Meanwhile, the coefficient of the interaction term (CA_mean) in column (2) is significantly negative at the 1% confidence level. This proves that there is a significant negative moderating effect between Coag and Access. In order to further explain the negative regulation between industrial collaborative agglomeration and network connectivity (hypotheses H3b and H4b), this article conducts a new parameter transformation for the interaction term by referring to the practice of Ascani et al. [
51]. Specifically, the moderating variable subtracts a particular value before multiplying it by the moderated variable. This particular value is the 10th, 25th, 50th, 75th, and 90th percentiles of the moderating variable, in turn. As a result, the regression coefficient of the moderated variable can be directly interpreted as to its marginal impact on green technology innovation when the moderating variable is at a specific value.
Table 5 reports the regression results when inter-city network connectivity is the moderating variable and intra-city industrial collaborative agglomeration is the moderated variable. In the case of low network connectivity (when Access equals the 10th percentile), the impact of industrial collaborative agglomeration is positive and extremely significant (at 1% confidence level). The marginal impact of industrial collaborative agglomeration on green technology innovation is 2.115 (exp(0.749)). When the network connectivity increases, the marginal impact decreases but is still significant. However, when the network connectivity reaches the 75th percentile or above, the significance of the positive effects of industrial collaborative agglomeration will disappear. It means that inter-city network connectivity does not enhance the positive impact of intra-city collaborative agglomeration on green technology innovation but weakens the benefits of green technology innovation brought by sharing effect and competition effect. Therefore, hypothesis H3b is confirmed. The higher the inter-city network connectivity, the lower the benefits of green technology innovation that the city obtains through the intra-city collaborative agglomeration of manufacturing and producer services.
Table 6 shows the regression results when the intra-city collaborative agglomeration of manufacturing and producer services is the moderating variable. From columns (1) to (5), it can be seen that no matter how the industrial collaborative agglomeration changes, the impact of inter-city network connectivity on green technology innovation is always significantly positive at the 1% confidence level, but the coefficient drops from 1.871 in column (1) to 1.476 in column (5). When the industrial collaborative agglomeration is equal to the 10th percentile, the marginal impact of network connectivity on green technology innovation is 6.495 (exp (1.871)). But when it increases to equal to the 90th percentile, the marginal impact of network connectivity decreases to 4.375 (exp (1.475)). It means that although industrial collaborative agglomeration does not completely offset the promoting effect of network connectivity on green technology innovation, it weakens the positive effect of network connectivity to some extent. It can be said that the local firms in collaborative agglomeration are not able to absorb and utilize the innovative elements brought by the inter-city network. Hypothesis H4b has been confirmed. The higher the intra-city collaborative agglomeration between the manufacturing industry and producer services in a city, the lower the green technology innovation benefits obtained by the city through inter-city network connectivity.
6.3. Heterogeneity Test
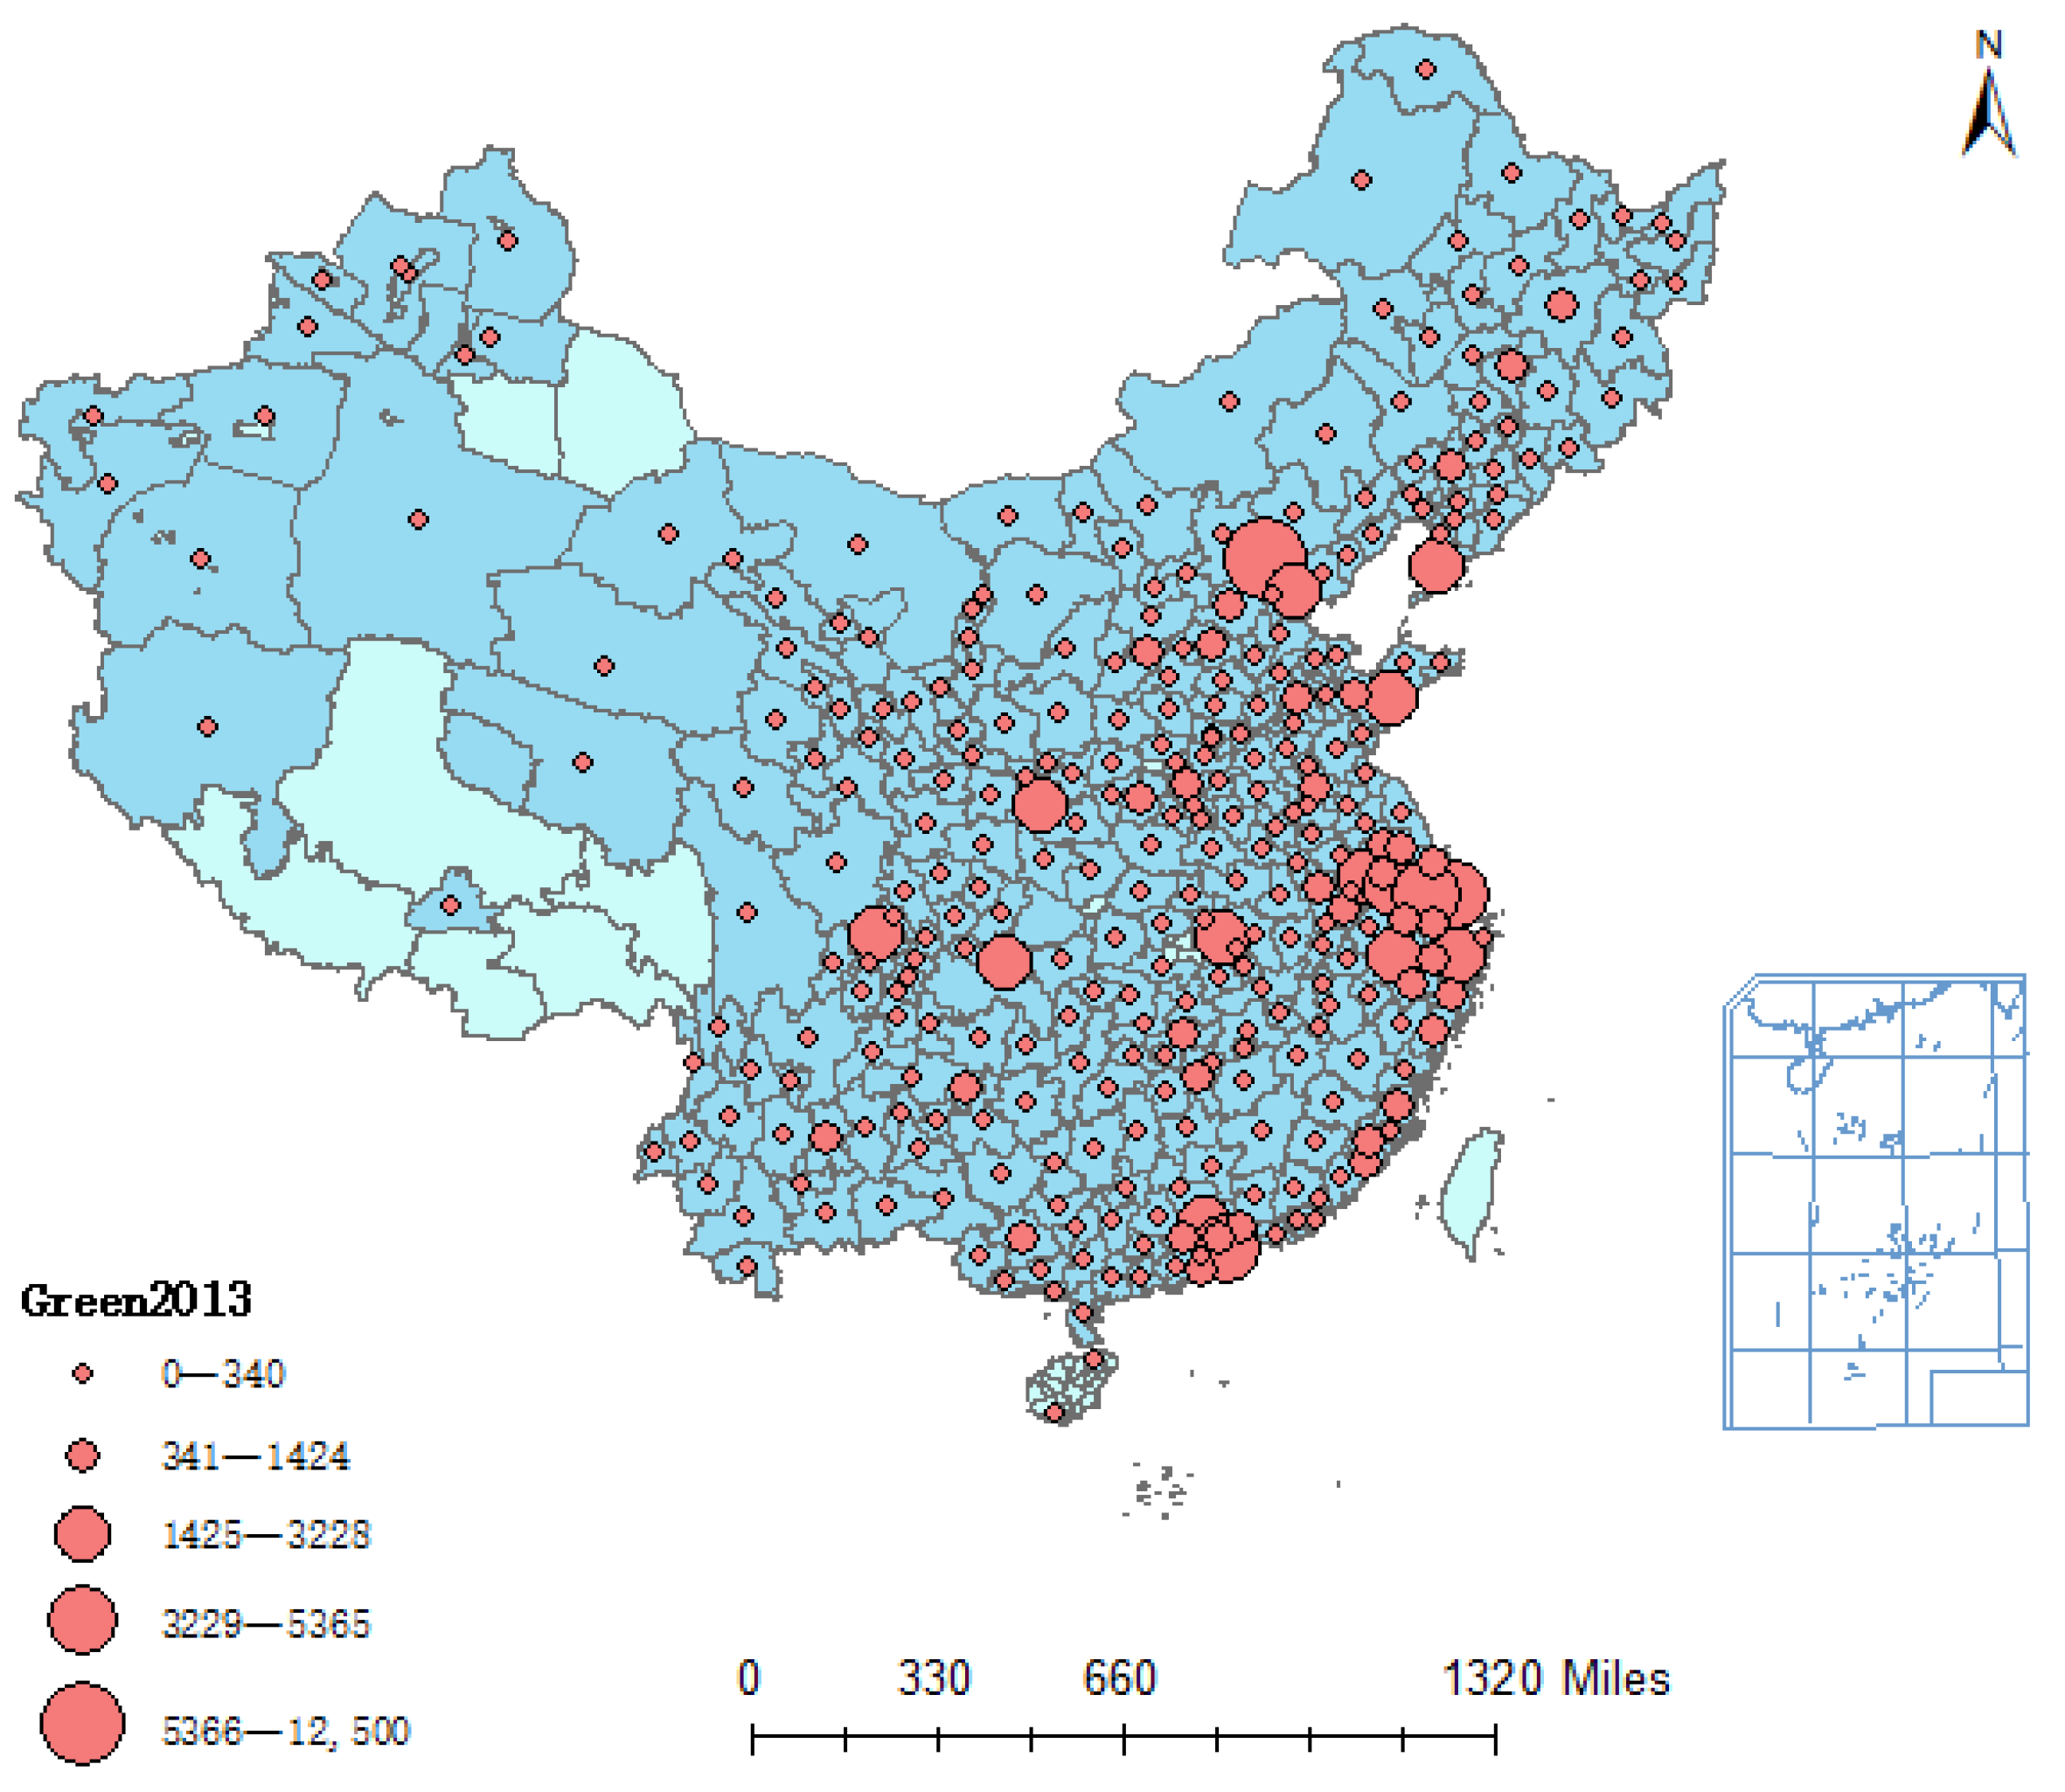
The regional distribution of green patents in China shows an unbalanced state, especially in the eastern coastal cities. It is necessary to further explore whether there are differences in the impact of intra-city industrial collaborative agglomeration and inter-city network connectivity on green technology innovation of different types of cities. Therefore, this article decides to examine the heterogeneity of the influence of industrial collaborative agglomeration and network connectivity from the perspectives of geographical division and economic development. Firstly, according to the standards of the National Bureau of Statistics of China, the samples are divided into three parts: eastern China, central China and western China. Regressions by subsamples are shown in
Table 7. Secondly, the samples are divided according to the GDP value of cities in 2013. A city with a GDP of more than 200 billion yuan is defined as a high-level city; a city with a GDP of more than 1000 yuan but less than or equal to 200 billion yuan is a medium-level city, and a city with a GDP of fewer than 100 billion yuan is a low-level city. The specific regression results are shown in
Table 8.
In summary, inter-city network connectivity has a significant promoting effect on all kinds of cities, while the intra-city collaborative agglomeration of manufacturing and producer services has heterogeneous effects on green technology innovation. Specifically, for the eastern, central and medium-level cities, industrial collaborative agglomeration and network connectivity can increase the level of green technology innovation. However, for the eastern cities, there is a significant negative regulation effect between them. It probably dues to the connection of cities increasing the fluidity of innovation elements, destroying the stable cooperation relationship of internal industries, and increasing the difficulty of green technology innovation. Meanwhile, it is found that the influence of industrial collaborative agglomeration is not significant for the western, high and low-level cities. A possible explanation is that for the western and economically backward areas, industrial collaborative agglomeration is still in an inefficient agglomeration state. It is unable to achieve scale effect and spillover effect, and thus unable to promote green technology innovation. For cities with high economic development levels, the collaborative agglomeration development of industries has reached the bottleneck stage. So, there is no room for additional green technology innovation in the short term. In addition, for cities with high and low levels of development, industrial collaborative agglomeration and network connectivity also have a negative moderating effect. This may be due to the failure of industrial collaborative agglomeration, which reduces the efficiency of innovation resource allocation and innovation motivation, thus weakening the promoting effect of network connectivity.
6.4. Endogeneity
There may be cyclic causality between green technology innovation and intra-city industrial collaborative agglomeration or inter-city network connectivity. Firstly, the essence of the spatial agglomeration of the two industries is the agglomeration of knowledge. Through various forms of exchanges, firms can achieve the purpose of mutual learning and joint innovation, thus promoting the innovation of green technology. This article argues that when the collaborative agglomeration reaches a certain level, innovation of green technology will in turn become the driving force for further development of the agglomeration. Because the agglomeration of green technology innovation in a region has a strong spillover. It can stimulate the generation of new ideas and new knowledge, improve the core competitiveness and innovation level of firms in the region, and then promote the agglomeration of producer services. Next, green patents are mainly researched and developed by universities and large firms, which are generally located in developed cities. Meanwhile, the traffic conditions of developed cities are relatively superior, which leads to the possibility of causal interaction between network connectivity and green technology innovation. If these causal relationships are significant, it is reasonable to believe that the collaborative agglomeration of manufacturing and producer services and the network connectivity are endogenous explanatory variables. And it is necessary to find appropriate instrumental variables to solve the endogeneity problem.
Before using instrumental variables, the endogeneity test of the two main explanatory variables was carried out. The results show that the intra-city industrial collaborative agglomeration accepts the null hypothesis at 10% confidence level, while the inter-city network connectivity rejects the null hypothesis at 5% confidence level. Therefore, it is believed that network connectivity is an endogenous explanatory variable, but industrial collaborative agglomeration is not. One and two lag periods of network connectivity are selected as instrumental variables to test. The model is first transformed by deviation and then estimated by GMM. Moreover, the model successfully passes the under-identification test, the weak identification test and the over-identification test. They prove that the use of lagged terms of endogenous explanatory variables as instrumental variables is effective and significant. The specific regression results are shown in
Table 9 and still consistent with the previous conclusion.
6.5. Robustness Test
In order to test the validity of the results, two methods, including replacing the econometric model and eliminating outliers, are used to conduct a robustness test. Columns (1) and (2) in
Table 10 are the results of a panel Poisson regression using fixed effects. Columns (3) and (4) report the regression results of the subsamples with four municipalities and 25 provincial capitals excluded. Columns (5) and (6) are the regression results of subsamples that exclude the top 50 cities according to the number of green patent applications of cities in 2013. By observing the regression coefficient, it can be seen that the influence coefficients of the intra-city collaborative agglomeration of manufacturing and producer services and the inter-city network connectivity on the number of green patents are consistent with the results of the baseline regression (significantly positive). Moreover, the coefficients of the interaction term are significantly negative from columns (1) to (6). It indicates that the results of this article are robust. Further observation shows that the coefficients of the variables Coag and Access in Column (3) are almost identical to the baseline regression. It indicates that the promoting impact of industrial collaborative agglomeration and network connectivity on green patents is not affected by the administrative level of the city. However, their results in Column (5) are slightly lower than those in the full sample. It indicates that for the cities with relatively developed green technology innovation, the promoting effect of industrial collaborative agglomeration and network connectivity will be stronger.
7. Conclusions and Policy Recommendations
This article discusses the development of green technology innovation under the intra-city collaborative agglomeration of manufacturing and producer services and inter-city network connectivity. It will provide an explanation of the different roles played by internal and external sources of innovative knowledge. Based on the research of prefecture-level cities in China, this article confirms that intra-city industrial collaborative agglomeration and inter-city network connectivity both have significant promoting effects on green technology innovation. The regression results show that the green technology innovation of the city will increase by 137.4% for every 1% increase of industrial collaborative agglomeration. This conclusion confirms the view that the industrial collaborative agglomeration within cities improves the level of green technology innovation in cities. Intra-city industrial collaborative agglomeration can not only improve the efficiency of resource allocation and utilization to promote knowledge spillover, but also promote the formation of healthy competition to promote industrial optimization and structural upgrading. However, further heterogeneity test showed that its promoting effect was only significant in the eastern, central and medium-level cities. Similarly, for every 1% increase in inter-city network connectivity, the green technology innovation output of a city will increase by 500.3%. It proves that inter-city network connectivity is also an important factor in promoting green technology innovation. Moreover, its positive impact is significant for all types of cities. So, it can be said that embedded in the network can enable the local city to acquire and use the external innovation elements, thus accelerating the generation of innovative knowledge. However, this article finds that there is a negative moderating relationship between intra-city industrial collaborative agglomeration and inter-city network connectivity. Network connectivity does not enhance the positive impact of intra-city collaborative agglomeration on green technology innovation but weakens the benefits of green technology innovation brought by sharing effect and competition effect. Besides, when the network connectivity is higher than the 75th percentile, the positive effect of industrial collaborative agglomeration becomes less significant. Similarly, although industrial collaborative agglomeration has not completely offset the promoting effect of inter-city network connectivity on green technology innovation. It has greatly weakened the positive effect of network connectivity. But, in the analysis of heterogeneity, it is found that this negative regulating effect is particularly serious in the eastern, high and low-level cities, while it is not significant for the central, western and medium-level cities.
Therefore, in order to achieve the goal of “innovation-driven and green development”, this article puts forward the following policy recommendations based on the above conclusions:
Firstly, Since the inter-city network connectivity can significantly improve green technology innovation, the government should consider breaking through the scope of urban space when planning green development. It means that the local city should actively integrate into domestic inter-city networks and strengthen its connectivity with external cities. Specifically, the government can expand the city’s network connectivity by strengthening the construction of rapid transportation infrastructures such as high-speed rail and expressway. It will promote the two-way flow of green technology innovation elements between the local city and external cities, thus improving the overall green innovation technology in the region or even in the country. In addition, the government can also encourage local firms to cooperate with foreign organizations, such as firms, universities and research institutions, to carry out green innovation activities. It is beneficial to the integration and sharing of information and resources, thus promoting the precise alignment of the green industrial chain and the green innovation chain.
Secondly, the suggestions for industrial development in different places are various, because the influence of the collaborative agglomeration of manufacturing and producer services is obviously heterogeneous. For these western and low-level cities, the government should actively promote the high-end, intelligent and green development of the local manufacturing industry, and guide the integrated development of related supporting producer services at the same time. Moreover, the government needs to formulate corresponding support policies such as involving special funds, land supply, talent training, and optimize the business environment, so as to provide policy support for the integrated development and effective agglomeration of the two industries. Only in this way can the overall competitiveness of the two industries be improved, and the profit space is expanded so that firms can build a virtuous cycle system between differentiated competition and green technology innovation. For other cities, the government should make more efforts to improve the level of collaboration between manufacturing and producer services in the cluster and further improve the whole industrial chain of the integrated development of manufacturing and producer services. When the two industries form the interactive development of industrial symbiosis and resource sharing, the industrial structure can be optimized, the development model can be transformed and the growing power can be transformed. The result is to enhance the city’s ability of green technology innovation, which leads to the continuous improvement of the competitiveness of the whole industrial value chain.
Finally, considering that there is a significant negative moderating relationship between the intra-city industrial collaborative agglomeration and the inter-city network connectivity, this article believes that the government should pay more attention to the development of the internal and external linkage. It means that the government should support the coordinated development of local manufacturing and producer services and encourage them to accelerate industrial transformation and upgrading for the purpose of reducing carbon emissions. In addition, the government should continue to increase the construction of transportation infrastructure, so as to improve the interconnection between cities and reduce the cost of the human capital, logistics and information in the network. Only by avoiding competition for innovation resources can cities achieve win-win cooperation.


