Abstract
Aerial surveys have always significantly contributed to the accurate mapping of certain geographical phenomena. Remote sensing opened up new perspectives in nature monitoring with state-of-the-art technical solutions using modern onboard recording equipment. We developed the technical background and the methodology that supports detailed and cost-effective monitoring of a network of natural areas, thereby detecting temporal changes in the spatial pattern of land cover, species, biodiversity, and other natural features. In this article, we share our experiences of the technical background, geometric accuracy and results of comparisons with selected Copernicus Land Monitoring products and an Ecosystem Map based on the testing of our methodology at 25 sites in Hungary. We combined a high-spatial-resolution aerial remote sensing service with field studies to support an efficient nature conservation monitoring network at 25 permanent sites. By analyzing annually (or more frequently) orthophotos taken with a range of 0.5–5 cm spatial resolution and 3D surface models of aerial surveys, it is possible to map the upper canopy of vegetation species. Furthermore, it allows us to accurately follow the changes in the dynamics at the forest edge and upper canopy, or the changes in species’ dominance in meadows. Additionally, spatial data obtained from aerial surveys and field studies can expand the knowledge base of the High-Resolution Aerial Monitoring Network (HRAMN) and support conservation and restoration management. A well-conducted high-resolution survey can reveal the impacts of land interventions and habitat regeneration. By building the HRAMN network, nature conservation could have an up-to-date database that could prompt legal processes, establish protection designation procedures and make environmental habitat management more cost-effective. Landscape protection could also utilize the services of HRAMN in planning and risk reduction interventions through more reliable inputs to environmental models.
1. Introduction
1.1. Motivations
In an information society, it is crucial to know about the actual state, patterns, and trends of our environment [1,2,3]. The role of ecosystem services and the conservation status of natural habitats in decision-making and legislation is increasing [4,5,6]. Ecosystems can provide a range of services that are of fundamental importance to human well-being, health, livelihoods, and survival [7,8]. Applying the latest remote sensing technologies in an innovative way can expand the range of monitoring tools and enhance nature conservation and scientific research efficiency. Demands on the use of high-resolution remote sensing procedures and spatial data in nature conservation projects [9,10,11,12], in environmental and restoration ecology [13,14,15], mapping and monitoring natural phenomena are growing [16,17,18,19]. However, data collection is confronted with the controversial challenges of increasing spatial resolution, higher frequency of surveys, and ever-faster evaluation providing readily available information on increasingly large areas [20,21,22,23,24,25,26,27]. Our team is continuously experimenting with the latest technologies and workflows to find the most cost-effective, innovative solutions adapted to the different spatial resolutions demanded by nature conservation monitoring [28,29,30,31,32] which comply with legal requirements.
1.2. General Background
The transformation, fragmentation, and degradation of valuable natural areas [33,34,35] have led to a dramatic loss of biodiversity worldwide [36]. The naturalness of the vegetation has decreased continuously over past centuries and decades [37], and the cost of potential restoration is constantly growing.
The socio-ecological resilience and climate change tolerance of natural areas are much higher than artificially created or degraded areas [38,39,40]. Global changes and changing disturbance regimes have substantial impacts on the resilience and stability of forests, which seem to be higher in natural stands due to the high diversity of their native species, structures, functions, and patterns [41,42]. Human society can benefit from the protection of natural habitats via the various ecosystem services provided by them [43,44]. The protection of natural and cultural values and ecosystem services can often be supported by economic arguments [45,46]. Nowadays, environmental interventions that trigger positive and sustainable ecosystem processes are also economically viable [47,48,49,50,51,52]. In contrast, projects that seem to be successful throughout the implementation phase can fail in the long term if biological and ecosystem processes are contradictory [53]. Various socio-economic movements and actions can also be strongly supported by clear visual messages like a series of interpreted aerial photos displaying the results of conservation monitoring projects.
1.3. Recent Technological Innovations
The novel remote sensing and digital photogrammetry methodologies can offer new ways to meet the needs of nature conservation monitoring [28,54,55,56]. The most effective tools that can help to study environmental processes on a large scale are numerous spatially distributed study sites, frequent image acquisition, quick evaluation of the results, and free flow of information [57]. Digital photogrammetry and multi-source satellite remote sensing create data at higher spatial, spectral, and temporal resolution than data collected at any other time on the ground [30,31,32,58]. The main technological components of our innovative workflows are aerial remote sensing by fixed-winged aircraft imagery, high-precision autopilot flight itineraries, digital photogrammetry technology, very high spatial and spectral resolution, orthophotos and additional oblique imagemaps and point clouds, high-rate image data acquisition, a direct georeferenced photogrammetric platform, high-speed automatic image preprocessing, field validation with local experts, and cooperation with research projects [28,32].
1.4. Monitoring System Based on Regular Aerial Surveillance of Landscape Details
Following the development of the technical bases, pilot surveys began in 2018 with a high-resolution sampling of 25 study sites in Hungary. Based on these centimeter spatial resolution multispectral aerial surveys, a nationwide database could be built in the future.
The proposed features of the High Spatial Resolution Aerial Monitoring Network (HRAMN) are as follows:
- High cost-efficiency: several hundred representative and permanent sample areas (i.e., 800 sites measuring 1 km2 each) in a 100,000 km2 area can be surveyed within a few days and can provide high spatial resolution digital orthoimage maps and point clouds up to four times a year at high flight speeds (200–800 km/h) for nature conservation, monitoring, and research projects.
- Prompt availability of digital orthoimage datasets, 3D point clouds to the field experts for evaluation in a few days: fast post-processing of thousands of images taken by aerial cameras in a few days can be achieved by the so-called direct orientation; every exposition’s location and tilt is recorded using an aerial camera system with a differential GPS and precision compass.
- Orthoimage maps can improve spatial accuracy while field experts provide special knowledge for interpretation. Applying orthophotos can enhance the exact localization of field objects by one order of magnitude, while experts can provide additional information and knowledge which is difficult or impossible to map by remote sensing alone.
- No interference with wildlife. We have conducted numerous experiments on the stress tolerance of mammals and birds with a UAV (unmanned aerial vehicle) and aeroplanes at different heights above ground level. There is no wildlife disturbance at flight altitudes above 450 m.
- Data and maps should be freely accessible and secured. It is suggested to grant public administrations and authorities, universities and academic research institutions, as well as citizens and not-for-profit organizations, free access to our datasets. Open access is one of the most important principles of the suggested infrastructure and service, except for sensitive data on wildlife and nature conservation. Therefore, investment in secure data storage and online access is also needed.
1.5. Objectives
This paper examines how the geometric accuracy, detection accuracy, and applicability of the tested services of the High Spatial Resolution Aerial Monitoring Network (HRAMN) databases relate to European databases. Moreover, we attempt to determine how the HRAMN can supplement the knowledge gained from other aerial, space-born, and field surveys.
We used some examples from Hungary to explain the importance of fine-scale aerial monitoring data in protecting natural landscapes. Our results demonstrated the effectiveness of the monitoring method and indicated a potential for further developments.
- The primary goal was to design, develop and test a cost-effective methodology and its technical background, including the selection of aircraft and onboard equipment and the whole workflow from flight planning through to image acquisition to the final digital product.
- A critical task is to improve and test the methods of data extraction and interpretation of high-resolution spatial data.
- It is important to examine how HRAMN databases relate to Copernicus and country-scale products.
2. Methods
2.1. The Main Components of Remote Sensing Technologies
During the last several years, various aeroplane types (Piper-Pa-32, Piper-Pa-34, Cessna 182, Cessna 210) flown by a pilot, but also unmanned aircraft systems (UAS), i.e., fixed-winged large drones and professional octocopters were tested and applied to develop mission-specific remote sensing platforms. More than a hundred digital frame camera systems and sensor combinations were also tested.
We surveyed sample areas of about one square kilometre with various flight settings and spatial resolutions ranging from 0.5 to 5 cm. This enabled us to define spatial resolution characteristics depending on the flight’s altitude above ground level, groundspeed, and the camera shutter speed of different remote sensing platforms. Modern sensors can capture sharp images at groundspeeds of up to 600 km/h with a 0.5 cm spatial resolution from a flight altitude of 600 m, however other flight and optical zoom parameters, such as the readout speed and data flow rate of recordings have to be optimized [59]. The following set of parameters is used for the aerial surveys. When the Sun’s angle of attack is beyond 30°, taking high-quality photographs requires a camera axis tilt less than 4°, a yaw of less than 7°, and a maximum of 2.5% deviation from the flight altitude [60]. A sufficiently detailed high dynamic range image should show the topmost branches of trees and the shady parts of forest gaps between trees clearly. As long as the aerial records meet these requirements, it does not matter whether we install the camera device on a plane or a drone. What really matters is the unperturbed accuracy of the flight path, the velocity, and smooth stability.
2.2. Area Frame Sampling Approach
It is unnecessary and not cost-effective to survey the whole area of countries with such a high spatial resolution. However, the establishment and operation of a monitoring network is a reasonable choice of experiment. This way, only certain parts of the territory are surveyed, and data can be gathered at a more detailed level, then the results can be extrapolated to larger reference zones [61]. Compared to whole area coverage mapping approaches, sample surveys provide rapid results, thus seasonal surveys become feasible. In addition, accuracy estimates of area frame sampling are possible depending on sample size, which judges reliability and the efficiency of large reference zones [62].
Irregularly shaped sampling areas can be selected if a methodological investigation finds no significant differences in results compared to regular square sample sites [63].
2.3. Main Types of Sample Areas and Spatial Resolution
Initially, 25 sample areas were selected, but we are currently surveying 32 areas (Supplementary File S1). Selected strict forest reserves represent old-growth natural forest, characteristic of the Carpathian Basin, where the natural ecological processes of forest ecosystems can be recognized and studied [64]. Furthermore, other forested research sites are selected for long-term monitoring and to support research investigations. In the case of wetlands, the main tasks are vegetation mapping, the population count of breeding heron colonies, and beaver impact monitoring. In the case of rocky sites and grasslands, we focus on the detailed mapping of vegetation and monitoring of the patterns and dynamics of patches.
We surveyed some of the wetlands with a 0.5 cm spatial resolution and oblique aerial images, while images of forests, rocky grasslands and populated urban areas were taken by aerial photos with 2–5 cm spatial resolution and 3D point clouds. In many sample areas, the aerial surveys were repeated over several months. For waterfowl colonies, aerial photography was performed three times during the breeding period for a more accurate population estimate.
2.4. No Disturbance and Other Survey Limitations
A broad range of information can be gathered about natural systems in field surveys. However, in certain cases, field surveys are limited or restricted by nature conservation regulations. Thus, the monitoring of wildlife populations and biodiversity [59] should be conducted without disturbing the populations (Figure 1), as this is also a worldwide ethical issue [65]. Aerial data should usually be completed and compared with field data, but they can also be used in themselves with some limitations. For example, HRAMN could be a feasible solution for monitoring changes in the Háros Peninsula Forest Reserve, where it is restricted to enter because of the nesting of protected birds. Still, with orthophotos, side-to-top oblique orthophotos, and three-dimensional models available with 5–20 cm planimetric accuracy combined with a field control point study limited to the outside of the area, we performed an all-tree orthophoto interpretation of the 25.5 hectares area without prior fieldwork. Later a field validation and photo documentation were completed successfully with the help of the staff of the Danube Ipoly National Park Directorate (Figure 2).
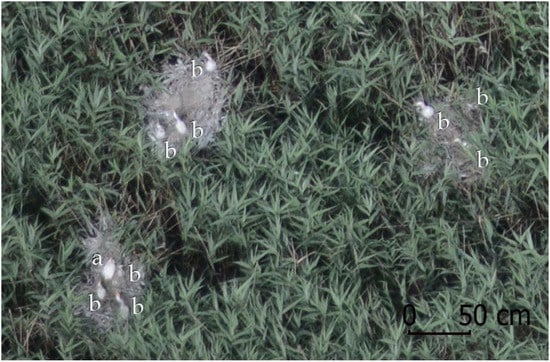
Figure 1.
Monitoring of the breeding colony of herons in the reed belt of Lake Kolon sample area from aircraft. Three nests, one adult great egrets (Ardea alba) (a) and nine young (b) can be detected in this detailed orthophoto. Any resolution smaller than the current one renders counting every piece impossible. Due to higher altitude the images are foggier than they were if taken from lower. The relatively high altitude (800 m above ground) of the flight mission did not trouble the nesting birds. In addition to the 0.5 cm high spatial resolution of orthophotos, the oblique image series also helped to identify and count the birds. (Photo Credit: Biro, Bakó, Ábrám, Morvai—INTERSPECT 2018).
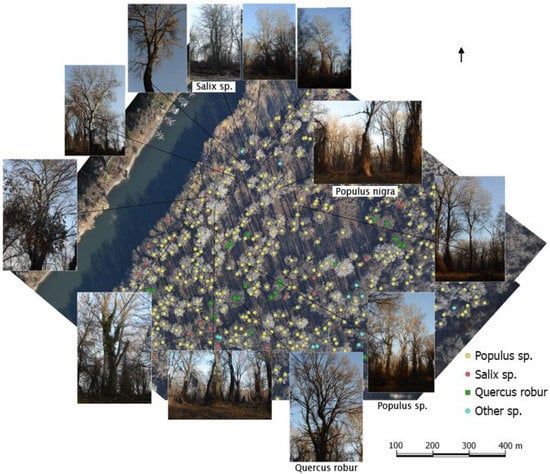
Figure 2.
High-resolution orthophoto mosaic of the Háros peninsula sample area used for the interpretation and mapping of dominant trees. Field validation and photo documentation of the trees were performed later with the specific permission of the nature conservation authority (Photo Credit: Bakó—INTERSPECT).
In the Land Use/Cover Area frame Survey (LUCAS) methodology, interpretation of remotely sensed photos is needed if the surveyed location is too inaccessible [66]. Simultaneous aerial and field surveys can help to understand natural phenomena more deeply and reduce the field efforts needed to explore and quantify the landscape changes (e.g., beaver impact study sites, Supplementary File S2).
2.5. Additional Attribution
In most cases, orthophoto products support more detailed studies, like the well-spring map, which was generated by combining the photo interpretation of a winter orthophoto map with a digital terrain model based on a geohydrological investigation (Figure 3), and a full-cover segmentation map of the upper canopy of forest based on a summer survey (Figure 4). Ensuring that surveys and field validation are well-timed is very important. The autumn forest’s images are often much more diverse than the images from summer. However, in many cases the combined effect of seasonal differences and other phenomena can be detected (such as soil features and differences in the phenology of species or individual trees), highlighting the importance of the time series in aerial surveys.
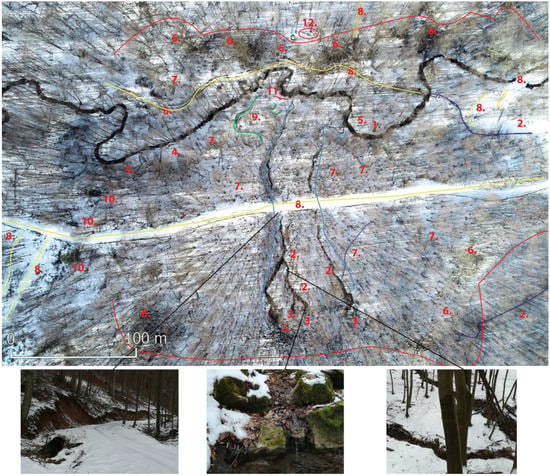
Figure 3.
Well-spring spots were explored and classified based on a wintertime survey in the Magas-Bakony Landscape Protection Area, Hungary. The orthophoto map and a 3D point cloud of the terrain were combined with a geohydrological modelling. Legend: 1. The riverbed pattern of the stream is meandering, with asymmetrical bends. 2. Branches are connected to the stream. 3. Springs that cannot have abundant water because their beds taper to the stream, located above the erosion base. 4. A straighter riverbed section that may indicate a reduction in slope, 5. Vegetation in the zone along the stream is natural. The trees definitely affect the flow of the stream and the resilience of the riverbed. 6. Higher, rocky terrain: a strip appears along the stream because of natural vegetation. 7. Traces of deer or wild boar activity. 8. A new road was passing through tributaries (artificial passages below the road). 9. An artificially created deep road. 10. Evergreen trees, like the European spruce (Picea abies). 11. The bend of an artificially deep road starting from the stream. 12. Red deer (Cervus elaphus). (Photo Credit: Bakó, Pál-Somogyi, Fehér, Síkhegyi, Licskó, Molnár—INTERSPECT 2019).
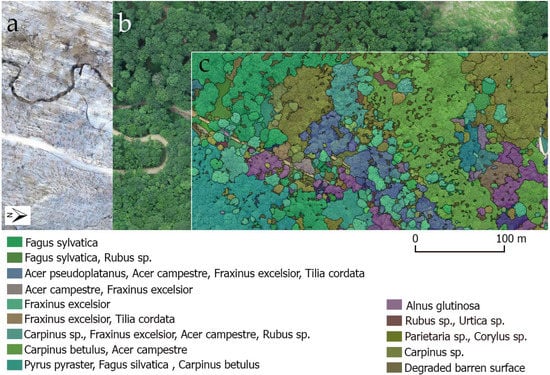
Figure 4.
High-resolution orthophotos of the Bakonybél forested sample area, Magas-Bakony Landscape Protection Area, Hungary, in winter (a), in summer (b), and the resulting segmentation map (c) of the upper canopy layer. (Photo Credit: Fehér, Bakó, Molnár, Burai—INTERSPECT 2019).
The datasets of orthophotos and 3D point clouds are evaluated in cooperation with local experts in botany, forestry, ecology, geology, etc., to deepen our knowledge of the sample areas. In addition, an integrated spatial database with attributes on land cover, land use, habitat, and species occurrence, is developed (Supplementary File S3). The attributes are attached during the basic, landscape-level evaluation of aerial surveys. The classification of land cover categories applied is given in Supplementary File S3.
2.6. Comparison: Applicability, Geometric Accuracy, and Detection Accuracy
HRAMN can help to develop, scale, and improve ecological databases based on space remote sensing and country-wide aerial remote sensing. At some sites, we examined the HRAMN’s efficiency in detecting landscape patterns and other data features. We analysed the novel methodology by comparing our results with data gained from the following databases: Copernicus Land Monitoring Service CORINE Land Cover 2018 and Urban Atlas 2018; National, High-resolution Ecosystem Map of Hungary [67,68]. We applied the overlap matrix approach to analyse deviations in land cover classes, focusing on types with higher influence on the ecosystem services.
Geometric accuracy was examined by field geodetic inspection at a separate set of test control points with 1 cm accuracy and by comparing the areas of the detected spots. If the land cover categories in the small-scale database did not allow the identification of specific land cover categories in the large-scale database, then we merged the corresponding categories into the HRAMN database for comparison. After the preprocessing of the two land cover databases, the translation of the nomenclature (pair to pair identification) is the next step. The third step is to calculate the overlap between classes and insert these overlap values into the matrix. When calculating the detection accuracy, we looked at the mistakenly categorized pieces. When comparing to a larger-scaled database, the two maps had been sliced up using geoprocessing tools. This created as many identical overlapping features as there were features that participate in that overlap. We examined the area of the small-scale database that differs from the higher-precision layer for specific land cover categories. HRAMN databases can be used to draw even further conclusions.
3. Results
3.1. Brief Guidelines on Aerial Surveys
To ensure uniform weather and illumination circumstances within an array of aerial recordings, high-speed flights (>200 km/h) are highly preferable. In our experience, high-quality orthophotography and point clouds are achievable cost-effectively using fast readout full-frame CMOS sensors that can take detailed and dynamic pictures even when illumination is insufficient, plus they are not overloaded by taking 9000 photos daily. In cameras with sensors of 36 × 24 to 53.4 × 40 mm bounding dimensions, we use fix focal length objectives (in the range of 35–500 mm focal length), locked to infinity, and our flight altitude is between 450 and 800 m. The resolution of our cameras varies between 36 and 200 megapixels. We recommend >85% overlap within rows, and 80% overlap between rows. We determined the settings of the groundspeed, flight altitude, spatial resolution, and shutter speed so that the images were not blurred by forward motion (Figure 5). Modern digital frame cameras are capable of capturing sharp images even at high groundspeeds. The diagram shows how the spatial resolution at a given flight altitude corresponds with groundspeed and what shutter speed is required to keep the image sharp with a 50 mm focal length. The same correlations can be applied for wide-angle lenses and telelenses with different altitudes so that the required spatial resolution can be reached at a much higher flight altitude. Below the line of 65% overlap of aerial images display the appropriate combinations of groundspeed, flight altitude, and shutter speed with a standard 50 mm focal length objective.
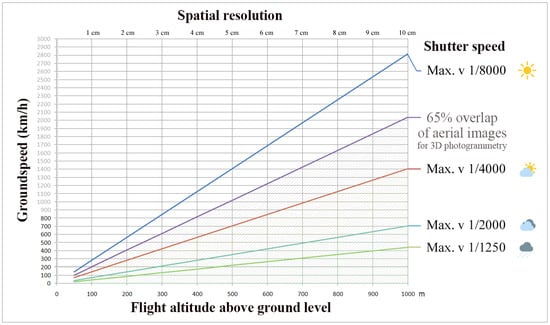
Figure 5.
Spatial resolution diagram at 36 × 24 mm sensor and 50 mm focus distance depending on flight altitude, groundspeed, and the shutter speed of the camera. The 65% inline overlap of aerial images shows the limit of the appropriate combinations of taking sharp images for 3D photogrammetry.
Increasing the flight speed also works with multispectral bands in the spectral range of 350 nm to 1100 nm [60] (Figure 6).
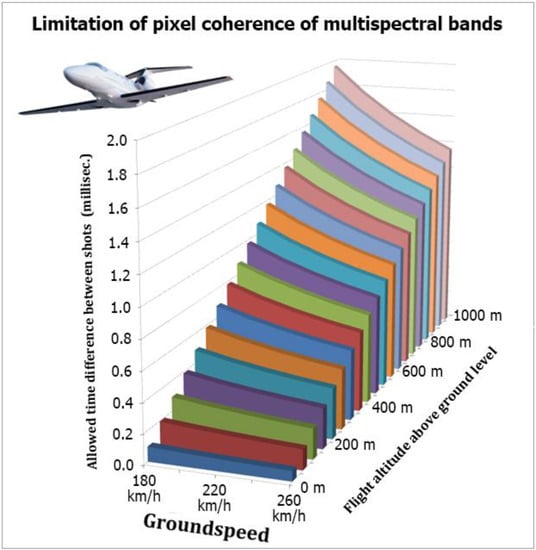
Figure 6.
Multispectral images can be taken up to half a cm in spatial resolution or during high-speed flights, depending on the flight altitude and groundspeed.
The following figure shows an example of a high-resolution (0.5 cm) infrared composite image taken by an aircraft with 220 km/h groundspeed, 500 m above the ground (Figure 7). A more coarse-grained (3 cm) version for spatial resolution can be produced at ground speeds of up to 600 km/h.
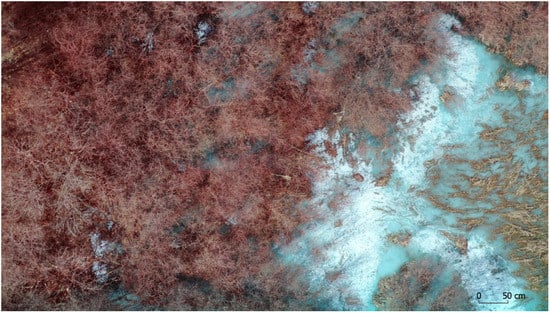
Figure 7.
Color infrared composite orthoimage detail with 0.5 cm spatial resolution from an aerial survey at 500 m altitude with 220 km/h groundspeed. It clearly shows the branch structure of (leafless) broadleaved trees and snowy patches. (Photo Credit: Bakó—Molnár INTERSPECT 2011).
3.2. Comparison with Large-Scale Maps
It is essential to know how HRAMN functions compared to other spatial databases, like the Corine Land Cover (CLC) and Ecosystem Map of Hungary. We examined the spatial overlap of land cover categories for some HRAMN sites. Table 1 shows spatial coincidences and differences between land cover categories of CLC and broad land cover classes of HRAMN in the case of the Hármashatár-hegy sample area. More land cover categories can be differentiated on the HRAMN product, despite that it does not make a distinction between broadleaved and conifer trees. However, considering the more elaborated version of vegetation classes, the HRAMN orthophoto reveals a much more detailed pattern and classification of the same site (Figure 8). More diverse forest types can be distinguished and mapped based on the species-level classification of the upper canopy trees. Accurate local assessment cannot be made using the CLC database in the case of diverse forests.

Table 1.
Spatial overlap matrix between land cover categories of CLC 2018 and HRAMN 2018 maps of Hármashatár-hegy sample area in m2.
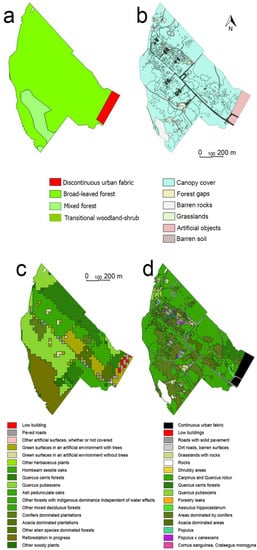
Figure 8.
Various remote sensing-based vector maps of the Hármashatár-hegy sample area, Hungary: (a) Copernicus CLC 2018, (b) HRAMN 2018 land cover, (c) Ecosystem Map of Hungary 2019, (d) HRAMN 2019 vegetation classes (Bakó, Pápay, Fűrész, Molnár—INTERSPECT).
It is worth examining the coincidenfce between CLC and HRAMN at Hár-mashatár-hegy sample area, where the vegetation is dominated by deciduous and black pine (Pinus nigra) trees (Figure 9). The CLC classifies 8.7% of the forests in the sample area as inhabited, 71.5% as decidufous broadleaved forests, 15% as mixed forests, and 4.8% as temporary shrubberies representing a 13.4% error for the sample area for discontinuous urban fabric. The screening for evergreen-invasive vegetation shows significantly less bias than mapping for invasive deciduous woody and herbaceous species (e.g., tree of heaven, Ailanthus altissima or common milkweed, and Asclepias syriaca). When we validated the HRAMN product using field surveys, an exceptionally high 95% accuracy was achieved in the Háros Peninsula sample area due to timing the survey correctly in the flowering period.
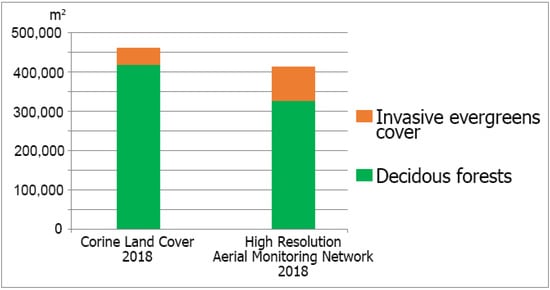
Figure 9.
The summarized cover of broadleaved forest and mixed forest classes by Corine Land Cover and HRAMN in the Hármashatár-hegy sample area. The CLC 2018 detected less than half of the area was covered by the invasive coniferous black pine (Pinus nigra) and overestimated the canopy of broadleaved trees. (Bakó—INTERSPECT).
For one of the other sample areas (Közös-erdő Strict Forest Reserve), the relationship between CLC 2018 and HRAMN 2018 highlights the importance of fine-scale validation of broad-scale databases (Table 2). Moreover, Table 3 and Figure 10 point out the need to and possibilities of increasing Urban Atlas’s accuracy.

Table 2.
Spatial overlap matrix between the land cover categories of CLC 2018 and HRAMN 2018 maps of Közös-erdő Strict Forest Reserve sample area in m2, at Páhi-Csengőd, Kiskunság Biosphere Reserve, Hungary.

Table 3.
Spatial overlap matrix between Copernicus Urban Atlas and HRAMN 2018 maps of Hármashatár-hegy sample area in m2. The degree of coincidence was classified into 3 classes from high (green) to low (gray).

Figure 10.
Overlapping maps of Urban Atlas and HRAMN 2019 vegetation patterns. There are remarkable geometric differences in the roads digitized from space imagery (yellow versus orange).
The Copernicus Tree Cover Density (TCD) product consists of the status layers showing the level of tree cover density in a range from 0–100% available for 2012, 2015, and 2018’ used as reference years. In the case of Közös-erdő Strict Forest Reserve sample area, 515.194 m2 of the total 789.045 m2 is covered by forests, and 189.423 m2 is covered by grasslands. The Copernicus TCD map does not detect 11% of the forest of Közös-erdő, the remaining 89% has a tree cover density above 40%. It shows a tree cover density value above 80% in 79% of forest gaps. 32% of the artificial objects show TCD values above 40% instead of 39% in uncovered water surfaces, and instead of 20% of spots covered with barren soil. The TCD map shows false woody cover on 20% of the grasslands.
Table 4 shows the tabulated overlap areas between the Dominant Leaf Type status layer and HRAMN 2018 in square m in the case of the Közös-erdő Strict Forest Reserve sample area. The Dominant Leaf Type status layer is a space remote sensing product providing information on the dominant leaf types: broadleaved or coniferous.

Table 4.
Spatial overlap matrix between the Copernicus Dominant Leaf Type (DLT) status layer and HRAMN 2018 maps of the Közös-erdő Strict Forest Reserve sample area in m2, at Páhi-Csengőd, Kiskunság Biosphere Reserve, Hungary.
It is also interesting to tabulate the Dominant Leaf Type (DLT) category system compared to HRAMN in the case of Közös-erdő Strict Forest Reserve sample area. There is a misinterpretation of DLT considering coniferous trees, but one can find a high level of similar results in the other categories (Table 5).

Table 5.
Dominant Leaf Type (DLT) status layer classes in m2 compared with HRAMN results at Közös-erdő sample area in Kiskunság Biosphere Reserve, Hungary.
In the case of the Copernicus Imperviousness High Resolution Layer, the level of sealed soil (imperviousness degree 1–100%) is produced using a semi-automated classification based on calibrated NDVI. For the Imperviousness High Resolution Layer, the total sample areas were in the non-sealed category, which was 2.45% error for the Közös Forest Biosphere Reserve, for example, and only 8.49% for the Hármashatár submountain sample area.
The Copernicus Land Monitoring Service Small Woody Features (SWF) vector layer provides harmonized information on linear structures such as hedgerows and patches (200 m2 ≤ area ≤ 5000 m2) of woody features. Thirty-one percent of the Small Woody Features layer fell on the non-tree-covered area for the Közös-erdő HRAMN sample area.
The combined Water and Wetness product is a thematic layer showing the occurrence of water and wet surfaces over the period from 2009 to 2018. These layers are based on multi-temporal and multi-seasonal optical high-resolution satellite imagery. In addition, these layers are also based on radar information (Sentinel-1 data) with a geometric resolution of 10 m on a pan-European basis. The Water and Wetness database did not detect 33% of the total water surface in the Közös-erdő HRAMN sample area, but instead overestimated the dry category four times.
Finally, we also examined the coincidence between HRAMN and the Ecosystem Map of Hungary [67,68] at the Hármashatár-hegy sample area. We found remarkable differences in the land cover overlap matrix (Table 6, Figure 8).

Table 6.
Spatial overlap matrix between the Ecosystem Map of Hungary (EMH) and HRAMN 2018 in the Hármashatár-hegy sample area, in m2.
3.3. Complex Evaluation Options
The orthophoto and a 3D point cloud from the area of the Kékes-Észak Strict Forest Reserve in the Mátra Mountains, Hungary, made it possible to develop the HRAMN deadwood mapping methodology. Using winter orthophoto and DSM (digital surface model) point clouds made by photogrammetry, we found nearly 3300 fallen dead trees, classified into two trunk diameter categories (Figure 11). Deadwood can be observed and digitized properly if its diameter is more than 11 cm because a trunk has to be at least two pixels wide to be recognizable. The lying deadwood was classified according to their widths. We separated trunks less than 70 cm in diameter and those over 70 cm in diameter into classes during the photo interpretation. Trees with about 60–70 cm trunks are commonly classified as a ‘large canopy size’ class of trees, while the larger size trees are considered ‘very large’ [69,70,71]. No fallen tree with a trunk diameter wider than 130 cm was found in the area. As a third category, we marked the piles of wood. The terrain of the sample area is extremely steep and rugged here, so deadwood monitoring on the field is challenging and expensive. The development of an automated learning algorithm is underway.
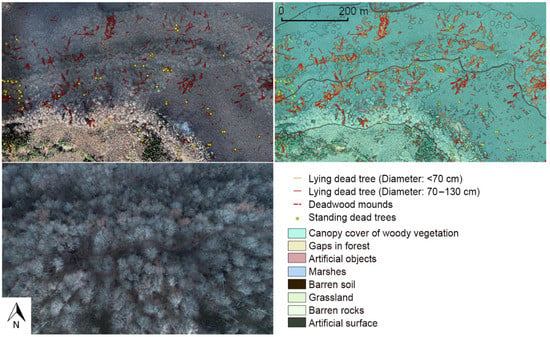
Figure 11.
Middle spatial resolution (5 cm) winter orthophoto map of the Kékes-Észak Strict Forest Reserve sample area (lower left). The upper maps show standing and fallen dead trees, and the forest canopy gaps are digitized (Photo Credit: Csernyava, Bakó, Horváth, Molnár—Centre for Ecological Research, INTERSPECT 2018).
The size of canopy gaps is an important factor and indicator in forest ecosystems [72]. Propagation vectors of invasive plant species are also traceable in the sample areas using aerial remote sensing [11]. Large-scale and frequent repetition of habitat mapping is key to the protection of rocky grasslands, as well. Human determined metropolitan areas can also hide ‘biodiversity islands’ with outstanding natural values that are worth monitoring [1,73].
3.4. Geometric Accuracy of HRAMN
Factors determining the geometric accuracy and limitations of the method should also be mentioned. In lowland grasslands, marshlands, bogs, and nesting sites, the planimetric accuracy of the survey is between 5.1 to 20.7 cm root mean square error (RMSE). In the worst case, RMSE was 15.3 cm in large-scale flat areas, and its reliability was 26.6 at a 95% confidence level based on independent test investigations. The average planimetric error was 13.6 cm, and the maximum planar deviation was 28.0 cm.
We can maintain the spatial resolution of 2.5 cm with a 75% side and an 80% inline overlap of the images, where planimetric and vertical RMSEs are 12 cm and 18 cm, respectively. With a constant set of ground control points, the geometric error can always be held under 6 cm planimetric and 8 cm vertical RMSE.
The spatial bias of the canopy patches of canopy maps originating from different image acquisition missions is highly variable. In forested mountainous sample areas, the accuracy strongly depends on overlap settings and flight altitude (Table 7). For ground points (i.e., the tree trunk position at the ground level of the trees), we can achieve similar accuracy as commercial UAVs; for example, with DJI Phantom RTK or other multi-rotor helicopters. However, for the top of the trees or canopy structure, the flight altitude can cause considerable perspective distortions. Due to the strong perspective distortion of the low-acquired UAV images at the Pilis Gap Experiment sample area (Table 7), the orthophoto-based canopy maps shift considerably compared to the results of field laser scanning as geometric reference (Figure 12). The productivity, however, is much higher, and the distortion indicators are much better in the case of aircraft missions capturing images with large overlaps.

Table 7.
Distortion: RMSE and bias of canopy patches of different canopy maps depending on the platform, image overlap, and flight altitude settings over the 3200 m2 Pilis Gap Experiment site.
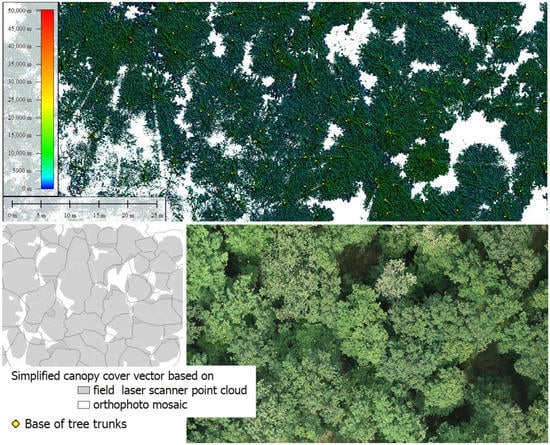
Figure 12.
Comparison of the high precision 3D canopy point cloud map originated from field laser scanning (upper part). Vertical color bar: height of pixels above ground; horizontal scale bar: spatial scale of stand; and 3 cm spatial resolution orthophoto mosaic of the same window is next to a commercial UAV (right below). Although the orthophoto is accurate at ground level, the pattern of the canopy cover map shifts (left below) because of the perspective distortion of the low flight altitude and wide-angle lens. Pilis Gap Experiment sample area—https://www.piliskiserlet.okologia.mta.hu/en, Accessed on 10 October 2020 (Photo Credit: Bakó, Burai, Molnár, Illés).
3.5. Detection Accuracy of HRAMN
In addition to the accuracy of delimiting individual patches, another critical factor is the accuracy of patch identification. A quality control analysis of the upper canopy layer of the Háros Peninsula forest reserve was performed to test detection accuracy. The HRAMN map was produced using 5 cm spatial resolution RGB orthophotos, and the control was a field survey. We were also interested in whether late autumn, low-foliage, or early spring aerial surveys would give more accurate results. Therefore, we conducted two aerial surveys for the 25.5-hectare test sample area, one in late October and another in mid-April.
The misidentification error of the upper canopy layer of trees was 5.0% based on the spring RGB orthophoto for the whole test area (Figure 13). If only the area covered by trees is considered (i.e., clearings were disregarded), the error was 7.3%. In 0.1% of the sample area, the orthophoto provided a more accurate result than the first field validation (clarified by a repeated field checking), mainly in inaccessible areas or where the upper canopy structures were not visible from the ground.
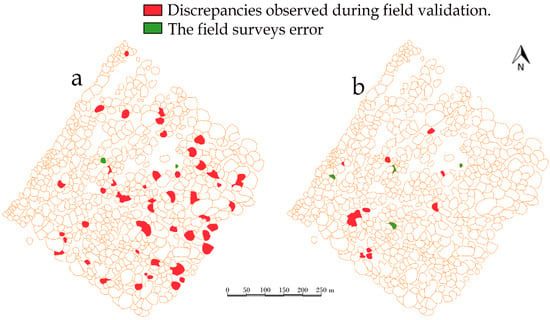
Figure 13.
Misidentification of trees on canopy maps (red colored) derived from spring blooms (a) and leafless, late autumn (b) orthophotos of the Háros Peninsula forest reserve test sample area, and discrepancies compared to the first field validation. The second field validation discovered minor field survey errors (green colored). (Bakó—INTERSPECT).
The interpretation of leafless (late autumn) orthophotos provided a better result. The misidentification error of the upper canopy layer was 0.8% (or 1.1% disregarding clearings) compared to the field validation. In comparison, an interpretator unfamiliar with the site achieved a misidentification error of 3.5% (or 2.2% disregarding clearings). In 0.3% of the sample area, the orthophoto provided a more accurate result than the lengthy field survey. There was a 9.1% difference in the total area of poplar trees and 1.5% for the canopy of oaks.
At such high spatial resolution, the structure and shade of the branch system were visible on the autumn images, so the upper canopy map derived from the spring images is notably less accurate.
The number of species identifiable without any fieldwork has increased with the high-resolution method. The tree of heaven (Ailanthus altissima) can be identified with very high accuracy. In leafless images, the American plane tree (Platanus occidentalis), the common dogwood (Cornus sanguinea), blackthorn (Prunus spinosa), and Japanese knotweed (Reynoutria japonica) can be clearly distinguished from the poplar, willow, and European white elm (Ulmus laevis) trees, even in a suppressed stand position. In the spring, Cornus, blackthorn, and Japanese knotweed were not discernible. The boxelder maple (Acer negundo), sycamore maple (Acer pseudoplatanus), small-leaved lime (Tilia cordata), European white elm, field maple (Acer campestre), and green ash (Fraxinus pennsylvanica) can be defined as one category. The Norway maple (Acer platanoides) can be distinguished from the English oak, poplar, and linden trees at a spatial resolution of 5 cm.
There have been some typical errors that are worth noting. While the branch system of poplar species has a light-looking, fibrous structure, the branch system of pedunculate oak is recognizable by its dark color in addition to its different pattern. In one case, a poplar tree much higher than its surroundings cast a shadow on a medium-sized poplar, so its branches appeared dark on the orthophoto (Figure 14). The arrangement of the branches of the oak tree was also similar to the poplar’s. As both the color and the structure are similar in this particular case, the poplar was misclassified as oak.
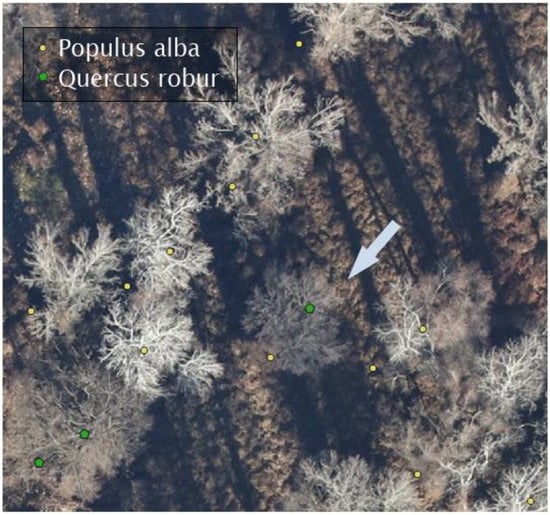
Figure 14.
The poplar marked with an arrow appeared in the shade of the taller poplar, similar to oak because the bark seems darker in the shadow. (Photo Credit: Bakó—INTERSPECT).
In the case of rocky grasslands, for example, in the Sas Hill Nature Reserve, Budapest, we tested how much the high-resolution orthophoto map can refine and enrich the result of habitat mapping (Figure 15, Table 8).
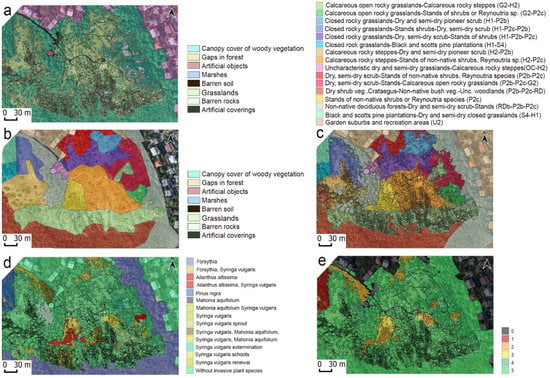
Figure 15.
In the case of Sas Hill Nature Reserve (Budapest), the suppression of invasive plant species (Ailanthus altissima, Forsythia species, Mahonia aquifolium, Pinus nigra and Syringa vulgaris) can be planned for based on more detailed orthophoto maps. A time series of images with a 3 cm spatial resolution, were applied and interpreted. Part (a) is the land cover map. Keys of the habitat map, 2012 (b), and the habitat map, 2020 (c), are shown in Table 8. Infection of invasive species (d) and naturalness (e) maps are a different color to the same map. The green color shows an area of the highest naturalness (5). The full list of keys can be found in Supplementary File S3. (Photo Credit: Bakó-Pácsonyi).

Table 8.
Comparison of the results of habitat mapping surveys taken with classical 20–50 cm spatial resolution orthophotos (summer 2012) and the method of HRAMN (summer 2020, taken with 3 cm spatial resolution). Values are in m2.
4. Discussion
Based on earlier studies and our results, the photogrammetric method does not provide as detailed three-dimensional spatial data on the trees and topography of a forest as static, field-by-position terrestrial laser scanning. However, it can be performed much faster and more cost-effectively. As for spatial resolution, aerial and space sensing methods provide much more detailed and accurate information about the state of landscape details, and are more cost-effective than airborne LiDAR (Light Detection and Ranging). Besides aerial monitoring, other 3D methods are available for surveying forests, but compared to TLS- (Terrestrial Laser Scanning) based measurements, the costs of airborne solutions are neglectable [74].
Laser (ALS—Airborne Laser Scanning) technologies have become more common in estimating the number of dead trees. An algorithm using machine learning performs the point cloud analysis. A research team achieved 89% accuracy in detecting standing dead trees in its experiments [75]. Based on experts’ experience applying the method in practice, the efficiency of detection, the size of the trees, and the resolution of the point cloud also depended on the undergrowth density [76].
Our method provides the safest solution for surveying protected areas where entry is prohibited. Detecting, understanding, and quantifying landscape processes are time- and cost-effective, e.g., the impact of certain ecosystems’ animal species on the environment; the extent of landscaping processes; the state of temporary watercourses in submontane environments; and changes in grassland patch dynamics, mowing and grazing in, and changes in forests, can be documented.
It is easier and faster to develop databases available on a continental scale, appropriate to their scale and commitments if we can validate rough-scale space sensing data with such reliable spatial information. The indisputable advantage of space-born remote sensing and the databases based on it lies in its ability to provide valuable data on entire countries and continents. At the same time, it is useful to examine their limitations and accuracy with fine-scale methods. Our method, which can survey many areas in a short time, is suitable for this. With the development of a database, it will also become easier and quicker to validate smaller-scale, space-based data with reliable spatial information.
Protecting, preserving, and restoring biodiversity, as well as enhancing natural capital (notably air, water, soil, forest, freshwater, wetland, and marine ecosystems) is one of the six priority objectives of the 8th EAP (Environment Action Program to 2030) [77]. The 8th EAP proposal suggests setting up a new monitoring framework that will help the EU and its member states determine to what extent we live within the planet’s environmental boundaries.
Compliance with the target of enhancing the resilience of ecosystems through the restoration of degraded land is still insufficient, partly due to the lack of appropriate baselines and the follow-up of restoration efforts [78].
With a precise quantification of the economic value of landscape and its contribution to human wellbeing, both the popularity of restoration processes preserving landscape values and scientific knowledge can be increased [79]. In contrast to some economic benefits of developments that lead to habitat degradation as a side effect, there are also specific material disadvantages, particularly the known expected costs of preserving the environment and health [80]. On small scales, using spatial data based on satellite earth observation systems, the United States of America and the European Union already use similar sources of information to support decision-making [81]. However, these, and the administrative databases of the member states’ aerial surveys, are not sufficiently sensitive to nature conservation issues. They do not fully tackle environmental challenges, although the excellent state of our natural environment is one of the pillars of human health.
Several articles highlight that changes in vegetation status cannot be described only by the infrared domain changes of satellite data [82,83,84,85,86]. However, with the help of very high spatial resolution aerial surveys, we can detect changes in vegetation more efficiently [87]. Despite the access of multispectral satellite imagery, high spatial resolution aerial surveys are applied in the USA to detect insect damage and analyse the forward progress and the end of infections [88]. High spatial resolution aerial photogrammetry helps to identify physiological stress in mature plantation trees even during the early stages of tree stress [89].
Point-frame surveys are widespread in forestry, for example, TER-UTI (Utilisation du territoire), run by the French Ministry of Agriculture, or the FMOS (Forest Protection Measuring and Observation System) in Hungary, launched in 1987 [90]. Particularly in Europe, aerial photography still plays a prominent role in forest inventories. The intensive use of aerial photography in Europe is the result of a combination of factors. They include the long-term traditional usage; the high spatial resolution; the often strong link between forest administration and the survey institutes that produce the aerial photographs; the relatively high costs for very high-resolution satellite data; and the higher probability of obtaining cloud-free data for the envisaged area within a certain period [91].
5. Conclusions
The High Spatial Resolution Aerial Monitoring Network contains reliable fine-scale data about many natural or urban study sites. The sites should be selected by experts and be relevant to conservational, biological, ecological, and geological questions at regional- and national levels of importance. Moreover, a non-contiguous area-based sampling network can help to increase the accuracy of procedures employed for mapping Europe and our understanding of habitats and ecosystem services without disturbing wildlife. It can contribute, for example, to the calibration of the High-Resolution Layers of Copernicus Land Monitoring Service.
An extended network could provide the National parks with spatial databases which can support management plans and monitoring. In addition, by better understanding the processes in space, models predicting the effects of interventions and treatment plans could also be built.
High-resolution (0.5–5 cm) orthophotos are used in more and more surveys and the various works based on them. More accurate and detailed habitat maps are available than before, providing a solid basis, e.g., for planning, mowing and grazing regimes. Forest surveys that can specify individual tree can be used in planning forestry work and monitoring its effects. The importance of mapping woody and herbaceously invasive plants should be stressed, which can significantly contribute to the efficiency and cost reduction of their eradication. More accurate monitoring programs can be carried out based on regularly available aerial photographs, such as surveying bird breeding sites, mapping the seaweed of open water surfaces, monitoring swamp sawgrass (Cladium mariscus) population dynamics, or large-scale surveying of individual plant species.
Supplementary Materials
The following are available online at https://www.mdpi.com/article/10.3390/su13168807/s1, File S1, File S2, File S3.
Author Contributions
Conceptualization: G.B., Z.M.; formal analysis: G.B.; Z.M., L.F., Ö.Á., E.M.; C.B., G.P., A.F., K.P., D.P., E.J., D.D., L.C., G.I.; writing and original draft preparation and editing: G.B., L.B., F.H., E.J., K.D.; resources and data curation: F.H., A.M. All authors have read and agreed to the published version of the manuscript.
Funding
This research received no external funding.
Data Availability Statement
Data supporting reported results can be found in the Interspect Ltd. Archivum, Halásztelek, Hungary.
Acknowledgments
We would like to acknowledge the financial contribution provided by Interspect Ltd., Centre for Ecological Research Department, and Óbuda University’s John von Neumann Faculty of Informatics, as well as the professional assistance of Kiskunság National Park and Moving Sand Nature Conservation Association. We would like to acknowledge the consulting assistance of György Büttner, Gergely Maucha, Béla Licskó, Ferenc Síkhegyi, Péter Ódor, Bence Kovács and Gábor Remetey-Fülöp. Our grateful thanks are also extended to the pilots, András Arday, Tamás Lengyel, Kálmán Oláh, and Csaba Burai, Tibor Góg, for their precision flights. We would like to acknowledge the language proofreading by Brigitta Palotás and Attila Bíró.
Conflicts of Interest
The authors declare no conflict of interest.
References
- Yang, X. Urban Remote Sensing: Monitoring, Synthesis, and Modeling in the Urban Environment; Wiley-Blackwell, John Wiley and Sons, Ltd.: Oxford, UK, 2011; p. 408. [Google Scholar]
- Gallant, A.L. The Challenges of Remote Monitoring of Wetlands. Remote Sens. 2015, 7, 10938–10950. [Google Scholar] [CrossRef] [Green Version]
- McGrath, M.J.; Scanaill, C.N. Environmental Monitoring for Health and Wellness; Sensor Technologies: Berkeley, CA, USA, 2013; pp. 249–282. [Google Scholar] [CrossRef] [Green Version]
- Kovaca, M.; Gasparinib, P.; Notarangelob, M.; Rizzob, M.; Cañellasc, I.; Fernández-de-Uñac, L.; Alberdic, I. Towards a set of national forest inventory indicators to be used for assessing the conservation status of the habitats directive forest habitat types. J. Nat. Conserv. 2020, 53, 125747. [Google Scholar] [CrossRef]
- Brickhill, D. Ecosystem services and the environment. InDepth Report 11 Produced for the European Commission; DG Environment: Brussels, Belgium, 2015. [Google Scholar]
- Ruckelshaus, M.H.; Jackson, S.T.; Mooney, H.A.; Jacobs, K.L.; Kassam, K.S.; Arroyo, M.T.K.; Báldi, A.; Bartuska, A.M.; Boyd, J.; Joppa, L.N.; et al. The IPBES Global Assessment: Pathways to Action. Trends Ecol. Evol. 2020, 35, 407–414. [Google Scholar] [CrossRef] [Green Version]
- Costanza, R.; D’Arge, R.; de Groot, R.S.; Farber, S.; Grasso, M.; Hannon, B.; Limburg, K.; Naeem, S.; O’Neill, R.V.; Paruelo, J.; et al. The value of world’s ecosystem services and natural capital. Nature 1997, 387, 253–260. [Google Scholar] [CrossRef]
- Millennium Ecosystem Assessment, Ecosystems and Human Wellbeing: Synthesis; Island Press: Washington, DC, USA, 2005; p. 137.
- Wulder, M.A.; Hall, R.J.; Coops, N.C.; Franklin, S.E. High Spatial Resolution Remotely Sensed Data for Ecosystem Characterization. BioScience 2004, 54, 511–521. [Google Scholar] [CrossRef] [Green Version]
- Sickel, H.; Ihse, M.; Norderhaug, A.; Sickel, M.A.K. How to monitor semi-natural key habitats in relation to grazing preferences of cattle in mountain summer farming areas—An aerial photo and GPS method study. Landsc. Urban Plan 2004, 67, 67–77. [Google Scholar] [CrossRef]
- Hantson, W.; Kooistra, L.; Slim, P.A. Mapping invasive woody species in coastal dunes in the Netherlands: A remote sensing approach using LIDAR and high-resolution aerial photographs. Appl. Veg. Sci. 2012, 15, 536–547. [Google Scholar] [CrossRef]
- Wang, S.; Garcia, M.; Bauer-Gottwein, P.; Jakobsen, J.; Zarco-Tejada, P.J.; Bandini, F.; Paz, V.S.; Ibrom, A. High spatial resolution monitoring land surface energy, water, and CO2 fluxes from an Unmanned Aerial System. Remote Sens. Environ. 2019, 229, 14–31. [Google Scholar] [CrossRef]
- Prince, S.D. Challenges for remote sensing of the Sustainable Development Goal SDG 15.3.1 productivity indicator. Remote Sens. Environ. 2019, 234, 111428. [Google Scholar] [CrossRef]
- Pogorzelec, M.; Bronowicka-Mielniczuk, U.; Serafin, A.; Parzymies, M. The importance of habitat selection for there introduction of the endangered Salix lapponum L. in eastern Poland. J. Nat. Conserv. 2020, 54, 125785. [Google Scholar] [CrossRef]
- Lu, B.; He, Y. Optimal spatial resolution of Unmanned Aerial Vehicle (UAV)-acquired imagery for species classification in a heterogeneous grassland ecosystem. GIScience Remote Sens. 2018, 55, 205–220. [Google Scholar] [CrossRef]
- Chen, Q.; Laurin, V.G.; Battles, J.J.; Saah, D. Integration of airborne lidar and vegetation types derived from aerial photography for mapping aboveground live biomass. Remote Sens. Environ. 2012, 121, 108–117. [Google Scholar] [CrossRef]
- Marshall, V.M.; Lewis, M.M.; Ostendorf, B. Detecting new Buffel grass infestations in Australian arid lands: Evaluation of methods using high-resolution multispectral imagery and aerial photography. Environ. Monit. Assess. 2014, 186, 1689–1703. [Google Scholar] [CrossRef] [Green Version]
- Erker, T.; Wang, L.; Lorentz, L.; Stoltman, A.; Townsend, P.A. A state wide urban tree canopy mapping method. Remote Sens. Environ. 2019, 229, 148–158. [Google Scholar] [CrossRef]
- Fitoka, E.; Tompoulidou, M.; Hatziiordanou, L.; Apostolakis, A.; Höfer, R.; Weise, K.; Ververis, C. Water-related ecosystems’ mapping and assessment based on remote sensing techniques and geospatial analysis: The SWOS national service case of the Greek Ramsar sites and their catchments. Remote Sens. Environ. 2020, 245, 111795. [Google Scholar] [CrossRef]
- Danielsen, F.; Burgess, N.D.; Balmford, A. Monitoring Matters: Examining the Potential of Locally-based Approaches. Biodivers. Conserv. 2005, 14, 2507–2542. [Google Scholar] [CrossRef]
- Goetz, J.; Brenning, A.; Marcer, M.; Bodin, X. Modeling the precision of structure-from-motion multi-view stereo digital elevation models from repeated close-range aerial surveys. Remote Sens. Environ. 2018, 210, 208–216. [Google Scholar] [CrossRef]
- Kukkonen, M.; Maltamo, M.; Korhonen, L.; Packalen, P. Comparison of multispectral airborne laser scanning and stereo matching of aerial images as a single sensor solution to forest inventories by tree species. Remote Sens. Environ. 2019, 231, 111208. [Google Scholar] [CrossRef]
- Wang, Y.; Pyörälä, J.; Liang, X.; Lehtomäki, M.; Kukko, A.; Yu, X.; Kaartinen, H.; Hyyppä, J. In situ biomass estimation at tree and plot levels: What did data record and what did algorithms derive from terrestrial and aerial point clouds in boreal forest. Remote Sens. Environ. 2019, 232, 111309. [Google Scholar] [CrossRef]
- Schug, F.; Frantz, D.; Okujeni, A.; Linden, S.; Hostert, P. Mapping urban-rural gradients of settlements and vegetation at national scale using Sentinel-2 spectral-temporal metrics and regression-based unmixing with synthetic training data. Remote Sens. Environ. 2020, 246, 111810, ISSN 0034-4257. [Google Scholar] [CrossRef] [PubMed]
- Navarro, A.; Young, M.; Allan, B.; Carnell, P.; Macreadie, P.; Ierodiaconou, D. The application of Unmanned Aerial Vehicles (UAVs) to estimate above ground biomass of mangrove ecosystems. Remote Sens. Environ. 2020, 242, 111747. [Google Scholar] [CrossRef]
- Mascia, M.B.; Pailler, S.; Thieme, M.L.; Rowe, A.; Bottrill, M.C.; Danielsen, F.; Geldmann, F.; Naidoo, R.; Pullin, A.S.; Burgess, N.D. Commonalities and complementarities among approaches to conservation monitoring and evaluation. Biol. Conserv. 2014, 169, 258–267. [Google Scholar]
- Zhang, H.; Sun, Y.; Chang, L.; Qin, Y.; Chen, J.; Qin, Y.; Du, J.; Yi, S. Estimation of Grassland Canopy Height and Aboveground Biomass at the Quadrat Scale Using Unmanned Aerial Vehicle. Remote Sens. 2018, 10, 851. [Google Scholar] [CrossRef] [Green Version]
- Bakó, G. Nagy terepi felbontású és frekvenciájú légi felmérésen alapuló monitoring-hálózat kiépítési módszertana. Tájökológiai Lapok 2019, 17, 63–78. [Google Scholar]
- Neitzel, F.; Klonowski, J. Mobile 3d mapping with a low-cost UAV system. In Proceedings of the International Archives of the Photogrammetry, Remote Sensing and Spatial Information Sciences, Conference on Unmanned Aerial Vehicle in Geomatics, Zurich, Switzerland, 14–16 September 2011. [Google Scholar]
- Bohlin, J.; Wallermann, J.; Olsson, H.; Fransson, J.E.S. Species-specific forest variable estimation using non-parametric modeling of multispectral photogrammetric point cloud data. In Proceedings of the International Archives of the Photogrammetry, Remote Sensing and Spatial Information Sciences, ISPRS Congress, Melbourne, Australia, 25 August–1 September 2012; pp. 387–439. [Google Scholar]
- Chiang, K.-W.; Tsai, M.-L.; Chu, C.-H. The development of an UAV borne direct georeferenced photogrammetric platform for ground control point free applications. Sensors 2012, 12, 9161–9180. [Google Scholar] [CrossRef] [PubMed] [Green Version]
- Bakó, G.; Molnár, Z.; Szilágyi, Z.; Biró, C.; Morvai, E.; Ábrám, Ö.; Molnár, A. Accurate Non-Disturbance Population Survey Method of Nesting Colonies in the Reedbed with Georeferenced Aerial Imagery. Sensors 2020, 20, 2601. [Google Scholar] [CrossRef]
- Backhaus, G.; Murungi, J. Transformations of Urban and Suburban Landscapes: Perspectives from Philosophy, Geography, and Architecture; Lexington Books: Boston, MA, USA, 2002; p. 269. [Google Scholar]
- Li, T.; Tao, L. Research on the Mining Wasteland Landscape Transformation. Adv. Mater. Res. 2013, 689, 459–462. [Google Scholar] [CrossRef]
- Crăciun, C.; Dan, B.M. Planning and Designing Sustainable and Resilient Landscapes; Springer Science & Business Media: Berlin, Germany, 2014; p. 303. [Google Scholar]
- Díaz, S.; Settele, J.; Brondízio, E.S.; Ngo, H.T.; Agard, J.; Arneth, A.; Balvanera, P.; Brauman, K.A.; Butchart, S.H.M.; Chan, K.M.A.; et al. Pervasive human-driven decline of life on Earth points to the need for transformative change. Science 2019, 366, 1327. [Google Scholar] [CrossRef] [Green Version]
- Biró, M.; Bölöni, J.; Molnár, Z. Use of long-term data to evaluate loss and endangerment status of Natura 2000 habitats and effects of protected areas. Conserv. Biol. 2018, 32, 660–671. [Google Scholar] [CrossRef] [Green Version]
- Virágh, K.; Bartha, S. The effect of current dynamical state of a loess steppe community on its responses to disturbances. Tiscia 1996, 30, 3–13. [Google Scholar]
- Kröel-Dulay, G.; Ransijn, J.; Schmidt, I.K.; Beier, C.; De Angelis, P.; Dato, G.; Dukes, S.F.; Emmett, B.; Estiarte, M.; Garadnai, J.; et al. Increased sensitivity to climate change in disturbed ecosystems. Nat. Commun. 2015, 6, 6682. [Google Scholar] [CrossRef] [PubMed] [Green Version]
- Nikinmaa, L.; Lindner, M.; Cantarello, E.; Jump, A.S.; Seidl, R.; Winkel, G.; Muys, B. Reviewing the Use of Resilience Concepts in Forest Sciences. Curr. For. Rep. 2020, 6, 61–80. [Google Scholar] [CrossRef]
- Pickett, S.T.A.; White, P.S. The Ecology of Natural Disturbance and Patch Dynamics; Academic Press: San Diego, CA, USA, 1985. [Google Scholar]
- Reyer, C.P.O.; Rammig, A.; Brouwers, N.; Langerwisch, F. Forest resilience, tipping points and global change processes. J. Ecol. 2015, 103, 1–4. [Google Scholar] [CrossRef]
- Nita, A.; Rozylowicz, L.; Manolache, S.; Ciocănea, C.M.; Miu, I.V.; Popescu, V.D.; Xia, C.-Y. Collaboration Networks in Applied Conservation Projects across Europe. PLoS ONE 2016, 11, e0164503. [Google Scholar] [CrossRef] [PubMed]
- Rodríguez-Morales, B.; Roces-Díaz, J.V.; Kelemen, E.; Pataki, G.; Díaz-Varela, E. Perception of ecosystem services and disservices on a peri-urban communal forest: Are landowners’ and visitors’ perspectives dissimilar? Ecosyst. Serv. 2020, 43, 101089. [Google Scholar] [CrossRef]
- Müller, A.; Maes, J. Arguments for biodiversity conservation in Natura 2000 sites: An analysis based on LIFE projects. Nat. Conserv. 2015, 12, 1–26. [Google Scholar]
- Bugter, R.; Harrison, P.; Haslett, J.; Tinch, R. Making a better case for biodiversity conservation: The BESAFE project. Biodivers. Conserv. 2018, 27, 1549. [Google Scholar] [CrossRef] [Green Version]
- Brodt, S.; Six, J.; Feenstra, G.; Ingels, C.; Campbell, D. Sustainable Agriculture. Nat. Educ. Knowl. 2011, 3, 1. [Google Scholar]
- Bateman, I.J.; Harwood, A.R.; Mace, G.M.; Watson, R.T.; Abson, D.J.; Andrews, B.; Binner, A.; Crowe, A.; Day, B.H.; Dugdale, S.; et al. Bringing ecosystem services into economic decision-making: Land use in the United Kingdom. Science 2013, 341, 45–50. [Google Scholar] [CrossRef]
- Tanentzap, A.J.; Lamb, A.; Walker, S.; Farmer, A. Resolving Conflicts between Agriculture and the Natural Environment. PLoS Biol. 2015, 13, e1002242. [Google Scholar] [CrossRef] [Green Version]
- Lomas, J.R.S.; Schmitt, L.H.M.; Jones, S.; McGeorge, M.; Bates, E.; Holland, M.; Cooper, D.; Crowther, R.; Ashmore, M.R.; Rojas-Rueda, D.; et al. A pharma co-economic approach to assessing the costs and benefits of air quality interventions that improve health: A case study. BMJ Open 2016, 6, e010686. [Google Scholar] [CrossRef] [PubMed] [Green Version]
- Bojke, L.; Schmitt, L.; Lomas, J.; Richardson, G.; Weatherly, H. Economic Evaluation of Environmental Interventions: Reflections on Methodological Challenges and Developments. Int. J. Environ. Res. Public Health 2018, 15, 2459. [Google Scholar] [CrossRef] [PubMed] [Green Version]
- Moore, T.H.M.; Kesten, J.M.; López-López, J.A.; Ijaz, S.; McAleenan, A.; Richards, A.; Gray, S.; Savović, J.; Audrey, S. The effects of changes to the built environment on the mental health and well-being of adults: Systematic review. Health Place 2018, 53, 237–257. [Google Scholar] [CrossRef] [PubMed]
- Catalano, A.S.; Lyons-White, J.; Mills, M.M.; Knight, A.T. Learning from published project failures in conservation. Biol. Conserv. 2019, 238, 108223. [Google Scholar] [CrossRef]
- Möckel, T.; Dalmayne, J.; Prentice, H.C.; Eklundh, L.; Purschke, O.; Schmidtlein, S.; Hall, K. Classification of Grassland Successional Stages Using Airborne Hyperspectral Imagery. Remote Sens. 2014, 6, 7732–7761. [Google Scholar] [CrossRef] [Green Version]
- Haest, B.; Vanden Borre, J.; Spanhove, T.; Thoonen, G.; Delalieux, S.; Kooistra, L.; Mücher, C.A.; Paelinckx, D.; Scheunders, P.; Kempeneers, P. Habitat Mapping and Quality Assessment of NATURA 2000 Heathland Using Airborne Imaging Spectroscopy. Remote Sens. 2017, 9, 266. [Google Scholar] [CrossRef] [Green Version]
- Marcinkowska-Ochtyra, A.; Jarocińska, A.; Bzdęga, K.; Tokarska-Guzik, B. Classification of Expansive Grassland Species in Different Growth Stages Based on Hyperspectral and LiDAR Data. Remote Sens. 2018, 10, 2019. [Google Scholar] [CrossRef] [Green Version]
- Kumpel, E.; MacLeod, C.; Stuart, K.; Cock-Esteb, A.; Khush, R.; Rachel Peletzet, R. From data to decisions: Understanding information flows within regulatory water quality monitoring programs. NPJ Clean Water 2020, 3, 38. [Google Scholar] [CrossRef]
- Gyberg, V.B.; Mobjörk, M. Integration Conundrums: Framing and Responding to Climate Security Challenges in Development Cooperation. Sustainability 2021, 13, 2582. [Google Scholar] [CrossRef]
- Bakó, G.; Tolnai, M.; Takács, Á. Introduction and Testing of a Monitoring and Colony-Mapping Method for Waterbird Populations That Uses High-Speed and Ultra-Detailed Aerial Remote Sensing. Sensors 2014, 14, 12828–12846. [Google Scholar] [CrossRef]
- Bakó, G. Monitoring environmental and conservation-related changes with high-resolution aerial remote sensing (Környezet- és természetvédelmi vonatkozású változások nyomon követése nagyfelbontású légi távérzékeléssel). Ph.D. Thesis, Szent István University, Gödöllő, Páter Károly, 2017. [Google Scholar]
- Ljuša, M.; Počivavšek, G. LUCAS—Land Use/Land Cover Area Frame Statistical Survey—Importance and development in Bosnia and Herzegovina, In Proceedings of the 23rd International Scientific-Experts Congress on Agriculture and Food Industry, Izmir, Turkey, 27–29 September 2012.
- Bettio, M.; Delincé, J.; Bruyas, P.; Croi, W.; Eiden, G. Area frame surveys: Aim, principals and operational surveys. In Building Agri-Environmental Indicators, Focusing on the European Area Frame Survey LUCAS. EC Report EUR 20521; European Commission: Brussels, Belgium, 2002; pp. 12–27. [Google Scholar]
- González, F.; López, S.; Cuevas, J.M. Comparing Two Methodologies for Crop Area Estimation in Spain Using Landsat TM Images and Ground Gathered Data. Remote Sens. Environ. 1991, 35, 29–36. [Google Scholar]
- Gallego, J. Area Sampling Frames for Agricultural and Environmental Statistics, Short guidelines for Developing Countries. JRC Tech. Rep. 2015. [Google Scholar] [CrossRef]
- Sabatini, F.M.; Burrascano, S.; Keeton, W.S.; Levers, C.H.; Lindner, M.; Pötzschner, F.; Verkerk, P.J.; Bauhus, J.; Buchwald, E.; Chaskovsky, O.; et al. Where are Europe’s last primary forests? Divers. Distrib. 2018, 24, 1426–1439. [Google Scholar] [CrossRef] [Green Version]
- Kordas, R.; Dumbrell, A.; Woodward, G. Large-Scale Ecology: Model Systems to Global Perspectives; Department of Life Sciences, Imperial College: London, UK, 2016. [Google Scholar]
- Scarnò, M.; Barcaroli, G.; Ballin, M.; Masselli, M. Redesign Sample for Land Use/Cover Area Frame Survey (LUCAS); European Commission: Brussels, Belgium, 2018; p. 11. [Google Scholar]
- Ministry of Agriculture. Ökoszisztéma-alaptérkép és adatmodell kialakítása. Magyarország Ökosztisztéma-alaptérképe. In Magyarország Ökosztisztéma-Alaptérképe Dokumentáció; Agrárminisztérium: Budapest, Hungary, 2019. [Google Scholar]
- Tanács, E.; Belényesi, M.; Lehoczki, R.; Pataki, R.; Petrik, O.; Standovár, T.; Pásztor, L.; Laborczi, A.; Szatmári, G.; Molnár, Z.; et al. Országos, nagyfelbontású ökoszisztéma- alaptérkép: Módszertan, validáció és felhasználási lehetőségek. Természetvédelmi Közlemények 2019, 25, 34–58. [Google Scholar] [CrossRef]
- Ódor, P.; van Hees, F.M. Preferences of dead wood inhabiting bryophytes for decay stage, log size and habitat types in Hungarian beech forests. J. Bryol. 2004, 26, 79–95. [Google Scholar] [CrossRef]
- Ódor, P.; van Hees, A.F.M.; Heilmann-Clausen, J.; Christensen, M.; Aude, E.; van Dort, K.W.; Piltaver, A.; Siller, I.; Veerkamp, M.T.; Grebenc, T.; et al. Ecological succession of bryophytes, vascular plants and fungi on beech coarse woody debris in Europe. Nat. Man Work. Rep. 2004, 51, 1–140. [Google Scholar]
- Woods, K.D.; Nagel, T.A.; Brzeziecki, B.; Cowell, M.C.; Firm, D.; Jaloviar, P.; Kucbel, S.; Lin, Y.; Maciejewski, Z.; Szwagrzyk, J.; et al. Multi-decade tree mortality in temperate old-growth forests of Europe and North America: Non-equilibrial dynamics and species-individualistic response to disturbance. Glob. Ecol. Biogeogr. 2021, 30, 1–23. [Google Scholar] [CrossRef]
- Kovács, B.; Tinya, F.; Bidló, A.; Boros, G.; Csépányi, P.; Elek, Z.; Horváth, C.V.; Illés, G.; Locatelli, J.; Németh, C.; et al. Introducing the “Pilis Gap Experiment”: A new multi-taxa study focusing on the effects of continuous cover forestry. In Governing and Managing Forests for Multiple Ecosystem Services Across the Globe; Book of Abstracts: Bonn, Germany, 2020; pp. 105–106. [Google Scholar]
- Nagy, K.M.; Malatinszky, Á. Unique botanical values in a metropolitan area and the landscape history reasons of their occurrence on the Széchenyi Hill, Budapest. Nat. Conserv. 2019, 32, 35–50. [Google Scholar] [CrossRef]
- Polewski, P.; Yao, W.; Heurich, M.; Krzystek, P.; Stilla, U. Active learning approach to detecting standing dead trees from ALS point clouds combined with aerial infrared imagery. In Proceedings of the 2015 IEEE Conference on Computer Vision and Pattern Recognition Workshops (CVPRW), Boston, MA, USA, 7–12 June 2015; pp. 10–18. [Google Scholar] [CrossRef]
- Yrttimaa, T.; Saarinen, N.; Luoma, V.; Tanhuanpää, T.; Kankare, V.; Liang, X.; Hyyppä, J.; Holopainen, M.; Vastaranta, M. Detecting and characterizing downed deadwood using terrestrial laser scanning. ISPRS J. Photogramm. Remote Sens. 2019, 151, 76–90. [Google Scholar] [CrossRef]
- 8th Environment Action Programme Proposal: Proposal for a Decision of the European Parliament and of the Council on a General Union Environment Action Programme to 2030; European Commission: Brussels, Belgium, 2020.
- Török, K.; Horváth, F.; Kövendi-Jakó, A.; Halassy, M.; Bölöni, J.; Szitár, K. Meeting Aichi Target 15: Efforts and further needs of ecological restoration in Hungary. Biol. Conserv. 2019, 235, 128–135. [Google Scholar] [CrossRef] [Green Version]
- Tagliafierro, C.; Longo, A.; Van Eetvelde, V.; Antrop, M.; Hutchinson, G. Landscape economic valuation by integrating landscape ecology into landscape economics. Environ. Sci. Policy 2013, 10. [Google Scholar] [CrossRef]
- Albrizio, S.; Kozluk, T.; Zipperer, V. Environmental policies and productivity growth: Evidence across industries and firms. J. Environ. Econ. Manag. 2017, 81, 209–226. [Google Scholar] [CrossRef]
- Fritz, S.; See, L.; Bayasa, L.; Waldner, F.; Jacques, D.; Becker-Reshef, I.; Whitcraft, A.; Baruth, B.; Bonifacio, R.; Crutchfield, J.; et al. A comparison of global agricultural monitoring systems and current gaps. Agric. Syst. 2019, 168, 258–272. [Google Scholar] [CrossRef]
- Dias, E.; Elias, R.B.; Nunes, V. Vegetation mapping and nature conservation: A case study in Terceira Island (Azores). Biodivers. Conserv. 2004, 13, 1519–1539. [Google Scholar] [CrossRef]
- Pedrotti, F. Plant and Vegetation Mapping; Springer: Berlin, Germany, 2013; p. 294. [Google Scholar]
- Dunford, R.; Michel, K.; Gagnage, M.; Piégay, H.; Trémelo, M.L. Potential and Constraints of Unmanned Aerial Vehicle Technology for the Characterization of Mediterranean Riparian Forest. Int. J. Remote Sens. 2013, 30, 4915–4935. [Google Scholar] [CrossRef]
- Durfee, N.; Ochoa, C.G.; Mata-Gonzalez, R. The Use of Low-Altitude UAV Imagery to Assess Western Juniper Density and Canopy Cover in Treated and Untreated Stands. Forests 2019, 10, 296. [Google Scholar] [CrossRef] [Green Version]
- Gini, R.; Passoni, D.; Pinto, L.; Sona, G. Use of Unmanned Aerial Systems for multispectral survey and tree classification: A test in a park area of northern Italy. Eur. J. Remote Sens. 2014, 47, 251–269. [Google Scholar] [CrossRef]
- Murariu, G.; Hahuie, V.; Murariu, A.; Georgescu, L.; Iticescu, C.; Calin, M.; Preda, C.; Buruiana, D.; Carp, G.B. Forest monitoring method using combinations of satellite and UAV aerial images. Case study—Bălăbăneşti forest. Int. J. Conserv. Sci. 2017, 8, 703–714. [Google Scholar]
- Cortés, H.; Moltzan, B. National Reports of Major Forest Insect and Disease Conditions in the United States; Forest Service, Department of Agriculture: Washington DC, USA, 2017. [Google Scholar]
- Dash, J.P.; Watt, M.S.; Pearse, G.D.; Heaphy, M.; Dungey, H.S. Assessing very high resolution UAV imagery for monitoring forest health during a simulated disease outbreak. ISPRS J. Photogramm. Remote Sens. 2017, 131, 1–14. [Google Scholar] [CrossRef]
- Standovár, T.; Szmorad, F.; Kovács, B.; Kelemen, K.; Plattner, M.; Roth, T.; Pataki, Z. A novel forest state assessment methodology to support conservation and forest management planning. Community Ecol. 2016, 17, 167–177. [Google Scholar] [CrossRef] [Green Version]
- Koch, B. Remote sensing supporting national forest assessments, Department of Remote Sensing and Landscape Information Systems, Faculty of Forest and Environmental Sciences, Albert-Ludwigs University of Freiburg. In Knowledge Reference for National Forest Assessments; Food and Agriculture Organization of the United Nations: Rome, Italy, 2015; pp. 81–82. [Google Scholar]
Publisher’s Note: MDPI stays neutral with regard to jurisdictional claims in published maps and institutional affiliations. |
© 2021 by the authors. Licensee MDPI, Basel, Switzerland. This article is an open access article distributed under the terms and conditions of the Creative Commons Attribution (CC BY) license (https://creativecommons.org/licenses/by/4.0/).