1. Introduction
The integrated planning and operation of traditionally separated energy systems is considered to be an important aspect of making cities more sustainable in the future. This means that urban energy systems are supposed to evolve into complex multi-network structures, in contrast to the classical silo-like approach of individual (separated) energy carriers today. In recent years, this concept has been investigated from different and complementary view points, focusing, for instance, on the electrical [
1] or the thermal [
2] perspective.
The paradigm shift in the planning and operation of urban energy systems towards an increase in sustainability implies a growing number of intricate interactions between previously separated systems and stakeholders. Within this context, simulation-based approaches provide the most viable way of assessing such systems in terms of cost and time effectiveness. Recently, a lot of effort has been made to on develop new methods and tools for planning and assessing urban multi-energy systems. However, models and tools are not the only prerequisites for successful simulation-based assessments. As the considered systems grow larger and more heterogeneous, the availability of high-quality, well-formatted and semantically structured data becomes a crucial prerequisite to handle the associated complexity. Unfortunately, best practices for data modelling are rarely utilized in the context of energy-related simulations, so data management and data access often become tedious and cumbersome tasks. However, with the steady progress of digitalization, more and more spatial and semantic urban data also become available and accessible. In the context of urban energy system simulations, the challenge is to represent the required data in a way that simulation tools can make use of them.
This work presents a novel approach for linking semantic 3D city modelling and domain-specific simulations of urban energy systems. The goal is to improve workflows for simulation-based assessments of urban energy systems, by providing energy simulation experts with adequate methods and tools to generate and subsequently use semantic urban data models for their specific purposes. This simplifies the access of GIS-based tools for urban energy planning and visualization to these detailed simulation results, which can then support energy utilities or city planners in identifying synergies and opportunities. This can increase the reliability and robustness of energy supply and demand, potentially improving the energy sustainability of future urban energy systems.
Scope and Main Contributions
Based on a discussion of the misalignment between the existing methodologies and tools for urban data modelling and energy simulations, a list of technical requirements for bridging the gaps between these disciplines is formulated. To demonstrate the feasibility of the proposed approach, a software prototype—referred to as Data Access Layer (DAL)—has been developed, which provides a concrete implementation of these requirements and demonstrates the usefulness for assessments of urban energy systems. The DAL relies on the CityGML standard and its extensions for representing the urban environment and utilizes a co-simulation environment to perform energy-related analyses.
In short, this work proposes a methodology and provides a proof of concept for (i) easy access to urban data models for typical energy simulation toolchains, (ii) creating urban data models based on the modelling paradigms used by energy simulation experts, (iii) the automated generation of simulation models from urban data models, and (iv) the possibility to store simulation setups alongside urban data models in the same database.
2. Current Trends in Modelling and Simulation of Urban Environments
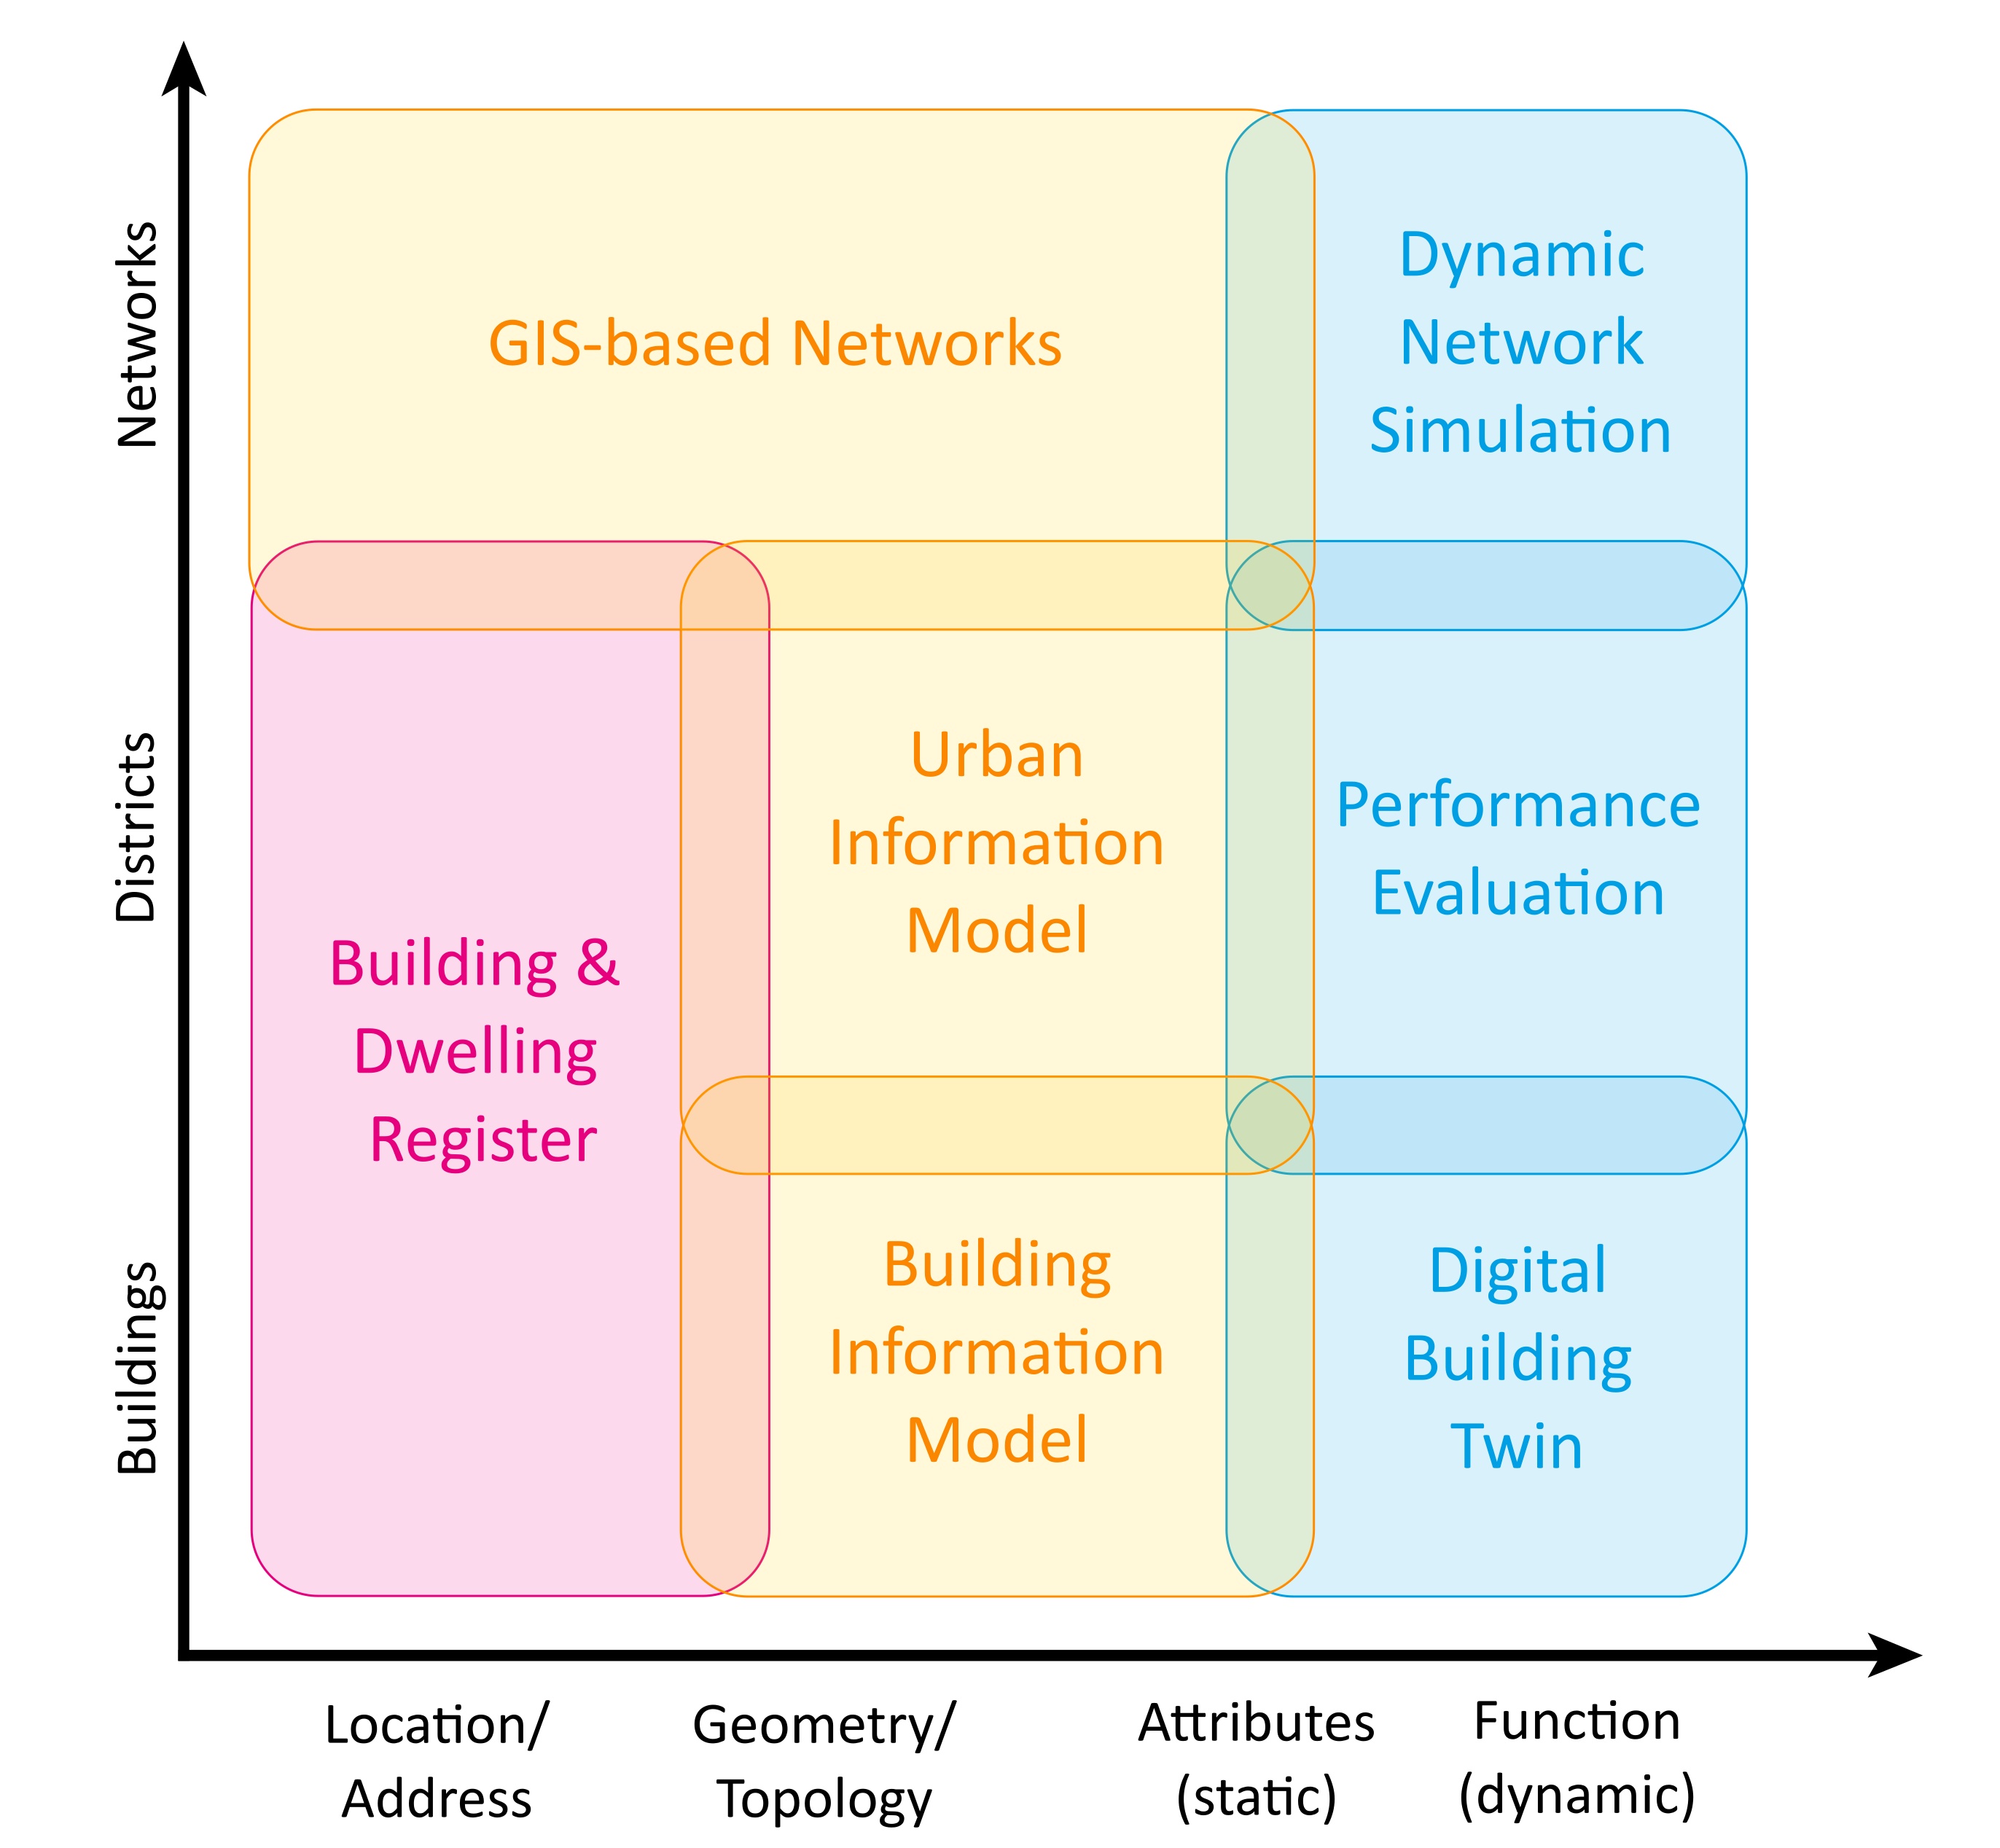
Figure 1 shows an overview of how different types of data models and digital technologies (including simulation) are related in the context of urban environments. Urban data models and simulations are widely used in city planning and become more important every day. Their spatial resolution ranges, on the one hand, from building information of single dwellings to representations of entire districts and (energy) networks. On the other hand, the data comprise different types of semantic information stored in several different formats and databases, e.g., dwelling registers (purple box), GIS-based network representations or
building information model (BIM) data sets (yellow boxes).
In practice, these heterogeneous data sources are typically neither integrated nor linked. This alone justifies the need for a central urban information model (UIM) that acts as a data integration platform and as a source of harmonized data. For example, a UIM can, on the one hand, support the modelling of spatial and non-spatial data at the urban scale; on the other hand, it can help connect existing databases to form a single information hub for city planners of different domains. This hub can then form the basis for different applications and serve, for instance, as a data source for the assessment of energy network operation or for the performance evaluation of buildings or digital building twins (blue boxes).
From the perspective of a city, access to harmonized urban data can lay the foundation for in-depth sustainability studies in terms of generation and consumption of energy. For instance, detailed neighborhood/district energy planning can be based on digital building data. This enables the creation of heating-demand registers for the identification of district heating expansion areas, the planning of local energy production such as photo-voltaic systems, and the identification of target areas for redevelopment activities, to name just a few.
In the following, a brief overview of the current trends in urban data modelling and energy system simulations is given, also highlighting the differences between these two fields. Whereas urban data models focus on the spatial representation and semantic categorization of entities within the urban space, domain-specific energy simulations study the behavior of the related physical and technical processes.
2.1. Semantic 3D City Modelling
During the last decade, semantic 3D city models have been adopted resembling an implementation of the UIM paradigm. Important to note here is that the name
semantic 3D city model does not refer to geometry only. All urban objects in a semantic 3D city model (buildings, vegetation, water bodies, utility networks, etc.) are described in terms of geometry (e.g., height, volume, position), semantics (e.g., building type, usage, construction date), topology (e.g., adjacency to other buildings, shared walls) and hierarchies. Hence, the resulting urban model has the advantage of being spatio-semantically coherent [
4]. In terms of available (open) standardized data models for city models, the only existing solution is currently offered by
CityGML.
CityGML [
5] has been an open and international standard since 2008. It has been conceived specifically as an information and data model for storage, manipulation, presentation and data exchange of semantic city models at the urban and territorial scale. Version 1.0 was released in 2008, followed by version 2.0 in 2012. A thoroughly updated and extended new version, version 3.0 [
6], is being finalized at the time of writing (summer 2021). CityGML 2.0, upon which the work presented in this articla is based, provides a generic data model that describes geometry, topology, semantics and appearance of 3D objects in urban environments, with five levels of geometric and semantic detail—named
levels of detail (LoD)—that range from LoD0 (the less detailed one) to LoD4 (the most detailed one). The data model also includes generalization hierarchies between thematic classes, aggregations, relations between objects, and spatial properties. It is possible to connect all city objects to specific ancillary data (e.g., cadastral data) by means of external links. Finally, CityGML offers an extension mechanism by means of so-called
Application Domain Extensions (ADE). Depending on the specific needs, new features or properties can be added, hence greatly augmenting its modelling capabilities.
The benefits tied to a coherent urban model have already been exploited by several authors and projects in the last 15 years. Applications range from urban planning [
7], noise mapping [
8] and augmented reality [
9] to energy (see below). [
10] provides a review of applications based on 3D city models.
2.1.1. Energy ADE
One of the fields in which semantic 3D city models have found a particularly rich area of application is energy. As a matter of fact, semantic 3D city models and their city-wide characterization of all main urban entities are—data-wise—the ideal starting point to support
urban energy modelling [
11,
12], a relatively new discipline that has been experiencing a steady increase in terms of popularity during the last decade to support the energy transition process at the city scale.
The number of studies and applications that invert the “classical” top-down approach by a more detailed, mostly bottom-up modelling approach has been growing in recent years. A common approach is to start at the building level in terms of granularity and spatial resolution. For sustainability studies and energy planning, a comprehensive knowledge of the demand and supply of energy resources, including their spatial distribution within urban areas, is therefore of great relevance. As a direct consequence, exchange of harmonized data among the urban actors and among the software tools is a fundamental aspect underlying urban energy modelling. One of the keys to address data interoperability issues is the adoption of standards—especially whenever reliable open standards exist.
Surprisingly, only few open standards exist for modelling energy-related aspects of the built environment, and they are strongly dependent on the scale and application domain they are conceived for. The authors of [
13] give an overview of existing open standards both at the building and city levels. In particular, at the city level, the number of choices is still rather small. In addition to CityGML, the authors mention the INSPIRE [
14] Data Specification on Buildings [
15] which, in part, takes inspiration from CityGML itself and is deemed, however, too generic to cover adequately the needs of complex multi-domain applications.
The fact that CityGML by itself is not capable of representing energy-related aspects adequately led to the development of the
Energy Application Domain Extension [
13], typically referred to as
Energy ADE. The extension provides a unique and standardized data model to overcome, on the one side, the data interoperability issues and, on the other side, to allow for both detailed single-building energy simulations and city-wide bottom-up energy assessments. The Energy ADE focuses primarily on buildings, their physical properties and installed systems. However, some parts of the Energy ADE can be used beyond the building scale for characterizing the energy demand of other urban objects such as street lamps or the energy production of power plants. Since its early stages of development, the Energy ADE has been tested and successfully adopted in several studies and projects [
16,
17].
2.1.2. Utility Network ADE
Conceptually similar to the Energy ADE, the
Utility Network ADE [
18,
19] focuses on utility networks, of which urban centralized energy infrastructures (e.g., district heating systems or gas networks) play a relevant role for this work. The Utility Network ADE is therefore complementary in scope and scale to the Energy ADE.
The Utility Network ADE defines a topological network model facilitating sophisticated analyses on utility networks and supplying infrastructures. Despite the availability of other data models and standards for utility networks, e.g., the INSPIRE utility networks submodel [
20], the ISO standard Industry Foundation Classes (IFC) [
21] and the ArcGIS Utility Network model [
22], the Utility Network ADE aims to provide a common basis for the integration of diverse models in order to facilitate joint analyses and visualization tasks. The Utility Network ADE allows for the depiction of heterogeneous networks and comprises a dual representation of network topography and topology. Additionally, it enables a representation of spatial and functional aspects of the networks. The Utility Network ADE’s data model allows for network hierarchies of arbitrary depth, nesting of network components, and modelling of multi-modal networks. Furthermore, it optionally allows for the representation of the network components as 3D topographic city objects. Finally, the data model allows the modelling of interdependencies between network features and city objects as well as between network features of different types of networks. The Utility Network ADE has been used in a number of case studies, ranging from the integrated modelling of heterogeneous networks [
23] to the simulation of cascading effects [
24].
From the point of view of multi-network simulations, the representation of a city and all of its energy-related entities and properties under the CityGML “umbrella” is interesting for several reasons. First and foremost, regarding the urban data context, the integrated modelling of networks within a 3D city model strongly underpins the actual urban energy system and allows for the linking with additional information from other city objects, such as buildings or other city objects such as street lamps, etc. Secondly, to achieve full interoperability, an integrated data model provides a holistic view of all urban networks, with sufficient semantic, topographical and topological information to generate simulation models for any simulation tool. At the same time, simulation results can be associated with already existing elements (e.g., maximum voltage levels at individual busbars) and be more easily explored and visualized.
2.1.3. Scenario ADE
Due to the intrinsic advantages offered by a CityGML-based city model, a common functionality that many applications rely upon is the possibility to define scenarios and compute related results accordingly. A city model can represent the current situation (status quo) or be one of many different scenario-derived city models stemming from the status quo after a number of changes and modifications. For example, key performance indicators are obtained in order to assess qualitatively and quantitatively the performance or the effects of selected measures in a sustainability study. As such, semantic 3D city models offer a valuable source of data for different types of simulations in the context of integrated urban energy systems in a consistent and harmonized way.
As CityGML does not provide a standardized way of dealing with scenarios, scenario-dependent results, or the description of the changes required to obtain a modified city model from a base model, the
Scenario ADE is the last application domain extension mentioned in this section. Scenario ADE has been under development since 2017, and is a first attempt to fill the mentioned gap. It extends the CityGML data model by introducing additional classes and properties to deal with scenario-dependent entities. A scenario is defined by a unique composition of a set of urban entities (a selection of buildings, network elements, etc.), a set of properties to describe them (current properties and/or scenario-specific properties) and the associated simulation tool. For each composition, results can be stored independently, therefore allowing for comparison between different scenarios. Additionally, information about each operation needed to generate a specific scenario can be stored, allowing for a better documentation of how a certain set of urban entities has been selected and characterized. The Scenario ADE data model is openly published and available, and further details can be found in [
25].
2.1.4. Database Implementation: 3DCityDB Plus
All above-mentioned data models (CityGML and its ADEs) represent abstract, conceptual models that are meant to organize elements of data. They shall describe the elements’ structures in a standardized way and define how they relate to one another, but also how they relate to the properties of real-world entities. In terms of implementation, CityGML data can be stored and exchanged in different formats. The first to be developed, and one of the most common, is a file-based format using XML documents. More recently, a JSON-based alternative has been introduced [
26]. Finally, an implementation for relational database management systems exists. The
3D City Database [
27]—also referred to as
3DCityDB—represents the official database implementation of the CityGML data model. The 3DCityDB consists of an open-source database schema (both for Oracle and PostgreSQL/PostGIS) and is accompanied by several tools that allow for import and export of CityGML data to and from the database.
The current version of the 3DCityDB (v4.3 at the time of writing) provides support (despite certain limitations) for ADEs. However, when the project described in this work started, the then-available 3DCityDB (version v3.3) lacked a generic solution for handling ADE elements in CityGML instance documents, although some preliminary research work had been carried out [
28]. In the meantime, a set of database design and mapping rules were defined and later implemented and openly published [
29] in order to extend the 3DCityDB v3.3 and add ADE support at database level (for PostgreSQL). For convenience, the resulting extended 3DCityDB was named
3DCityDB Plus. Further technical details can be found in [
13,
30].
2.2. Simulation of Energy-Related Aspects in Urban Environments
For the assessment of energy-related applications, the collection of data as well as the spatial and semantic modelling of the associated infrastructure are only the first step. The real task lies in studying the behavior of the related physical and technical processes. This includes, for example, the analysis of the voltage stability in power grids, the thermo-hydraulic stability of heat networks or the interplay of energy demand and generation in the presence of volatile, renewable energy sources. The most efficient and cost-effective way of performing such assessments are simulations, which try to calculate and predict the evolution of these systems over time. To run them, the simulations’ underlying dedicated models not only include the systems’ spatial and semantic properties, but also reflect their behavior in terms of physical and/or technical processes.
Energy-related simulation tools traditionally focus on just one specific engineering domain, such as power grids, heating networks or buildings. From a historical perspective, this approach is quite natural, given that these tools are typically either the result of long-term academic research efforts of specific fields of engineering or have been developed by industry with a specific aim and audience in mind. However, even though these tools have been very successful in delivering valuable insights in the past, they are as such not suited for analyzing future urban energy systems, which are believed to become multi-carrier energy systems [
31,
32].
In order to overcome the challenges of modelling and simulating multi-carrier energy systems, a lot of research and development has been carried out in recent years. For instance, in the context of technical assessments, which target primarily issues related to the operation and closed-loop control of such systems, two approaches have received particular attention. Multi-domain modelling languages, such as Modelica [
33] and MATLAB/Simulink, on the one hand, and co-simulation approaches, especially based on the FMI specification [
34] and the HLA standard [
35], on the other hand, have gained a lot of popularity. As a matter of fact, both approaches have been successful in showing their potential regarding the assessment of complex energy systems on the scale of neighbourhoods, districts and cities—see for instance [
36,
37,
38] or [
39,
40,
41,
42].
3. Methodology and Technical Requirements
Semantic 3D city models provide a representation of urban space, comprising a description of all its relevant entities (buildings, infrastructure, water bodies, etc.). They describe spatial and non-spatial properties and include information on topologies and hierarchies, all of which represent an essential input for energy simulations. However, the methods and tools used by energy simulation experts differ substantially, which makes the interaction on a technical level tedious and prevents effective collaboration. In the following, the most relevant types of misalignment between these methodologies and tools are listed and explained, leading to the formulation of the main technical requirements for bridging the gaps between these communities. These requirements are listed in
Table 1.
3.1. Data Access (TR1)
For the GIS-community, a variety of tools for creating and retrieving geospatial data are already available for semantic 3D city modelling in general and for CityGML in particular. Unfortunately, these tools generally do not integrate well into typical workflows for energy simulations. Typical reasons for this are not the technical maturity of the related tools or their provided functionality per se, but rather practical obstacles (e.g., licenses for commercial tools) and limited expertise of the energy simulation community (e.g., proficiency in SQL, familiarity with GIS formats and technologies). Nevertheless, access to integrated, city-wide data is the most fundamental prerequisite for energy simulation experts and one of the biggest motivations to adopt and include concepts from urban data modelling. Therefore, providing easy access to CityGML data for typical toolchains for energy simulations is a fundamental technical requirement, as expressed by
TR1 in
Table 1.
3.2. Modelling Support (TR2)
In general, the modelling paradigms behind semantic city models such as CityGML do not align with the general thinking and structure that experts for energy simulations apply to create models. Energy simulation models are in comparison less abstract and more focused on the specifics of the respective domain, their semantic representations aim to be convenient for domain experts and do not attempt to be applicable to other domains.
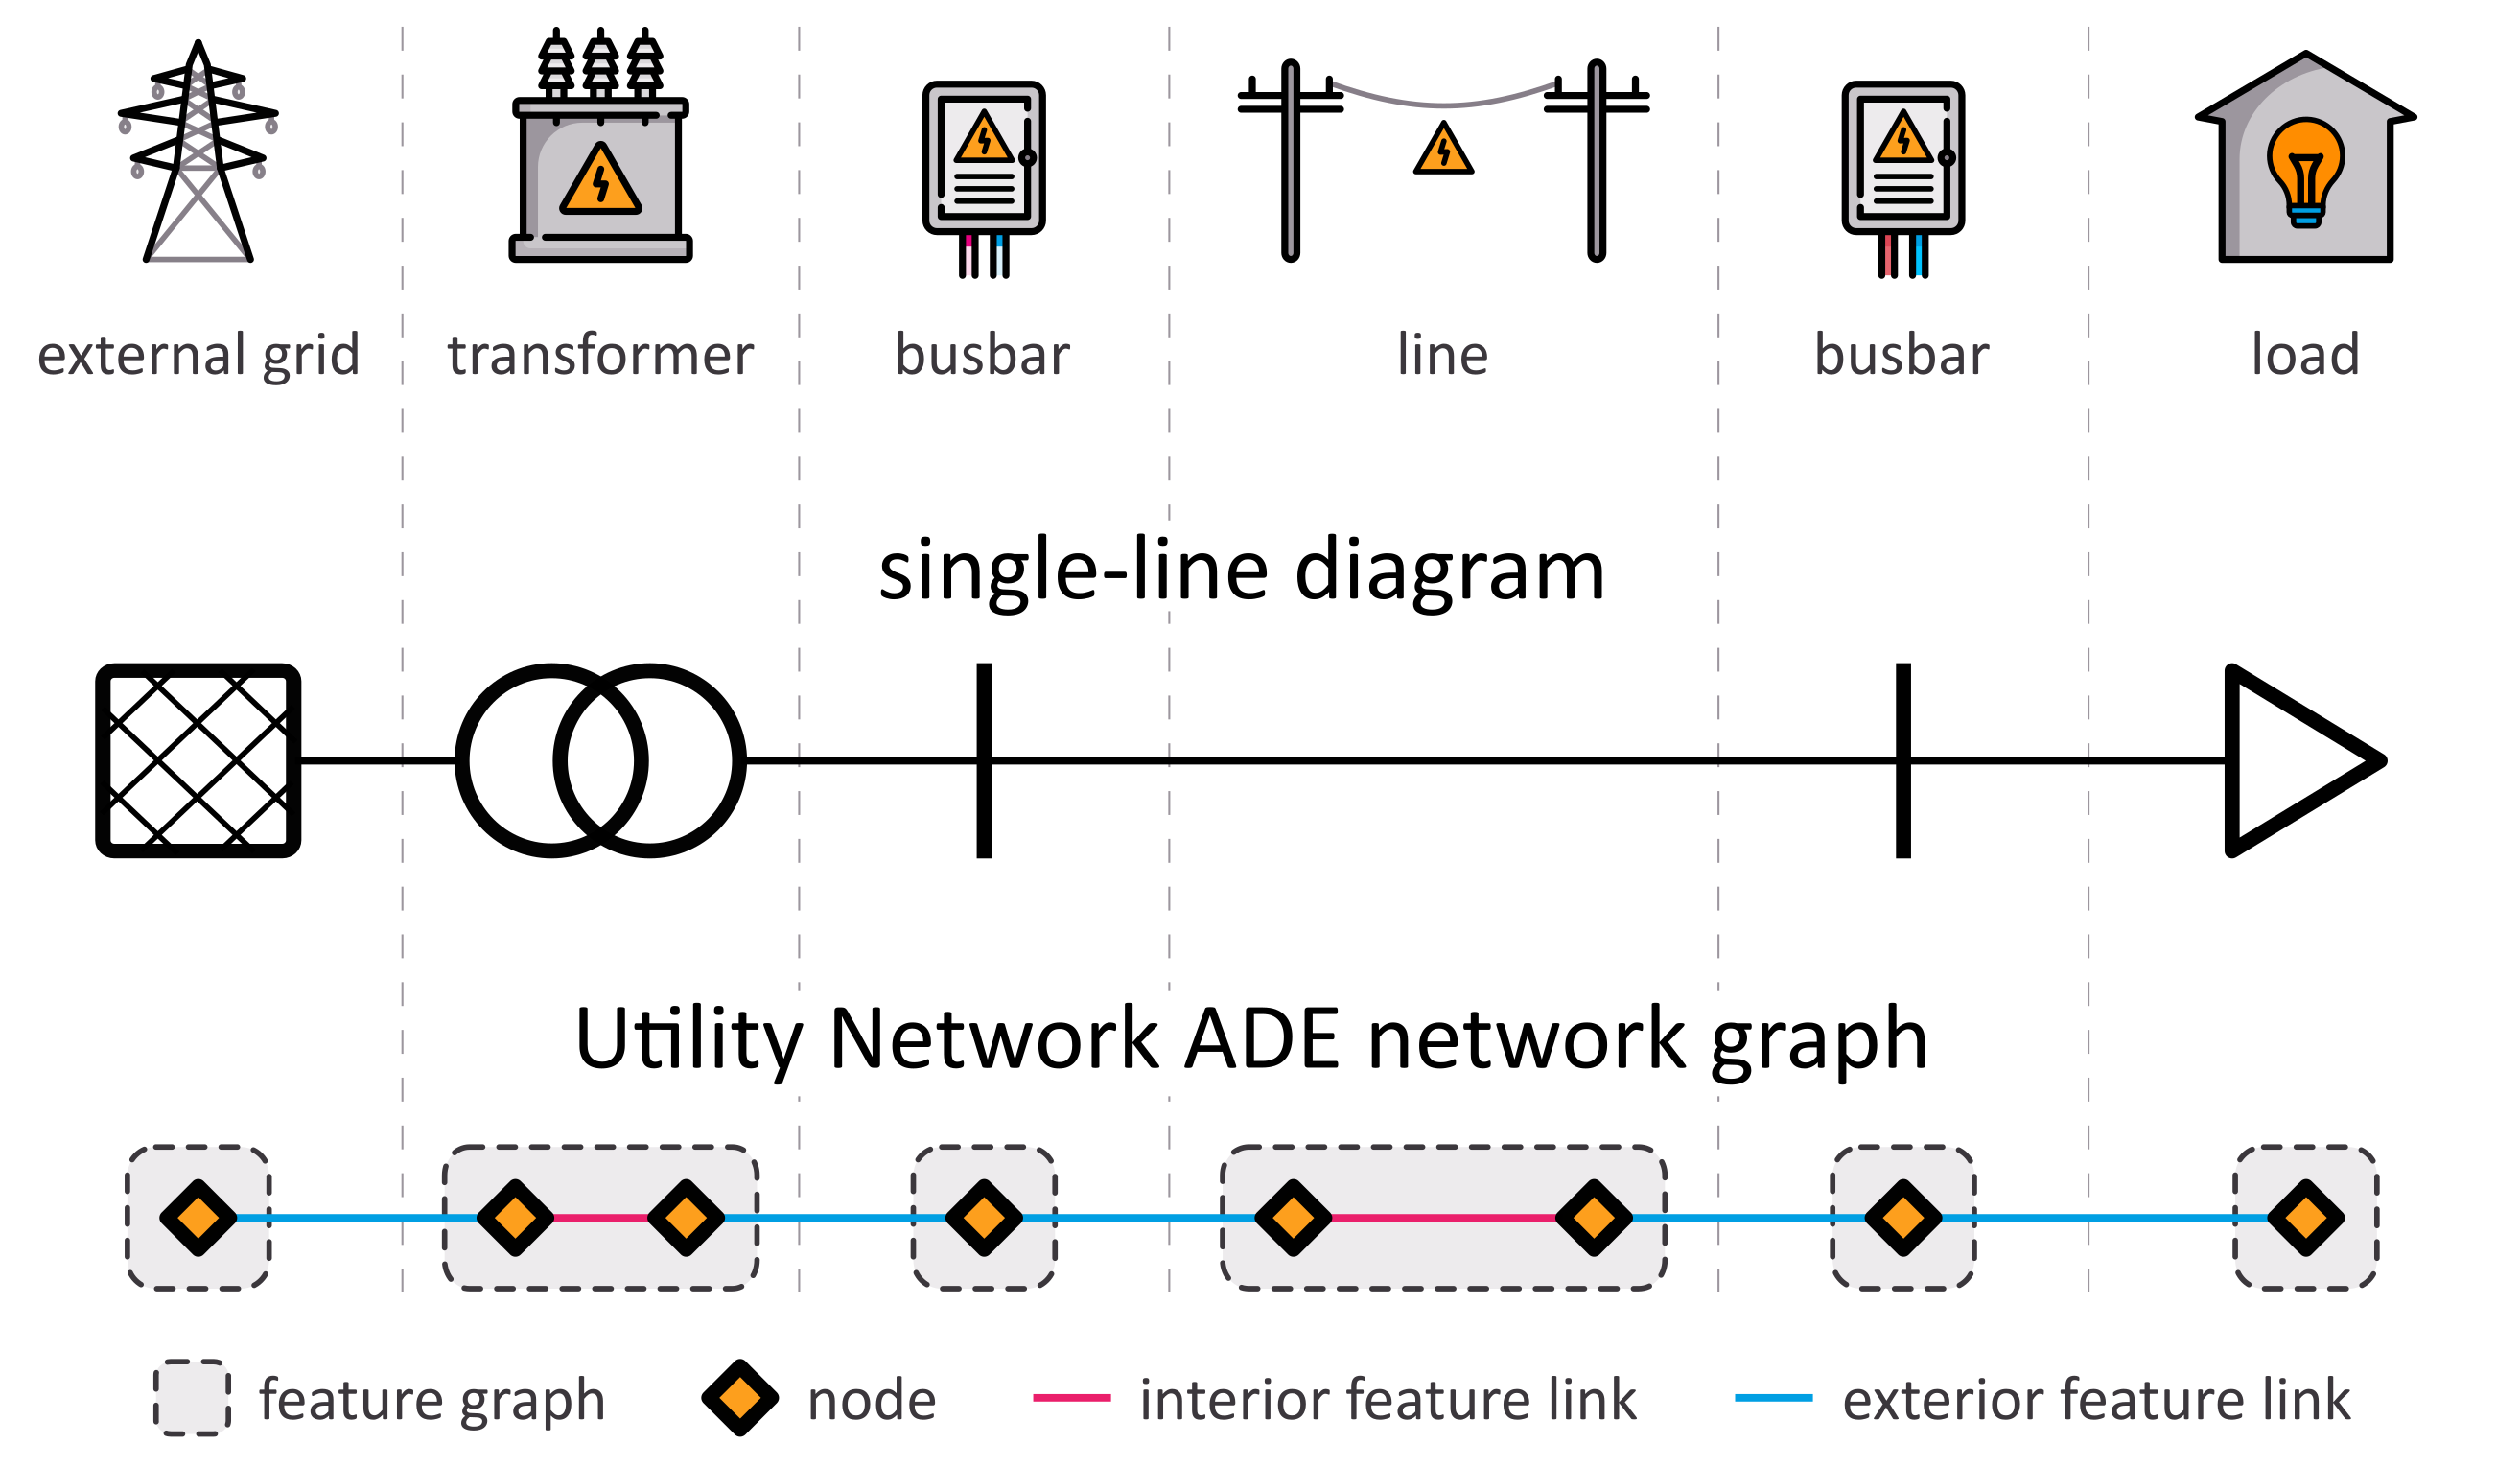
For example, the representation of networks in the Utility Network ADE is based on so-called
network features, which are abstractions of real-world components of a network. Each network feature comprises both a topographical and (optionally) a topological representation, with the latter using so-called
feature graphs to provide a topological and functional model of the corresponding network entity. The feature graphs consist of
nodes connected through
interior feature links, which can themselves be connected to other feature graphs through
exterior feature links. This concept provides a flexible mechanism to represent very different types of utility networks, including power grids, telecommunication networks or pipe systems. However, a power engineer uses domain-specific models that are more straightforward to apply. In general, a distribution grid model is represented by a much simpler
single-line diagram, whose creation typically starts with defining the electrical busbars, connecting them with lines and cables, then adding electrical loads and other equipment (transformers, generators, etc.).
Figure 2 shows a comparison of these different modelling approaches for a simple electrical network. Similar, yet incompatible approaches apply for the modelling of other energy networks.
The domain-specific approaches are a subset of the more generic approach used for instance by the Utility Network ADE and can be mapped accordingly. However, energy simulation experts are—for obvious reasons—keen to use their domain-specific approaches. Hence, in order for energy simulation experts to adopt and include concepts from urban data modelling, a mapping between these paradigms is required, as expressed by
TR2 in
Table 1.
3.3. Simulation Model Generation (TR3)
As mentioned in
Section 2.2, assessments of energy-related applications rely on the modelling of the behavior of physical and/or technical processes. When creating a corresponding simulation model, knowledge about spatial and semantic properties of components and subsystems is a vital input. Hence, retrieving this type of information directly from a semantic city model could potentially prove useful when creating such simulation models. For instance, the positions and other (static) attributes of transformers, cables and loads of an electrical distribution grid can be retrieved from a semantic city model. Based on this information, the corresponding technical component models can be parameterized (e.g., type of transformer, length and diameter of cables, time series of electrical demand, etc.) and put together to create a simulation model. This simulation model could then be used to assess whether the electrical network can be operated safely.
Unfortunately, the topological and topographical representation of data used in urban data models is, in general, not compatible with energy simulation tools. Even though this prevents the direct use of semantic city data by these simulation tools, the data can still be used to generate simulation models in an appropriate format that can be imported by these tools. However, it should be noted that this is not a one-to-one mapping, but rather requires domain-specific reasoning and inference (e.g., selecting and parameterizing the correct physics-based model for a transformer based upon a set of static attributes from a semantic city model). Simulation models potentially comprise a large number of components and subsystems, which makes the manual mapping from semantic city models a tedious and error-prone task. Hence, in order to promote the usage of urban data models by energy simulation experts, new tools for the automated generation of simulation models for established simulators from CityGML data are required, as expressed by
TR3 in
Table 1.
3.4. Simulation Setup (TR4)
The growing availability of semantic urban data models acting as information hub of integrated and harmonized city-wide information seems to be the ideal answer to the needs for modelling complex urban systems. This is especially true for co-simulation approaches, where different subsystems are simulated in different tools with potentially incompatible data formats, which prevents, in general, a closed representation of the overall system in terms of simulation models.
However, simulation setups require storing additional metainformation for executing an actual simulation or co-simulation. In the latter case, not only configurations are required for each individual simulator, but also specific information regarding the coupling and orchestration of several simulator instances. Hence, in order to increase the usefulness of urban model databases as information hubs for simulation applications, they must also integrate metadata related to simulation setups, as expressed by
TR4 in
Table 1.
4. Proof of Concept Implementation
In the following sections, a proof-of-concept implementation of the so-called Data Access Layer (DAL) is presented. This DAL addresses the challenges of linking semantic urban data models and simulation models as described in the previous section and implements solutions to the corresponding technical requirements. In order to be compatible with future developments in urban data modelling and to improve reproducibility, the DAL relies solely on CityGML and its ADEs to represent the urban environment.
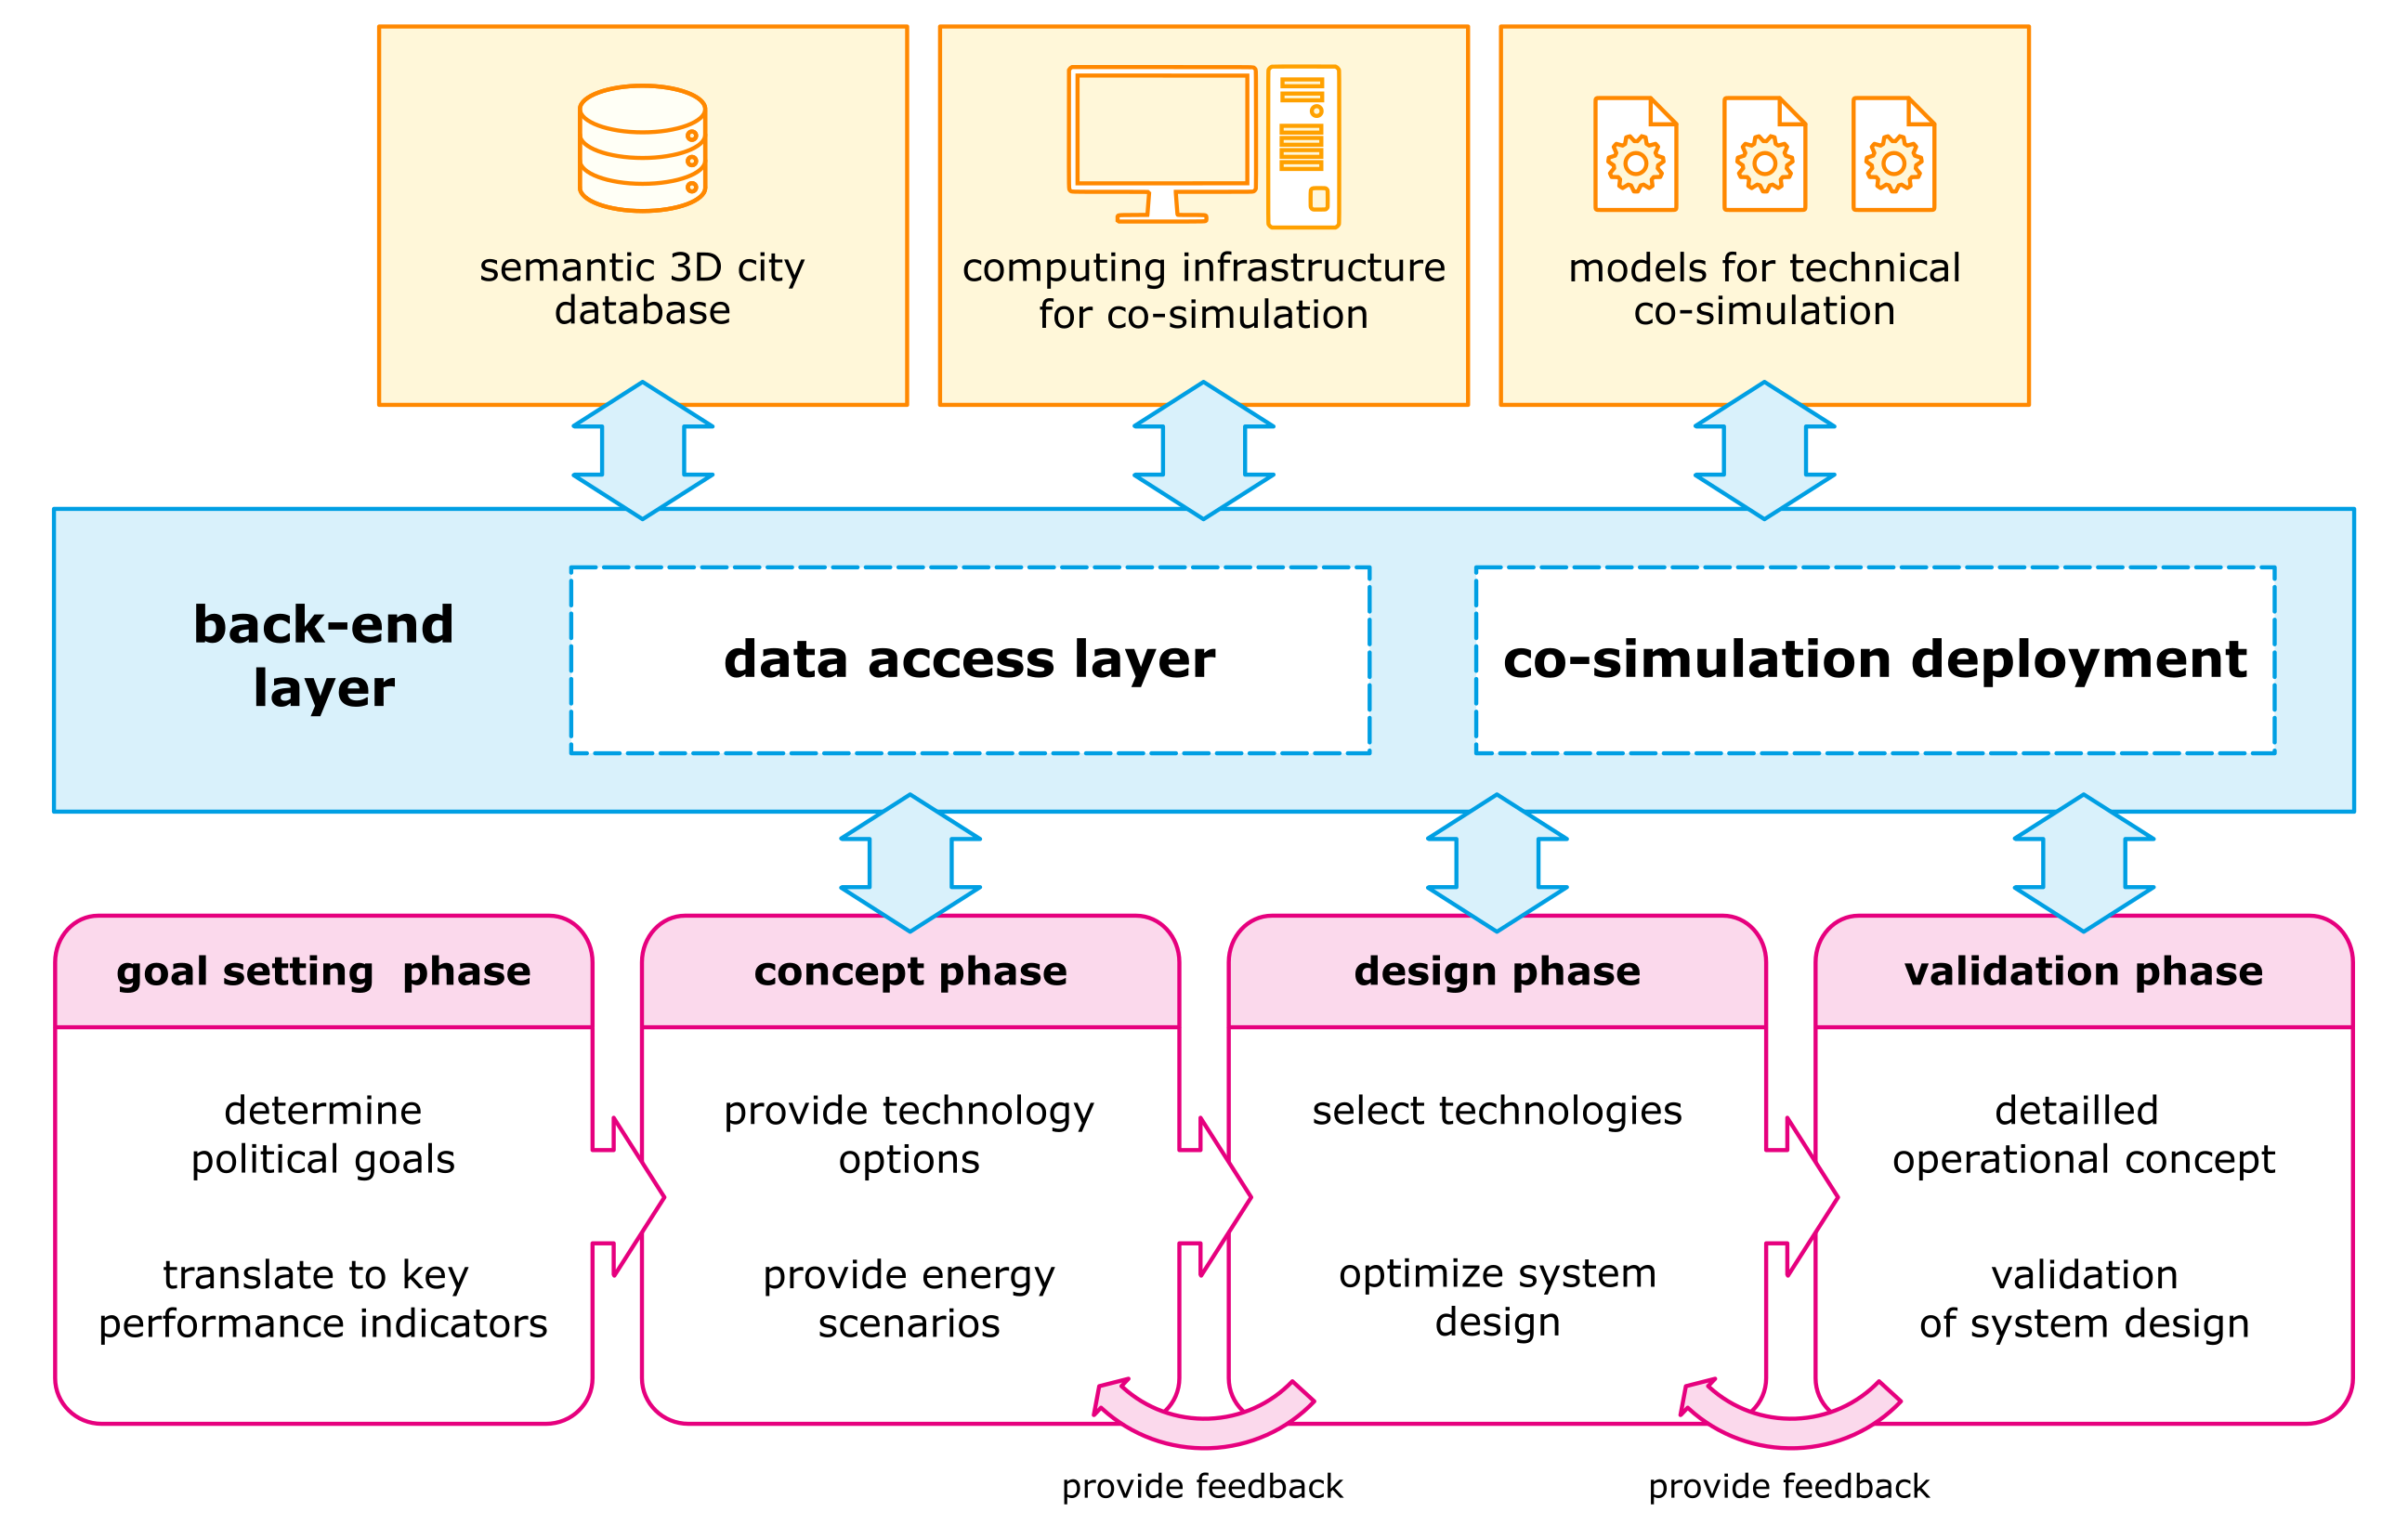
The DAL has been developed as part of project IntegrCiTy [
43], a research project that aimed to create new tools and methods to support the efficient planning of inter-operable energy networks in urban environments. Another goal was to increase sustainability in urban areas by exploring and successively exploiting possible synergies among energy networks. This approach had several consequences in terms of sustainability: while interoperability of energy supply networks allowed an increase in energy efficiency (e.g., by favoring co-generation-based scenarios) and reduced emissions (e.g., by presenting alternatives to oil-based heating), it also highlighted potentials for decreasing investment costs (i.e., moving towards more economic sustainability). Within this context, the DAL was a central component of a technical framework to support an optimal workflow for urban energy planning, as depicted in
Figure 3.
The DAL was implemented in Python and is openly available [
44]. The release version (v1.1.1) presented here and used for the demonstration in
Section 5 requires an instance of the 3DCityDB Plus (version 3.3).
4.1. Data Access Layer Prototype
The officially recommended way of accessing data in the 3DCityDB is the
3D City Database Importer/Exporter [
45]. This Java-based tool is primarily intended to import/export data from/to potentially very large files. Even though this tool integrates well into typical workflows of GIS experts, it is less suited for typical workflows of energy simulation experts, who are usually not familiar with GIS formats and related tools. Furthermore, adding ADE content to the database is still not possible via this tool.
Like in many other areas, Python has become a very popular tool in energy-related domains for workflow automation and data analysis. This trend is increasing as more and more energy-related simulation tools can be used via Python, either because they are implemented directly in Python (pandapower, TESPy, etc.), they come with a Python interface (PowerFactory, EnergyPlus, OpenModelica, etc.) or because of other developments by the user community (TRNSYS, etc.). Within this context, the basic functionality of the DAL addresses TR1 by providing user-friendly access to the 3DCityDB Plus for energy simulation experts:
Mapping of city objects: The CityGML specification and its extensions define classes for the semantic representation of objects in urban environments. The 3DCityDB, which implements the CityGML specification, maps these classes to tables with scalar attributes in the database. Moreover, it contains a dedicated table that links the class names to the corresponding tables. The DAL uses this metadata to perform a so-called object-relational mapping of all CityGML classes, which maps the tables back to Python classes at run-time (without any additional schema description information outside the database). The DAL also allows such a mapping for data contained in database views. This enables an object-oriented approach for working with the data, which, in most cases, is preferable to the handling of tuple-based raw data.
Writing city objects: The 3DCityDB Plus implements utility PL/pgSQL-based functions for inserting city object data into the database. The DAL provides a mechanism to call these functions via Python, which allows using them in a programmatic way, even in complex workflows (cf. to
Section 5 below).
Retrieving city objects: The DAL retrieves city object data as collections of objects of mapped CityGML classes (see above). The mechanism is conceptually equivalent to SQL queries and allows to define constraints and join operations based on class attributes.
For basic examples of this functionality please refer to [
46].
4.2. Support for Network Modelling
The implementation of the Energy ADE and the Utility Network ADE in the 3DCityDB Plus provides an extensive set of SQL functions for adding energy-related and network-related city object data. However, as mentioned above (see
Section 3), this functionality does not align well with the modelling paradigms of energy simulation experts. In order to address this issue in compliance with
TR2, the DAL builds upon the low-level 3DCityDB Plus functions to provide domain-specific high-level functions. The latter can be more easily included into typical modelling workflows of energy simulations experts.
An example that is representative for a large variety of component models is shown in
Figure 4. It visualizes the functionality provided by the DAL for adding a power line to the model of an electrical network represented through the help of the Utility Network ADE. As depicted in the top left of the diagram, the direct interaction of an energy simulation expert with the DAL is limited to providing information that is also required in typical domain-specific modelling workflows:
Reference to network model: The DAL requires the city object ID of the network and the corresponding network graph as well as the spatial reference system ID.
Topological information: The DAL requires information about the busses that the new line will be connected to, such as their city object IDs or their position. The information about each bus is contained in a dedicated data structure, which is generated by the DAL when creating a new electrical bus. Since creating a power network model typically starts with adding electrical busses to the network, it can be assumed that these data are available to the simulation expert when adding lines to the network model.
Technical parameters: The DAL requires specific technical information for parameterizing the line model. This includes the line capacitance (in nF/km), resistance (in W/km), inductance (in W/km), maximal thermal current (in kA) and line type (e.g, overhead line or underground cable).
This is conceptually the same type of information that is also required by comparable methods from popular network simulators (cf. pandapower or DIgSILENT PowerFactory’s Python API). Hence, energy simulation experts are trained to retrieve and work with this type of information when adding new lines to a network model. Based on this information, the DAL carries out all the necessary steps to add a representation of this line, according to the modelling scheme of the Utility Network ADE, to the 3DCityDB. This includes several steps, some of which require domain-specific knowledge about how power lines are typically modelled:
Topographical representation: The DAL generates a topographical representation of the new power line under the assumption that the electrical busses are connected by a straight line. (This is a known oversimplification of the DAL prototype that can be easily fixed in further versions.) This information is first translated to a well-known text representation and then converted to a PostGIS geometry object for further use by the 3DCityDB;
Semantic representation: The DAL adds a new network feature (i.e., an instance of CityGML class Cable) to the 3DCityDB. This object is linked to the corresponding network;
Topological feature representation: A new feature graph is added to the 3DCityDB and linked to the corresponding network feature and network graph. The feature graph comprises only two exterior nodes (the two ends of the power line) connected via an interior feature link. (Even with a more complex topographical representation, the topological representation would still remain the same. This is one of the advantages of the integrated but separated representation possibilities of the Utility Network ADE.);
Topological feature connection: The two nodes of the power line’s feature graph are connected to the nodes of the feature graphs representing the electrical busses via inter-feature links;
Generic attributes: The technical parameters specific to the power lines (see above) are stored as generic attributes and linked to the network feature. (This is only necessary for the version of the Utility Network ADE used for the DAL prototype. Later versions–starting from version 0.9.3–include a package defining components specific to electricity networks.)
These steps represent the mapping of a specific power network component model to the generic Utility Network ADE modelling scheme. On the one hand, this mapping includes several domain-specific assumptions (e.g., using a network feature graph with exactly two external nodes). On the other hand, energy simulation experts are typically not familiar with this kind of workflow. Hence, automating and simplifying this procedure with the DAL provides a useful tool for enriching semantic 3D city models based on the modelling paradigms used by energy-related simulations, in compliance with
TR2. Basic examples for creating electrical network models, thermal network models and gas network models are available online [
47,
48,
49].
4.3. Automated Simulation Model Generation
The DAL supports not only the creation of new network models, but also their retrieval and translation to actual simulation models. As mentioned in
Section 3.3, this operation does not consist in just a simple conversion of data from one format to another. It is rather an interpretation of the semantic information and static attributes contained in the 3DCityDB in a domain-specific as well as tool-specific context, in order to generate dynamic physics-based models of the behavior of these systems. In order to comply with
TR3, the DAL provides proof-of-concept implementations of simulation model generators for different energy domains (electrical networks, thermal networks, gas networks).
The generators for the network models retrieve the network graph and all network features (and linked generic attributes) for a specified network from the 3DCityDB. Based on the DAL’s data access methods, the network features are retrieved as class objects and can be easily sorted according to their type (e.g., electrical busses, lines, loads, etc. for an electrical network). Furthermore, the information from the network graph includes the topological information of how these individual components are connected. This information can be used step-by-step to instantiate and link the component models corresponding to these network features, in order to generate the complete system simulation model.
This common workflow has to be adapted specifically for each energy domain. For instance, the simulation model generator for electrical networks starts with creating electrical bus models, then connects these bus models with line models, followed by adding models for electrical loads to the bus models, etc. On the other hand, the simulation model generator for thermal network models starts with adding models for thermal sources and sinks, then adds models for pipe junctions and finally connects everything with pipe models.
Finally, the domain-specific generator workflows have to be specialized for different simulation tools. Even though the workflows can be conceptually applied to most simulation tools of the same domain, generators have to be adapted to the specific interface implementations of the simulation tools. In the case of the DAL, this means that all simulation model generators are derived from base class
SimModelDBReaderBase. Class
ElectricalSimModelDBReader inherits from this class to implement the common workflow for generating eletrical network simulation models. On top of this, class
PandaPowerModelDBReader provides a relatively thin layer that connects to the specific API of pandapower. The conceptual design of these classes also allows interfacing with other popular simulators for electrical networks (even though this has not yet been demonstrated with another proof-of-concept implementation).
Figure 5 depicts the class diagram of the simulation model generators for the DAL, showing the domain specific methods for each domain and the corresponding prototype implementations.
4.4. Persistence Scheme for Simulation Setups
A co-simulation toolchain that enables detailed technical assessments of proposed changes and extensions to urban energy systems is an important asset. As explained in
Section 3.4, additional metainformation on top of the domain-specific data provided through the CityGML data model and its extensions is required to execute a simulation. This is especially true for co-simulation approaches, which require configurations for each individual tool (e.g., integrator steps sizes or initial conditions) as well as specific information regarding the coupling and orchestration of the tools.
Consequently, the logical next step is a persistence scheme for this type of information that integrates with the CityGML data model. To this end, the
Simulation Package data model has been developed [
50] in order to link CityGML-based semantic 3D city models and energy simulations.
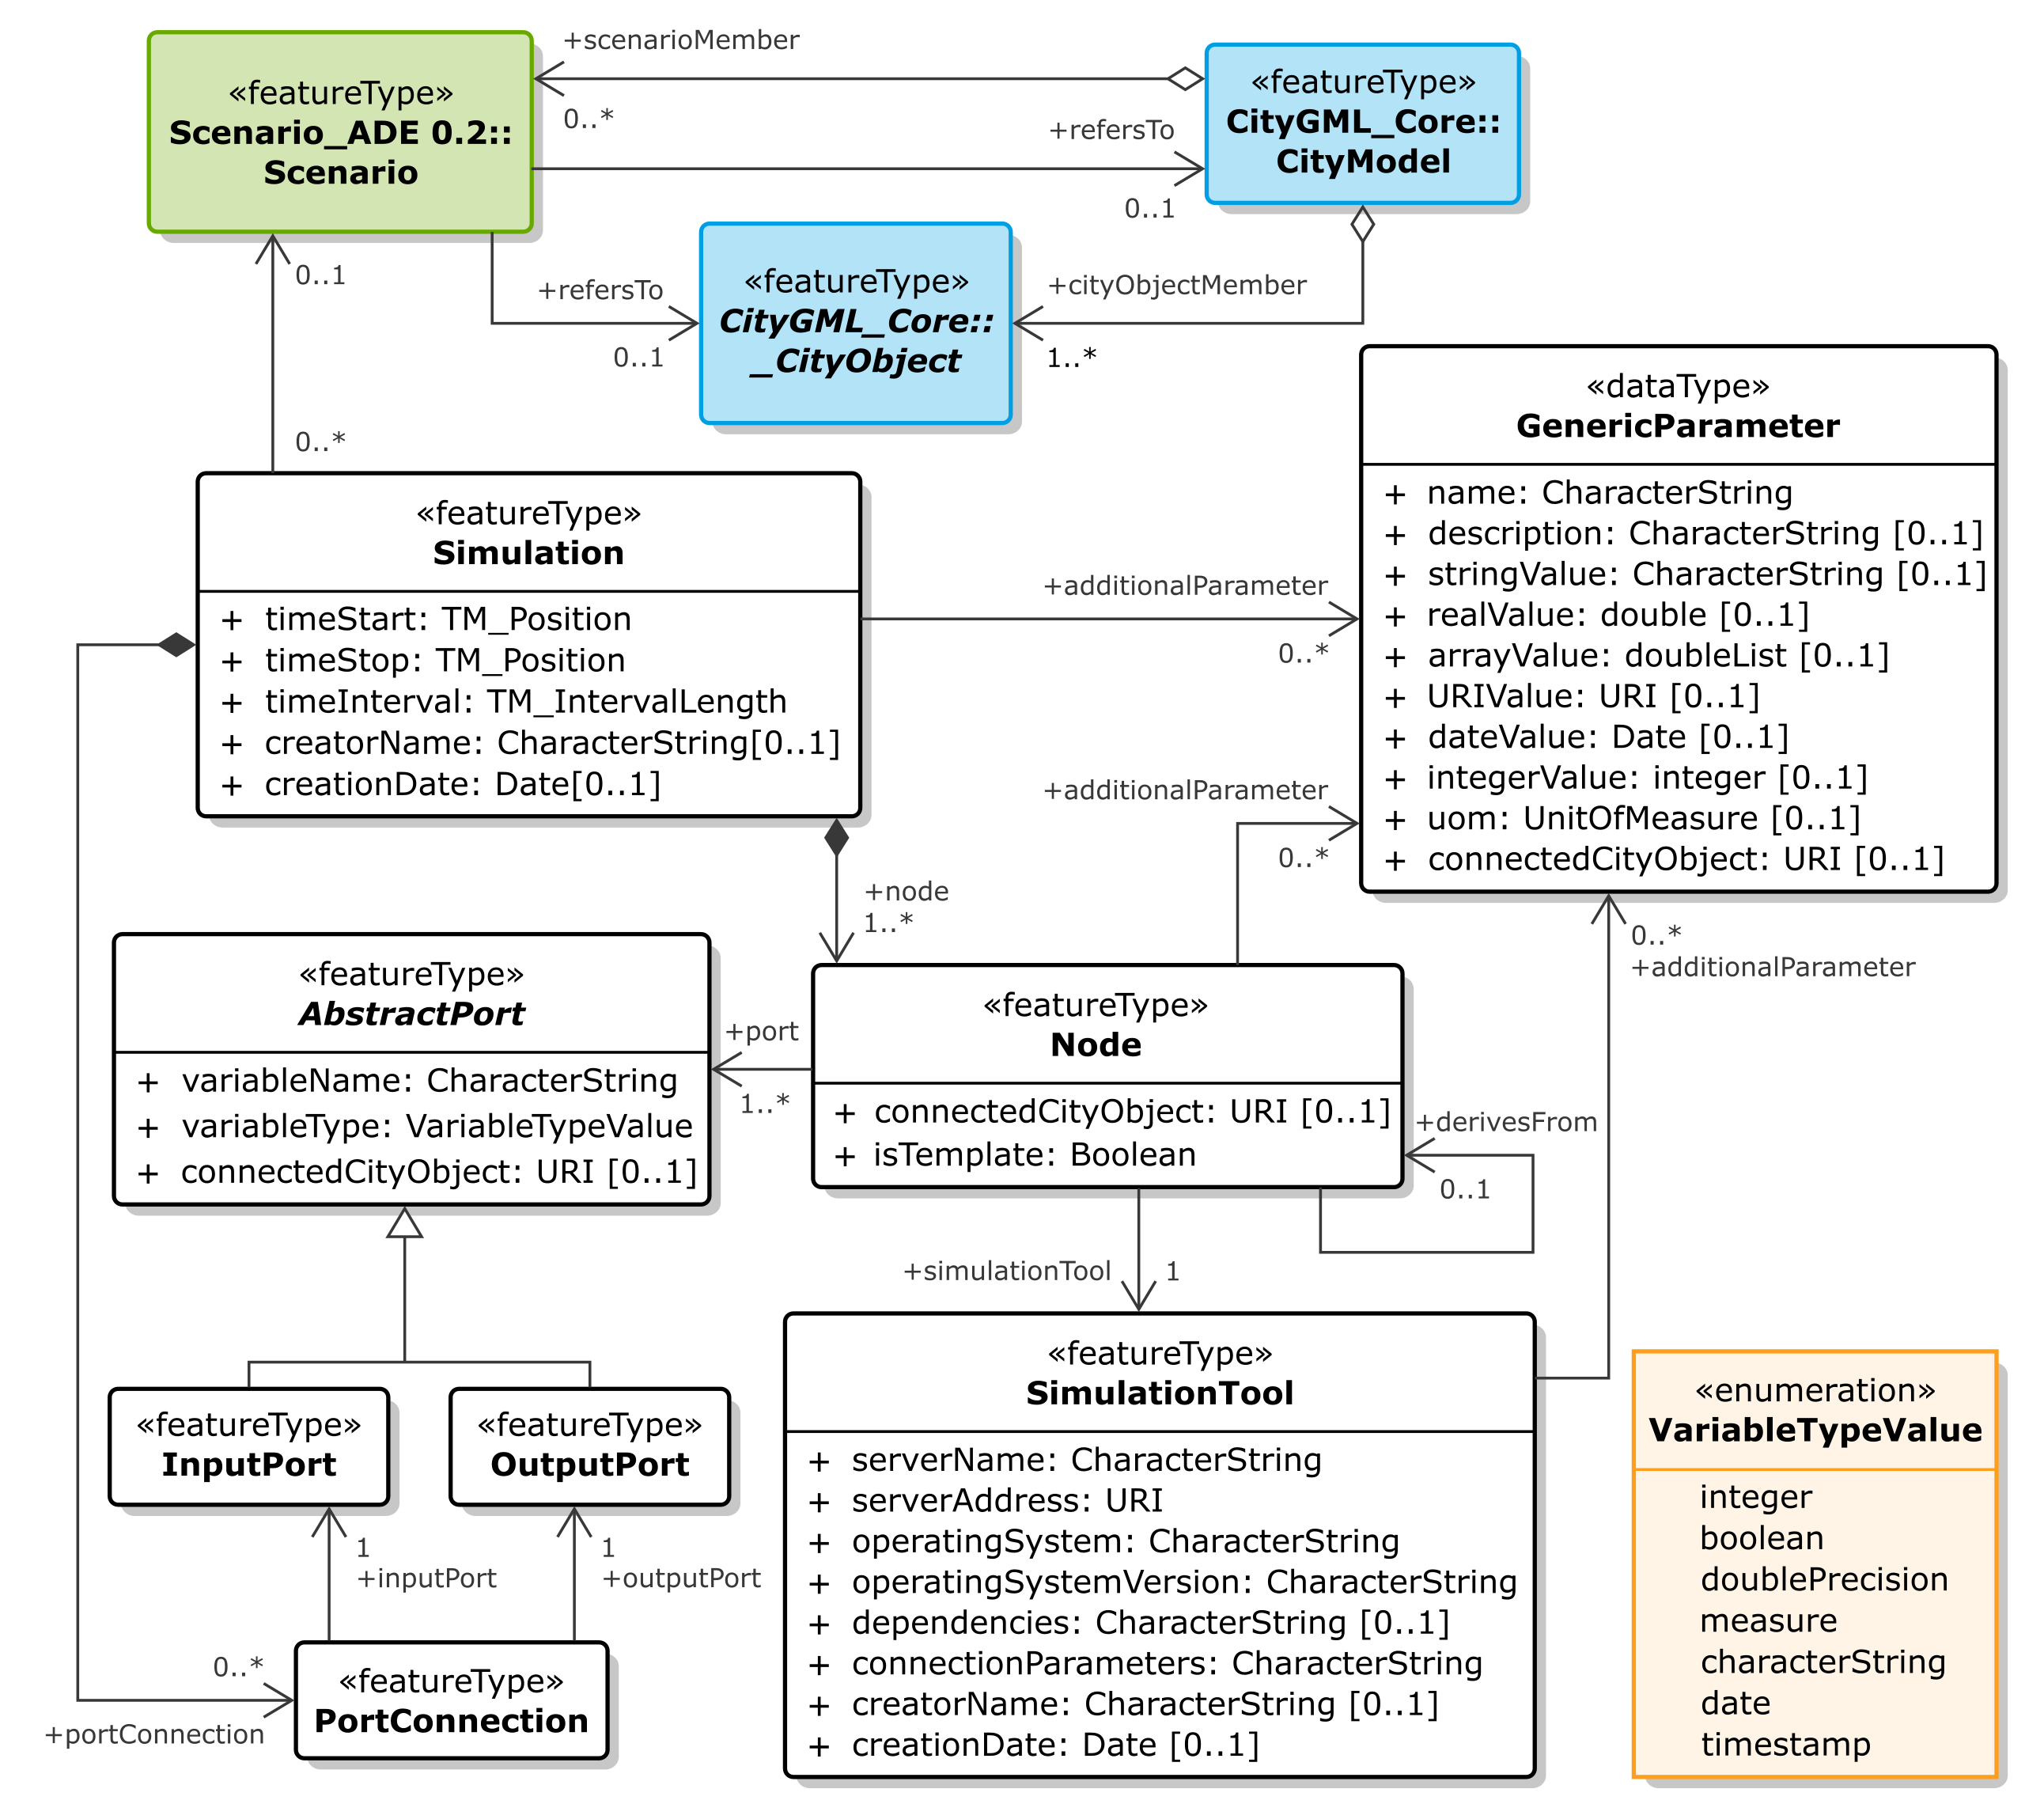
Figure 6 shows the UML class diagram of the Simulation Package, which defines the following classes:
Class
Simulation: Instances of this class are the top-level objects describing a co-simulation setup, linking all entities required to define the composition of the coupled tools. Instances can optionally reference class
Scenario from the CityGML Scenario ADE [
51], which allows a systematic representation of different scenarios within a city;
Class Node: Instances of this class represent the basic simulation units of a co-simulation setup and are basically an abstraction of simulation models and tools. Instances can be linked with CityGML objects, which allows linking them to domain-specific semantic data of a city model (useful, for instance, for automated model creation or validation);
Class AbstractPort: This is an abstract class that is further specialized into class InputPort and class OutputPort, which represent the input and output variables of a simulation node. Ports are intended to represent only a single scalar variable and must correspond to a variable in the associated simulation model. Instances can be linked with CityGML objects, which allows linking them to domain-specific semantic data of a city model (useful, for instance, for automated model creation or validation);
Class PortConnection: This class can be used to link ports of different nodes, which corresponds to the exchange of one scalar value between these two nodes;
Class SimulationTool: Instances of this class contain information specific to the simulation tool associated with a node.
The Simulation Package contributes to ease linking the semantic 3D city models and urban energy system simulations. As such, the design aims to be as generic as possible, in order to enable its application to a large variety of (co-)simulation tools.
The DAL relies on the generic Simulation Package to implement a persistence scheme for ZerOBNL [
52], the co-simulation framework developed for IntegrCiTy’s technical framework (cf.
Figure 3). Like the DAL, ZerOBNL is implemented in Python, enabling the representation of co-simulation setups as Python data structures. These ZerOBNL data structures can be easily written to or read from the 3DCityDB Plus with the help of the DAL, in compliance with
TR4.
5. Demo Application
To showcase the usefulness of the DAL for an urban energy planning applications, a demo case has been implemented. This demo case provides a proof-of-concept implementation for:
Consolidating buildings and network data and storing them in the 3DCityDB Plus;
Creating simulation models from these data;
Simulating and analyzing the system, then storing the results to the database;
Retrieving these data for visualizing the results.
The demo comprises a series of Jupyter notebooks. All instructions and resources required to run the demo are publicly available [
53].
Even though this demo application relies on 2D data only, this does not rule out that 3D data might be the preferred format for other applications or case studies (e.g., for the simulation of thermal zones or shading effects in buildings). In terms of the CityGML standard, 2D and multiple 3D representations of the same object can co-exist; therefore, it is up to the user to pick what is needed for the specific application. However, even though this would require only moderate changes to the software, the current version of the DAL does not yet support 3D geometries.
5.1. Import Buildings Data to the 3DCityDB
The demo starts by using the DAL for importing data to the 3DCityDB. In this specific example, geometric data (2D footprints) and energy data (gas consumption) of buildings is extracted from separate sources, consolidated, semantically linked and finally stored in the database.
In real life, collecting data is often a long and laborious task. Moreover, once all the required data have been collected, they are typically fragmented over various sources and delivered in various data formats. In this demo, the source data are spread over several files:
Shapefile data: A common format for GIS-related data is the shapefile format. In this example, the shapefile contains the 2D footprints of buildings and information on which type of energy carrier they use for heating;
CSV data: Files containing comma-separated values (CSVs) are probably the most common format for data exchange. In this example, the CSV data file contains gas consumption profiles of buildings.
In this example, both data sets use the same ID to refer to the same building (e.g.,
building175), which makes it possible to easily link the data from both sets. In real-life applications it might take another pre-processing step to link the available data.
Figure 7 visualizes the buildings data from the shapefile.
A big advantage of implementing the DAL in Python is the availability of a large variety of software packages for data manipulation. Due to Python’s increased usage in data-centric applications (e.g., big data, data science), these packages have become very mature, powerful and easy to use. For this demo case, the
Python Shapefile Library (PyShp) [
54] and the
pandas library [
55] are used to read and manipulate the shapefile and CSV data, respectively.
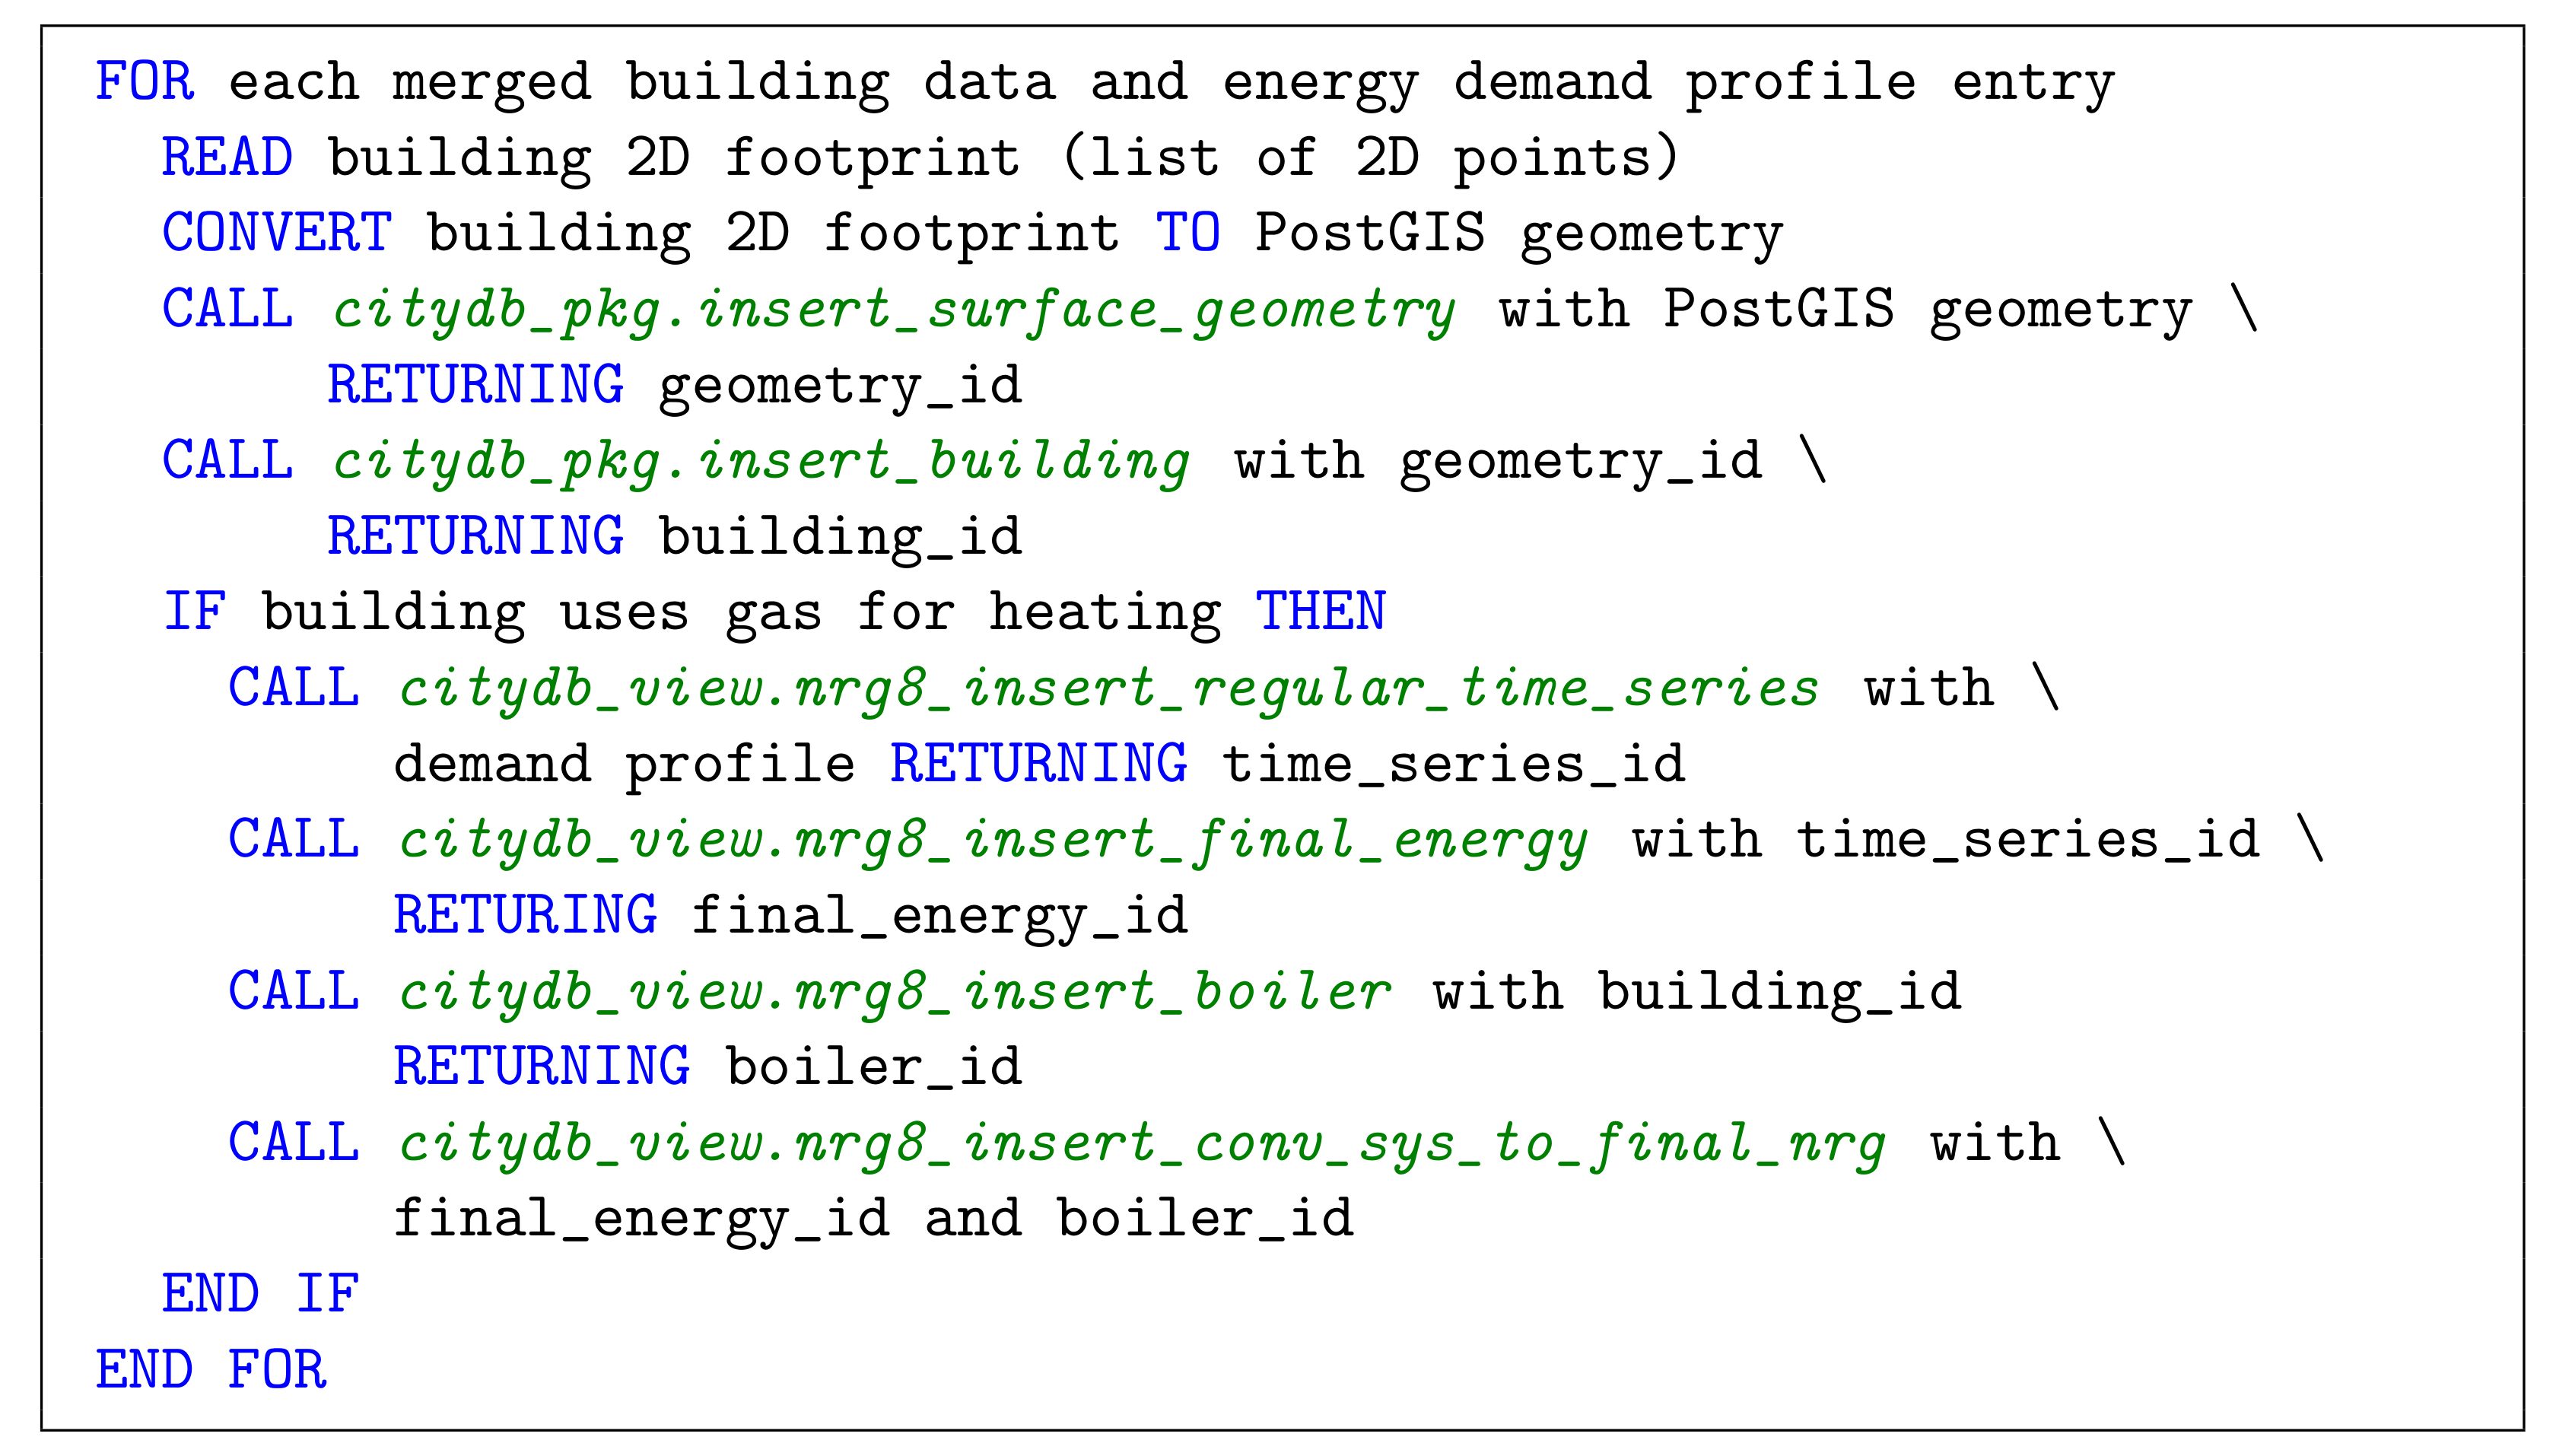
This makes it easy to programmatically merge the data from both sources and add them to the 3DCityDB, see the pseudocode in
Figure 8. For adding the appropriate CityGML and ADE objects to the 3DCityDB, the DAL provides easy access to the SQL functions defined in the respective schemas (cf.
Section 4.1). In this demo case, the data from the shapefile and CSV data are translated to semantic objects of type
MultiSurface,
Building,
RegularTimeSeries,
FinalEnergy, etc., giving a structured meaning and inter-association to the raw data.
5.2. Import Network Data to the 3DCityDB
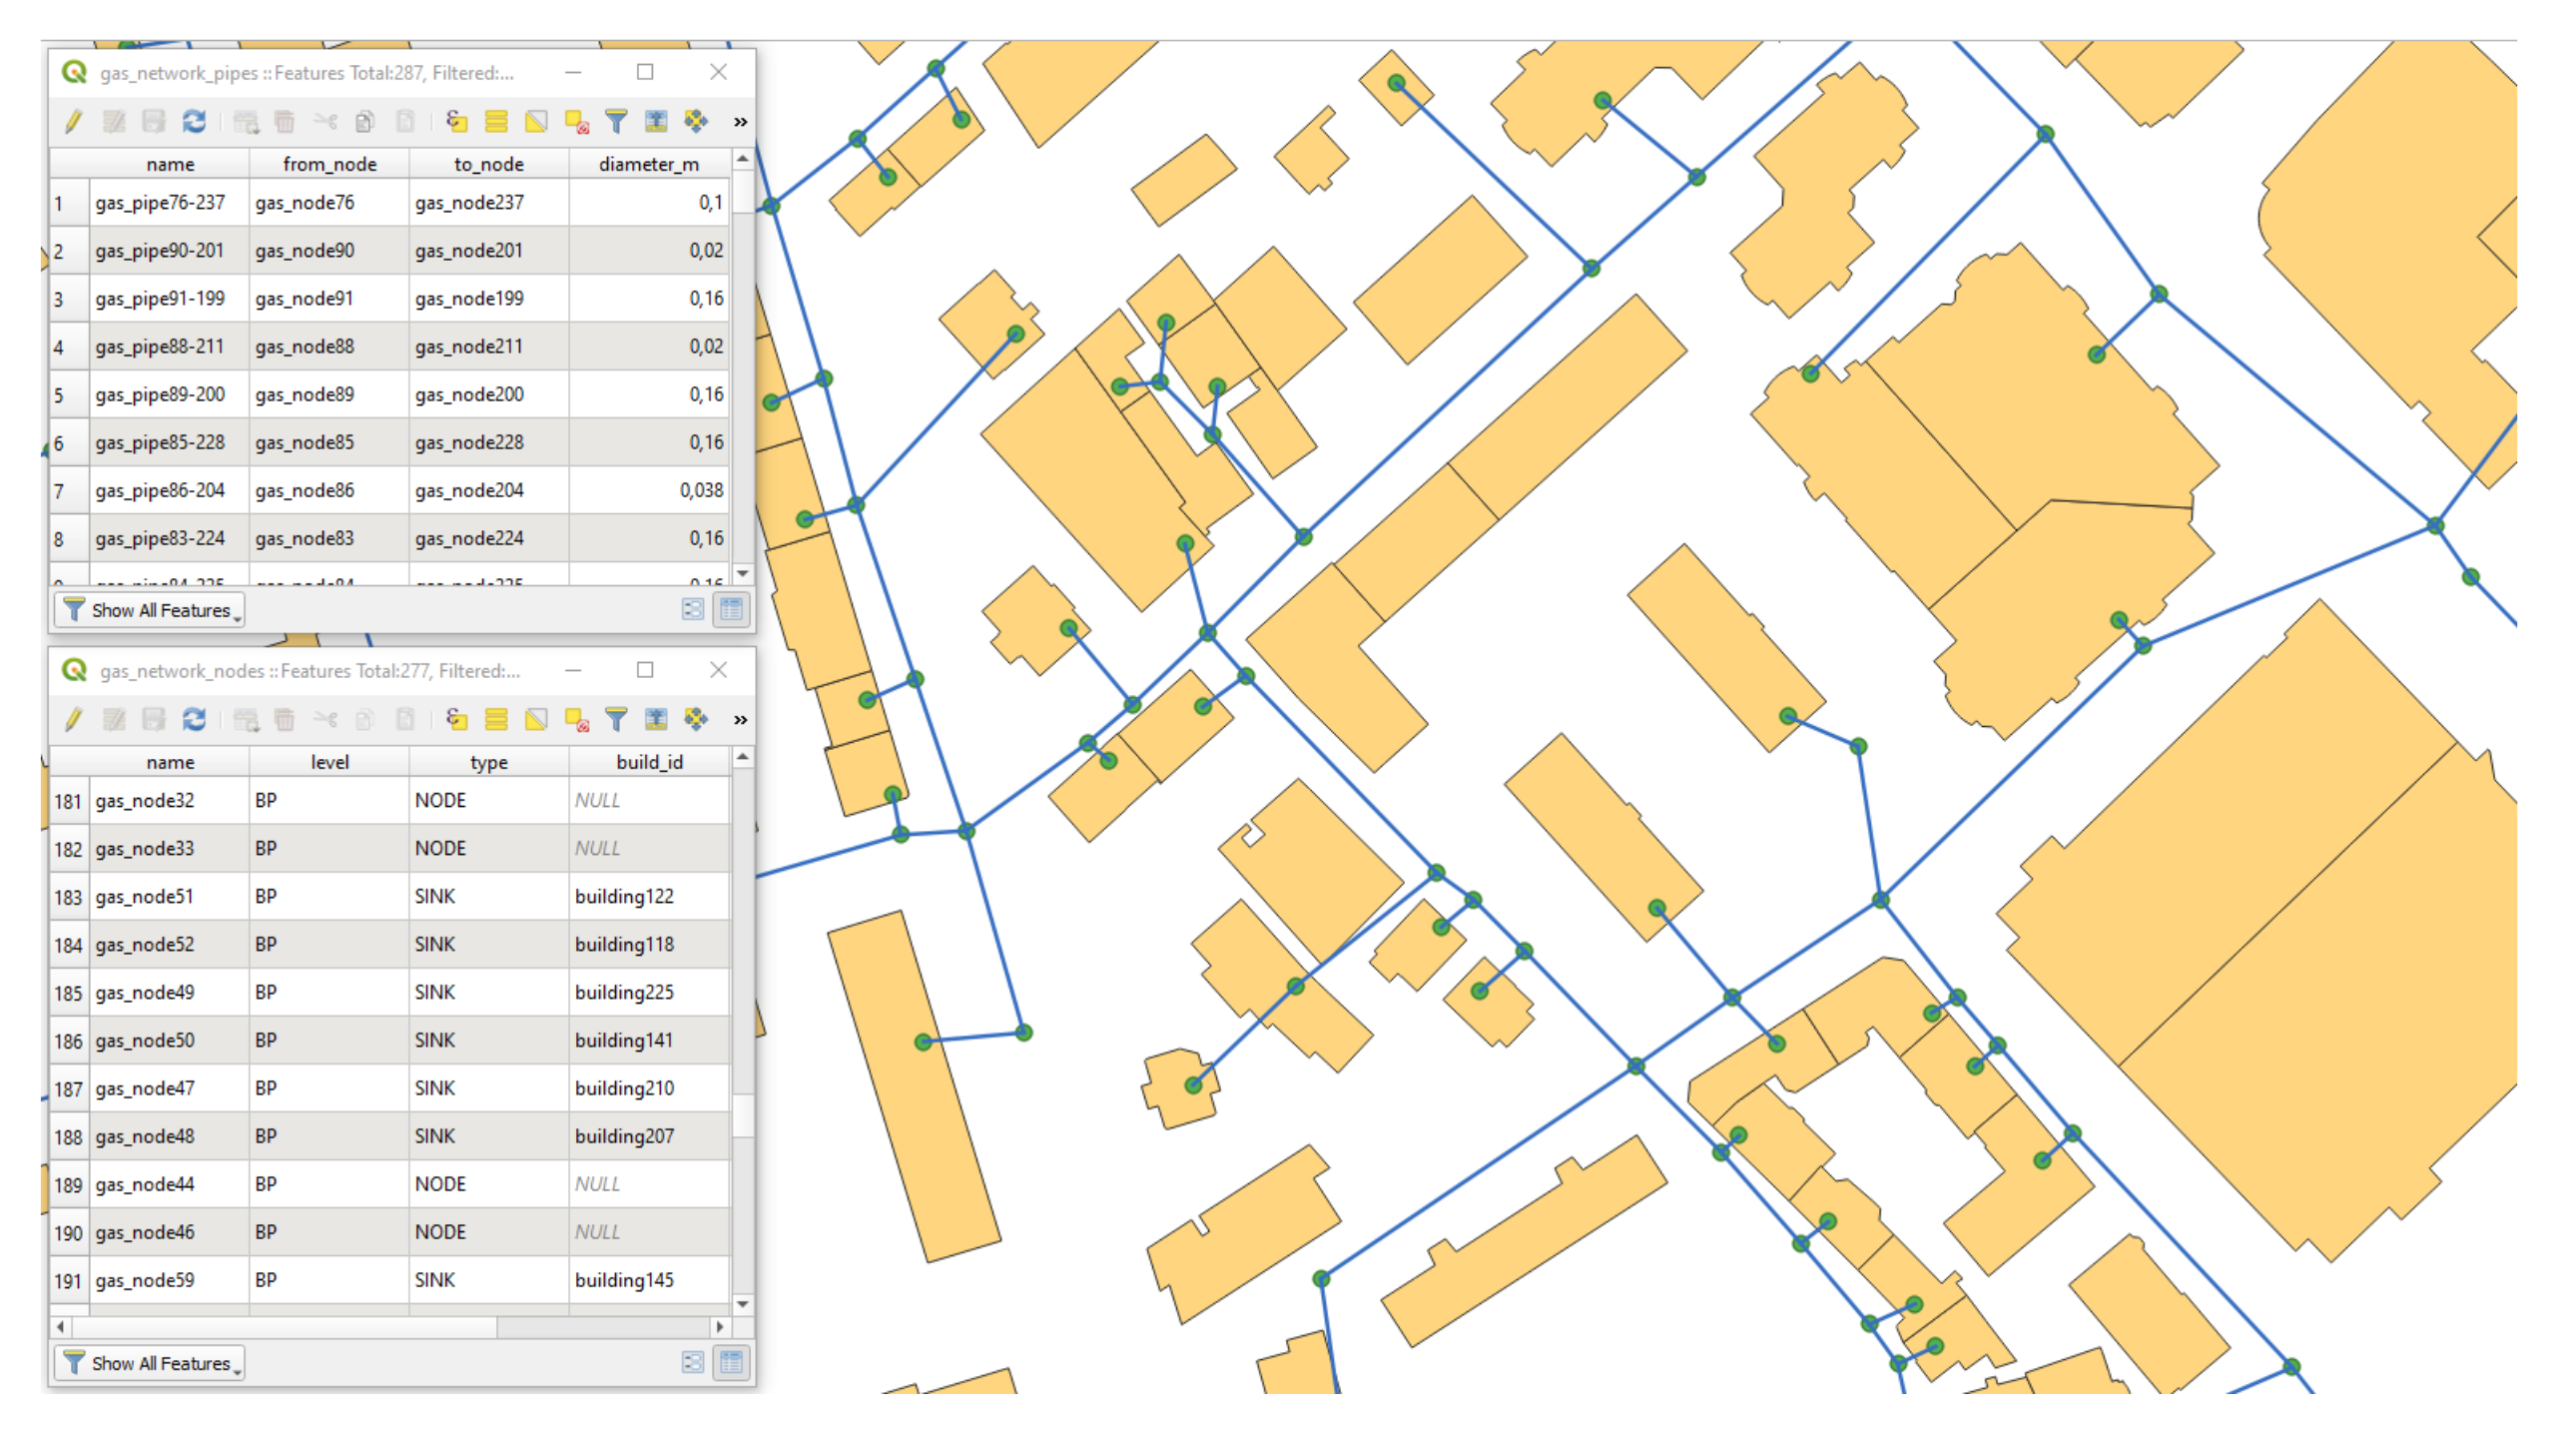
In a next step, the demo extracts topographical data from separate sources (shapefiles in this example), links it into a topographical representation of a gas network (2D line diagram) and stores it in the 3DCityDB. One input data set comprises information about the gas network pipes, containing the positions of all pipes as 2D lines, where each pipe is defined by two points (start and end point of a straight pipe). The other data set comprises the gas network nodes, which are points in space where either a pipe is connected to a network boundary (substation, building) or where two or more pipes are joined.
In this example, both data sets use a consistent set of IDs to refer to pipes and nodes, which makes it possible to easily link the data from both sets. For instance, there is a pipe called
gas_pipe83-224, whose starting and ending points coincide with
gas_node83 and
gas_node224, respectively. By checking the additional data associated to these nodes in the shapefiles, it is possible to determine that this pipe is connected to a building on one side (
gas_node83 is connected to
building126) and that two other pipes are joined to it (
gas_pipe223-224 and
gas_pipe224-225 via
gas_node224). In real-life applications it might take another pre-processing step to link the available data.
Figure 9 visualizes part of the network data and the associated attributes from both data sets.
With Python it is a relatively easy exercise to extract these data, categorize them in terms of network nodes, pipes, sources and sinks and find the links between them. In fact, this is a typical workflow well understood also by energy simulation experts, as explained in
Section 3.2. Therefore, it is also an easy task to use these data for constructing and storing a semantic network representation with the help of the DAL, adding first the network nodes, connecting them with pipes and finally adding sources and sinks (cf.
Section 4.2).
5.3. Gas Grid Co-simulation Setup
The demo continues with the creation of a simulation model of the gas grid. In fact, a co-simulation approach is applied, which combines the simulation model of the physical behavior of the network components with a simulation model of the gas consumption of the connected buildings. To keep the example simple, the gas consumption model merely outputs the time series data for each building. In a real-world example, this simplistic co-simulation setup could be expanded by using dynamic building models or including an energy management system.
A detailed explanation of the simulation models and the co-simulation configuration [
52] is out of the scope of this article. However, the implemented workflow can be considered as a typical workflow for the co-simulation of energy systems. More importantly, the demo case demonstrates that the DAL can be seamlessly integrated into such a workflow, offering several advantages:
Semantic data integration: Due to the easy access provided through the DAL, the 3DCityDB Plus can effectively serve as an integrated data hub, in accordance with
TR1. Instead of relying on cluttered data from scattered files, each with its own internal ad hoc data structure, the database can be used as a source of well structured and semantically linked data. For instance, the demo case uses the DAL for linking the energy demand in buildings to the sinks of the gas network. As described in
Section 4.1, the DAL facilitates this task by mapping all related CityGML classes to Python objects, which eases the handling of the semantic structure and the associated data;
Multi-domain application-independent data format: Energy simulation tools typically focus on specific engineering domains (e.g., buildings or networks), making their data formats for storing simulation models unsuitable for describing urban energy systems in their entirety. Combining the functionality of the DAL with the semantic models of CityGML and its ADEs (and its implementation in the 3DCityDB) effectively enables multi-domain modelling for simulations of urban energy applications, in accordance with TR2 and TR3. For instance, the demo case uses the DAL from within the gas network simulator to generate the network model directly from the 3DCityDB Plus information at run-time;
Documentation and reproducibility: Storing data in the database not only improves transparency and the availability of data for a workflow, it can also increase the reproducibility of simulation-based assessments. Storing the co-simulation configuration alongside the data used to generate and parameterize simulation models decreases the effort for others to execute the same workflow with identical results. For instance, the demo case uses the DAL not only to store the co-simulation configuration, but also allows to associate configuration parameters to attributes of CityGML objects.
5.4. Gas Grid Operation Assessment
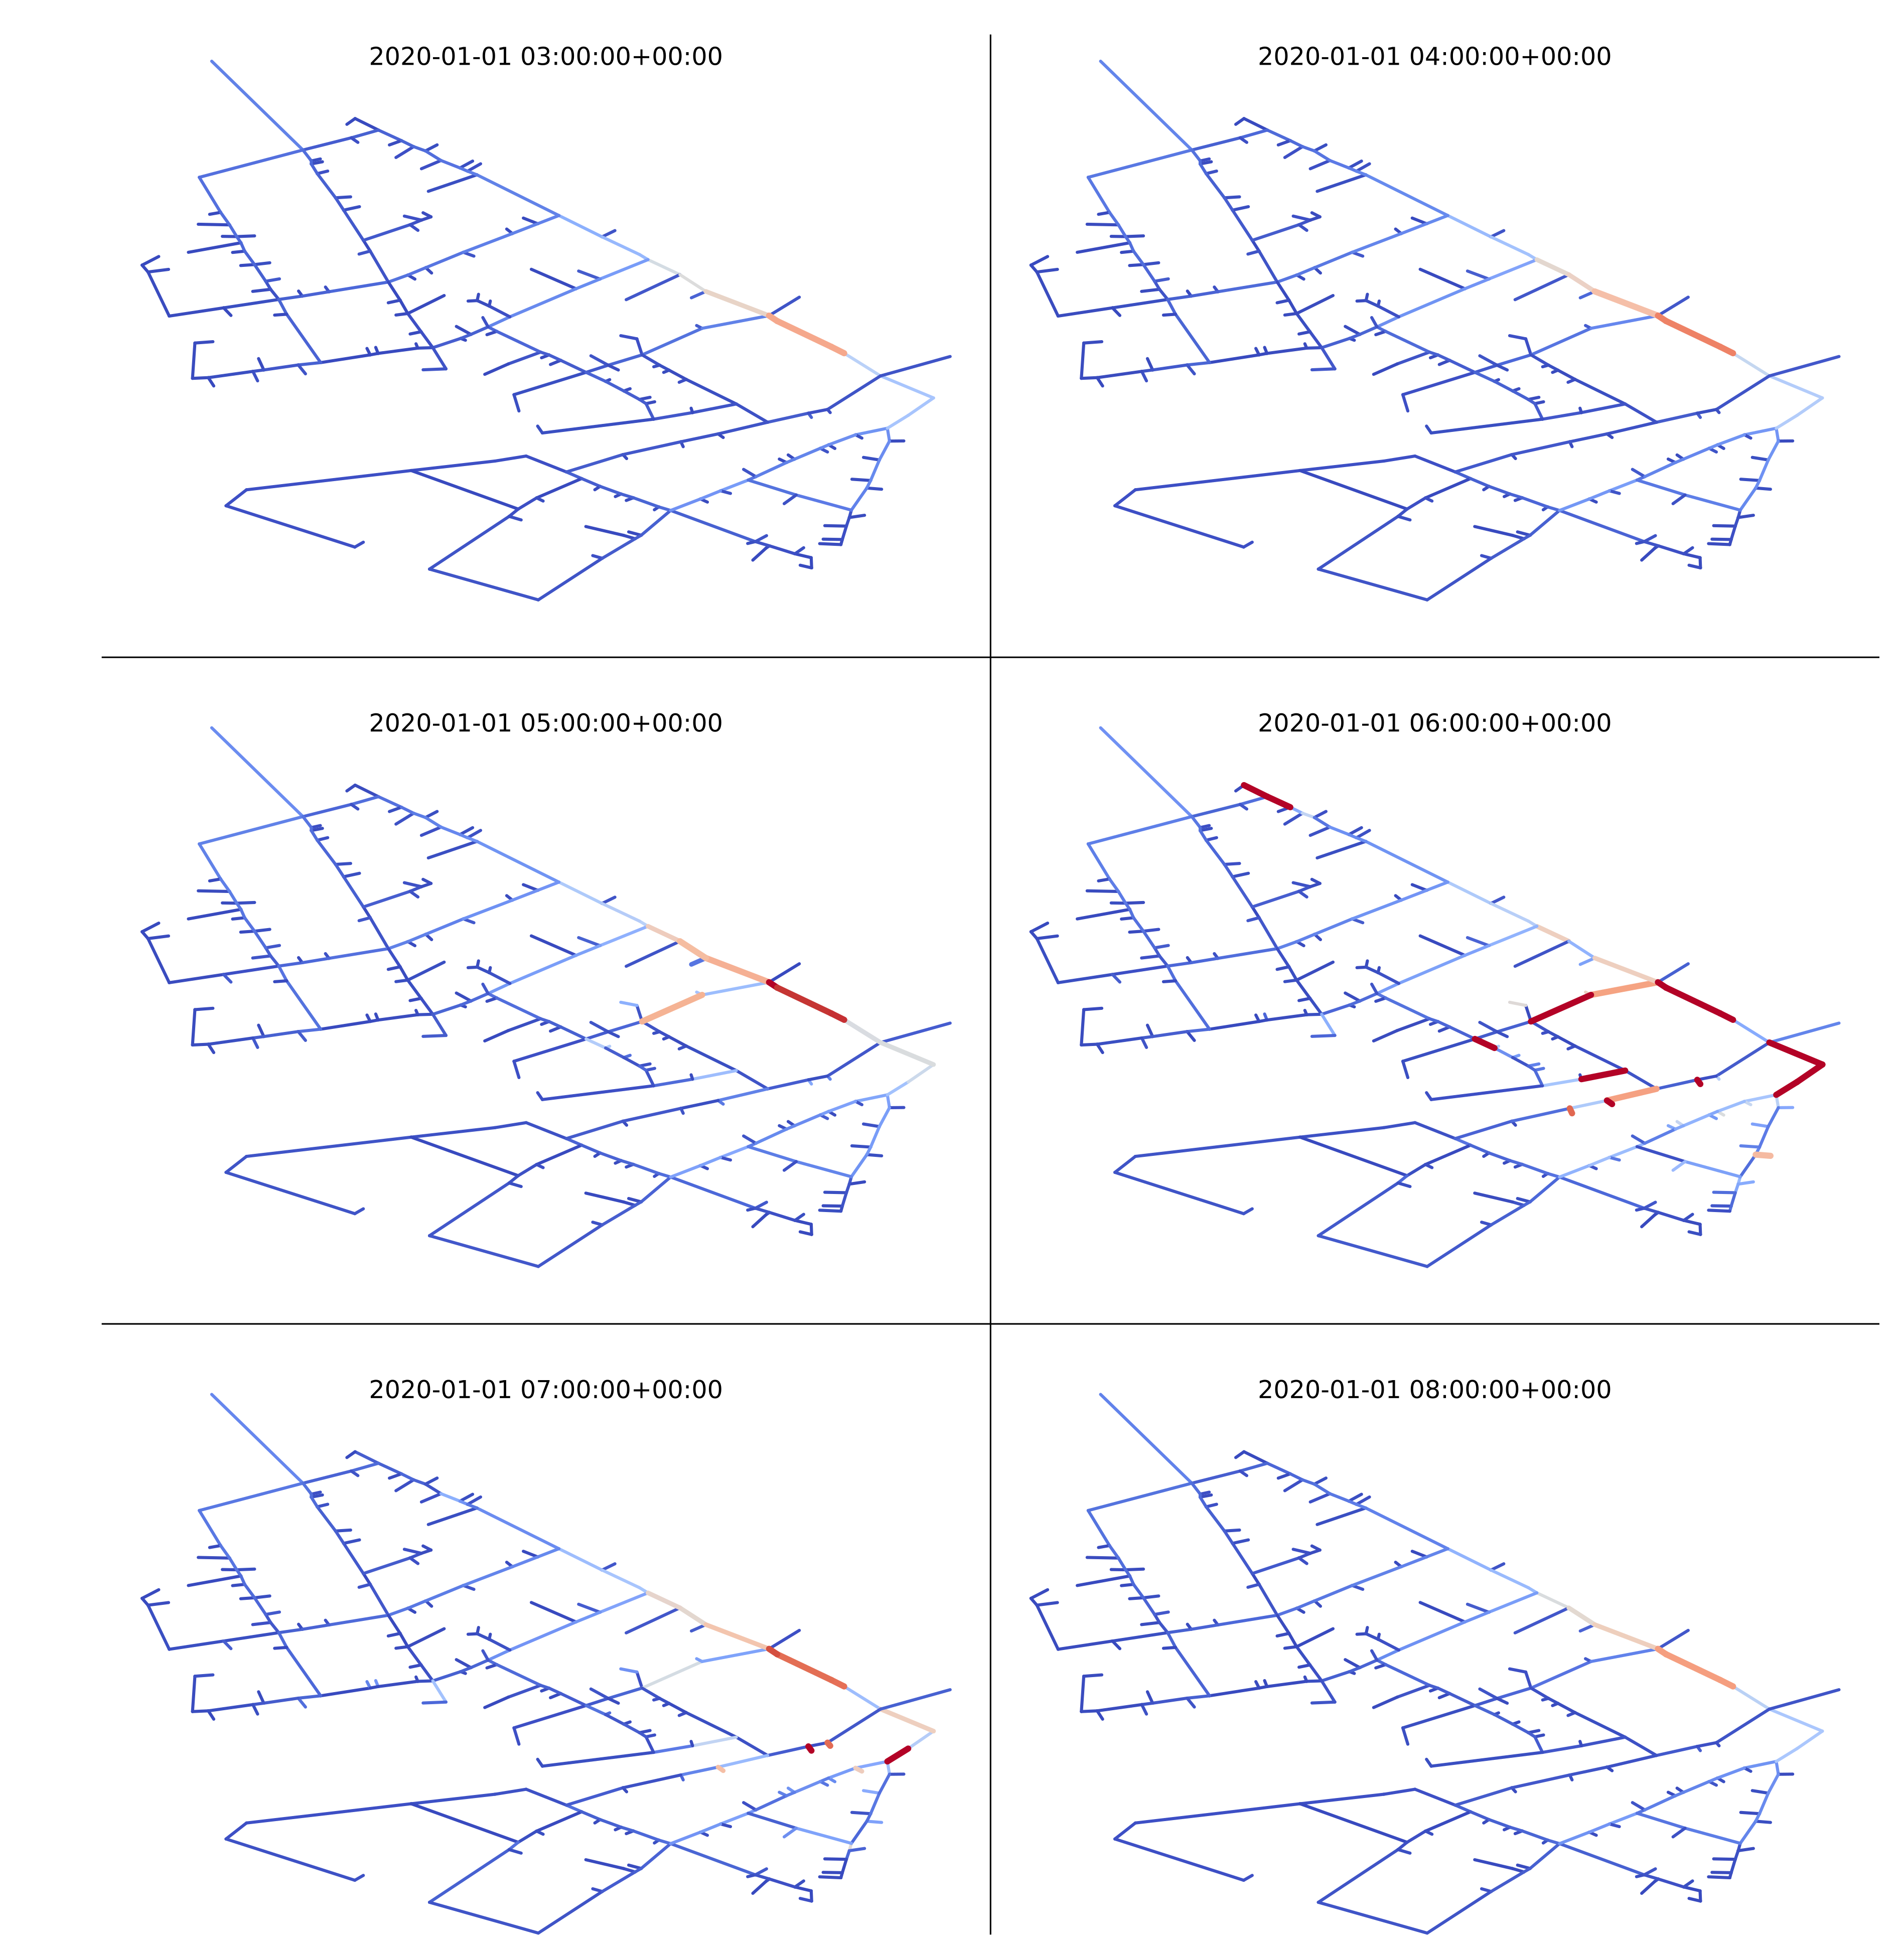
The DAL implements all required functionality to directly translate the co-simulation configuration stored in the 3DCityDB Plus into a setup that can be executed with the help of IntegrCiTy’s co-simulation toolchain. This allows running a mostly automated simulation-based assessment of the gas grid operation. In this specific demo case, the assessment looks at the evolution of the gas network’s operational state over time, based on the demand profiles from all connected buildings. Among other significant network properties, this involves the computation of the mass flow in the pipes as a function of time.
The DAL relies on Scenario ADE to associate the simulation results (time series of mass flow rates) with the corresponding objects (pipes) and store them in the 3DCityDB Plus. In other words, the DAL treats the results of a simulation run as a specific scenario, which allows linking the same CityGML and ADE objects in the database with (a potentially large set of) results. In this specific demo case, using the 3DCityDB Plus as an integrated demo hub enables linking the simulation results for each individual pipe to the topographical information of the pipes, even though the simulation model itself uses only a topological representation of the gas network. By providing these data in the 3DCityDB, these results are not only available to energy simulation experts, but also to experts for urban data modelling. This allowsed us to explore and visualize results with tools commonly used in the geospatial domain.
Figure 10 shows the final output of the simple demo case, which visualizes the simulation results for the gas network at different times of the day. The figure displays the pipes with a color coding corresponding to the absolute value of the mass flow rate (red indicating high mass flow rates).
6. Discussion
The presented work aims at bridging the gap between semantic 3D city modelling and domain-specific simulations of urban energy systems. Historically, these two fields have been developed mostly independently, focusing on different aspects of urban environments. While 3D city modelling focuses on the spatial representation and semantic categorization of entities in the urban space, domain-specific energy simulations are studying the behavior of the related physical and technical processes. This has led to a misalignment between the existing methods and tools used by the corresponding communities (see
Section 2.2). However, there are strong links between both fields that could be used in a synergetic way to improve workflows for the assessment of urban energy systems.
The usefulness of geospatial data as input for simulation tools has already been proven successfully in the past [
56,
57]. In recent years, the advantages of a semantic representation of urban space over purely geospatial data formats has been recognized, which has led to the development of several simulation tools that rely on CityGML. Examples include detailed simulations of buildings on district- and city-scale [
58,
59], assessments of bioenergy potentials [
60] or analyses of urban water demand [
61]. This work follows in these footsteps and uses CityGML to represent the urban environment. Furthermore, it also adopts several of CityGML’s application domain extensions, in order to enable the proper representation of urban energy systems, including energy grids.
However, in contrast to other approaches based on CityGML (including those cited above), this work does not assume that the required data are readily available. Even though this is often the case for existing buildings and infrastructure, energy planning and energy sustainability analyses typically involve the assessments of future scenarios, comprising for instance new or upgraded generators, storage, conversion devices and energy grids. Unfortunately, energy simulation experts are in general not familiar with the concepts and tools used by the geospatial community, which poses an obstacle to the adoption of workflows based on CityGML in the energy community. Hence, this work also aims to provide energy simulation experts with adequate methods and tools to generate and subsequently use new CityGML models for their own purpose, see
Section 3. Furthermore, this work does not aim to support one specific tool, only, but tries to offer support for different types of energy-related simulation tools, with the option to use them as part of a co-simulation. The software prototype presented in
Section 4 implements the approach proposed in this work as a proof-of-concept for various types of energy grid simulators. As such, the demo application in
Section 5 must not be seen as a showcase of the DAL’s complete functionality, but rather as a simple example of the types of workflows it is able to support.
In view of future challenges for urban energy planning, this software prototype is first and foremost intended as an inspiration for experts from the urban data modelling community and the energy simulation community to join forces. Improving this collaboration has a high potential for also improving the support for decision makers of utilities and local authorities, who require fact-based evidence to back up ambitious energy and sustainability objectives. Hence, even though this work itself focuses on technical aspects of urban data modelling and energy-related simulations, it can be considered as an “enabling technology” in the more general context for reaching increased sustainability in cities and territories.
7. Future Work
The presented DAL is still in a prototype stage, first and foremost meant as inspiration for future work. However, it also has the potential to serve as a basis for future developments. The following paragraphs include a (non-exhaustive) list of required improvements that would be critical to make the DAL a mature and usable tool for urban energy simulation applications.
The most important feature will be a more extensive support for different energy simulation tools. For instance, the automated mapping of Utility Network ADE models to simulation models is currently only supported for three different tools, serving only as a proof of concept. However, the DAL has been conceptualized in a way that will allow for an extension of this support to a larger number of other simulators for electrical, heat and gas networks. Furthermore, the DAL could also be extended to support the automated generation of simulation models for other energy domains, especially for building energy simulations.
The DAL’s interface to the 3DCityDB does not yet cover the full set of insert and delete methods. This is mostly due to the vast number of methods provided by the 3DCityDB and its extensions, of which only a subset was relevant for the demo case. Furthermore, several improvements to the object-relational mapping of CityGML and ADE classes could be applied. For instance, mapping of a class does not yet automatically include mapping of parent classes (and shared attributes).
When it comes to the underlying database, namely the 3DCityDB Plus, several improvements are required in hindsight of the recent development and improvements related to the CityGML implementations used in this work. The work presented in this paper is based on CityGML 2.0, the Energy ADE 0.8, the Utility Network ADE 0.9.2 and Scenario ADE 0.2, implemented on top of the 3D City Database 3.3.1.
During the development of the project, Energy ADE has reached version 1.0. The Utility Network ADE has seen a slower development (reaching so far version 0.9.4). In both ADEs, some functionality has been added and some classes have been reorganized to allow for better modularity and harmonization between these two ADEs, given their intrinsic complementarity.
The 3D City Database is at version 4 (4.3 at the time of writing, summer 2021). Among the major improvements is an initial native support of ADEs. One major improvement is the possibility to automatically create the database schema of an ADE once the XSD schema is provided [
27]. However, to have full ADE support from within the Importer/Exporter and to read and write CityGML files with ADE content, additional Java classes need to be written [
62]. Currently, in addition to a TestADE (for testing purposes), complete ADE support is available only for the i-Urban Revitalization ADE [
63] and a subset of the Energy ADE 1.0 (called KIT-Profile) [
64].
Last but not least, CityGML itself has been in active development since 2013 for the upcoming new version 3.0 [
6], which is expected to be released during 2021. CityGML 3.0 introduces new concepts that may reduce the dependency on external ADEs. For example, the current usage of class
UsageZone from the Energy ADE, given the new concept of
spaces in CityGML 3.0. Another major addition of CityGML 3.0 consists in the support for time-dependent variations (e.g., time-series), thanks to the Dynamizer module. This calls for a major revision (and simplification) of Energy ADE, too. Similar considerations apply to Scenario ADE.


