Article

Total Replacement of Fishmeal by Spirulina (Arthrospira platensis) and Its Effect on Growth Performance and Product Quality of African Catfish (Clarias gariepinus)

1
Department of Animal Science, Georg August University of Goettingen, 37077 Göttingen, Germany
2
Center for Integrated Breeding Research, Georg August University of Goettingen, 37075 Göttingen, Germany
*
Author to whom correspondence should be addressed.
Sustainability 2021, 13(16), 8726; https://doi.org/10.3390/su13168726
Submission received: 17 May 2021 / Revised: 23 July 2021 / Accepted: 30 July 2021 / Published: 5 August 2021

Abstract

:
Microalgae are increasingly being studied to replace fishmeal in aquafeed production. Low level Spirulina supplementation to various fish species has been widely investigated, demonstrating enhanced growth and better product quality. In order to evaluate the effects of a full fishmeal replacement with Spirulina (Arthrospira platensis) on growth and product quality in African catfish (Clarias gariepinus), two isoenergetic diets were formulated and fed for ten weeks to 120 fish with an average initial weight of 50 ± 3 g. Full supplementation of Spirulina resulted in reduced growth (p < 0.001) whereas feed conversion ratio was on par (p > 0.05). Furthermore, Spirulina-fed fish showed a more intense yellow coloration in skin, and raw and cooked fillet (p < 0.001). The analysis of fatty acids revealed higher proportions of C16:0 (p < 0.001) and C18:2n6 (p < 0.05) in fish fed the Spirulina-diet while C24:0 (p < 0.01) and C20:5n3 (p < 0.001) were found to be higher in the control group. Even though no statistically significant differences in the overall SFA, MUFA and PUFA were detected, a slight increase of the n6/n3 ratio was observed in the Spirulina-fed fish. Without further optimization of the feed ration, a complete fishmeal replacement with Spirulina can lead to economic losses. It remains to be studied whether the observed changes in product quality affect consumer acceptance.

1. Introduction

Nowadays, the worldwide fish populations are endangered by various anthropogenic factors. Climate change threatens the overall biodiversity [1,2,3,4] and can have an effect on the worldwide fish populations [5,6,7]. Further, water pollution can be identified as another crucial factor, which has been largely investigated [8,9,10,11]. In addition, the intensive use of fishmeal represents a threat to the safeguarding of marine ecosystems [12]. Seawater consumption, the high amount of energy required, and the emission of effluents with a high organic content are some of the reasons why the processing of raw fish into produce fishmeal is raising environmental concerns. In addition, fisheries lead to far-reaching changes in the ecosystem and endanger the world’s fish populations [13]. These observations underlie the urgent need to identify feasible alternatives to common fishmeal for the aquaculture sector.
Micro- and macroalgae constitute the first trophic level in the food chain, representing an interesting source of proteins for aquafeed production. They are also considered to be more sustainable in terms of resource use than other aquafeed ingredients [14]. The protein content of algae is between 6 and 71% of dry matter, highly depending on the species [15]. Spirulina (SP) seems to be suitable for aquafeed production, containing a high proportion of proteins, usually between 59 and 65% of dry matter [16]. In fact, various studies showed that low levels of SP addition can be beneficial to the growth performance of different fish species [17,18,19,20,21,22,23,24].
Besides the protein, SP is also a source of natural carotenoids, containing β-carotene and xanthophylls (zeaxanthin, echinenone and cryptoxanthin) [25,26]. These carotenoids are integrated into the fish muscle without further modification [27], producing a more intense red and yellow coloration of the fillet, along with blood carotenoids [28]. In previous studies, the luminosity (L*), redness (a*) and yellowness (b*) was found to be higher in SP-fed trout fillets [18,29]. Although the presence of carotenoids in the fillet could represent a sort of value adding in terms of their nutraceutical properties [30], the trade-off might be a decreased consumer acceptance due to an unfamiliar coloring effect [31].
The fatty acid profile plays a major role in product quality of animal products, and polyunsaturated fatty acids (PUFA) are especially crucial for human health [32]. Since algae are considered to have a positive effect on the lipid metabolism in fish [33], several studies were already conducted in this direction and reported an enhanced level of PUFA in the fish muscle [29,34,35].
In our study, we aimed at evaluating the effects of a full supplementation of SP on the growth and product quality of fish. African catfish (Clarias gariepinus) was selected for the experiment, being an omnivorous fish species and given its increasing importance in global aquaculture production [36]. A ten-week feeding trial was undertaken with two isoenergetic diets containing either fishmeal or SP (Arthrospira platensis) meal as a protein source. In order to estimate the general effects of a fishmeal-free fully SP-substituted diet on weight, feed conversion ratios (FCR), color of skin and fillet, cooking loss and fatty acids were determined.

2. Materials and Methods

2.1. Ethical Clearance

All animal work followed relevant national guidelines. Good veterinary practice was applied in all procedures whenever animals were handled. The study was in accordance with the German legal and ethical requirements of appropriate animal procedures. The procedures in this study were approved by the Institutional Animal Welfare Body (no. T2-2019, 27 June 2019).

2.2. Rearing of Experimental Fish

Reproduction, rearing and the feeding trial of fish took place in a warm water recirculation aquaculture system (RAS) of the Georg August University of Göttingen. Catfish larvae (full siblings) were reared with trout starter feed (Inicio Plus, Biomar, Aarhus Denmark) until they reached the required weight. Then a total number of 120 African catfish (Clarias gariepinus) with an average body weight of 50 ± 3 g were fed for ten weeks on two isoenergetic experimental diets (Table 1 and Table 2), developed and analyzed by Dietz et al. [37]. Nutritional value was in accordance with the recommendations of the National Research Council (NRC) for catfish [38]. The control group (FM100) was fed with a pelleted feed consisting of 20% fishmeal, whereas in the experimental group (SP100), the fishmeal was completely replaced by SP meal. Each treatment was run in randomized triplicates and consisted of 20 fish per aquarium. All experimental fish were kept in 200 L aquariums connected to a RAS and exposed to a light regime of 10 h dim light and 14 h darkness. Fish were hand fed twice a day according to body weight and water temperature, thus daily rations amounted to 2% of the fish biomass. One fish died over the course of the trial and was replaced with a full sibling comparable in body weight (±5 g) of the dead fish’s weight in order to keep a constant stocking density. The body weight of fish was regularly measured (after two, six and ten weeks) in order to adjust rations applied. Water temperatures and oxygen contents were recorded daily using a Pond Master sensor (OxyGuard, Farum, Denmark). Average water temperature was kept at 27.0 °C throughout the study period, and oxygen saturation in the RAS showed an average value at 127.0%, resembling an average oxygen content of 9.9 mg/L. The pH was measured weekly applying a color scale for indicator solution UNISOL 410 (Macherey-Nagel, Düren, Germany). Ammonium and nitrate concentrations were measured photometrically by a NANOCOLOR 300 D (Macherey-Nagel, Düren Germany). The average pH of the water was 6.9, while the ammonium and nitrate concentrations ranged in the intervals 0.05–0.12 mg/L and 0.12–0.26 mg/L, respectively.

2.3. Sampling of Experimental Fish

After 10 weeks of feeding, 120 fish were anesthetized with a sharp blow to the head and killed by immediate withdrawal of blood. Body weight, length and carcass weight were recorded for all experimental fish. Approximate FCR was calculated as followed:
approximate   FCR = mean   amount   of   feed   per   fish   g weight   gain   g
Daily weight gain was calculated as follows:
daily   weight   gain = weight   gain   g days   of   feeding
Eighteen fish (9 per treatment) were used for microbiome analysis (data presented elsewhere) and were not used for further product quality measurements. After the direct samplings, fish were filleted and each fillet was cut in two parts (anterior and posterior muscle) and frozen at −20 °C until further analyses.

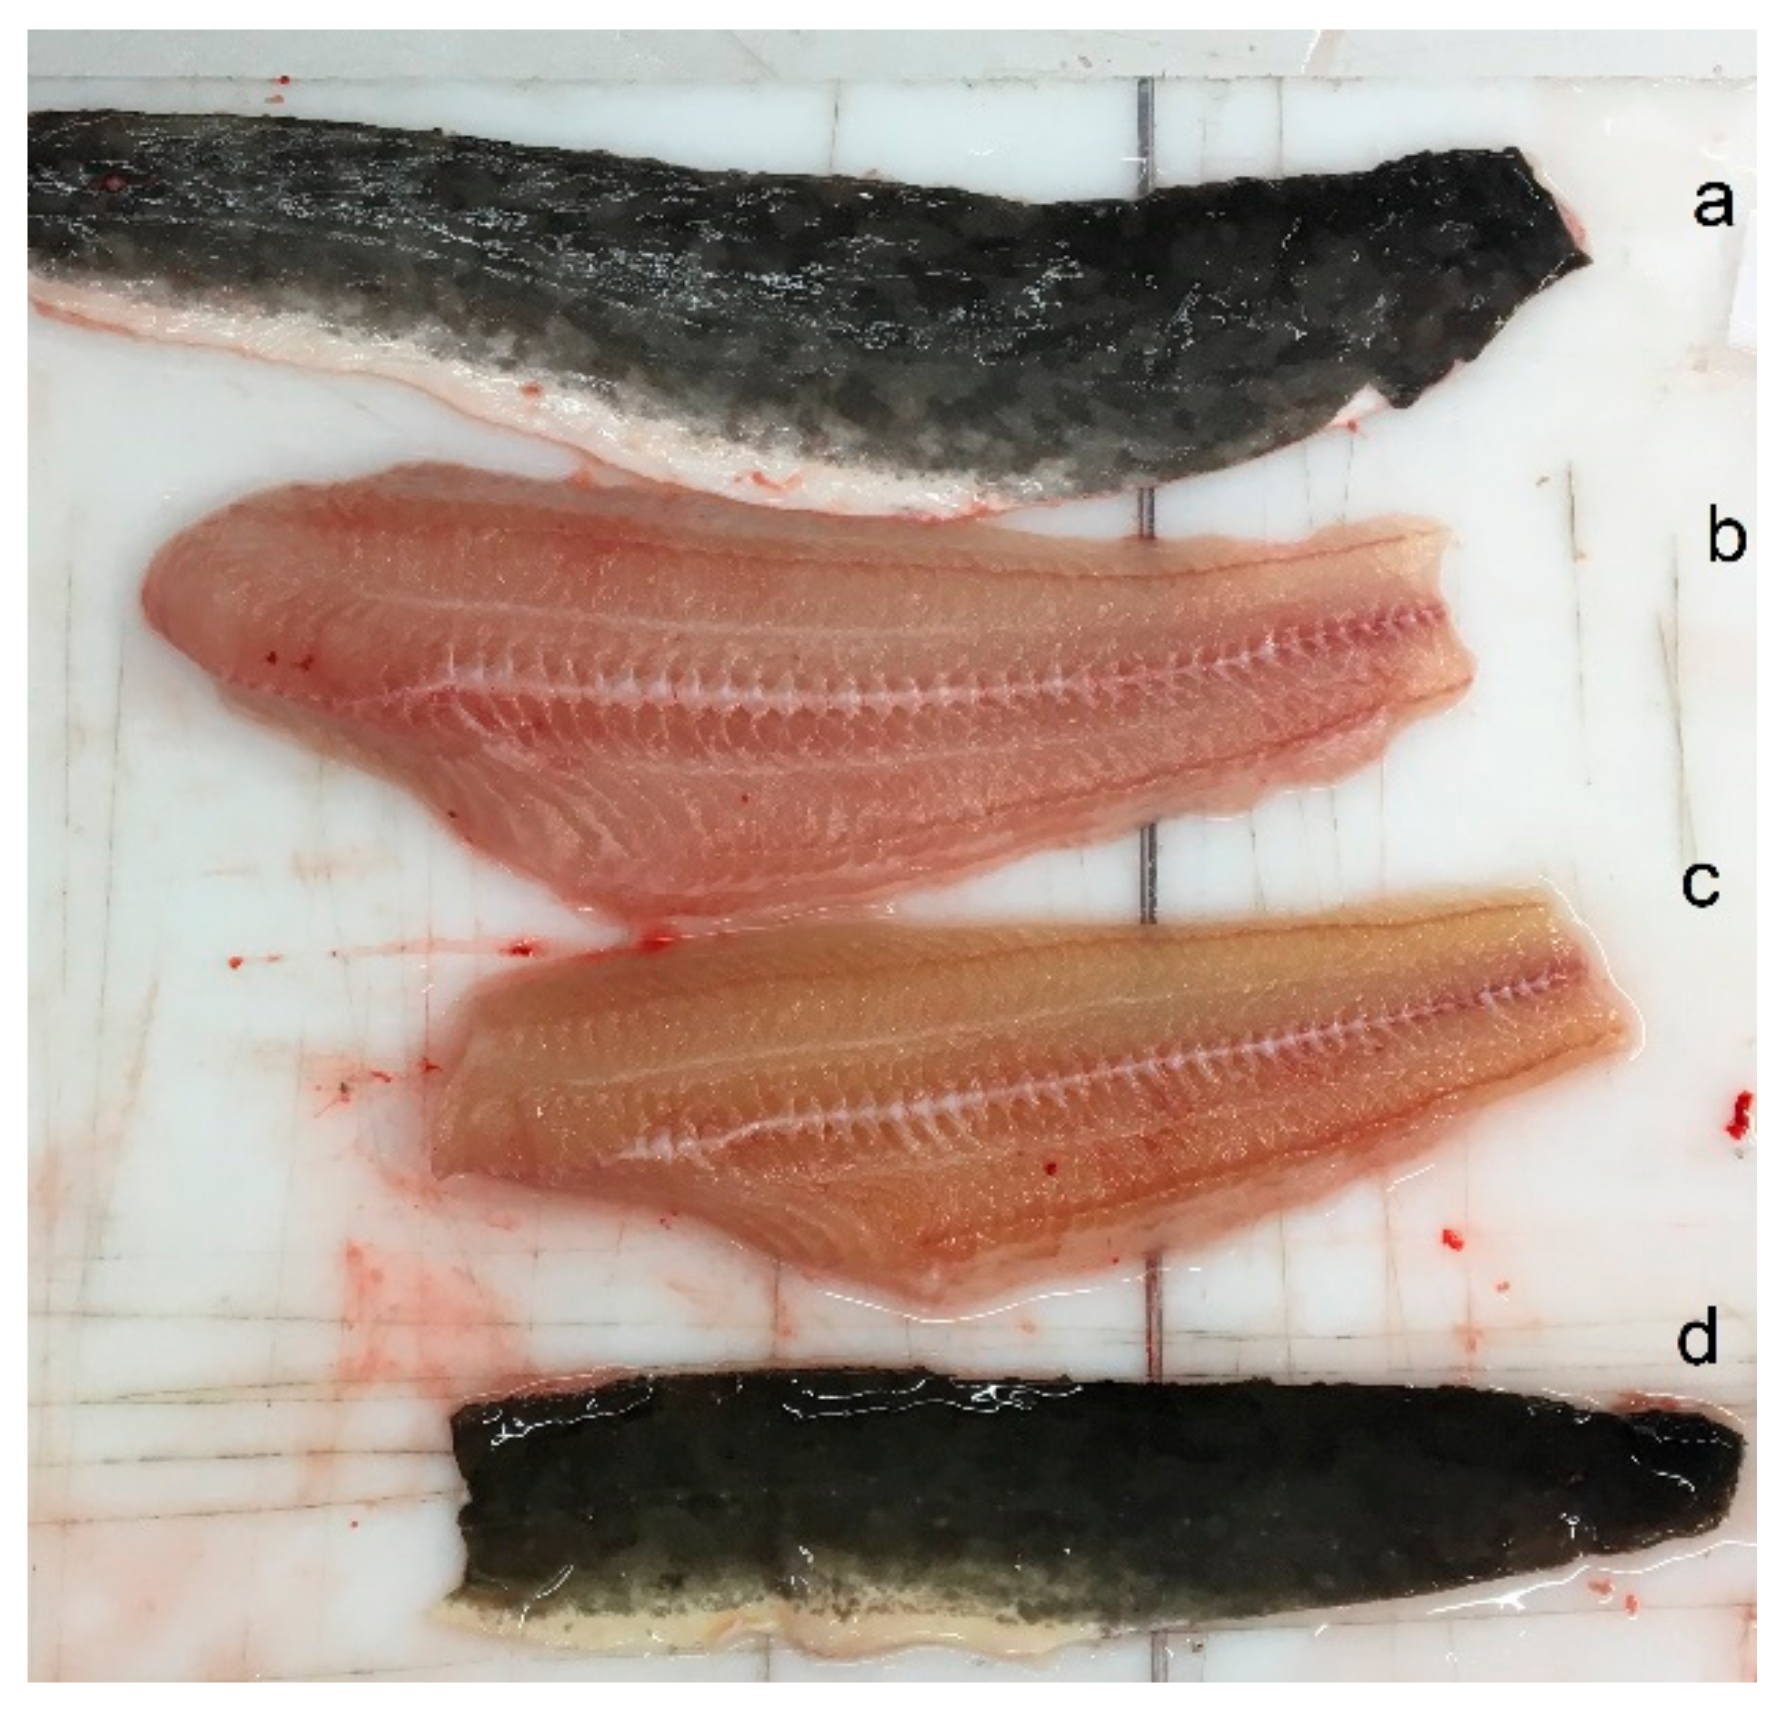
2.4. Color Measurements of Fish

A total of 102 fish (51 fish per treatment) were used to determine skin and fillet color (Figure 1). Color values were displayed as lightness (L*), red/green (a*) and blue/yellow (b*). Chroma (C*) describes the color saturation and was calculated as follows:
C * = a * 2 +   b * 2
h° describes the color appearance and was calculated as follows:
h ° = arctan b * a *
Immediately after slaughtering, skin color was measured with a CM-600d spectrophotometer (Konica Minolta, Chiyoda, Japan) with the following settings: Illumina D65 and two degrees observer. Both sides of the fish, left and right, were sampled on the dorsal skin at three points: between the head and dorsal fin, below the beginning of the dorsal fin and above the middle of the dorsal fin. In addition, three measurements were taken along the ventral skin at the abdomen: between the pectoral fins, between the pectoral and pelvic fins, and between the pelvic fins.
For the fillet color evaluation, both sides of the skinless fillets were cleaned with tap water and measured with a CR-400 spectrophotometer (KONICA MINOLTA, Japan) on the internal surface of the skinless fillet, as described by Iwona et al. [39] for African catfish. Subsequently, the right fillet was frozen at −72 °C for fatty acid analysis and the left fillet was frozen at −20 °C for the determination of color stability upon cooking and cooking loss.

2.5. Sampling of Experimental Fish

Further measurements were taken once the 102 (51 fish per treatment) fillets reached room temperature after thawing. The core temperature of raw and also of cooked fillets was measured with a thermometer (735-2, testo, Titisee-Neustadt, Germany). First, the right dorsal part of the fillets was thawed for 24 h at 4 °C, then the fillet color was measured (CM-600d, Konica Minolta, Chiyoda, Japan) once again in three measurements along the dorsal back muscle. The color change was calculated as follows:
Δ color = fillet   color   cooked fillet   color   raw
The fillets were weighed, placed in plastic bags that were slightly evacuated (80%) and then cooked in a water bath at 78 °C until the core temperature reached 70 °C. After the boiled fillets reached room temperature, the leaked fluid was carefully dabbed with a paper tissue, the fillets were weighed again, and a second color measurement was taken.

2.6. Fatty Acids

The method for the fatty acid analysis was adapted from [40] with modifications. Both of the experimental diets and the front dorsal muscle of 20 fish per treatment were used for analysis. Fish fillets and feed samples were freeze-dried overnight and minced (EGK 200 spice and coffee grinder, Rommelsbacher, Dinkelsbühl, Germany). The samples were stored at 4 °C in hermetically sealed boxes until further processing.

2.6.1. Chemical and Reagents

Butylated hydroxyanisol (BHA) and 3 M methanolic HCl were provided by Sigma-Aldrich (Munich, BY, Germany). Methanol, chloroform and n-hexane were purchased from Carlo Roth (Karlsruhe, BW, Germany). Sodium chloride (NaCl) was provided by VWR Chemicals (Darmastadt, Germany).

2.6.2. Fish Samples Treatment

Two grams of freeze-dried fish were accurately weighed and recorded to two decimal spaces. A 20 mL chloroform/methanol solution (2/1, v/v, Folch I solution) and 32 μL of 10% (w/v) BHA ethanolic solution were added. The mix was homogenized with an Ultra Turrax T25 (IKA, Germany) for 45 s. Next, the homogenate was filtered through paper and 5 mL of 0.88% NaCl (aq) was added. After 15 min the lower phase was withdrawn and evaporated with a Multivapor P-12 (BÜCHI, Switzerland) at 50 °C. Afterwards, 1 mL of 3 M methanolic HCl was added and incubated in a 60 °C water bath for 40 min. After cooling for 5 min at room temperature, 2 mL hexane was added. The upper phase was transferred into a 1.5 mL vial for the GC-FID analysis.

2.6.3. Feed Samples Treatment

Of freeze-dried feed, 0.5 g was accurately weighed. Three milliliters of 3 M methanolic HCl was added and incubated at 60 °C for 2 h. The mix was brought to room temperature and centrifuged for 5 min at 10 °C and 4000× g. One milliliter of the supernatant was mixed with 1 mL of n-hexane and 200 μL of the resulting upper phase was put into a GC-vial for the GC-FID analysis.

2.6.4. GC-FID Analysis of FAMEs

Fatty acid methyl esters (FAMEs) were analyzed by means of a TRACETM 1310 gas chromatograph (Thermo Fisher Scientific Inc., Waltham, MA, USA) and an AS 1310 autosampler (Thermo Fisher Scientific Inc., Waltham, USA). Extractions were performed in duplicate for the fish fillets and for the experimental diets in quadruplicate, respectively. The gas chromatograph was equipped with Chromeleon software (version 7.2.9). Separation of methyl esters was performed on a SupelcowaxTM-10 column (30 m, 0.32 mm, 0.25 μm) provided by Thermo Fisher, USA. A flame ionization detector (FID) was used with a heater temperature of 260 °C, an air flow of 350 mL/min, H2 flow of 35 mL/min and auxiliary gas flow of 40 mL/min. The SSL injector temperature was set at 250 °C with a split ratio of 1:50 and a purge flow of 2.4 mL/min. The oven temperature was set at 160 °C for 1 min, then increased by 10 °C/min until 220 °C and then held for 3 min. The final temperature reached 250 °C (increased also by 10 °C/min) and held for 3 min. The total run time amounted to 16 min. Hydrogen was used as a carrier gas with a flow rate of 1.2 mL/min. Identification of fatty acids was performed by comparison of retention times with the Supelco 37 Component FAME Mix standard (Sigma-Aldrich, Munich, Germany). The relative amount of each fatty acid was expressed as percentage of total area.

2.7. Statistical Analysis

The statistical analysis was conducted with R [41]. Even though a normal distribution is initially assumed for a fish population, we visually checked normality by Q-Q-plot and confirmed it with a Shapiro–Wilk test. Welch two-sample t-tests for unequal variances were carried out to compare the means of all quantitative variables from FM100 and SP100. ANOVA was calculated to obtain differences between the initial experimental units. Pearson’s correlation was used for linear association between fish body weight and cooking loss. A principal component analysis (PCA) was then performed on standardization (i.e., to mean 0 and standard deviation 1) such that the PCA was merely based on correlations of the studied variables. Multivariate analysis was applied to growth, color parameters, cooking loss as well as fatty acids. For visualization, the R package’s ggplot2 [42] and factoextra [43] were used. Additionally, R code snippets from Allen et al. [44] were adjusted to create raincloud plots.

3. Results

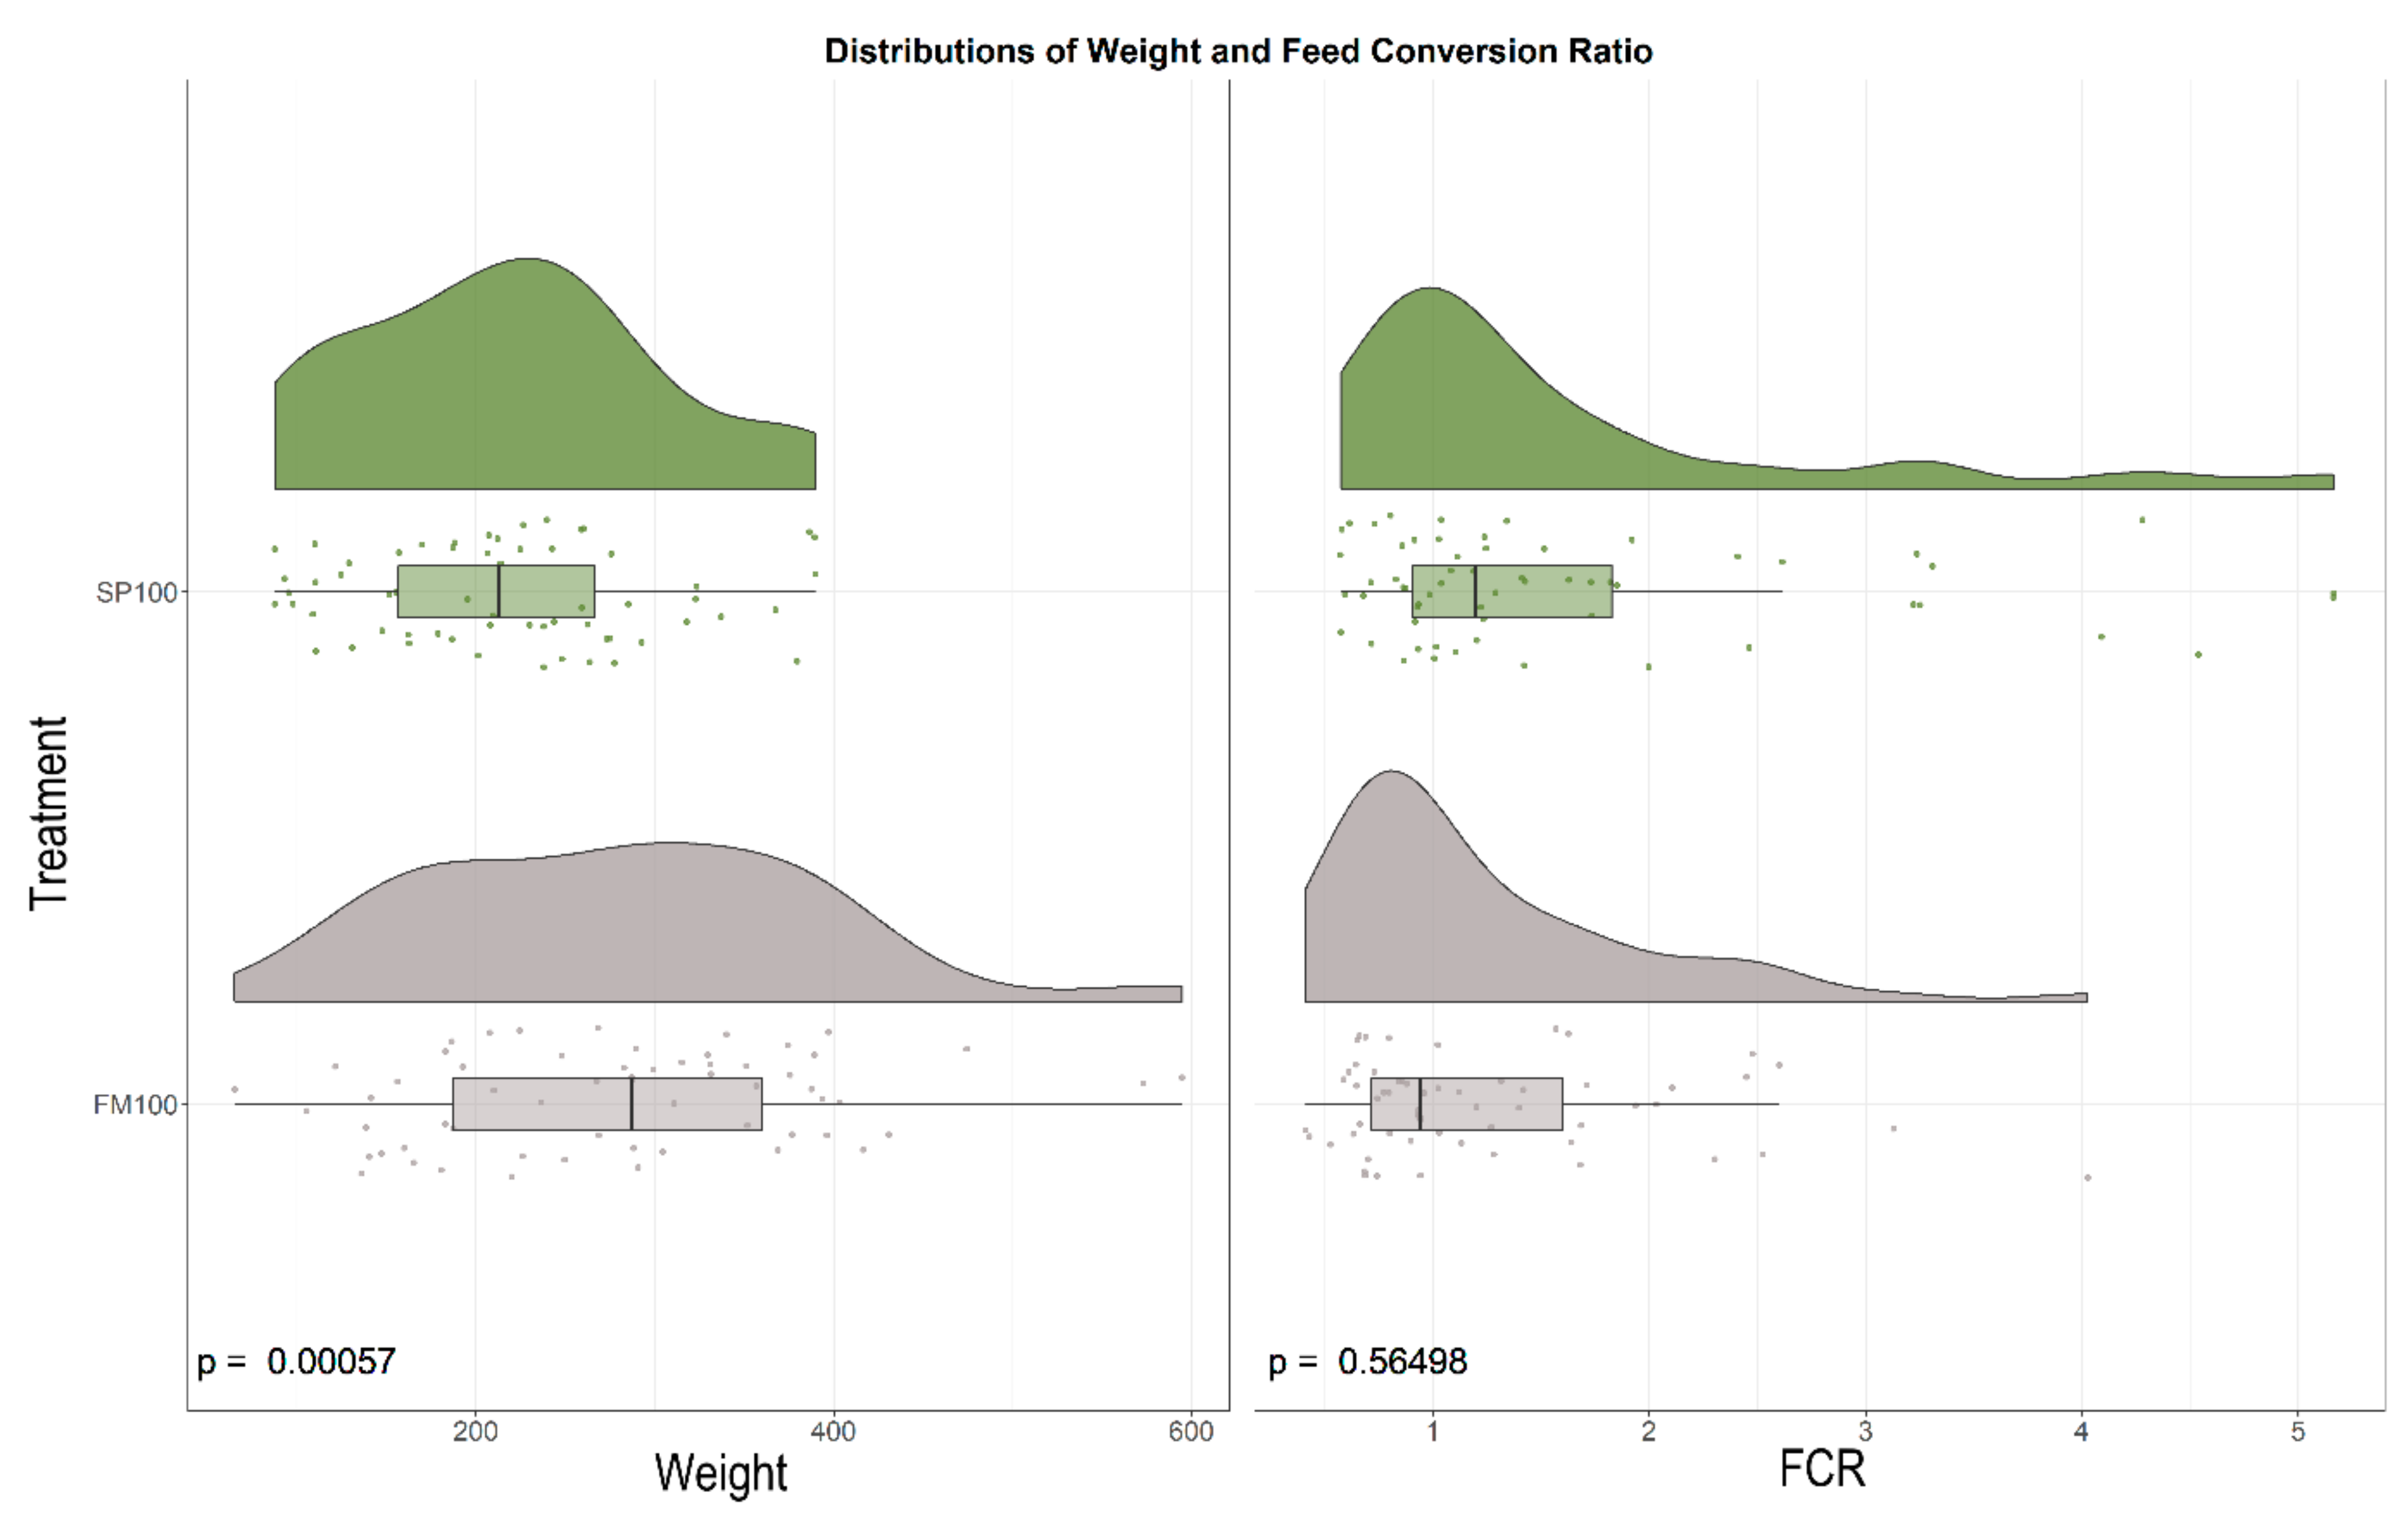
3.1. Growth Parameters

Mortality was generally low during the ten-week trial, since only one fish died for unknown reasons in the SP100 group. The initial body weight did not show any statistical differences between the experimental units (p > 0.05). The final body weight differed significantly among experimental groups, which showed average values of 280.84 ± 110.80 g for FM100 and 219 ± 82 g for SP100, respectively (Figure 2 and Table A1). The final weight was found to be significantly reduced for SP100 (p < 0.001). No statistically significant difference was observed in FCR between both groups (p > 0.05), but within the last weeks of the feeding experiment, we observed an increase in FCR for both groups (Table A2 in Appendix A).

3.2. Color Parameters and Cooking Loss
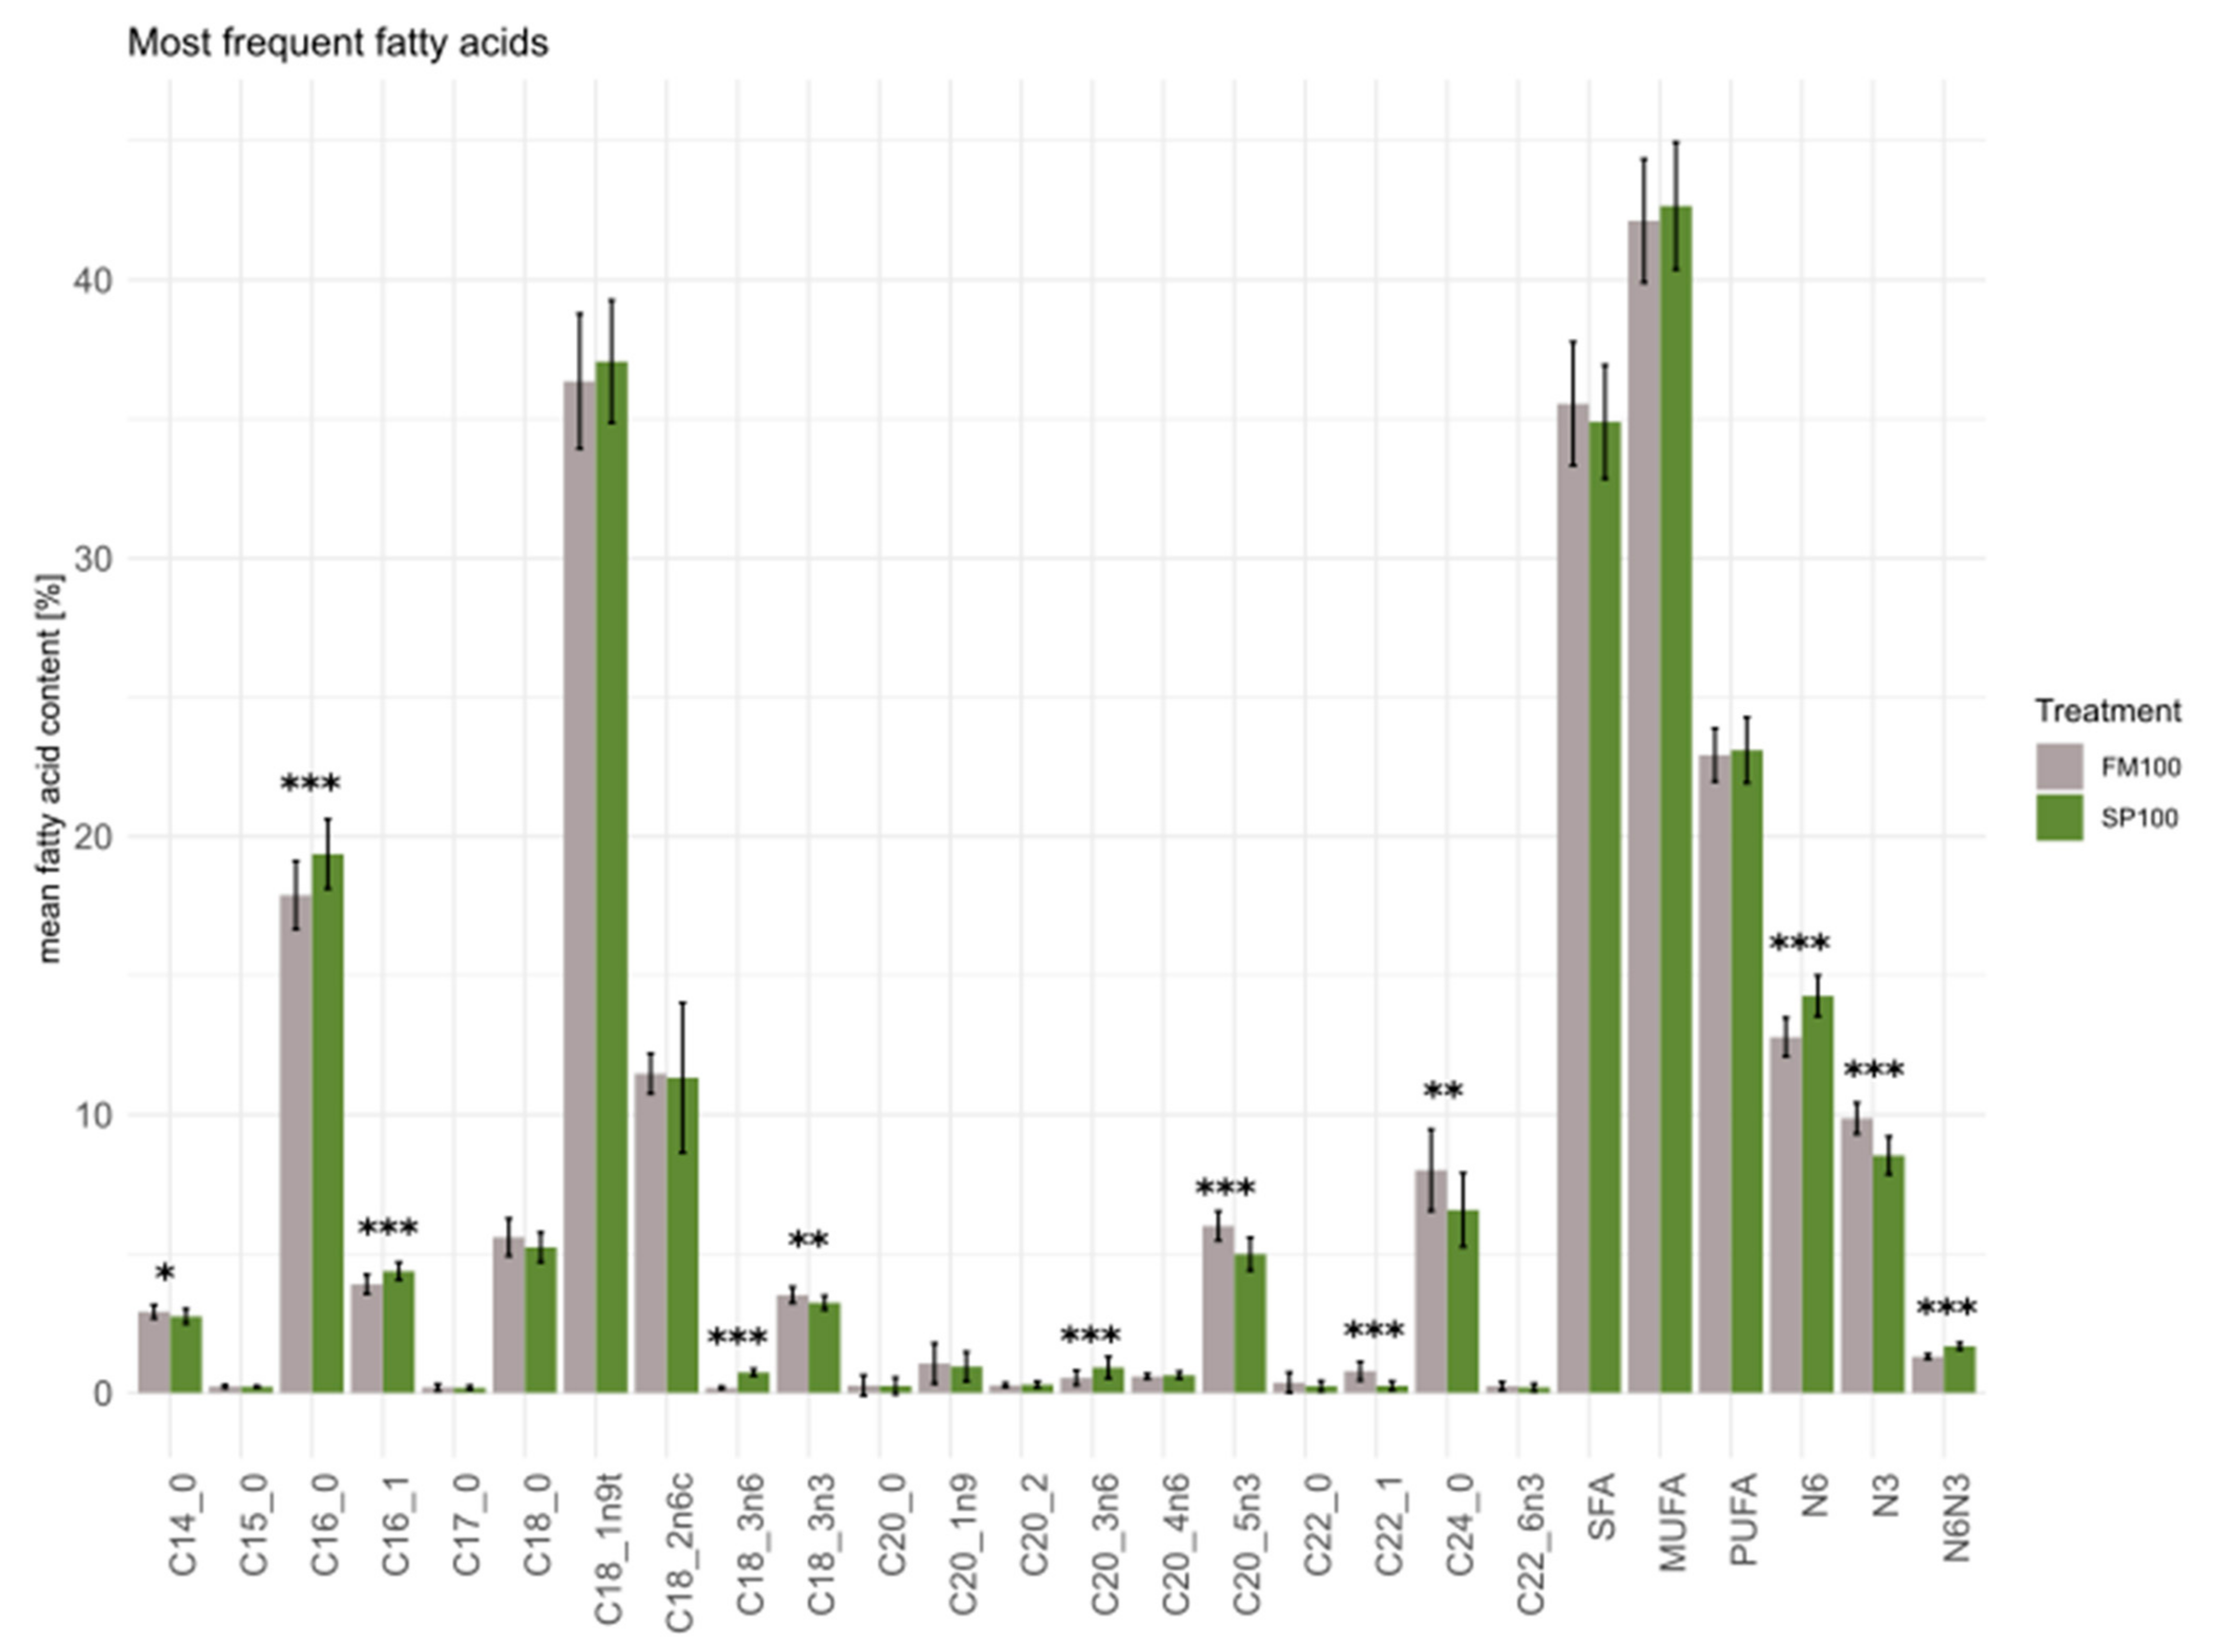
Dorsal skin and ventral skin showed significant differences between FM100 and SP100 in redness (a*) (p < 0.01), yellowness (b*) and C* (p < 0.001), but not in h°-values (p > 0.05). In SP100 samples, redness (a*) was lower in the skin and higher in the fillets (p < 0.001), when compared to FM100 group (Table 3). In skin and fillet samples of SP100, significantly higher values for the color yellow (b*) were observed (p < 0.001). No relevant differences for brightness (L*) were observed in both tissues (p > 0.05). In addition, SP100 values were elevated in treatment groups in skin and fillet; however, h°-values showed only slight increase in skin samples and decreased values in fillets.
The effect of cooking on the color stability of the fillet is expressed in the delta values between raw and cooked fillet samples. Color parameters changed after cooking for both treatments. Brightness, redness and yellowness increased due to the cooking process. The color changes were comparable for L* and b*, showing no statistically significant difference (p > 0.05). However, significant differences in Δa* were observed between the two groups (p < 0.01).
SP replacement affected cooking loss (p < 0.05). Specifically, cooking loss average values of 11.24 ± 3% and 9.82 ± 3% were recorded for FM100 and SP100 samples, respectively. No correlation was found between body weight and cooking juice loss (p > 0.05).

3.3. Fatty Acids

The five most abundant fatty acids in our investigation included oleic (C18:1n9), palmitic (C16:0), linoleic (C18:2n6c), lignoceric (C24:0) and eicosapentaenoic acids (C20:5n3) (Figure 3 and Table A2). Higher proportions of C16:0 (p < 0.001) were observed in fish fed the SP100 diet with 19.37 ± 1.25% compared to 17.89 ± 1.22% in the FM100 group. C24:0 (p < 0.01) and C20:5n3 (p < 0.001) were higher in the FM100 group (8.01 ± 1.47% and 6.00 ± 0.53%) than in the SP100 group (6.58 ± 1.33% and 4.99 ± 0.59%). No significant difference (p > 0.05) was observed for C18:1n9, which was the most abundant fatty acid in both FM100 (36.36 ± 2.42%) and SP100 (37.07 ± 2.20%) groups. No significant difference was found for C18:2n6c, with 11.48 ± 0.72% in FM100 and 11.33 ± 0.64% in the SP100 group. Overall, no differences were observed in sum of saturated fatty acids (SFA), monounsaturated fatty acids (MUFA) and polyunsaturated fatty acids (PUFA) between the two diets. Total n-6 fatty acids amounted to 12.79 ± 0.70% in FM100 and were higher (p < 0.001) in the SP100 group with 14.27 ± 0.73%, whereas n-3 fatty acids were lower in content (p < 0.001) in SP100 with 8.53 ± 0.68% towards 9.87 ± 0.56%. This led to a significantly lower (p < 0.001) n-6/n-3 ratio in FM100 (1.30 ± 0.09) than in SP100 (1.68 ± 0.12).
The fatty acid profile in the feed was characterized by higher values of SFA in SP100 (32.05 ± 0.28%) than in FM100 (25.37 ± 0.54%) and in MUFA for SP100 (52.16 ± 0.39%) than in SP100 (43.93 ± 1.97%) Table A3. Overall, PUFA levels were lower in SP100 (15.73 ± 0.17%) than in the FM100 (30.60 ± 1.48%) diet. It is particularly noticeable that the concentration of C20:5n3 in SP100 was much lower, at 0.62 ± 0.05%, than in FM100, with 8.58 ± 0.63%.

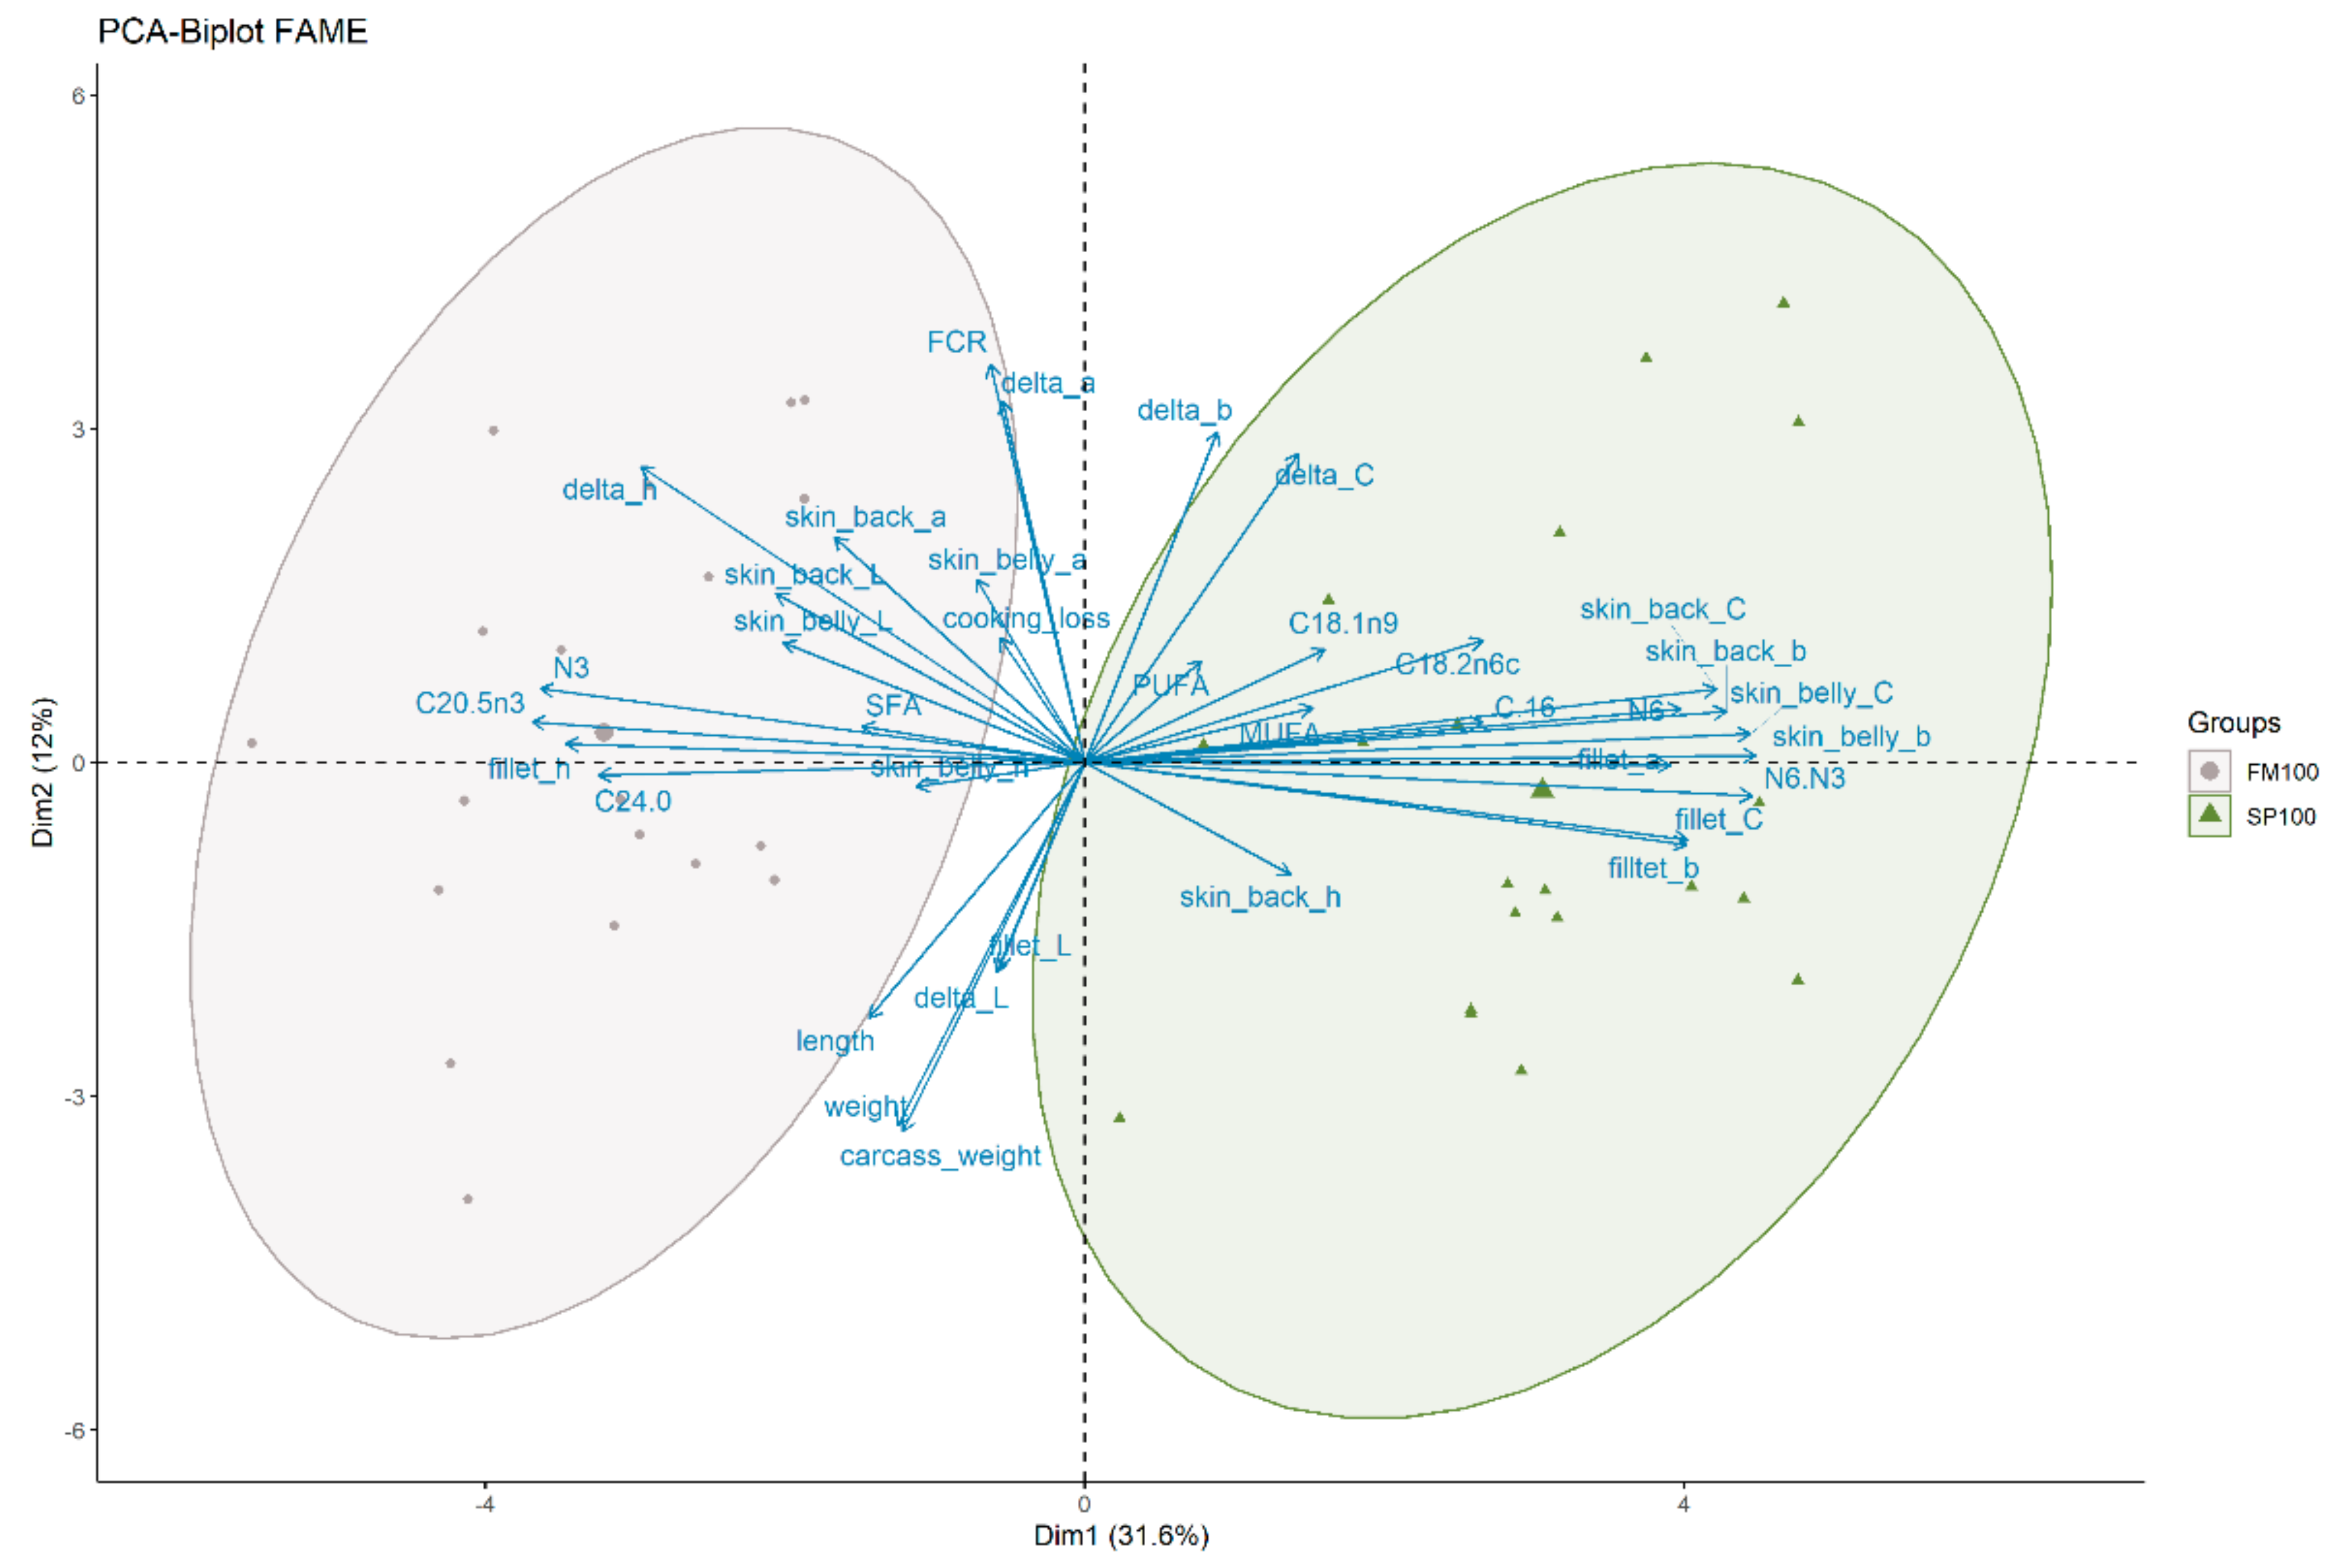
3.4. Principal Component Analysis (PCA)

The PCA biplot illustrates that fillet color was influenced the most by the complete replacement of FM with SP (Figure 4). In addition, skin color parameters (dorsal back muscle and belly) b* and C*, and to a lesser extent a*, were also affected by SP-based feeding. As for the other parameters, PCA confirms the results of the t-test, with fatty acids being one of the distinguishing factors among the two groups; FCR, weight, length, carcass weight, cooking loss and delta color parameter had only a subordinate influence.

4. Discussion

The results of this study indicate that a full supplementation of SP has a negative effect on the growth parameters in African catfish. Furthermore, our study implies that SP might affect consumer acceptance, as color parameters of skin and fillet change according to the SP supplementation. Additionally, effects on cooking loss and fatty acid composition were observed.
Growth performance is one of the most relevant factors for aquaculture economics, considering that the operational costs for aquafeed are between 50 and 70% [45]. In this trial, fish fed SP100 showed a significantly lower growth performance than the FM100 group. This confirms previous observations that a full replacement of fishmeal with SP resulted in reduced growth performance in other fish species [46,47]. More specifically, supplementation rates of up to 50% produced comparable growth to that of the control group, but beyond that level, a lower growth rate and—with a 100% SP replacement—a lower feed utilization was observed. On the other hand, a low (5%) to intermediate (75%) inclusion level of SP in the diet of African catfish has been shown to boost growth performance [22,47]. In our study, a full supplementation of SP had no effect on FCR. Over the course of the trial, a declining feed acceptance was observed within the last weeks of the trial and this resulted in uneaten food particles, which may have influenced the FCR and explain the tendency to increasing FCR values. Compared to other studies with a lower SP supplementations for African catfish, a full supplementation showed comparable FCR values [22,48,49]. However, the feed ingredients, housing conditions and the age of the catfish were different between experiments and especially SP composition can vary in protein, carbohydrate and lipid content [15].
Previous studies showed that the carotenoid pigments in the SP algae change the flesh color of rainbow trout to brown-yellow [50]. Our study delivered similar results, as skin and fillet color were highly influenced by the SP replacement. More specifically, yellow intensified in skin and fillet; red decreased in skin, but increased in the fillet; brightness was not affected. The different coloring effect on skin and fillet might be due to a diverse accumulation tendency by the various pigments in different tissues. Red and yellow values in skin and fillet of SP-fed trout increased, while brightness/darkness only showed remarkable differences in fillet color [18,29]. Both studies indicate SP as a good source of carotenoids to improve skin and fillet pigmentation. However, it must be taken into account that alterations in flesh color are known to have a potentially negative impact on consumer acceptance [51]. Traditionally, the fillet color of African catfish is classified as white [52,53]. On the one hand, a higher yellow coloration of catfish fillet might be perceived as a discoloration leading to lower consumer acceptance—for example, in countries like USA [54]. On the other hand, the characteristic coloration might also be used for sustainability marketing purposes, but more studies should be made on this topic.
The cooking process increased L*, a* and b* values for both groups. This observation could be justified by the already documented thermal stability of yellow pigments, such as lutein [39].
Dietary nutrients have the potential to improve the flesh quality of fish [55]. To ensure a high product quality, a minimal weight loss after cooking is required to fulfill consumer expectations [56]. The fish consists of high proportions of water and fat. Its moisture content mostly depends on feeding and usually ranges from 69 to 74% [57,58,59] and the fat content is about 5.7% [60]. Due to the cooking process, liquid components leach out of the fillet [61]. In our study, cooking loss was reduced in the SP100 group. A study performed on African catfish suggested that the fattening and—as a consequence—the weight of the fish could have an influence on the cooking loss [62]. More specifically, the author observed higher cooking losses in stronger fattened African catfish. However, in this case we found no statistically significant correlation between body weight and cooking loss, so that the difference might be due to a fattening effect, the diets or could be attributable to other aspects not considered in this study.
Our research showed that fatty acids profile was affected by the presence of SP in the diet. C18:1n-9 was one of the most prevalent fatty acids but did not differ significantly in the FM100 group. SFA, MUFA and PUFA also did not show any significant differences. In contradiction to our study, MUFA was reduced, while PUFA levels were elevated in Siberian sturgeon (Acipenser baeri) fed with high SP inclusion of up to 60% [63]. However, this led to increased proportions of C16:0, which is in accordance with our study. Teimouri et al. [35] reported similar findings for MUFA and PUFA in rainbow trout (Oncorhynchus mykiss) fed up to 100 g kg−1 SP. Additionally, SFA reduced with high inclusions of SP. However, Jafari et al. [34] found this effect in rainbow trout only with low SP inclusion of 5%, but not at 7.5%. Increasing amounts of SFA and PUFA could be found in Roohani et al. [29] at 52.8 g kg−1 SP inclusion in the feed of Caspian brown trout (Salmo trutta caspius). In walking catfish (Clarias macrocephalus) fed with a 10% SP inclusion, C16:0 increased too, but other highly abundant fatty acids such as C18:0, C18:1n-9, C18:2n-6 and C22:6n3 showed opposite results. Furthermore, SFA and MUFA increased and PUFA was reduced [64]. Differences in the fatty acid composition between the experimental groups can largely be explained by the fatty acid composition of the diets. In this respect, it is noted that the C20:5n3 was largely reduced in the SP100 diet, but in the fillet the strong difference was not reflected in the fish muscle. This might be because of the biosynthesis of long-chain PUFA towards C20 and C22 PUFA and the expression of the elongase of the very long chain fatty acid gene [65]. Nevertheless, the fatty acid composition is species-specific [66] and feed composition of the experimental diets differed strongly, which means that comparisons between species can only provide limited information. Differences in the microbial community of the gastrointestinal tract could be a reason for this effect. The slightly increased n6/n3 ratio observed in SP100 fillets reflects the fatty acids composition of diets. In fact, results showed how the replacement of FM with SP led to an increase of dietary n6 fatty acids and a contemporary reduction of the n3. Although from a mere nutritional point of view these data can be interpreted as a (slight) worsening of the lipid profile of the fillet, the observed n6/n3 ratio was still well below the limit of 5 recommended for the fatty acid balance in the human diet [67].

5. Conclusions

This is the first study regarding total replacement of fishmeal with SP for African catfish. Even though a full SP supplementation could produce several benefits in terms of sustainability, the full replacement of fishmeal with SP could return economic losses due to a lower growth performance. It remains to be shown whether catfish with elevated yellow skin and fillet coloration is acceptable to consumers. Moreover, investigations on the chemical nature of pigments accumulated in the fish muscle are necessary in order to evaluate possible health benefits deriving from the consumption of SP-fed African catfish. Even though the replacement of fishmeal reduced the PUFA content in feed drastically, this difference was comparably low in flesh and the resulting n6/n3 ratio is still considered acceptable. Further optimizations in feed composition and feed application time should be investigated as well as the performance of other fish species.

Author Contributions

Conceptualization, S.R.; methodology, S.R., M.C. and D.M.; validation, S.R., M.C. and D.M.; formal analysis, E.O.; investigation, S.R. and M.C.; resources, S.R., C.D., M.C. and D.M.; data curation, S.R., M.C. and E.O.; writing—original draft preparation, S.R.; writing—review and editing, M.C., E.O., S.W., J.T. and D.M.; visualization, E.O.; supervision, M.C., D.M. and J.T.; project administration, M.C., D.M. and J.T.; funding acquisition, S.W. All authors have read and agreed to the published version of the manuscript.

Funding

This work was supported by the Lower Saxony Ministry of Science and Culture Germany (11-76251-99-36/16(ZN 3261)). We acknowledge support by the Open Access Publication Funds of the Göttingen University.

Institutional Review Board Statement

The study was carried out in accordance with the EU Directive 2010/63/EU for animals used for scientific purposes and the Council for Animal Welfare at the University of Göttingen approved the study (T2-2019int).

Informed Consent Statement

Not applicable.

Data Availability Statement

The data presented in this study are available on request from the corresponding author.

Acknowledgments

The authors would like to thank the technical personnel of the division of Product Quality of Animal Products and the technical personnel of the division of Aquaculture.

Conflicts of Interest

The authors declare no conflict of interest.

Appendix A

Table A1. Final growth parameters, carcass weight and approximate FCR and daily weight gain of FM100 (n = 60) and SP100 (n = 60).
DietWeight [g]Length [mm]Carcass Weight [g]Approximate Feed Conversion Rate (FCR)Daily Weight Gain [g]
FM100280.84 ± 110.80315.85 ± 38.84256.67 ± 99.910.97 ± 1.893.31 ± 1.59
SP100218.66 ± 82.24291.33 ± 33.31199.61 ± 72.871.16 ± 1.162.41 ± 1.18
df108.74115.32107.9397.921108.74
t-Statistics3.5503.7113.617−0.5773.550
p-Value<0.001<0.001<0.0010.565<0.001
Values are means ± SD. p-values were calculated by Welch t-test.
Table A2. Growth parameters over the course of the ten-week trial for FM100 and SP100.
Weeks0–22–66–10
DietWeight [g]FCRDaily Weight
Gain [g]
Weight [g]FCRDaily Weight
Gain [g]
Weight
[g]
FCRDaily Weight
Gain [g]
FM10074.47 ± 0.640.67 ± 0.031.714 ± 0.08169.33 ± 8.810.66 ± 0.053.388 ± 0.25280.84 ± 13.191.33 ± 0.193.982 ± 0.60
SP10071.07 ± 1.060.75 ± 0.031.526 ± 0.07147.95 ± 5.870.78 ± 0.042.756 ± 0.16218.66 ± 41.571.72 ± 0.282.526 ± 0.44
df2.6064.0003.7533.5883.9863.4392.3993.5613.671
t-Statistics3.396−3.0843.0533.506−3.2453.7382.469−1.9913.412
p-Value0.0530.0370.0410.0300.0320.02640.1110.1260.031
Values are means ± SD of triplicate goups (n = 20 per replicate). p-values were calculated by Welch t-test.
Table A3. Fatty acid content (%) of FM100 (n = 20) and SP100 (n = 20) in the fillet.
Fatty AcidFM100SP100p-Value
C6:00.00 ± 0.000.00 ± 0.00NA
C8:00.00 ± 0.000.00 ± 0.000.586
C10:00.00 ± 0.000.00 ± 0.000.690
C11:00.00 ± 0.000.00 ± 0.000.622
C12:00.07 ± 0.020.07 ± 0.010.957
C13:00.01 ± 0.010.01 ± 0.010.700
C14:02.92 ± 0.242.75 ± 0.260.026
C14:10.02 ± 0.010.02 ± 0.010.247
C15:00.23 ± 0.060.22 ± 0.030.535
C15:10.00 ± 0.000.00 ± 0.00 0.834
C16:017.89 ± 1.2219.37 ± 1.25<0.001
C16:13.90 ± 0.344.37 ± 0.32<0.001
C17:00.20 ± 0.120.18 ± 0.070.639
C17:10.00 ± 0.000.00 ± 0.000.155
C18:05.59 ± 0.675.23 ± 0.530.061
C18:1n936.36 ± 2.4237.07 ± 2.200.312
C18:2n6c11.48 ± 0.7211.33 ± 0.640.811
C18:3n60.18 ± 0.050.73 ± 0.13<0.001
C18:3n33.52 ± 0.293.24 ± 0.250.001
C20:00.27 ± 0.370.25 ± 0.300.806
C20:1n91.06 ± 0.720.95 ± 0.530.580
C20:20.27 ± 0.070.30 ± 0.110.389
C20:3n60.54 ± 0.270.91 ± 0.39<0.001
C21:00.00 ± 0.010.00 ± 0.000.223
C20:4n60.59 ± 0.100.63 ± 0.130.195
C20:3n30.11 ± 0.020.10 ± 0.030.264
C20:5n36.00 ± 0.534.99 ± 0.59<0.001
C22:00.37 ± 0.360.24 ± 0.180.099
C22:10.78 ± 0.340.26 ± 0.17<0.001
C22:20.00 ± 0.000.00 ± 0.00NA
C23:00.00 ± 0.000.00 ± 0.00NA
C24:08.01 ± 1.476.58 ± 1.330.001
C24:1n90.00 ± 0.000.00 ± 0.010.324
C22:6n30.24 ± 0.150.20 ± 0.130.277
SFA35.55 ± 2.2234.90 ± 2.040.299
MUFA42.12 ± 2.2242.66 ± 2.290.428
PUFA22.93 ± 0.9523.10 ± 1.180.604
Total n-612.79 ± 0.7014.27 ± 0.73<0.001
Total n-39.87 ± 0.568.53 ± 0.68<0.001
n-6/n-31.30 ± 0.091.68 ± 0.12<0.001
Values are means ± SD. p-values were calculated by t-test.
Table A4. Fatty acid content (%) in FM100 and SP100 diet.
Fatty AcidFM100SP100
C6:00.00 ± 0.000.15 ± 0.00
C8:00.02 ± 0.020.10 ± 0.02
C10:00.00 ± 0.000.00 ± 0.00
C11:00.00 ± 0.000.28 ± 0.00
C12:00.06 ± 0.020.11 ± 0.02
C13:00.01 ± 0.000.05 ± 0.00
C14:03.65 ± 0.334.59 ± 0.33
C14:1NANA
C15:00.24 ± 0.020.54 ± 0.02
C15:1NANA
C16:012.60 ± 0.3519.03 ± 0.35
C16:13.93 ± 0.264.85 ± 0.26
C17:00.20 ± 0.390.45 ± 0.39
C17:10.09 ± 0.000.09 ± 0.00
C18:02.61 ± 0.183.73 ± 0.18
C18:1n936.80 ± 2.2544.75 ± 2.25
C18:2n6c15.77 ± 0.5311.81 ± 0.16
C18:3n60.12 ± 0.021.19 ± 0.05
C18:3n34.83 ± 0.361.34 ± 0.04
C20:00.58 ± 0.041.80 ± 0.03
C20:1n91.87 ± 0.131.96 ± 0.05
C20:20.10 ± 0.010.06 ± 0.01
C20:3n60.07 ± 0.020.06 ± 0.00
C21:00.00 ± 0.000.00 ± 0.00
C20:4n60.56 ± 0.060.12 ± 0.01
C20:3n30.00 ± 0.000.00 ± 0.00
C20:5n38.58 ± 0.630.62 ± 0.05
C22:00.22 ± 0.060.59 ± 0.28
C22:11.24 ± 0.150.50 ± 0.28
C22:2NANA
C23:0NANA
C24:05.18 ± 0.240.61 ± 0.03
C24:1n90.00 ± 0.000.00 ± 0.01
C22:6n30.67 ± 0.160.58 ± 0.12
SFA25.37 ± 0.5432.05 ± 0.28
MUFA43.93 ± 1.9752.16 ± 0.39
PUFA30.60 ± 1.4815.73 ± 0.17
Total n-616.51 ± 0.6013.19 ± 0.20
Total n-314.09 ± 0.882.54 ± 0.12
n-6/n-31.17 ± 0.305.21 ± 0.03
Values are means ± SD.

References

  1. Lovejoy, T.E.; Hannah, L.J.; Ainley, D.G.; Wilson, E.O. Biodiversity and Climate Change: Transforming the Biosphere; Yale University Press: London, UK, 2019; ISBN 9780300206111. [Google Scholar]
  2. Sala, O.E.; Chapin, F.S.; Armesto, J.J.; Berlow, E.; Bloomfield, J.; Dirzo, R.; Huber-Sanwald, E.; Huenneke, L.F.; Jackson, R.B.; Kinzig, A.; et al. Global biodiversity scenarios for the year 2100. Science 2000, 287, 1770–1774. [Google Scholar] [CrossRef]
  3. Thomas, C.D.; Cameron, A.; Green, R.E.; Bakkenes, M.; Beaumont, L.J.; Collingham, Y.C.; Erasmus, B.F.N.; de Siqueira, M.F.; Grainger, A.; Hannah, L.; et al. Extinction risk from climate change. Nature 2004, 427, 145–148. [Google Scholar] [CrossRef]
  4. Mooney, H.; Larigauderie, A.; Cesario, M.; Elmquist, T.; Hoegh-Guldberg, O.; Lavorel, S.; Mace, G.M.; Palmer, M.; Scholes, R.; Yahara, T. Biodiversity, climate change, and ecosystem services. Curr. Opin. Environ. Sustain. 2009, 1, 46–54. [Google Scholar] [CrossRef]
  5. Rijnsdorp, A.D.; Peck, M.A.; Engelhard, G.H.; Möllmann, C.; Pinnegar, J.K. Resolving the effect of climate change on fish populations. ICES J. Mar. Sci. 2009, 66, 1570–1583. [Google Scholar] [CrossRef]
  6. Cheung, W.W.L.; Lam, V.W.Y.; Sarmiento, J.L.; Kearney, K.; Watson, R.; Pauly, D. Projecting global marine biodiversity impacts under climate change scenarios. Fish Fish. 2009, 10, 235–251. [Google Scholar] [CrossRef]
  7. Booth, D.J.; Poloczanska, E.; Donelson, J.M.; Molinos, J.G.; Burrows, M. Biodiversity and Climate Change in the Oceans. In Climate Change Impacts on Fisheries and Aquaculture; Phillips, B.F., Pérez-Ramírez, M., Eds.; John Wiley & Sons, Ltd.: Hoboken, NJ, USA, 2017; pp. 63–89. [Google Scholar]
  8. Lawrence, A.J.; Arukwe, A.; Moore, M.; Sayer, M.; Thain, J. Molecular/Cellular Processes and the Physiological Response to Pollution. In Effects of Pollution on Fish; Lawrence, A., Hemingway, K., Eds.; John Wiley & Sons, Ltd.: Hoboken, NJ, USA, 2007; pp. 83–133. [Google Scholar]
  9. Austin, B. The effects of pollution on fish health. J. Appl. Microbiol. 1998, 85 (Suppl. 1), 234–242. [Google Scholar] [CrossRef]
  10. Heath, A.G. Water Pollution and Fish Physiology, 2nd ed.; CRC: Boca Raton, FL, USA, 2018; ISBN 9780203718896. [Google Scholar]
  11. Khoshnood, Z. Effects of Environmental Pollution on Fish: A Short Review. Transylv. Rev. Syst. Ecol. Res. 2017, 19, 49–60. [Google Scholar] [CrossRef] [Green Version]
  12. Little, D.C.; Edwards, P. Integrated Livestock-Fish Farming Systems; FAO: Rome, Italy, 2003; ISBN 92-5-105055-4. [Google Scholar]
  13. García, S.M. The Ecosystem Approach to Fisheries: Issues, Terminology, Principles, Institutional Foundations, Implementation and Outlook; Food and Agriculture Organization of the United Nations: Rome, Italy, 2003; ISBN 92-5-104960-2. [Google Scholar]
  14. Taelman, S.E.; de Meester, S.; Roef, L.; Michiels, M.; Dewulf, J. The environmental sustainability of microalgae as feed for aquaculture: A life cycle perspective. Bioresour. Technol. 2013, 150, 513–522. [Google Scholar] [CrossRef]
  15. Becker, E.W. Micro-algae as a source of protein. Biotechnol. Adv. 2007, 25, 207–210. [Google Scholar] [CrossRef]
  16. Dernekbasi, S.; Unal, H.; Karayucel, I.; Aral, O. Effect of Dietary Supplementation of Different Rates of Spirulina (Spirulina platensis) on Growth and Feed Conversion in Guppy (Poecilia reticulate Peters, 1860). J. Anim. Vet. Adv. 2010, 9, 1395–1399. [Google Scholar]
  17. Velasquez, S.F.; Chan, M.A.; Abisado, R.G.; Traifalgar, R.F.M.; Tayamen, M.M.; Maliwat, G.C.F.; Ragaza, J.A. Dietary Spirulina (Arthrospira platensis) replacement enhances performance of juvenile Nile tilapia (Oreochromis niloticus). J. Appl. Phycol. 2016, 28, 1023–1030. [Google Scholar] [CrossRef]
  18. Teimouri, M.; Amirkolaie, A.K.; Yeganeh, S. The effects of dietary supplement of Spirulina platensis on blood carotenoid concentration and fillet color stability in rainbow trout (Oncorhynchus mykiss). Aquaculture 2013, 414–415, 224–228. [Google Scholar] [CrossRef]
  19. Sirakov, I.; Velichkova, K.; Nikolov, G. The effect of algae meal (Spirulina) on the growth performance and carcass parameters of rainbow trout (Oncorhynchus mykiss). J. BioSci. Biotech. 2012, 151–156. Available online: https://www.researchgate.net/publication/271326438_The_effect_of_algae_meal_Spirulina_on_the_growth_performance_and_carcass_parameters_of_rainbow_trout_Oncorhynchus_mykiss (accessed on 29 September 2020).
  20. Nandeesha, M.C.; Gangadhara, B.; Manissery, J.K.; Venkataraman, L.V. Growth performance of two Indian major carps, catla (Catlacatla) and rohu (Labeorohita) fed diets containing different levels of Spirulina platensis. Bioresour. Technol. 2001, 80, 117–120. [Google Scholar] [CrossRef]
  21. Raji, A.A.; Alaba, P.A.; Yusuf, H.; Abu Bakar, N.H.; Mohd Taufek, N.; Muin, H.; Alias, Z.; Milow, P.; Abdul Razak, S. Fishmeal replacement with Spirulina Platensis and Chlorella vulgaris in African catfish (Clarias gariepinus) diet: Effect on antioxidant enzyme activities and haematological parameters. Vet. Sci. Res. J. 2018, 119, 67–75. [Google Scholar] [CrossRef] [PubMed]
  22. Promya, J.; Chitmanat, C. The effects of Spirulina platensis and Cladophora Algae on the Growth Performance, Meat Quality and Immunity Stimulating Capacity of the African Sharptooth Catfish (Clarias gariepinus). Int. J. Agric. Biol. 2011, 13, 77–82. [Google Scholar]
  23. Meng-Umphan, K. Growth performance, sex hormone levels and maturation ability of Pla Pho (Pangasius bocourti) fed with spirulina supplementary pellet and hormone application. Int. J. Agric. Biol. 2009, 11, 458–462. [Google Scholar]
  24. Roy, S.S.; Pal, R. Microalgae in Aquaculture: A Review with Special References to Nutritional Value and Fish Dietetics. Proc. Zool. Soc. 2015, 68, 1–8. [Google Scholar] [CrossRef]
  25. Miki, W.; Yamaguchi, K.; Konosu, S. Chemistry and utilization of plankton. VIII. Carotenoid composition of Spirulina maxima. Nippon Suisan Gakkaishi 1986, 52, 1225–1227. [Google Scholar] [CrossRef]
  26. Mathew, B.; Sankaranarayanan, R.; Nair, P.P.; Varghese, C.; Somanathan, T.; Amma, B.P.; Amma, N.S.; Nair, M.K. Evaluation of chemoprevention of oral cancer with Spirulina fusiformis. Nutr. Cancer 1995, 24, 197–202. [Google Scholar] [CrossRef]
  27. Hata, M.; Hata, M. Studies on Astaxanthin Formation in some Fresh-water Fishes. Tohoku J. Agric. Res. 1974, 24, 192–196. [Google Scholar]
  28. Kop, A.; Durmaz, Y. The effect of synthetic and natural pigments on the colour of the cichlids (Cichlasoma severum sp., Heckel 1840). Aquac. Int. 2008, 16, 117–122. [Google Scholar] [CrossRef]
  29. Roohani, A.M.; Abedian Kenari, A.; Fallahi Kapoorchali, M.; Borani, M.S.; Zoriezahra, S.J.; Smiley, A.H.; Esmaeili, M.; Rombenso, A.N. Effect of spirulina Spirulina platensis as a complementary ingredient to reduce dietary fish meal on the growth performance, whole-body composition, fatty acid and amino acid profiles, and pigmentation of Caspian brown trout (Salmo trutta caspius) juveniles. Aquac. Nutr. 2019, 25, 633–645. [Google Scholar] [CrossRef]
  30. Vílchez, C.; Forján, E.; Cuaresma, M.; Bédmar, F.; Garbayo, I.; Vega, J.M. Marine carotenoids: Biological functions and commercial applications. Mar. Drugs 2011, 9, 319–333. [Google Scholar] [CrossRef] [PubMed] [Green Version]
  31. Welker, C.; de Negro, P.; Sarti, M. Green algal carotenoids and yellow pigmentation of rainbow trout fish. Aquac. Int. 2001, 9, 87–93. [Google Scholar] [CrossRef]
  32. Tapiero, H.; Nguyen Ba, G.; Couvreur, P.; Tew, K.D. Polyunsaturated fatty acids (PUFA) and eicosanoids in human health and pathologies. Biomed. Pharmacother. 2002, 56, 215–222. [Google Scholar] [CrossRef]
  33. Nakagawa, H. Effect of dietary algae on improvement of lipid metabolism in fish. Biomed. Pharmacother. 1997, 51, 345–348. [Google Scholar] [CrossRef]
  34. Jafari, S.M.A.; Rabbani, M.; Emtyazjoo, M.; Piryaei, F. Effect of dietary Spirulina platensis on fatty acid composition of rainbow trout (Oncorhynchus mykiss) fillet. Aquac. Int. 2014, 22, 1307–1315. [Google Scholar] [CrossRef]
  35. Teimouri, M.; Yeganeh, S.; Amirkolaie, A.K. The effects of Spirulina platensis meal on proximate composition, fatty acid profile and lipid peroxidation of rainbow trout (Oncorhynchus mykiss) muscle. Aquac. Nutr. 2016, 22, 559–566. [Google Scholar] [CrossRef]
  36. FAO. FAO Fisheries & Aquaculture—Species Fact Sheets—Clarias Gariepinus (Burchell, 1822). Available online: http://www.fao.org/fishery/species/2982/en (accessed on 29 September 2020).
  37. Dietz, C.; Sünder, A.; Liebert, F. Does Genetic Background of Rainbow Trout Impact on Growth and Feed Utilization Following Fishmeal Substitution by Partly Defatted Insect Meal (Hermetia illucens) or Microalgae Powder (Arthrospira platensis)?: 74rd Conference 3–5 March 2020 in Göttingen; DLG-Verlag: Frankfurt, Germany, 2020; ISBN 978-3-7690-4113-2. [Google Scholar]
  38. National Research Council. Nutrient Requirements of Fish and Shrimp; National Academies Press: Washington, DC, USA, 2011; ISBN 978-0-309-47322-4. [Google Scholar]
  39. Iwona, C.-S.; Skiepko, N.; Pomianowski, J.F.; Kubiak, M.S.; Baryczka, M. Gender differences in the chemical composition and selected properties of African Catfish (Clarias Gariepinus Burchell, 1822) Meat. Ital. J. Food Sci. 2016, 28, 2016–2391. [Google Scholar]
  40. Du, M.; Ahn, D.U.; Sell, J.L. Effects of dietary conjugated linoleic acid and linoleic:linolenic acid ratio on polyunsaturated fatty acid status in laying hens. Poult. Sci. J. 2000, 79, 1749–1756. [Google Scholar] [CrossRef]
  41. R Core Team. R: A Language and Environment for Statistical Computing; R Foundation for Statistical Computing: Vienna, Austria, 2020. [Google Scholar]
  42. Wickham, H. ggplot2: Elegant Graphics for Data Analysis; Springer: Cham, Germany, 2016; ISBN 9783319242774. [Google Scholar]
  43. Kassambara, A.; Mundt, F. Factoextra: Extract and Visualize the Results of Multivariate Data Analyses. Available online: https://CRAN.R-project.org/package=factoextra (accessed on 29 September 2020).
  44. Allen, M.; Poggiali, D.; Whitaker, K.; Marshall, T.R.; Kievit, R.A. Raincloud plots: A multi-platform tool for robust data visualization. Wellcome Open Res. 2019, 4, 63. [Google Scholar] [CrossRef] [PubMed] [Green Version]
  45. FAO. The State of World Fisheries and Aquaculture: Meeting the Sustainable Development Goals; FAO: Rome, Italy, 2018; ISBN 9789251305621. [Google Scholar]
  46. Olvera-Novoa, M.A.; Domínguez-Cen, L.J.; Olivera-Castillo, L.; Martínez-Palacios, C.A. Effect of the use of the microalga Spirulina maxima as fish meal replacement in diets for tilapia, Oreochromis mossambicus (Peters), fry. Aquac. Res. 1998, 29, 709–715. [Google Scholar] [CrossRef]
  47. El-Sayed, A.-F.M. Evaluation of soybean meal, spirulina meal and chicken offal meal as protein sources for silver seabream (Rhabdosargus sarba) fingerlings. Aquaculture 1994, 127, 169–176. [Google Scholar] [CrossRef]
  48. Chavez, P.D.L.C.; Bolviar, R.B. Spirulina platensis as an alternative protein source for the African catfish Clarias gariepinus. AACL Bioflux 2018, 11, 481–494. [Google Scholar]
  49. Raji, A.A.; Junaid, O.Q.; Milow, P.; Mohd. Taufek, N.; Fada, A.M.; Kolawole, A.A.; Alias, Z.; Razak, S.A. Partial replacement of fishmeal with Spirulina platensis and Chlorella vulgaris and its effect on growth and body composition of African catfish Clarias gariepinus (Burchell 1822). Indian J. Fish. 2019, 66, 100–111. [Google Scholar] [CrossRef]
  50. Choubert, G. Tenative utilization of Spirulina algae as a source of carotenoid pigments for Rainbow Trout. Aquaculture 1979, 18, 135–143. [Google Scholar] [CrossRef]
  51. Peterson, D.H.; Jäger, H.K.; Savage, G.M.; Washburn, G.N.; Westers, H. Natural Coloration of Trout Using Xanthophylls. Trans. Am. Fish. Soc. 1966, 95, 408–414. [Google Scholar] [CrossRef]
  52. Young, J.A.; Smith, A.P.; Muir, J.F. Market analysis using Multiple Correspondence Analysis: The case of consumer acceptance of African catfish, Clarias gariepinus (Burchell, 1822). Aquac. Res. 1996, 27, 283–291. [Google Scholar] [CrossRef]
  53. Jäger, G.-L. Entwicklung einer Marketing-Konzeption für Süßwasserfische aus Warmwasser-Kreislaufanlagen: Dargestellt am Beispiel Afrikanischer Wels. Ph.D. Thesis, Universität Göttingen, Göttingen, Germany, 1991. [Google Scholar]
  54. Li, Y.; Liu, S.; Cline, D.; Chen, S.; Wang, Y.; Bell, L.N. Chemical treatments for reducing the yellow discoloration of channel catfish (Ictalurus punctatus) fillets. J. Food Sci. 2013, 78, S1609–S1613. [Google Scholar] [CrossRef]
  55. Larsson, T.; Koppang, E.O.; Espe, M.; Terjesen, B.F.; Krasnov, A.; Moreno, H.M.; Rørvik, K.-A.; Thomassen, M.; Mørkøre, T. Fillet quality and health of Atlantic salmon (Salmo salar L.) fed a diet supplemented with glutamate. Aquaculture 2014, 426–427, 288–295. [Google Scholar] [CrossRef]
  56. Morkore, T.; Einen, O. Relating Sensory and Instrumental Texture Analyses of Atlantic Salmon. J. Food Sci. 2003, 68, 1492–1497. [Google Scholar] [CrossRef]
  57. Solomon, R.J. Proximate Analysis and Nutritional Value of African Catfish (Clarias gariepinus) Fed with Local (Telferia occidentales and Moringa olefera) and Industrial Feed (Coppens). J. Fish. Livest. Prod. 2018, 6, 1–6. [Google Scholar] [CrossRef]
  58. Chukwu, O.; Shaba, M.I. Effects of Drying Methods on Proximate Compositions of Catfish (Clarias gariepinus). World J. Agric. Sci. 2009, 5, 114–116. [Google Scholar]
  59. Akpambang, V.O.E. Proximate composition of some tropical fish species. Chem. Sin. 2015, 6, 125–129. [Google Scholar]
  60. Rosa, R.; Bandarra, N.M.; Nunes, M.L. Nutritional quality of African catfish Clarias gariepinus (Burchell 1822): A positive criterion for the future development of the European production of Siluroidei. Int. J. Food. Sci. Technol. 2007, 42, 342–351. [Google Scholar] [CrossRef]
  61. Offer, G.; Knight, P.; Jeacocke, R.; Almond, R.; Cousins, T.; Elsey, J.; Parsons, N.; Sharp, A.; Starr, R.; Purslow, P. The Structural Basis of the Water-Holding, Appearance and Toughness of Meat and Meat Products. Food Struct. 1989, 8, 151–170. [Google Scholar]
  62. Wedekind, H. Untersuchungen zur Produktqualität Afrikanischer Welse (Clarias gariepinus) in Abhängigkeit von genetischer Herkunft, Fütterung, Geschlecht und Schlachtalter. Ph.D. Thesis, Universität Göttingen, Göttingen, Germany, 1991. [Google Scholar]
  63. Palmegiano, G.B.; Agradi, E.; Forneris, G.; Gai, F.; Gasco, L.; Rigamonti, E.; Sicuro, B.; Zoccarato, I. Spirulina as a nutrient source in diets for growing sturgeon (Acipenser baeri). Aquac. Res. 2005, 36, 188–195. [Google Scholar] [CrossRef]
  64. Chainapong, T.; Traichaiyaporn, S.; Deming, R.L. Effect of dietary spirulina platensis on the fatty acid composition in flesh and ovary of walking catfish (Clarias macrocephalus). Chiang Mai J. Sci. 2018, 45, 129–135. [Google Scholar]
  65. Oboh, A.; Betancor, M.B.; Tocher, D.R.; Monroig, O. Biosynthesis of long-chain polyunsaturated fatty acids in the African catfish Clarias gariepinus: Molecular cloning and functional characterisation of fatty acyl desaturase (fads2) and elongase (elovl2) cDNAs7. Aquaculture 2016, 462, 70–79. [Google Scholar] [CrossRef]
  66. Passi, S.; Cataudella, S.; Di Marco, P.; de Simone, F.; Rastrelli, L. Fatty acid composition and antioxidant levels in muscle tissue of different Mediterranean marine species of fish and shellfish. J. Agric. Food Chem. 2002, 50, 7314–7322. [Google Scholar] [CrossRef] [PubMed]
  67. Elvevoll, E.O.; James, D.G. Potential benefits of fish for maternal, foetal and neonatal nutrition: A review of the literature. Food Nutr. Agric. 2000, 27, 28–39. [Google Scholar]
Figure 1. Skin and fillet of FM100 and SP100-fed fish after 10 weeks of experimental feeding: (a,b) skin and fillet of a fish fed the FM100 diet; (c,d) fillet and skin of a fish fed SP100 diet.
Sustainability 13 08726 g001
Figure 2. Raincloud plot of body weight and approximate food conversion ratio (FCR) for experimental groups FM100 (gray, n = 60) and SP100 (green, n = 60) after 10 weeks. Upper histograms show the distribution of data and boxplot with each value for every individual measurement.
Sustainability 13 08726 g002
Figure 3. Most frequent fatty acids (%) in fish muscle of FM100 (n = 20) and SP100 (n = 20). SFA: saturated fatty acid, MUFA: monounsaturated fatty acid, PUFA: polyunsaturated fatty acid, N6: sum of omega-6 fatty acids, N3: sum of omega-3 fatty acids. N6N3: ratio N6: N3. The values are means ± SD. p-values were calculated by Welch t-test (* p < 0.05, ** p < 0.01, *** p < 0.01).
Sustainability 13 08726 g003
Figure 4. PCA biplot of weight, length, carcass weight, FCR, skin and filet color parameters, color stability (delta values), cooking loss and fatty acids for FM100 (n = 20) and SP100 (n = 20). Individual values are shown as gray points for FM100 and green triangles for SP100 group.
Sustainability 13 08726 g004
Table 1. Feed ingredients of FM100 and SP100 diets.
Ingredient (% Dry Matter)FM100SP100
Fishmeal 120.000.00
Spirulina 20.0020.00
Fish oil10.7010.70
Wheat meal14.0012.50
Wheat gluten20.0021.50
Soy protein concentrate 320.0020.00
Rapeseed oil10.7010.70
Vit./min. premix1.001.00
CaHPO41.001.00
CMC (Binder)1.291.08
TiO2 (Marker)0.500.50
Fe3O4—black (dye)0.070.07
L-Lysin (HCL-Lys, 78% Lys)0.700.90
D,L-Methionine0.010.04
L-Tryptophan0.030.01
1 Crude protein: 62% as is, 2 Crude protein: 63% as is, 3 Crude protein: 67% as is.
Table 2. Approximate composition (% fresh matter) of FM100 and SP100 diets.
Approximate Composition (%)FM100SP100
Dry matter94.694.0
Crude protein (Nx6.25)45.445.7
Crude lipids24.623.9
N-free extracts17.519.0
Crude ash7.15.4
Gross energy [MJ/kg]23.423.5
Digestible energy [MJ/kg]20.020.0
Table 3. Color parameters of skin, and raw and cooked fillet in FM100 (n = 51) and SP100 (n = 51).
Skin (Dorsal Back Muscle)
DietL*a*b*C*
FM10030.42 ± 4.921.17 ± 0.461.97 ± 1.422.40 ± 1.2967.29 ± 63.92
SP10029.81 ± 4.630.77 ± 0.464.18 ± 2.044.30 ± 2.0078.14 ± 17.43
p-Value0.455<0.001<0.001<0.0010.091
Skin (Abdomen)
DietL*a*b*C*
FM10071.19 ± 8.281.56 ± 1.742.49 ± 2.533.53 ± 2.37107.89 ± 100.11
SP10068.60 ± 7.450.61 ± 2.3511.25 ± 3.9511.46 ± 4.0987.34 ± 10.46
p-Value0.0580.002<0.001<0.0010.056
Raw Fillet
DietL*a*b*C*
FM10048.66 ± 5.050.35 ± 1.699.15 ± 2.259.32 ± 2.2389.90 ± 13.58
SP10047.98 ± 5.522.32 ± 2.1713.17 ± 3.5513.52 ± 3.6682.00 ± 11.83
p-Value0.247<0.001<0.001<0.001<0.001
Cooked Fillet
DietΔL*Δa*Δb*ΔC*Δh°
FM10024.36 ± 3.682.22 ± 1.288.34 ± 2.617.83 ± 2.4116.58 ± 8.65
SP10024.19 ± 3.371.80 ± 1.098.83 ± 2.968.81 ± 2.967.19 ± 4.17
p-Value0.6900.0030.1420.037<0.001
Values are means ± SD. p-values were calculated by Welch t-test. L* (+ = lighter, − = darker), a* (+ = redder, − = greener), b* (+ = yellower, − = bluer), C* (+ = brighter, − = duller), h° (hue angle).
Publisher’s Note: MDPI stays neutral with regard to jurisdictional claims in published maps and institutional affiliations.

