
Superposed Natural Hazards and Pandemics: Breaking Dams, Floods, and COVID-19


Abstract
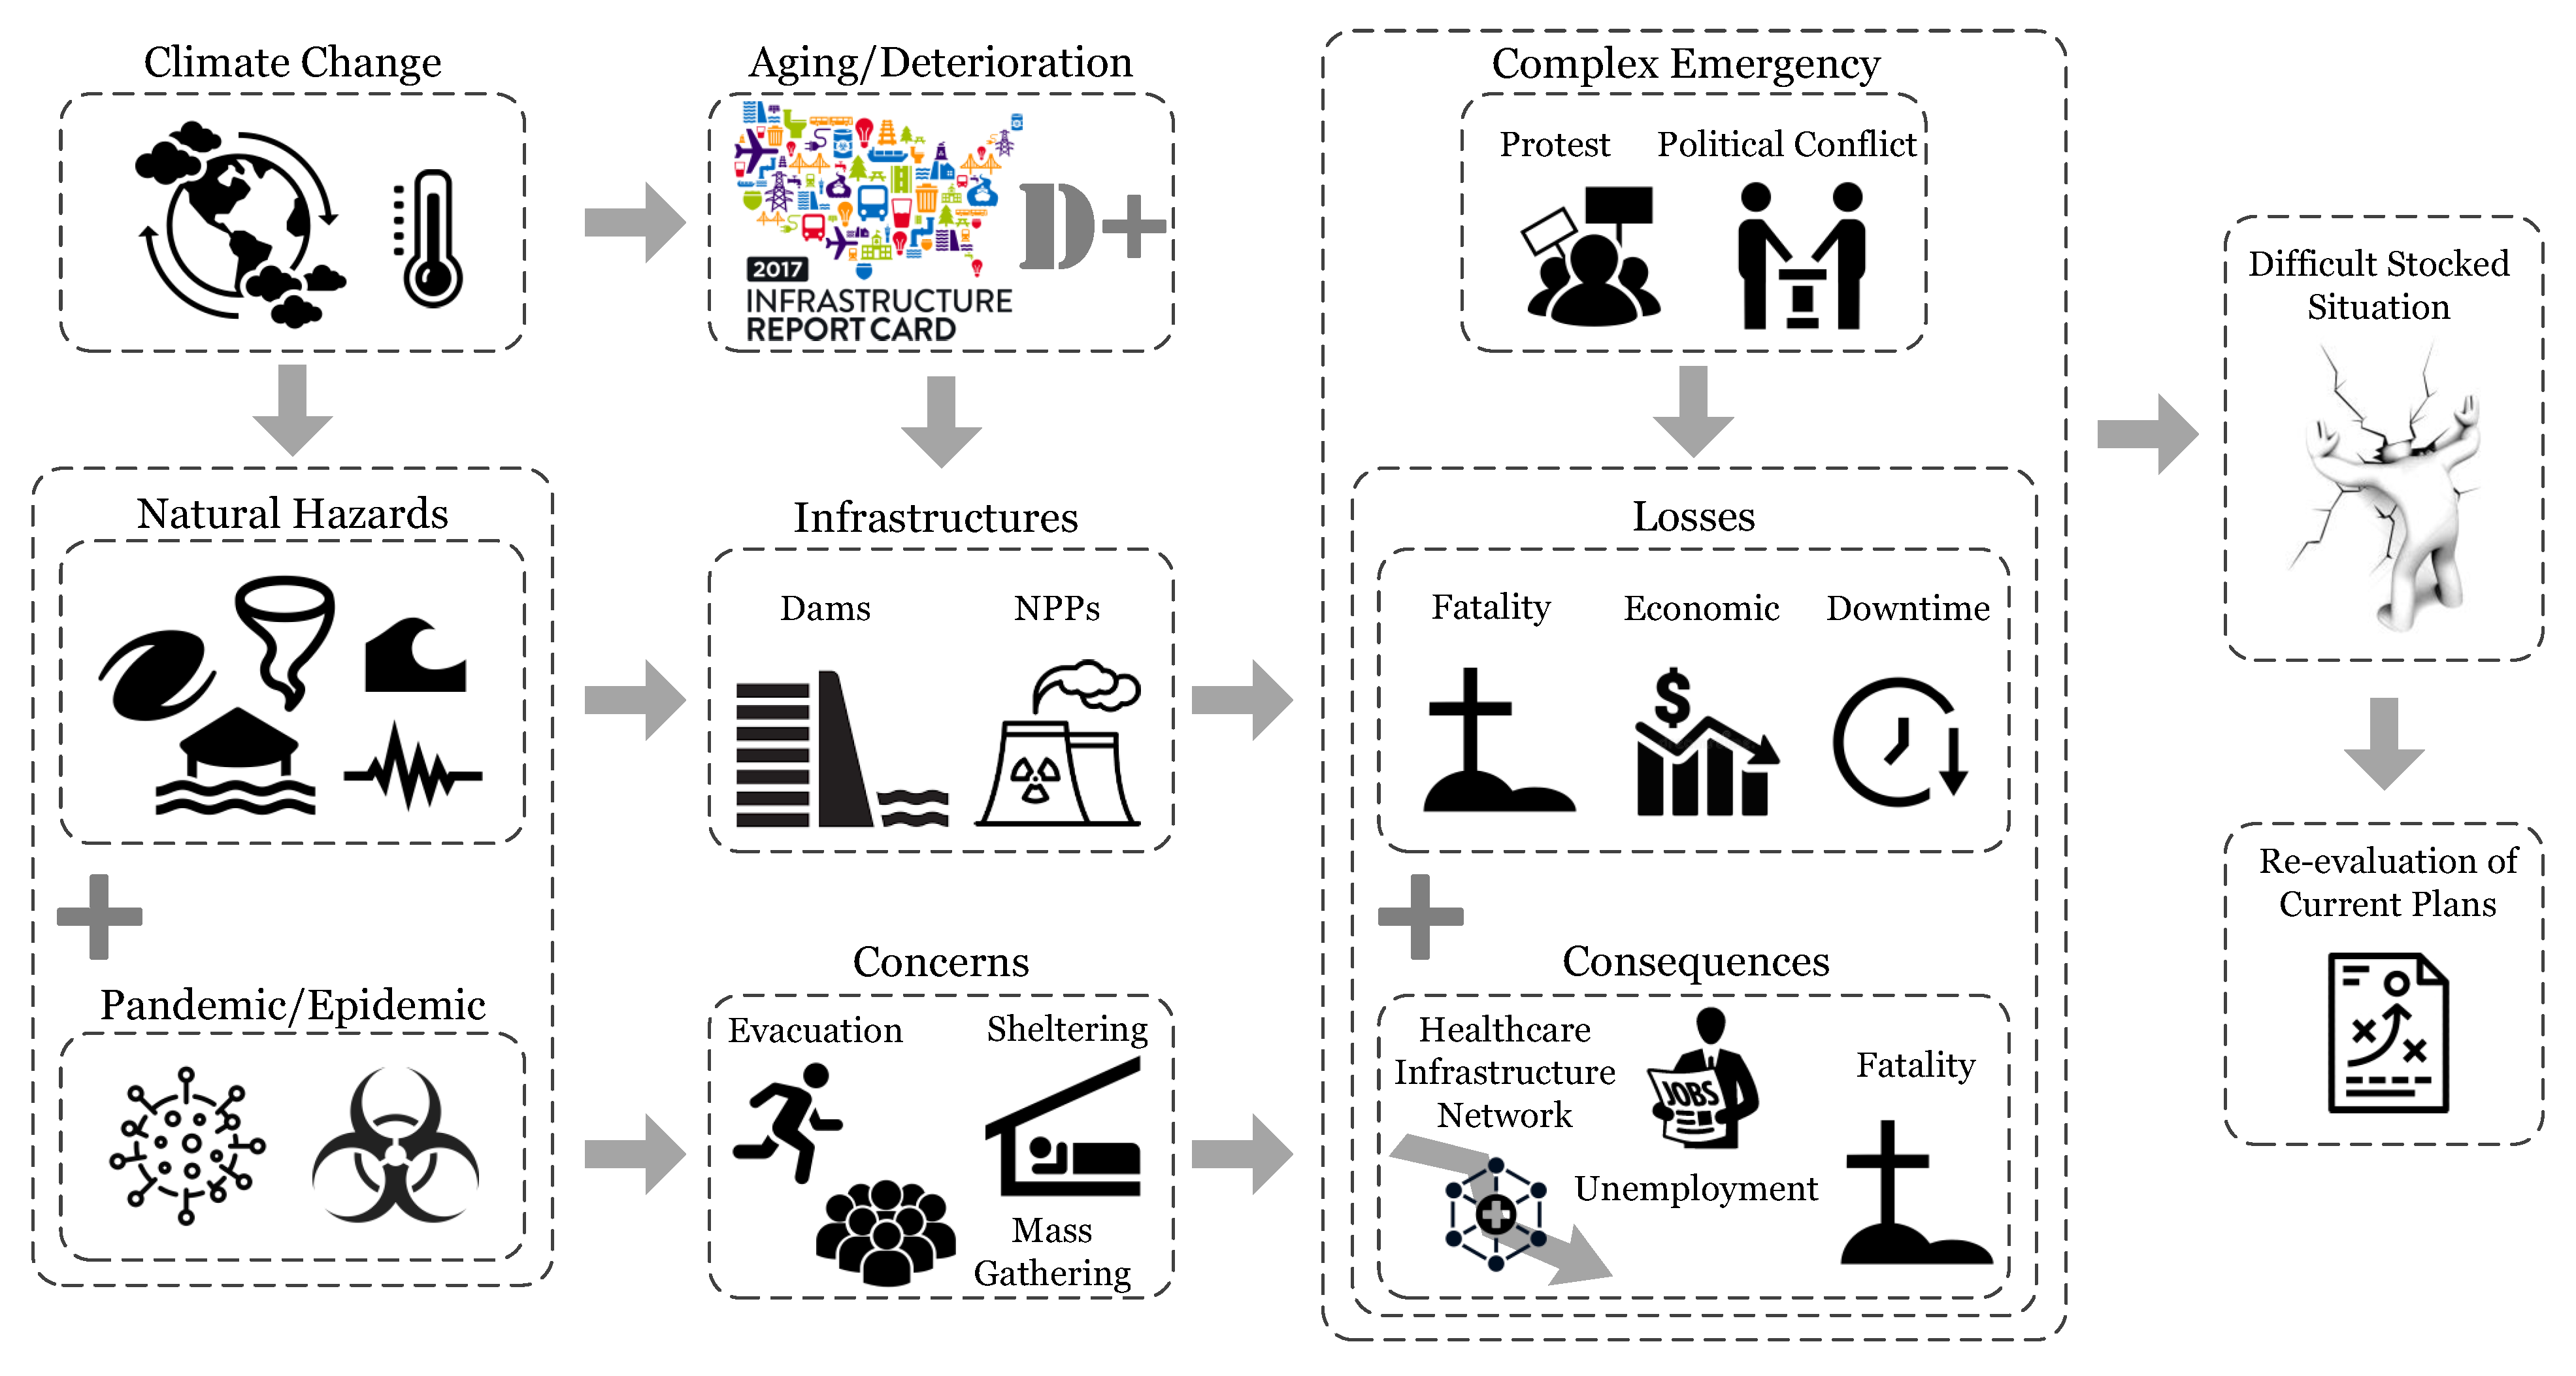
:1. Introduction
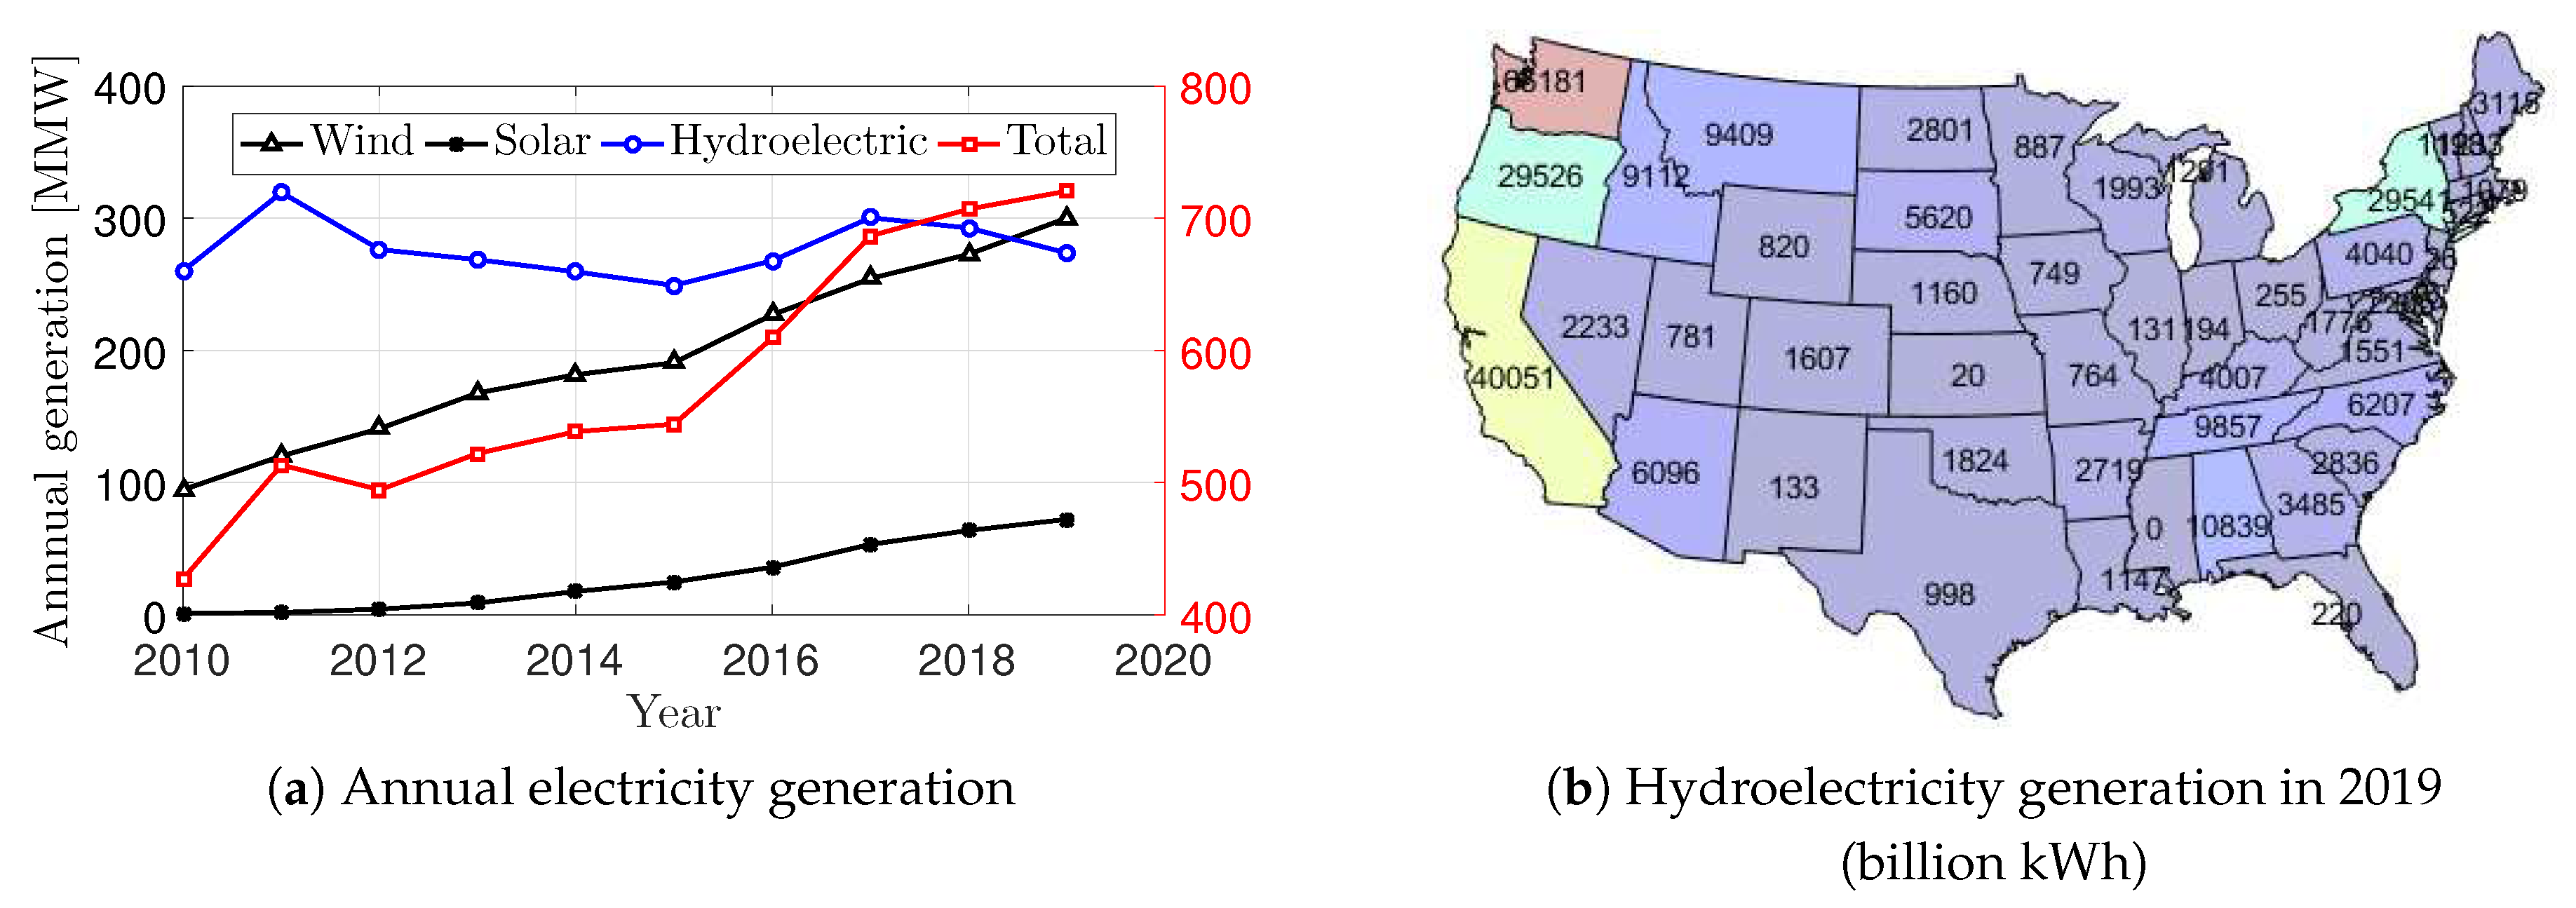
2. Dams and Hydropower in the Era of COVID-19
2.1. Hydropower and COVID-19
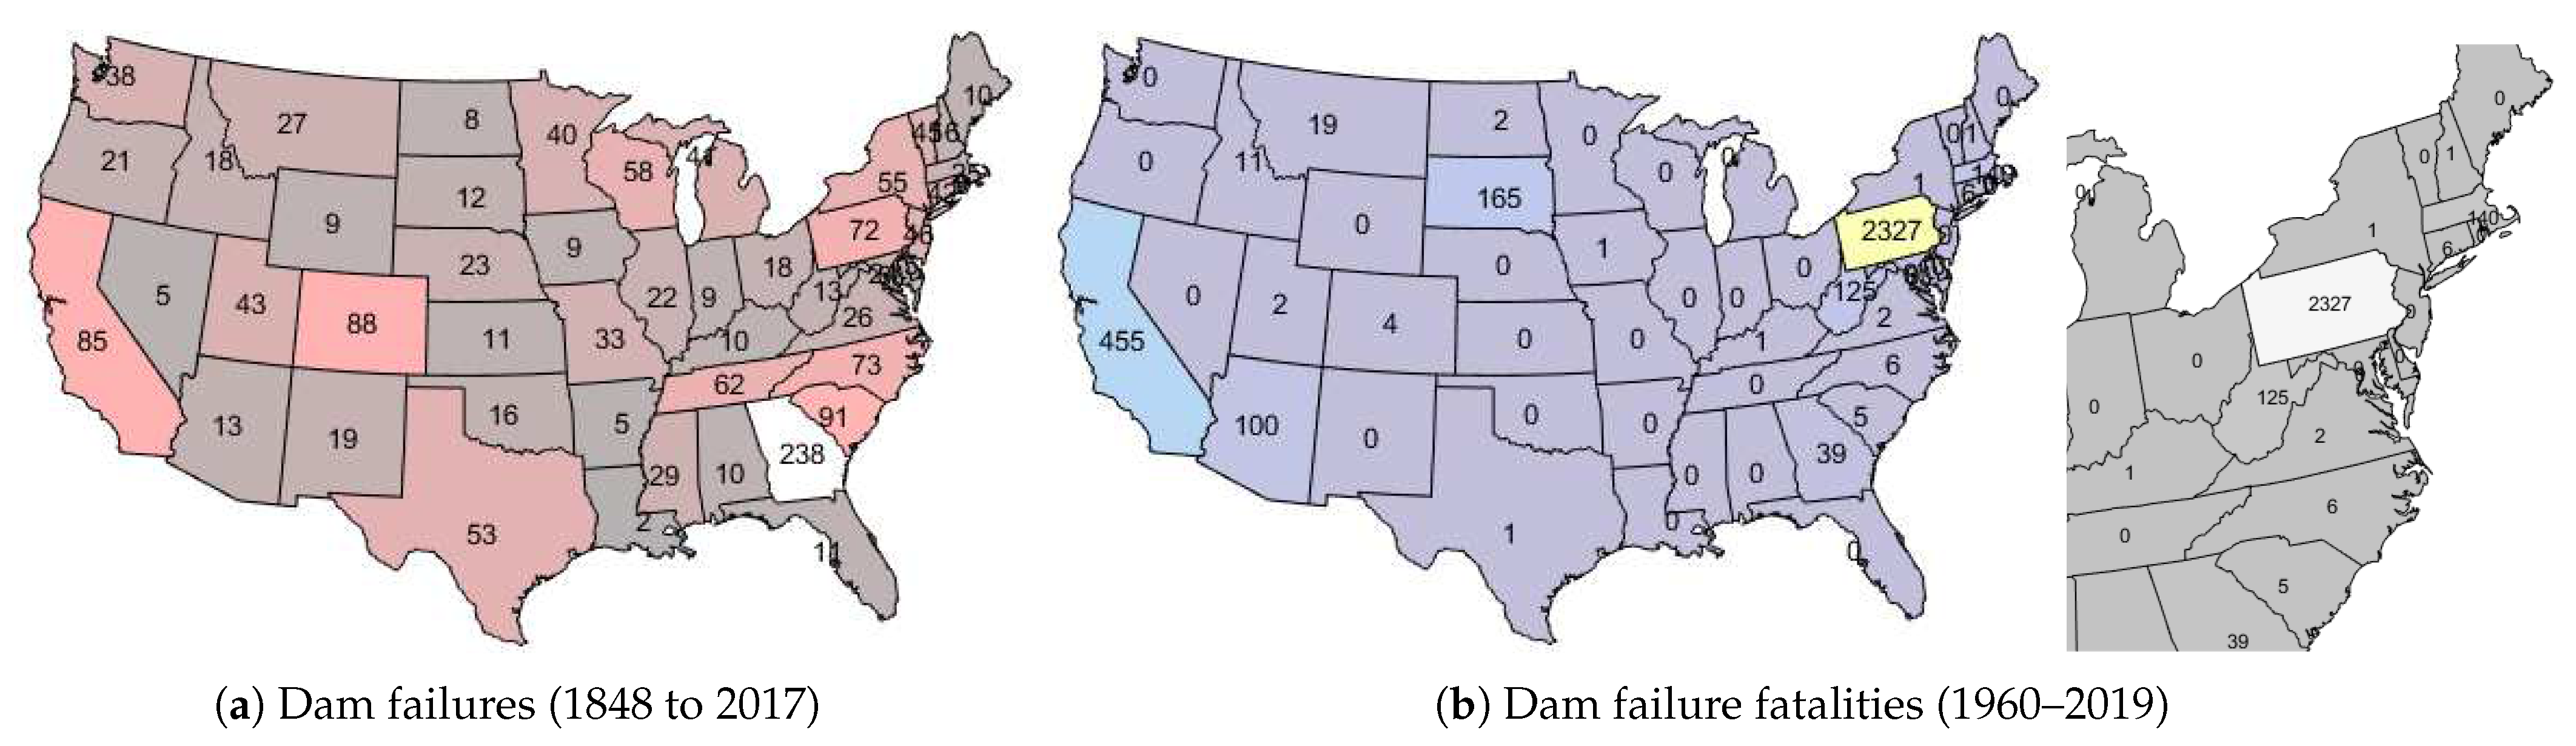
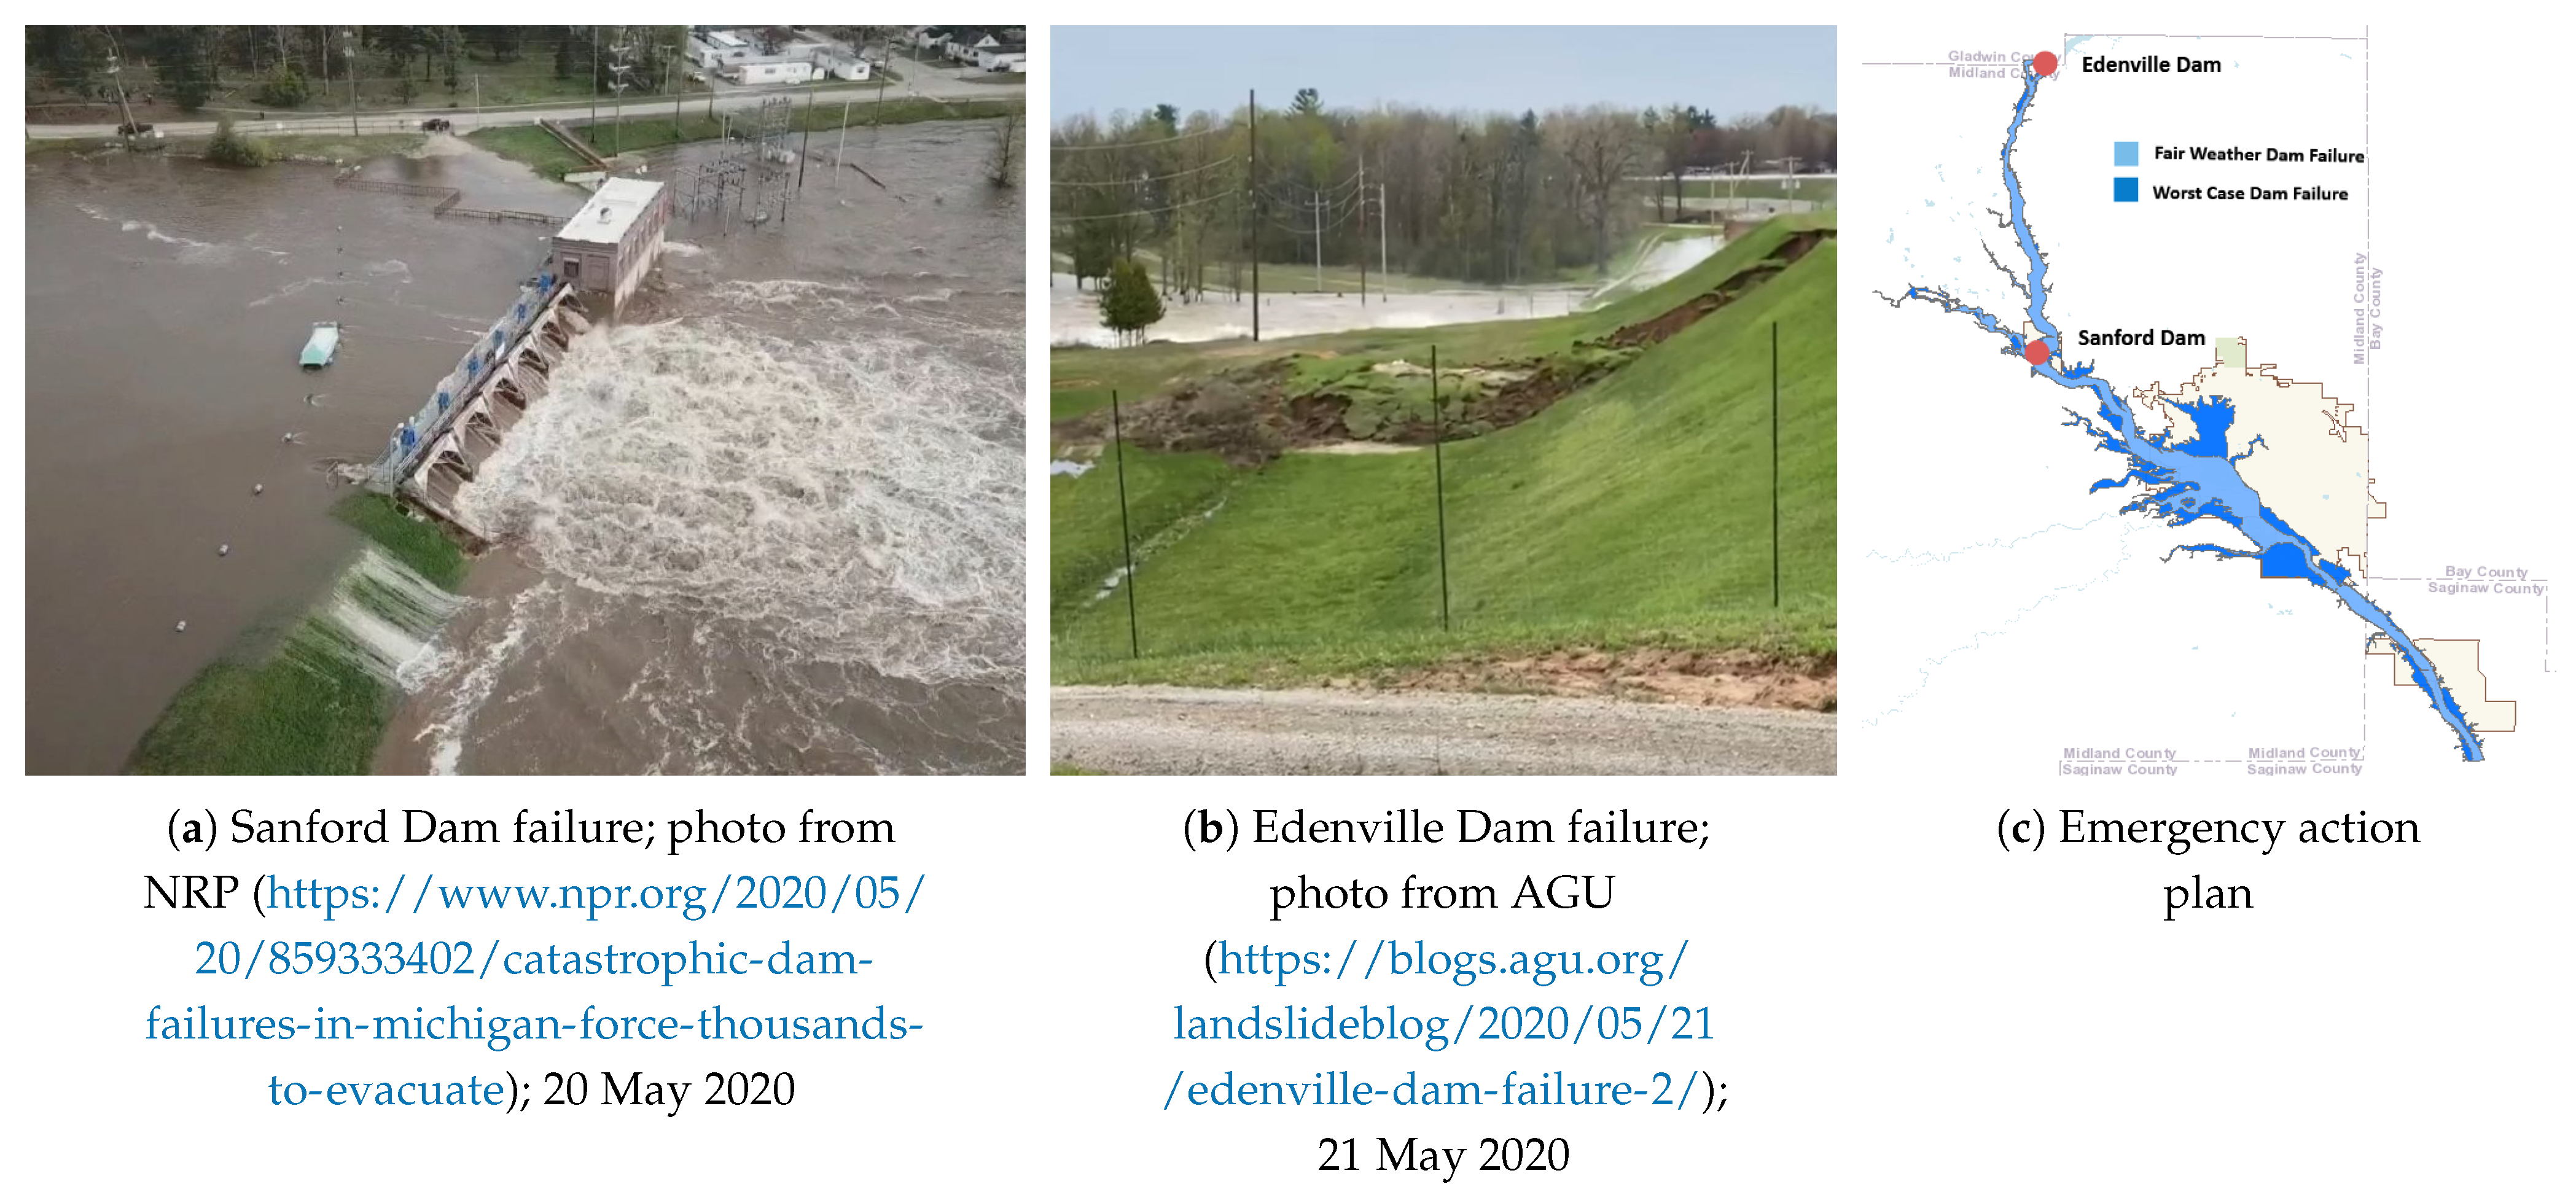
2.2. Dam Failure: Case Histories and Recent Events
- Mill River Dam (Massachusetts, 1874), Age at failure: 9, Lives lost: 138
- South Fork Dam (Pennsylvania, 1889), Age at failure: 36, Lives lost: 2209
- Walnut Grove Dam (Arizona, 1890), Age at failure: 2, Lives lost: 70–100
- Austin Dam (Pennsylvania, 1911), Age at failure: 2, Lives lost: 78
- Lower Otay (California, 1916), Age at failure: 19, Lives lost: 30
- St. Francis Dam (California, 1928), Age at failure: 2, Lives lost: 420
- Buffalo Creek Coal Waste Dam (West Virginia, 1972), Age at failure: 0, Lives lost: 125
- Canyon Lake Dam (South Dakota, 1972), Age at failure: 39, Lives lost: 474
- Laurel Run Dam (Pennsylvania, 1977), Age at failure: 63, Lives lost: 40
- Kelly Barnes Dam (Georgia, 1977), Age at failure: 78, Lives lost: 39
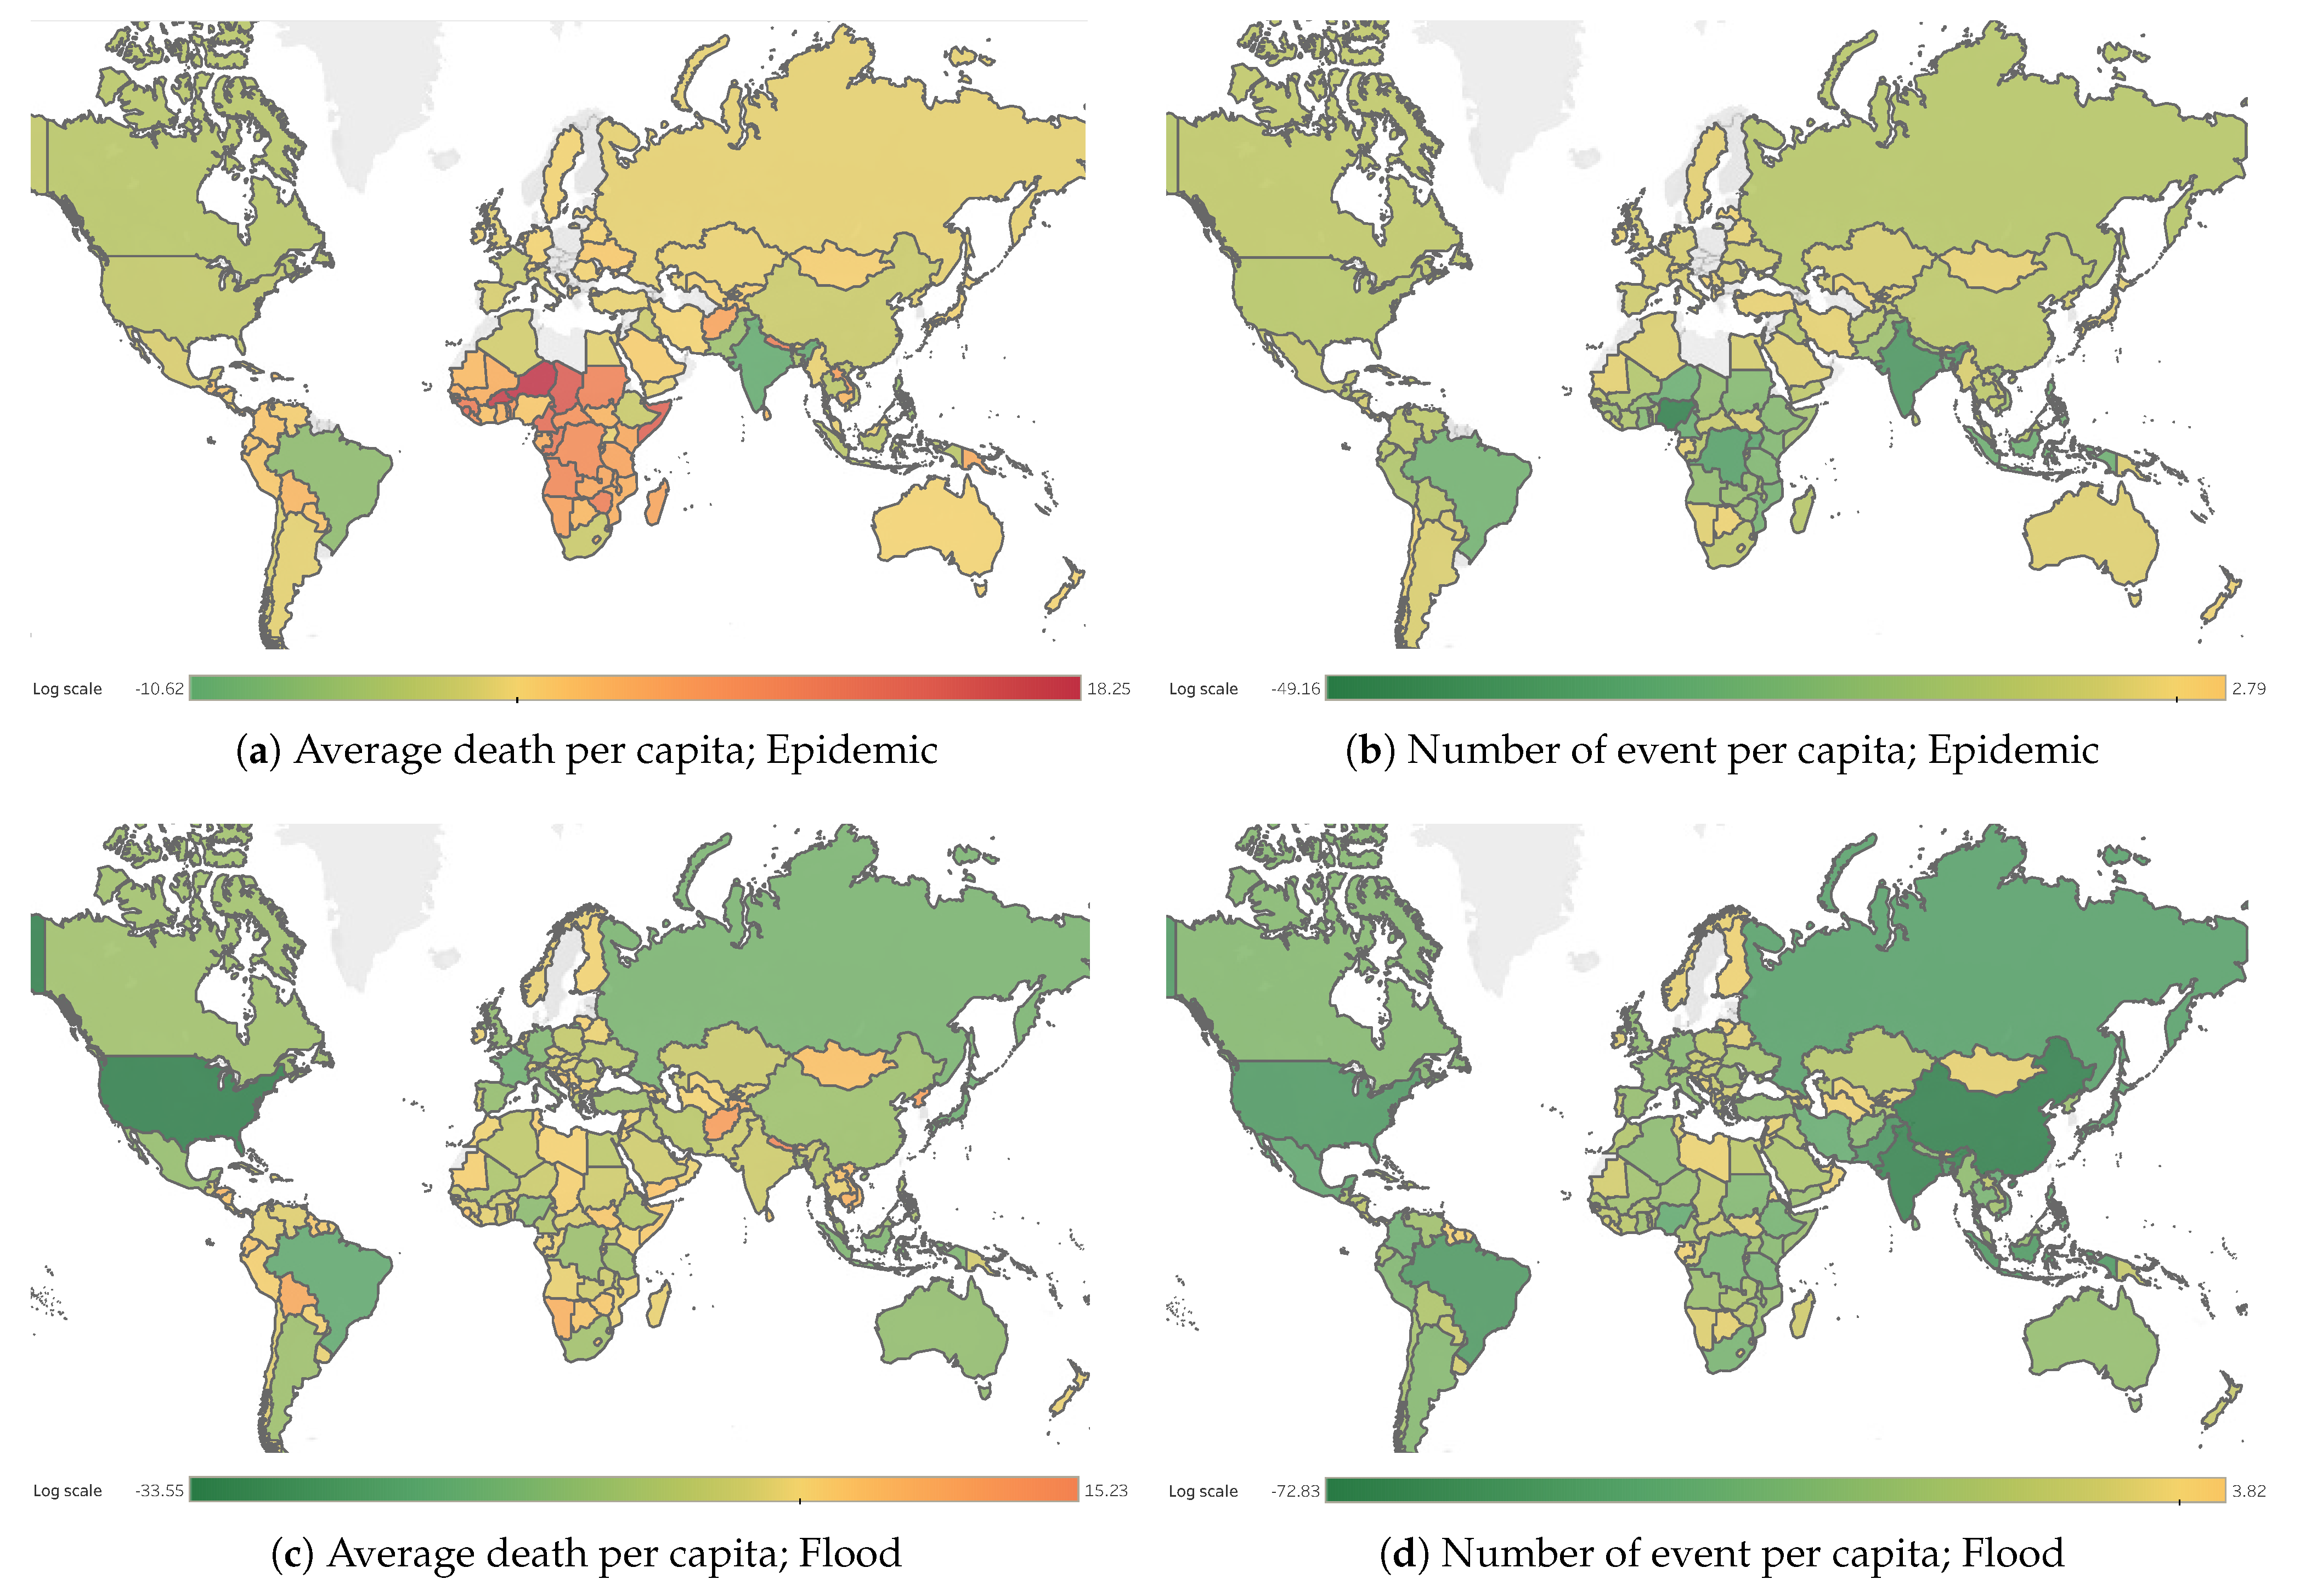
2.3. Pandemic and Flooding: Worldwide Experience
2.4. Pandemic and Other Natural Hazards: Worldwide Experience
- Occurs when a devastating natural hazard (e.g., flood, earthquake, hurricane) damages the fundamentals of health care system and consequently causes an outbreak in that region or country, i.e., an epidemic after a natural hazard event [44]. Here are a few examples of this kind of “double trouble”:
- –
- –
- The 2010 magnitude 7.0 earthquake in Haiti caused about 200,000 fatalities and displaced about 1.5 million people [47]. It severely damaged the public health system and created an environment for potential outbreaks of infectious diseases [48]. About nine months later, a cholera outbreak began to spread across the country, killing about 8000 and infecting about 650,000 others. Prior to this devastating earthquake in 2010, there was no history of cholera in Haiti.
- Occurs when a natural hazard (not necessarily a devastating one) transpires during a pandemic outbreak. This may have an adverse effect on emergency resources, reducing the capability of the health system to help people and intensifying the spread of the infection through any means (e.g., evacuations into communal centers). We will focus on this category. Examples include:
- –
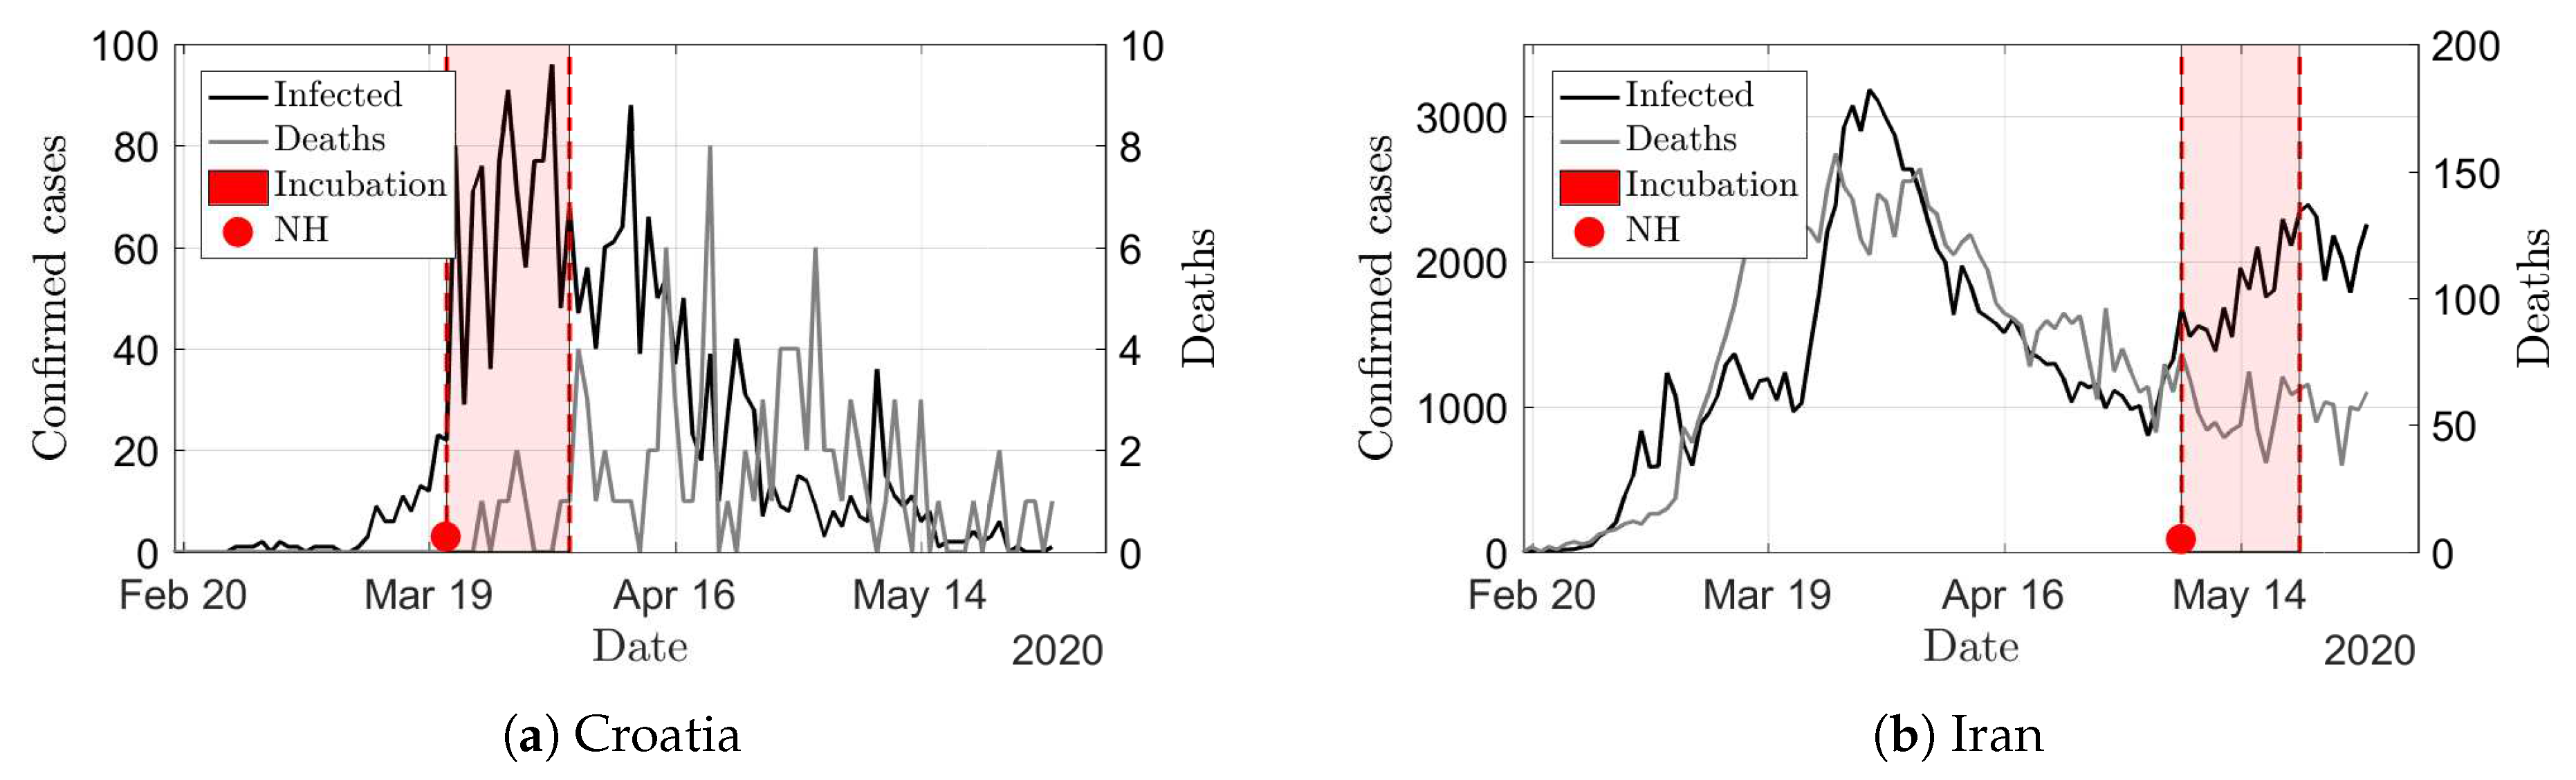
- On 22 March 2020, an early morning earthquake with a moment magnitude of 5.3 hit the city Zagreb, Croatia [49]. The main shock was followed by numerous aftershocks, the strongest of which had a magnitude of 5.0 [50]. This resulted in one fatality, 27 injured, about 6200 damaged buildings, and over 1900 buildings became uninhabitable. COVID-19 testing was disrupted for hours in hospitals. While officials urged citizens, who left their homes, to keep socially distancing, some Zagreb residents disagreed with the order. “Earthquakes are more important than the coronavirus. If the earthquake hits, and you are under a door, you worry about yourself first and then the mask later,” a man told a local TV station (See the Link, https://www.abc.net.au/news/2020-03-23/coronavirus-lockdown-zagreb-hampered-earthquake/12080066). The earthquake caused a widespread panic making people leave their homes in hundreds of thousands, gravely compromising imposed social distancing [51].
- –
- An early morning magnitude 5.1 earthquake hit Tehran, Iran, on 7 May 2020. The strongest aftershock had a magnitude of 3.9. At least two people died and about 38 were injured, though luckily there was no other major damage. According to the Reuters (https://www.reuters.com/article/us-iran-quake-casualties/moderate-iran-quake-kills-two-draws-many-into-tehran-streets-idUSKBN22K0LW), officials urged people, some of whom spent the night outdoors for fear of aftershocks, to observe the social distancing mandated to prevent the spread of COVID-19.To date, there is no solid reporting on the direct impacts of earthquakes on the spread of COVID-19 in Croatia or Iran; however, overlapping the incident day, as well as the 14-day incubation period, with daily variations in infection cases presents some increasing trends, which may or may not be coincidental, Figure 8. This appears clearer for the situation in Iran, as new cases of COVID-19 spiked after the number of people infected had been on the decline, though this may have been due to a second wave of the virus.On the contrary, there are some reports that show minor impact of earthquake on the spread of COVID-19. Mavroulis et al. [52] post-processed publicly-available data on the daily reported laboratory-confirmed COVID-19 cases in Greece and correlated them with two earthquake events. They concluded that the impact of the Epirus earthquake (21 March 2020, magnitude 5.7) on the pandemic evolution in the northwestern part of Greece is negligible (only 2 out of 5 positive cases during post-earthquake period could be attributed to this shaking). They also found the impact of the Samos earthquake (30 October 2020, magnitude 6.9) on the COVID-19 speared in the eastern part of Greece is low (with only 12 reported positive cases). They did not find any relation between the 9 August 2020 Evia flood in the central Greece and increase in the number of COVID-19 cases.
- –
- Between 12 and 13 April 2020, dozens of tornadoes tore through several U.S. states in the South. Homes were obliterated, and there were 36 fatalities. Many had to move to shelters, but one family was turned away at the door of a tornado shelter in Crossville, Alabama because the hopeful entrants did not have enough face masks for every member in their family [4].
- –
- During August and September 2020, at least 35 people died in the U.S. West Coast wildfires, (24 in California, 10 in Oregon, and a child in Washington state), and tens of thousands were forced to evacuate their homes [53]. This implies COVID-19 related housing issues.
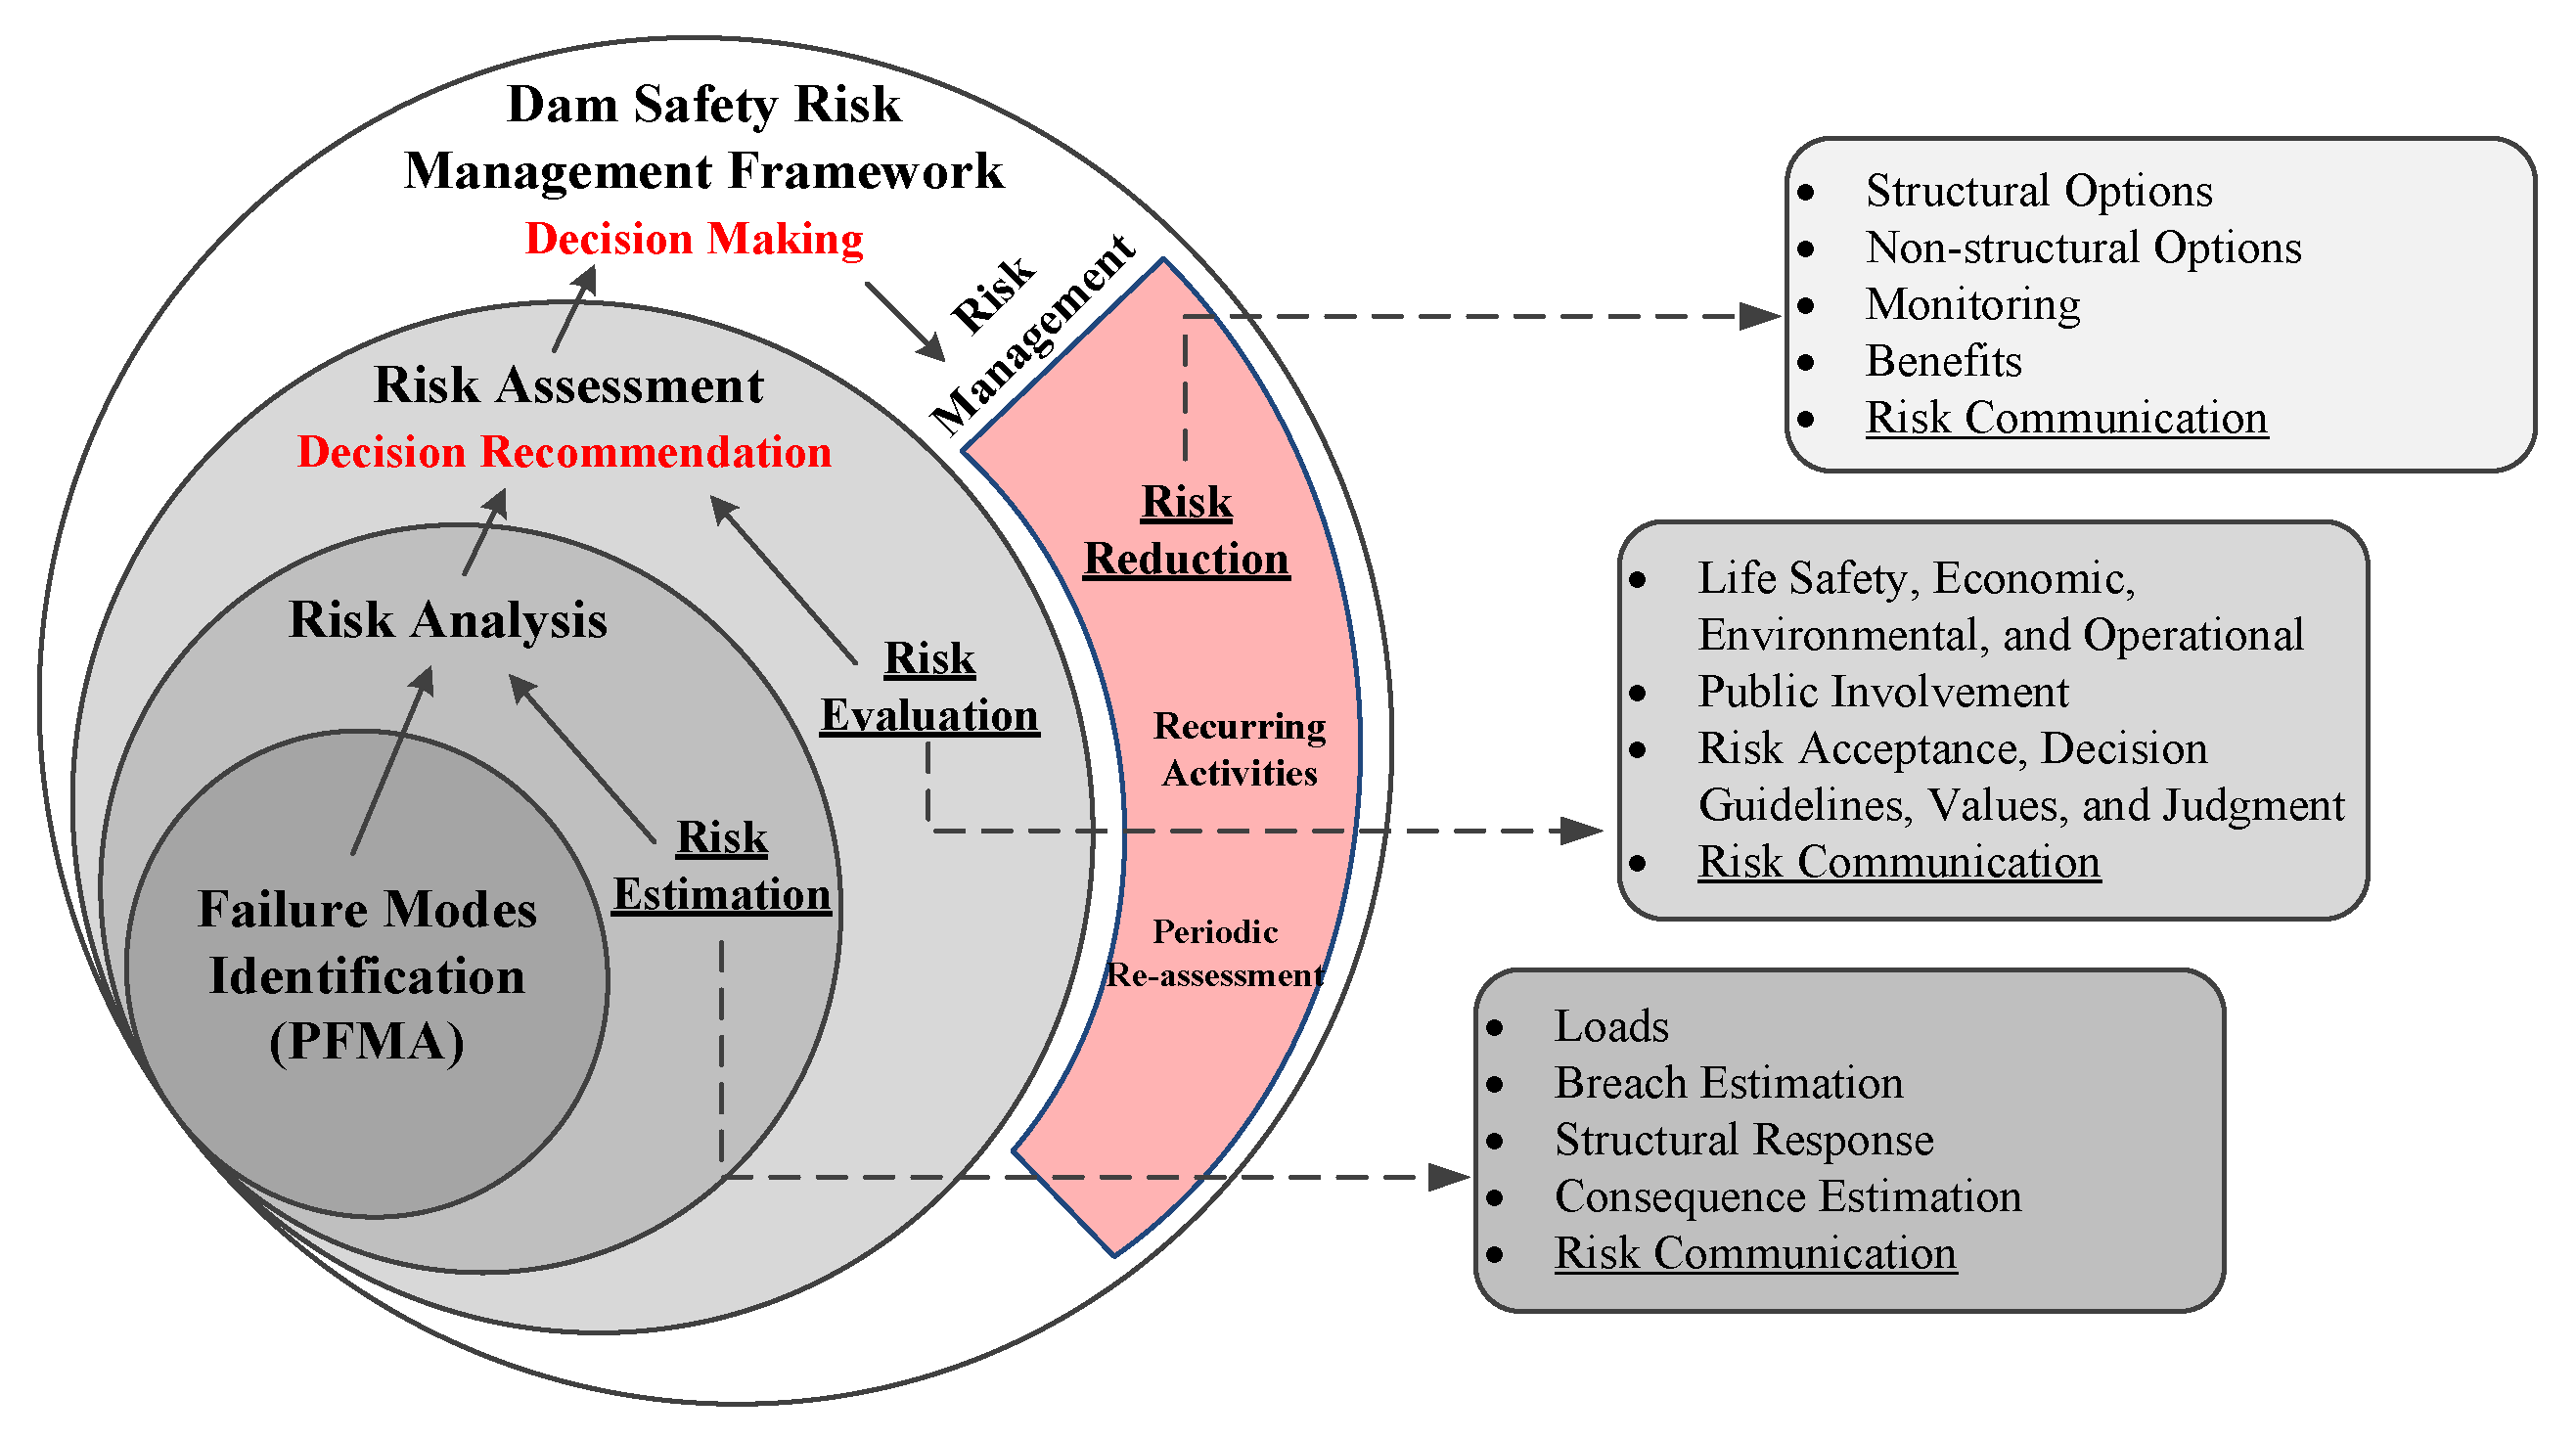
3. Risk Assessment and Emergency Management Frameworks
3.1. Classical Risk-Informed Decision Making
- The likelihood of occurrence of a load (e.g., flood).
- The likelihood of an adverse structural response (e.g., dam break) given the load.
- The magnitude of the consequences given the event (e.g., loss of life) that occurs.
- –
- Direct consequences are always estimated.
- –
- Indirect consequences (e.g., downtime, destruction of property, and the displacement of people) are also estimated, where possible, and can be incorporated into the risk estimates.
3.2. Pandemic-Centered Risk Assessment
- “Enhance leaders’ awareness on DRR in the pandemic.
- Integrate risk management of disasters and pandemics.
- Provide clean water, sanitation, and hygiene sustainably during and after disasters.
- Protect disaster risk management stakeholders from threat of COVID-19.
- Protect scarce medical resources from disaster impact.
- Protect disaster evacuees from threat of COVID-19.
- Protect COVID-19 patients from threat of disasters.
- Develop specialized evacuation guidance for cities and areas under COVID-19.
- Finance DRR actions under COVID-19 effectively to avoid economic catastrophe.
- Strengthen global solidarity and international cooperation to cope with these co-occurring challenges.”
- Integrate the concept of human security into new policy.
- Put a priority on protecting human life at evacuation centers and of disaster management staff.
- Focus on the vulnerable groups.
- Engage local organizations and communities.
- Risk communication with scientific knowledge.
- Coordinate with multiple sectors, in particular, water and health.
4. Elements of Classical Life Safety Risk
4.1. Loss of Life Models
- Breach factors: cause and type of failure (), breach location (), breach geometry (), and development rate ().
- Hydraulic factors: water depth (), flow velocity (), flood-rise rate (), wave (), water temperature (), flood duration (), debris in water (), flood severity ().
- Area and building factors: area topography (), area usage (), building type (), number of building story (), building quality (), roads (), traffic situation (), traffic tools ().
- Time and weather factors: warning time (), time of day (), time of week (), time of year (), holiday or festival (), weather ()
- Population factors: age (), gender (), physical state (), faith (), experience/knowledge of flood (), family relationship (), financial state (), population distribution (), human decision (), human behavior ().
4.2. Loss of Life Metrics
- Individual incremental life safety risk using probability of loss of life for the identifiable person or group by location that is most at risk of loss of life due to dam break. It is computed from all exposure conditions and all potential failure modes (PFMs) associated with all loading or initiating events.
- Societal incremental life safety risk:
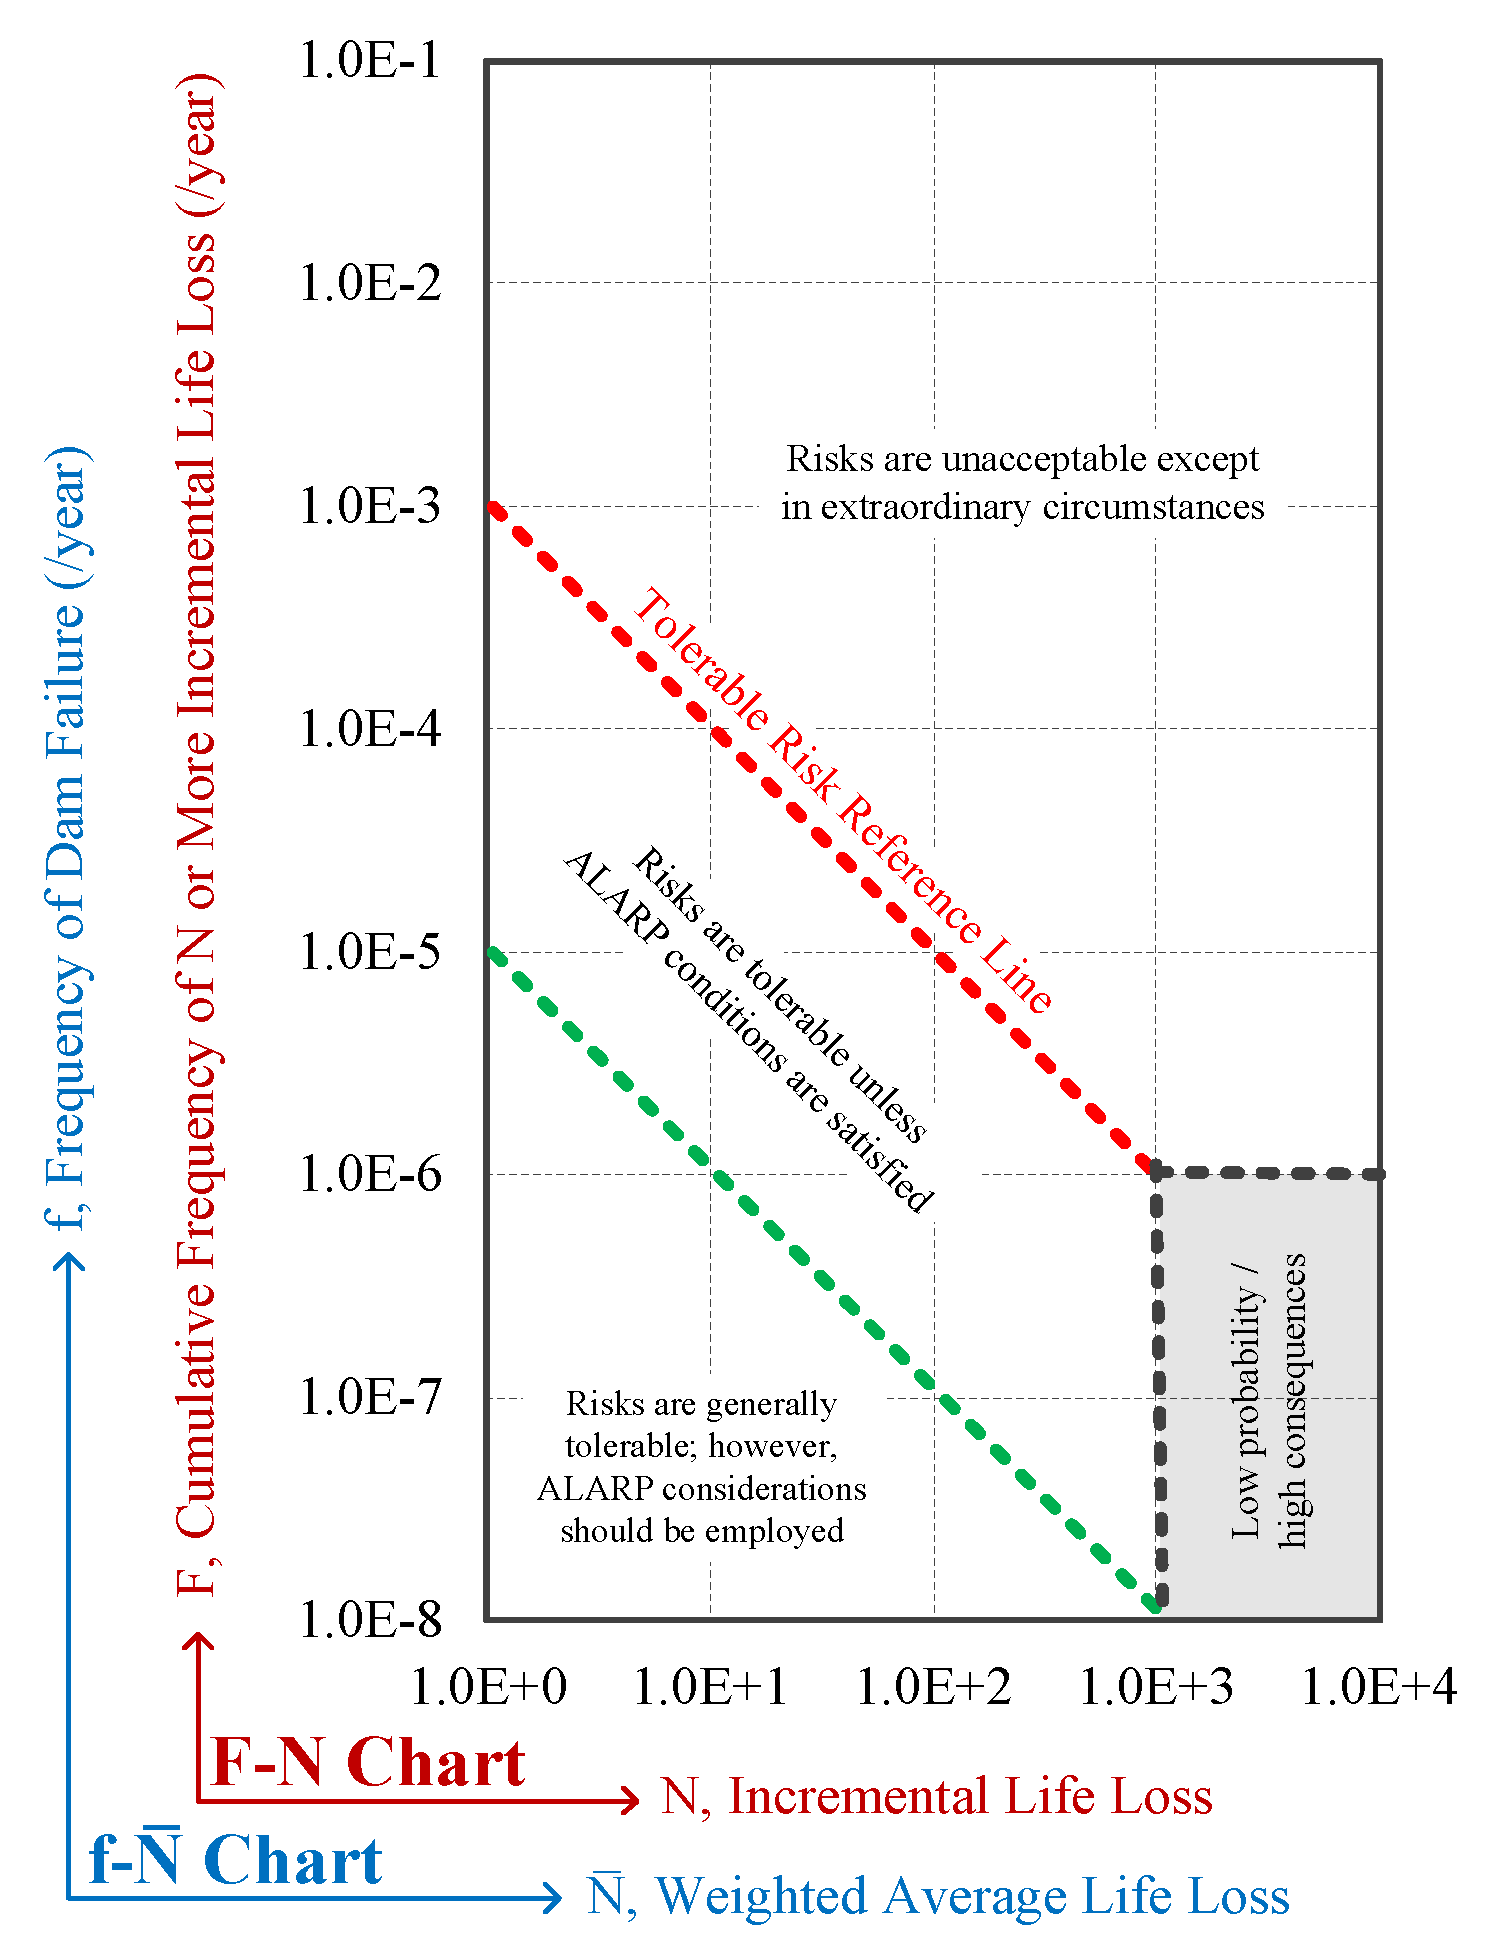
- Probability distribution of potential loss of life is represented by a probability distribution of the estimated annual probability of potential loss of life from dam failure for all loading types and conditions, all PFMs, and all population exposure scenarios.It is displayed in an F-N chart which is a plot of the cumulative frequency of incremental loss of life of N or more lives, F, vs. incremental loss of life, N, associated with the incremental flood risk, See Figure 12.
- Average annual life loss (AALL): The value of this metric for a dam should be estimated from all PFMs associated with all loading or initiating event types and considering all exposure conditions associated with loss of life. AALL is presented in an f-N chart. The estimated loss of life plotted on the horizontal scale is the weighted average incremental life loss, .
The non-breach life safety risk is also considered and plotted on the cumulative frequency distribution of potential loss of life (F-N) chart with the x-axis showing loss of life, N, from non-breach flood.
5. Pandemic as an Environmental Consequence
- The grief and loss suffered by relatives and friends of those who die.
- The impact of multiple deaths on the psyche of the community in which they lived.
- The stress involved in arranging alternative accommodations and income.
- The sense of loss by those who enjoyed the natural landscape, which is destroyed.
- The fear of lost status and reputation of the dam owning/regulating organization(s) and their technical staff.
- How might a flood occurrence affect the infection growth rate of COVID-19?
- How might the presence of COVID-19 adversely affect (i.e., increase) direct and indirect loss of life during a dam break flood?
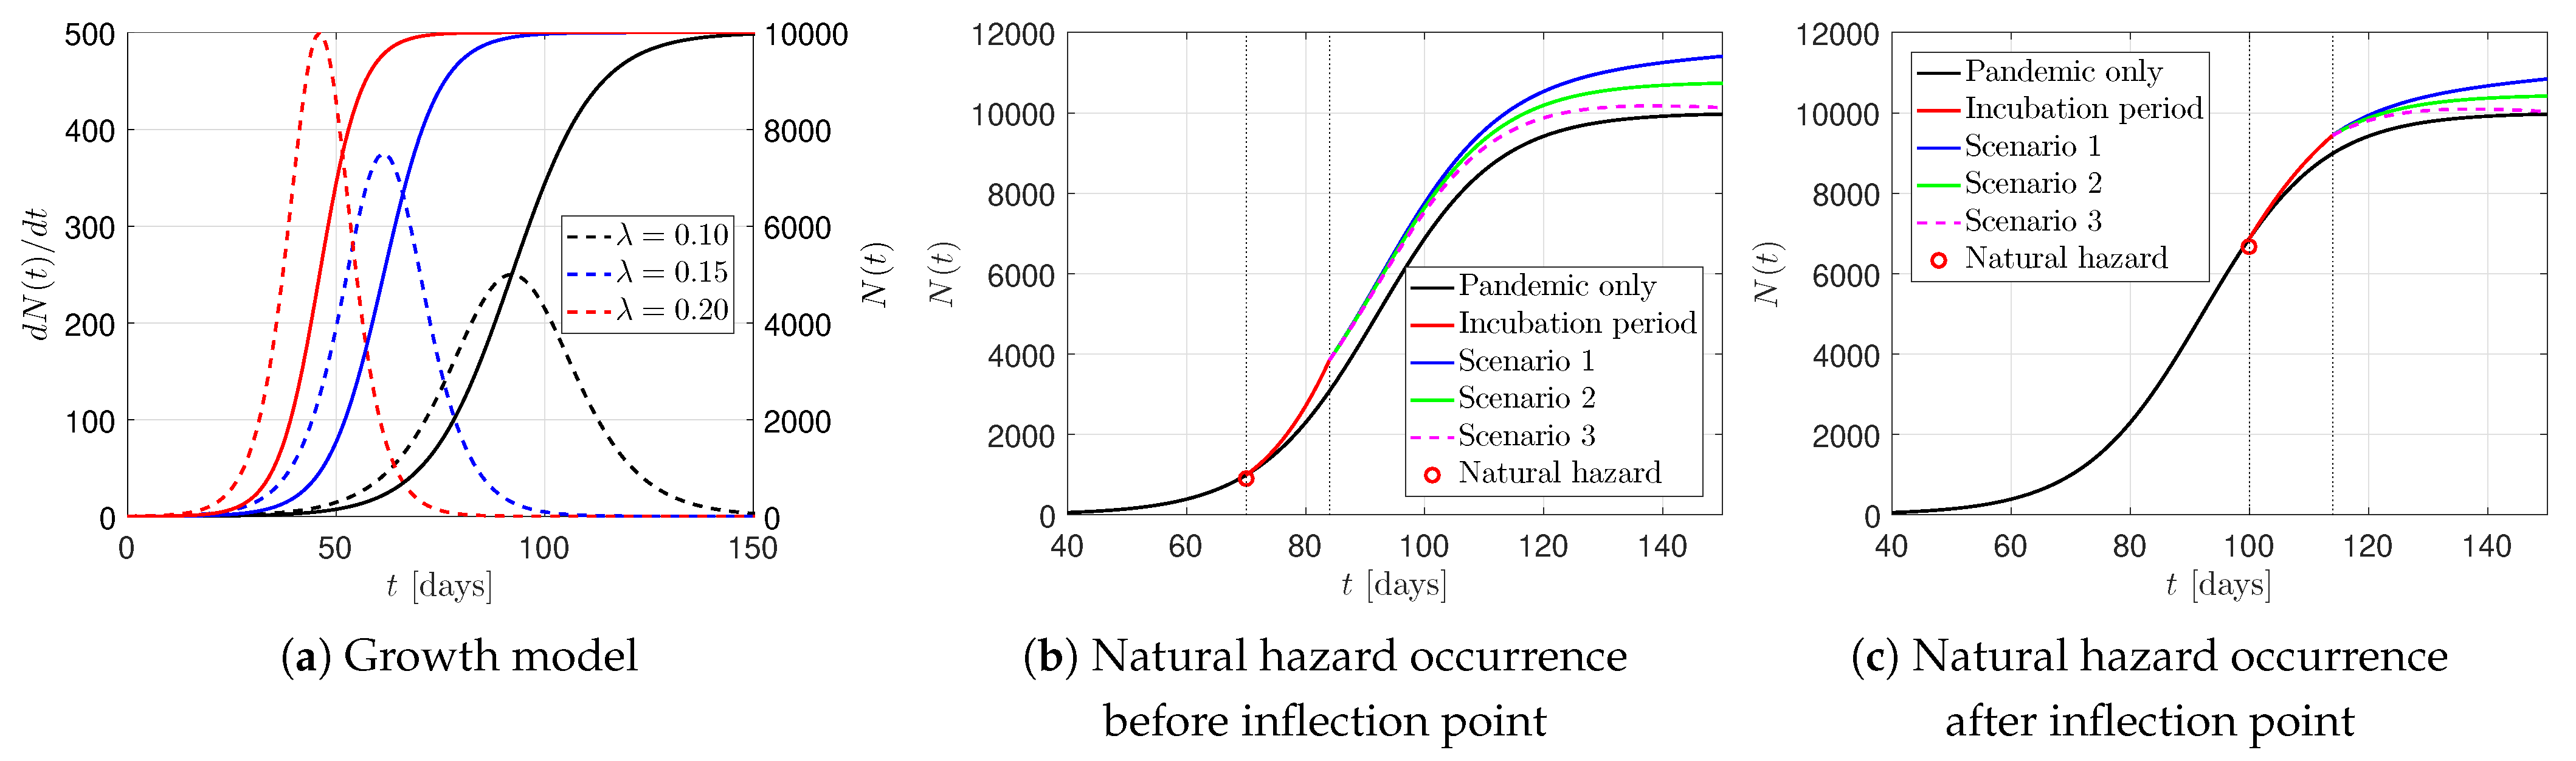
5.1. Impact of Natural Hazard on Pandemic Growth Rate
- We focus only on one “base case” (i.e., ), and we call it the “pandemic only” scenario. It is assumed that no natural hazard occurs in this scenario.
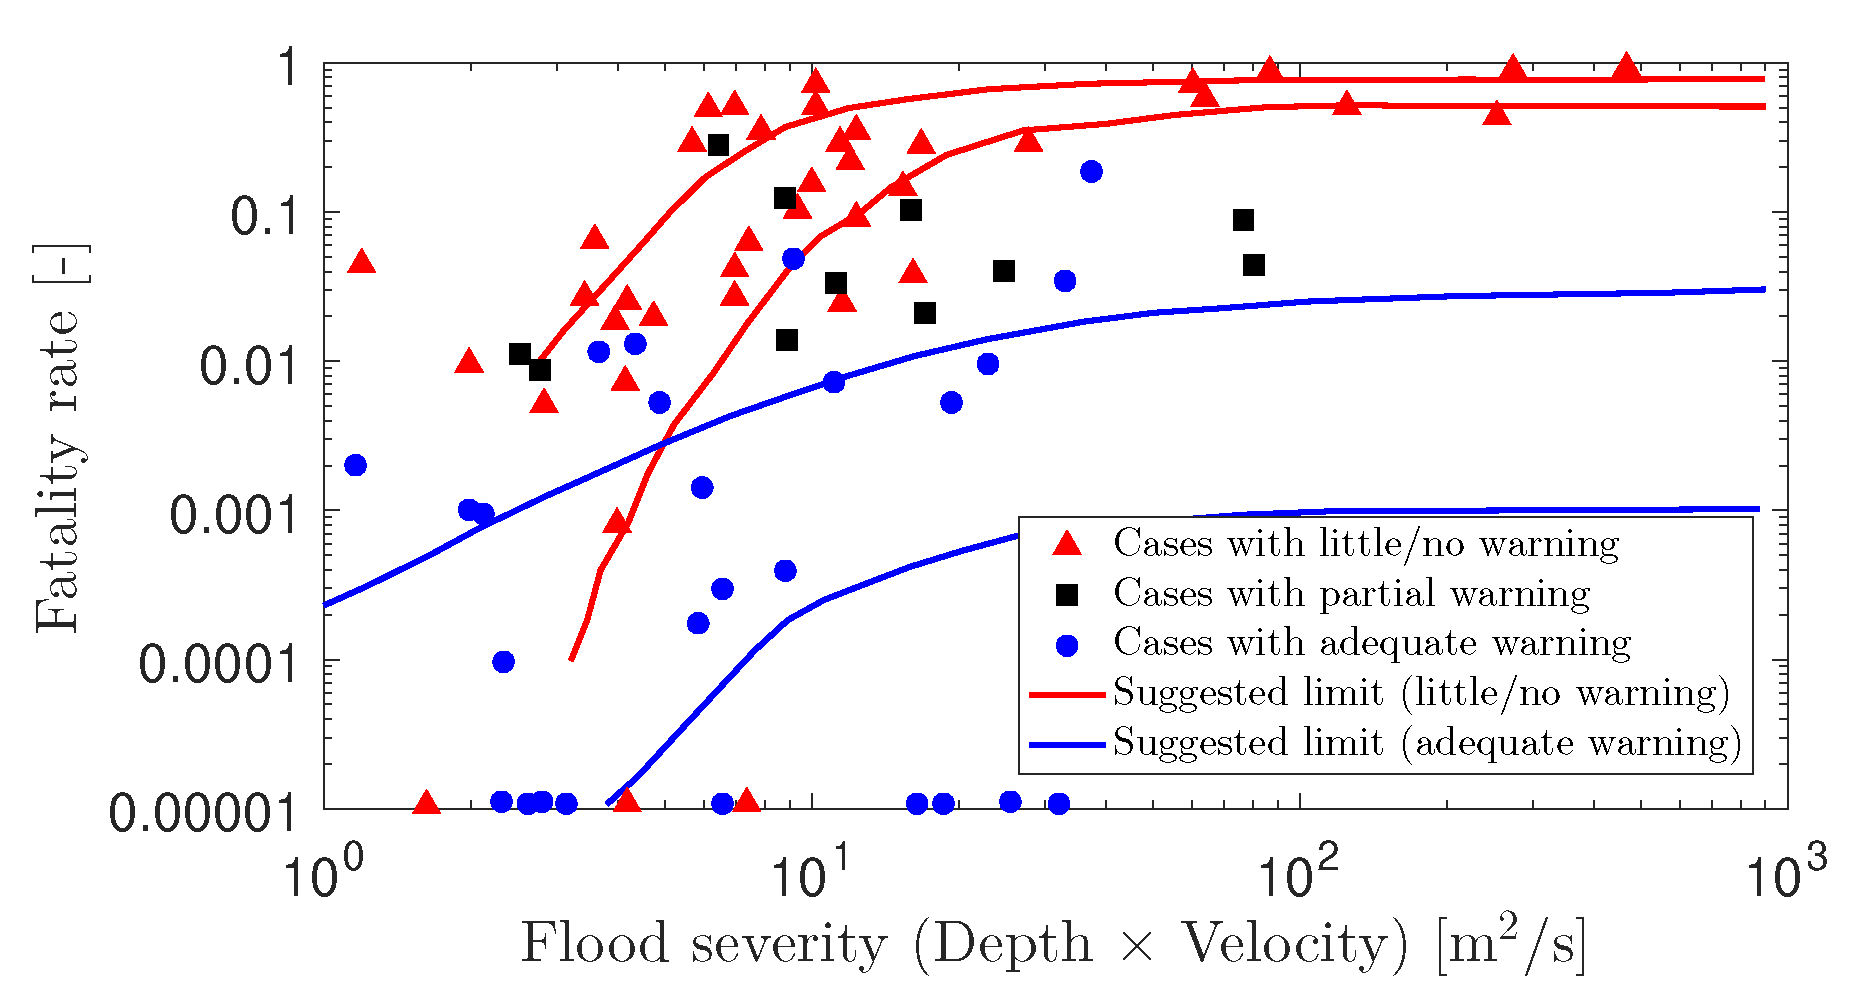
- During this discussion, we do not address the direct loss of life due to a dam break flood. We only focus on the indirect fatality rate growth. The concept of mortality is used to connect the number of indirect fatalities, , to the total number of those affected, :Jonkman [91] reports a worldwide mean mortality of 0.0355 and 0.0054 for flash and river floods, respectively. One should note that this value is highly dependent on the region or country and the infrastructure’s maturity.
- According to the World Health Organization (WHO, https://www.who.int/emergencies/diseases/novel-coronavirus-2019/question-and-answers-hub/q-a-detail/q-a-coronaviruses), COVID-19 has an incubation period of one to 14 days (with a median of five days). Therefore, we reflect the number of potential new patients in a linear mode from day one to 14 following the natural hazard. This is shown by the red curve in Figure 13b. The actual final increase at the end of day 14, , should be obtained through continuous monitoring of all the people that are displaced after flooding.
- In the most ideal—and maybe impossible—case, the number of those infected is not increased; however, if the number of infected people is potentially increased, three scenarios can be discussed:
- –
- Scenario 1: There is no further action taken by society and/or the government, and thus the final number (estimated) of infected people, , will be higher than (sum of pandemic-only and natural hazard-induced cases). This is due to a sudden increase in the number of infected people, which increases the chance of spreading COVID-19.
- –
- Scenario 2: Some restrictions are applied by society and/or the government to keep the growth rate similar to the “pandemic only” case. Therefore, , will be equal to .
- –
- Scenario 3: A severe level of restrictions is established by society and/or the government that is greater than during pandemic only conditions. In this scenario, the number of natural hazard-induced cases are dampened gradually, and the final will be equal to K. The impact of the pandemic is entirely absorbed by external activities.
5.2. Impact of Ongoing Pandemic on Natural Hazard-Induced Loss
“It would have been bad even with the best of government. Here it has been an absolute chaotic disaster” Barak Obama (9 May 2020).
6. Closing Remarks
“There may and likely will come a time in which we have both an airborne disease that is deadly, and in order for us to deal with that effectively, we have to put in place an infrastructure—not just here at home, but globally—that allows us to see it quickly, isolate it quickly, respond to it quickly, so that if and when a new strain of flu like the Spanish flu crops up five years from now or a decade from now, we’ve made the investment and we’re further along to be able to catch it. It is a smart investment for us to make. It’s not just insurance; it is knowing that down the road, we’re gonna continue to have problems like this—practically in a globalized world, where you move from one side of the world to the other in a day. So this is important now, but it’s also important for our future, and our children’s future, and our grandchildren’s future.”
Author Contributions
Funding
Institutional Review Board Statement
Informed Consent Statement
Data Availability Statement
Acknowledgments
Conflicts of Interest
Appendix A. Life Safety Risk Metrics
- Individual incremental life safety. The individual risk (IR) should meet the following criteria:
- If IR ≥ 1 × 10 per year: risks are unacceptable except in extraordinary circumstances.
- If 1 × 10≤ IR < 1 × 10 per year: risks are intolerable unless ALARP (refers to as low as reasonably practicable) conditions are satisfied.
- If IR < 1 × 10 per year: risks are generally tolerable; however, ALARP considerations should be employed.
- Societal incremental life safety as follows:
- Probability distribution of potential incremental life loss: the social incremental risk (SIR) should meet the following criteria and is evaluated based on the F-N chart, Figure 12:
- –
- If SIR ≥ 1 × 10 lives per year: SIR above the tolerable risk reference line is unacceptable except in extraordinary circumstances.
- –
- If 1 × 10≤ IR < 1 × 10 lives per year: SIR in this range will be considered intolerable unless ALARP considerations are satisfied.
- –
- If SIR < 1 × 10 per year: SIR in this range will be considered tolerable; however, the ALARP considerations should be employed.
- –
- Low Probability/High Consequence region: If the estimated social risk falls into the gray zone in Figure 12, the evaluation of the tolerability of risk must be based on a thorough review of the project benefits and risks.
- Average Annual Life Loss: The AALL should meet the following criteria in accordance with f-, Figure 12:
- –
- If AALL ≥ 1 × 10 lives per year: AALL in this range is unacceptable except in extraordinary circumstances.
- –
- If 1 × 10≤ AALL < 1 × 10 lives per year: AALL in this range will be considered intolerable unless ALARP considerations are satisfied.
- –
- If AALL < 1 × 10 per year: AALL in this range will be considered tolerable; however, the ALARP considerations should be employed.
- –
- Low Probability/High Consequence region: If the estimated social risk falls into the gray zone in Figure 12, the evaluation of the tolerability of risk must be based on a thorough review of the project benefits and risks.
Appendix B. Basic Reproduction Number

References
- Alexander, D. Natural Disasters; Routledge: London, UK, 2018. [Google Scholar]
- Hariri-Ardebili, M. Risk, Reliability, Resilience (R3) and beyond in dam engineering: A state-of-the-art review. Int. J. Disaster Risk Reduct. 2018, 31, 806–831. [Google Scholar] [CrossRef]
- FEMA. Federal Guidelines for Dam Safety Risk Management; Technical Report; Federal Emergency Management Agency: Washington, DC, USA, 2015. [Google Scholar]
- Andrews, R. What Happens If a ‘Big One’ Strikes During the Pandemic? The Atlantic, 9 May 2020. [Google Scholar]
- Sadegh, M.; Moftakhari, H.; Gupta, H.V.; Ragno, E.; Mazdiyasni, O.; Sanders, B.; Matthew, R.; AghaKouchak, A. Multihazard scenarios for analysis of compound extreme events. Geophys. Res. Lett. 2018, 45, 5470–5480. [Google Scholar] [CrossRef] [Green Version]
- Tilloy, A.; Malamud, B.D.; Winter, H.; Joly-Laugel, A. A review of quantification methodologies for multi-hazard interrelationships. Earth-Sci. Rev. 2019, 196, 102881. [Google Scholar] [CrossRef]
- Eshrati, L.; Mahmoudzadeh, A.; Taghvaei, M. Multi hazards risk assessment, a new methodology. Int. J. Health Syst. Disaster Manag. 2015, 3, 79. [Google Scholar]
- World Health Organization. Coronavirus disease 2019 (COVID-19): Situation Report; World Health Organization: Geneva, Switzerland, 2020; p. 80. [Google Scholar]
- Wu, Y.C.; Chen, C.S.; Chan, Y.J. The outbreak of COVID-19: An overview. J. Chin. Med. Assoc. 2020, 83, 217. [Google Scholar] [CrossRef] [PubMed]
- Hellewell, J.; Abbott, S.; Gimma, A.; Bosse, N.I.; Jarvis, C.I.; Russell, T.W.; Munday, J.D.; Kucharski, A.J.; Edmunds, W.J.; Sun, F.; et al. Feasibility of controlling COVID-19 outbreaks by isolation of cases and contacts. Lancet Glob. Health 2020, 8, e488–e496. [Google Scholar] [CrossRef] [Green Version]
- Fearnley, C.J.; Dixon, D. Early Warning Systems for Pandemics: Lessons Learned from Natural Hazards. I. J. Disaster Risk Reduct. 2020, 49, 101674. [Google Scholar] [CrossRef] [PubMed]
- UNISDR. Sendai framework for disaster risk reduction 2015–2030. In Proceedings of the 3rd United Nations World Conference on DRR, Sendai, Japan, 14–18 March 2015; pp. 14–18. [Google Scholar]
- Maini, R.; Clarke, L.; Blanchard, K.; Murray, V. The Sendai Framework for Disaster Risk Reduction and its indicators-where does health fit in? Int. J. Disaster Risk Sci. 2017, 8, 150–155. [Google Scholar] [CrossRef] [Green Version]
- Thu, T.P.B.; Ngoc, P.N.H.; Hai, N.M. Effect of the social distancing measures on the spread of COVID-19 in 10 highly infected countries. Sci. Total Environ. 2020, 742, 140430. [Google Scholar] [CrossRef] [PubMed]
- Valliappan, S.; Chee, C. Ageing Degradation of Concrete Dams Based on Damage Mechanics Concepts. In Computational Structural Engineering; Yuan, Y., Cui, J., Mang, H., Eds.; Springer: Cham, The Netherlands, 2009; pp. 21–35. [Google Scholar]
- Bedford, J.; Farrar, J.; Ihekweazu, C.; Kang, G.; Koopmans, M.; Nkengasong, J. A new twenty-first century science for effective epidemic response. Nature 2019, 575, 130–136. [Google Scholar] [CrossRef]
- Shi, W.; Hall, B.J. What can we do for people exposed to multiple traumatic events during the coronavirus pandemic? Asian J. Psychiatry 2020, 51, 102065. [Google Scholar] [CrossRef] [PubMed]
- Mishra, A.; Bruno, E.; Zilberman, D. Compound natural and human disasters: Managing drought and COVID-19 to sustain global agriculture and food sectors. Sci. Total Environ. 2020, 754, 142210. [Google Scholar] [CrossRef] [PubMed]
- Hariri-Ardebili, M.A. Living in a multi-risk chaotic condition: Pandemic, natural hazards and complex emergencies. Int. J. Environ. Res. Public Health 2020, 17, 5635. [Google Scholar] [CrossRef] [PubMed]
- Haas, C. Coronavirus and risk analysis. Risk Anal. 2020, 40, 660–661. [Google Scholar] [CrossRef] [Green Version]
- US Energy Information Administration. Electric Power Monthly. 2020. Available online: https://www.eia.gov/ (accessed on 15 May 2020).
- Rich, Eddie Twitter Post. 2020. Available online: https://twitter.com/eddierich1?lang=en (accessed on 30 May 2020).
- Editorial Team Hydropower and the impact of COVID-19. Water Power and Dam Construction, 18 May 2020.
- ASCE. 2021 Report Card for America’s Infrastructure; Dams. American Society of Civil Engineers. 2021. Available online: https://www.infrastructurereportcard.org/cat-item/dams/ (accessed on 30 March 2021).
- National Performance of Dams Program. Dam Failures in the U.S., NPDP-01 V1; Technical Report; Department of Civil and Environmental Engineering, Stanford University: Stanford, CA, USA, 2018. [Google Scholar]
- U.S. Department of the Interior, Bureau of Reclamation. DSO-99-06: A Procedure for Estimating Loss of Life Caused by Dam Failure; Technical Report; Dam Safety Office: Denver, CO, USA, 1999. [Google Scholar]
- Graham, W.J. Major US dam failures: Their cause, resultant losses, and impact on dam safety programs and engineering practice. In Great Rivers History: Proceedings and Invited Papers for the EWRI Congress and History Symposium; American Society of Civil Engineers: Reston, VA, USA, 2009; pp. 52–60. [Google Scholar]
- Zhang, L.; Xu, Y.; Jia, J. Analysis of earth dam failures: A database approach. Georisk 2009, 3, 184–189. [Google Scholar] [CrossRef] [Green Version]
- ICOLD. ICOLD Incident Database Bulletin 99 Update: Statistical Analysis of Dam Failures; Technical Report; International Commission on Large Dams: Paris, France, 2019. [Google Scholar]
- Hariri-Ardebili, M.A.; Salamon, J.; Mazza, G.; Tosun, H.; Xu, B. Advances in Dam Engineering. Infrastructures 2020, 5, 39. [Google Scholar] [CrossRef]
- France, J.; Alvi, I.; Dickson, P.; Falvey, H.; Rigbey, S.; Trojanowski, J. Independent Forensic Team Report—Oroville Dam Spillway Incident. Technical Report. 2018. Available online: https://www.ussdams.org/our-news/oroville-dam-spillway-incident-independent-forensic-team-final-report/ (accessed on 10 May 2020).
- Brunner, G.W. HEC-RAS (river analysis system). In North American Water and Environment Congress & Destructive Water; ASCE: New York, NY, USA, 2002; pp. 3782–3787. [Google Scholar]
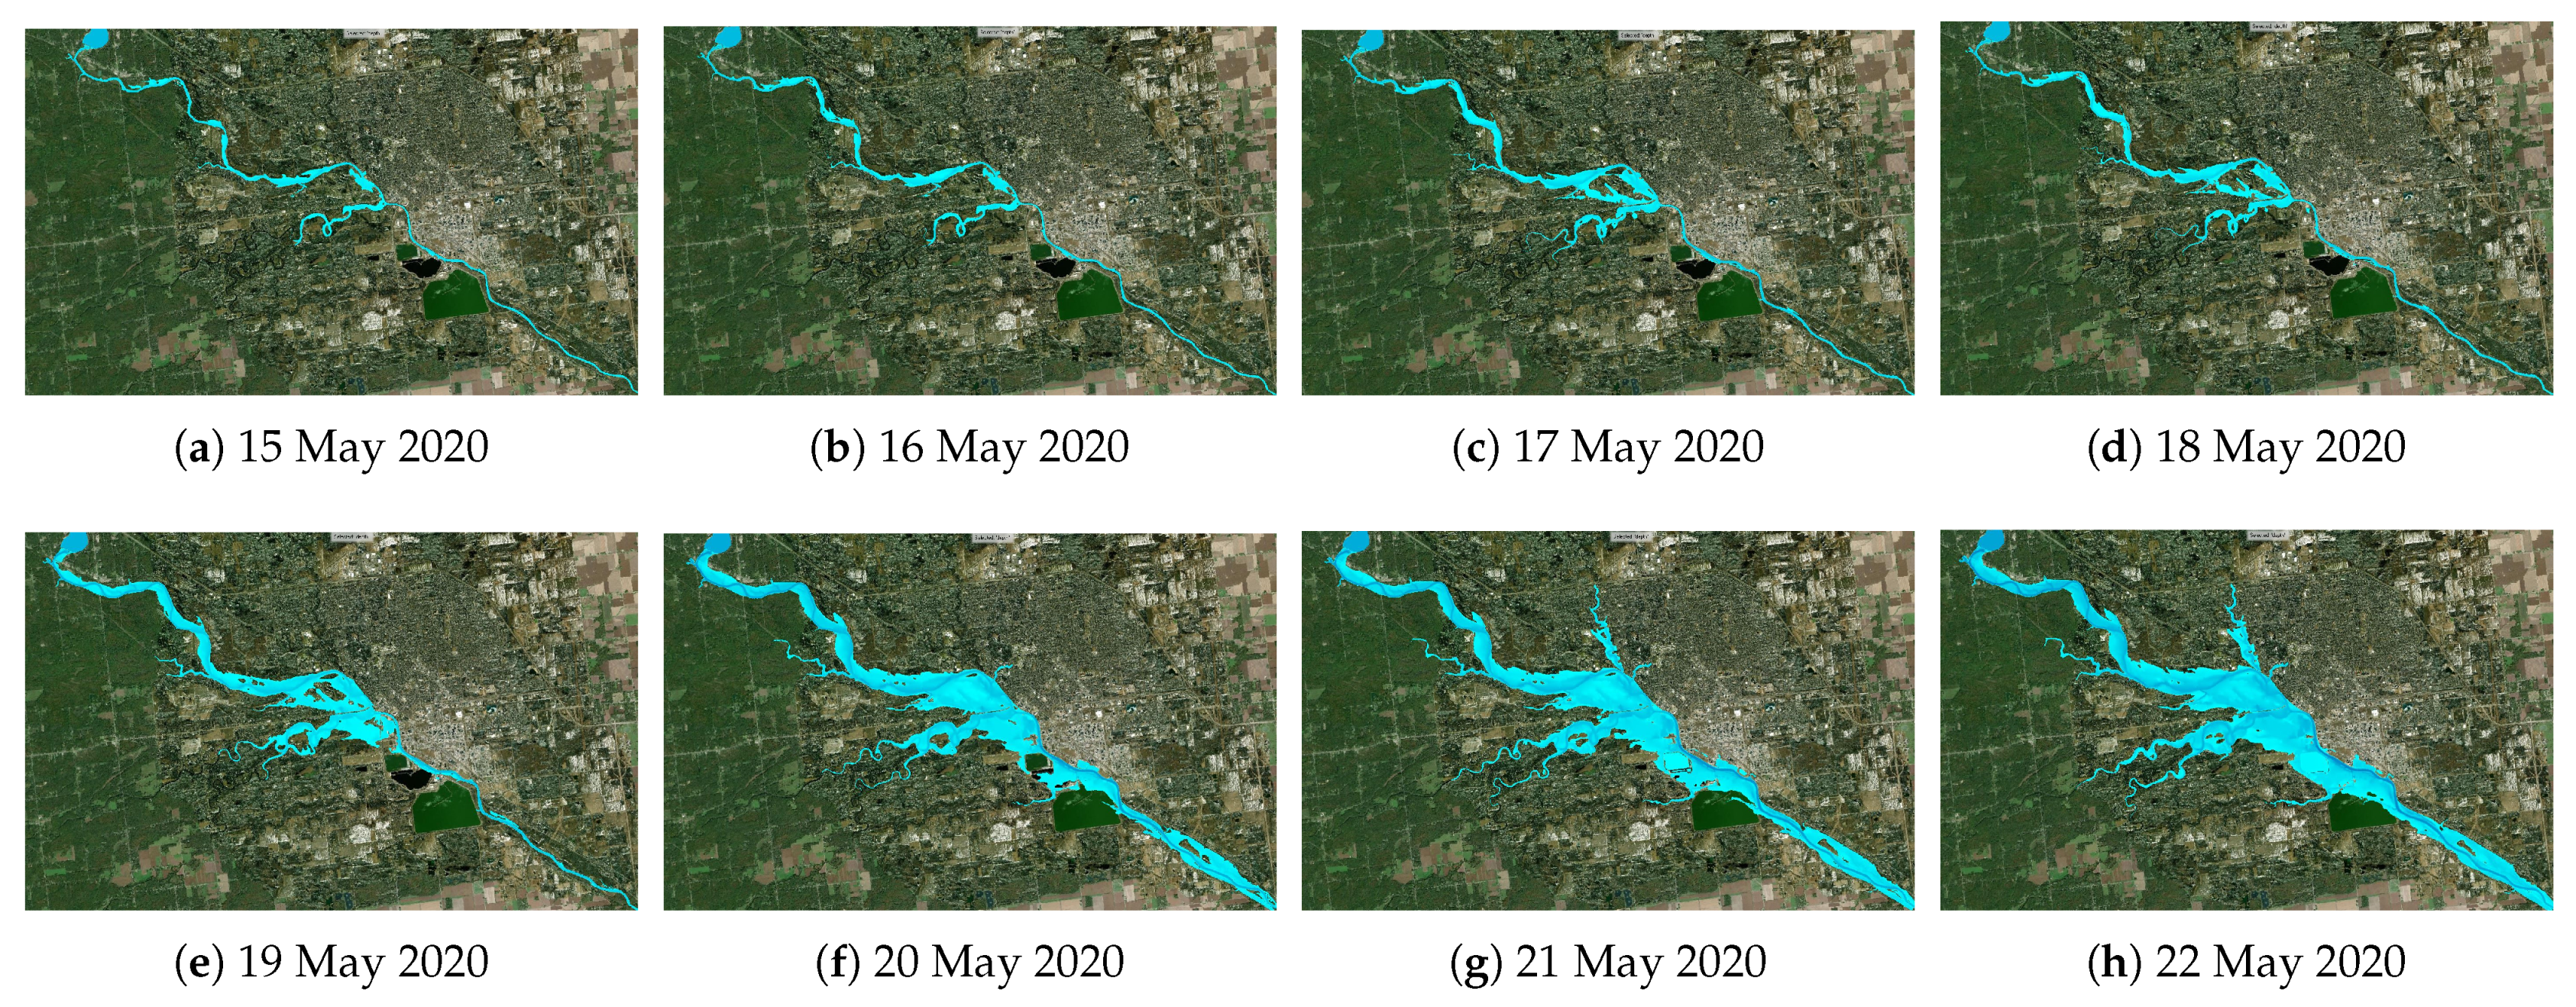
- NASA Earth Observatory Satellite. Muddy Flooding in Michigan. 2020. Available online: https://earthobservatory.nasa.gov/images/146752/muddy-flooding-in-michigan (accessed on 10 May 2020).
- NID. National Inventory of Dams. 2019. Available online: https://nid-test.sec.usace.army.mil/ords/f?p=105:22:13023978711032::NO::: (accessed on 30 May 2020).
- Litman, T. Pandemic-Resilient Community Planning: Practical Ways to Help Communities Prepare for, Respond to, and Recover from Pandemics and Other Economic, Social and Environmental Shocks. 2020. Available online: https://www.vtpi.org/PRCP.pdf. (accessed on 10 May 2020).
- Osorio, C.; Williams, C.; Webber, T. Michigan flood displaces thousands, threatens Superfund site. ABC News, 21 May 2020. [Google Scholar]
- FEMA P-946. Federal Guidelines for Inundation Mapping of Flood Risk Associated with Dam Incidents and Failures; Technical Report; Federal Emergency Management Agency: Washington, DC, USA, 2013. [Google Scholar]
- Simonovic, S.P.; Kundzewicz, Z.W.; Wright, N. Floods and the COVID-19 pandemic—A new double hazard problem. Wiley Interdiscip. Rev. Water 2021, 8, e1509. [Google Scholar] [CrossRef]
- Songsore, J. The complex interplay between everyday risks and disaster risks: The case of the 2014 cholera pandemic and 2015 flood disaster in Accra, Ghana. Int. J. Disaster Risk Reduct. 2017, 26, 43–50. [Google Scholar] [CrossRef]
- Manitoba Government. High Water Response Activity: COVID-19 Adaptations. 2020. Available online: https://www.gov.mb.ca/emo/pdfs/adaptations-to-high-water-response-activity.pdf (accessed on 30 May 2020).
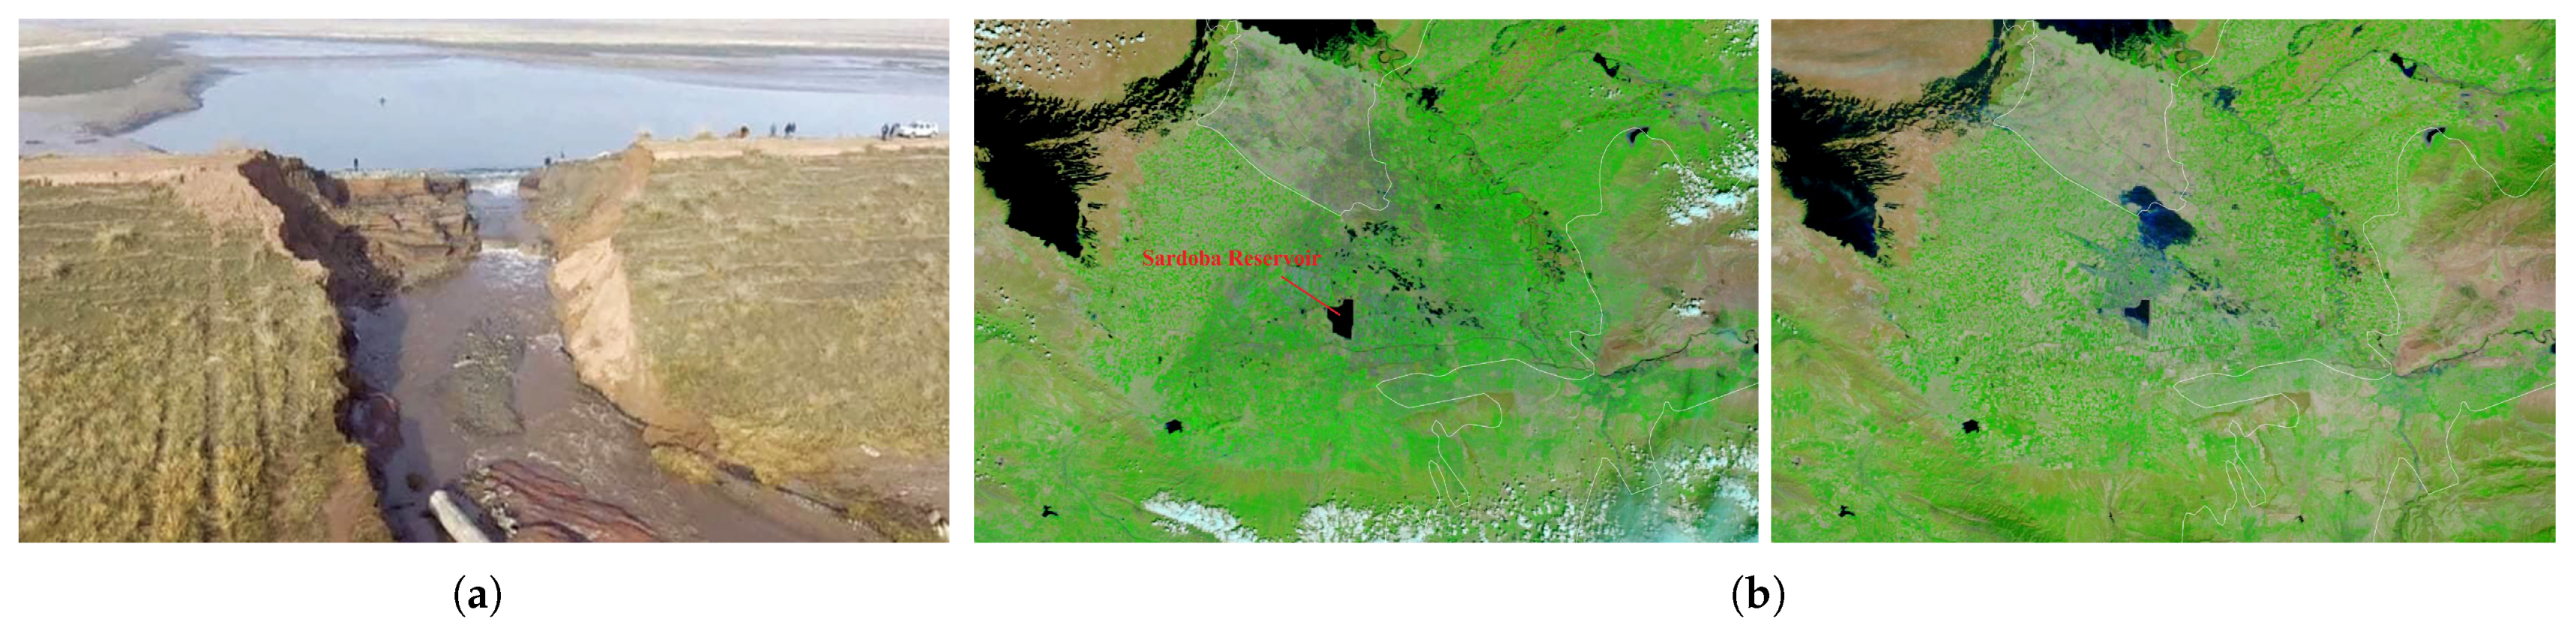
- Putz, C. 70,000 Evacuated after Breach in Uzbek Dam, Investigation into Failure Launched. The Diplomat, 4 May 2020. [Google Scholar]
- Hydropower & Dams. Investigations underway following Sardoba dam breach in Uzbekistan. Int. J. Hydropowers Dams. 2020. Available online: https://www.hydropower-dams.com/news/investigations-underway-following-sardoba-dam-breach-in-uzbekistan/ (accessed on 30 May 2020).
- Copernicus. Flood List. 2020. Available online: http://floodlist.com/america (accessed on 29 September 2020).
- Watson, J.T.; Gayer, M.; Connolly, M.A. Epidemics after natural disasters. Emerg. Infect. Dis. 2007, 13, 1–5. [Google Scholar] [CrossRef]
- Ramalanjaona, G. Impact of 2004 tsunami in the islands of Indian ocean: Lessons learned. Emerg. Med. Int. 2011, 2011, 920813. [Google Scholar] [CrossRef]
- Guha-Sapir, D.; van Panhuis, W.G. Health impact of the 2004 Andaman Nicobar earthquake and tsunami in Indonesia. Prehosp. Disaster Med. 2009, 24, 493–499. [Google Scholar] [CrossRef] [Green Version]
- Doocy, S.; Cherewick, M.; Kirsch, T. Mortality following the Haitian earthquake of 2010: A stratified cluster survey. Popul. Health Metrics 2013, 11, 5. [Google Scholar] [CrossRef] [Green Version]
- Houston, A.R. Applying Lessons from the Past in Haiti: Cholera, Scientific Knowledge, and the Longest-Standing Principle of International Health Law. In Infectious Diseases in the New Millennium; Springer: Cham, Switzerland, 2020; pp. 13–41. [Google Scholar]
- Čivljak, R.; Markotić, A.; Capak, K. Earthquake in the time of COVID-19: The story from Croatia (CroVID-20). J. Glob. Health 2020, 10, e010349. [Google Scholar] [CrossRef] [PubMed]
- Seismological Service of the Geophysical Department of the Faculty of Science. Short review of the earthquakes in the Zagreb area in the last two weeks (23 March–5 April 2020). 2020. (In Croatian). Available online: https://www.pmf.unizg.hr/geof/seizmoloska_sluzba/o_zagrebackom_potresu_2020?@=1lqln# (accessed on 30 May 2020).
- Peitl, V.; Golubić Zatezalo, V.; Karlović, D. Mental Health Issues and Psychological Crisis Interventions during the COVID-19 Pandemic and Earthquakes in Croatia. Arch. Psychiatry Res. Int. J. Psychiatry Relat. Sci. 2020, 56, 193–198. [Google Scholar]
- Mavroulis, S.; Mavrouli, M.; Lekkas, E. Geological and hydrometeorological hazards and related disasters amid COVID-19 pandemic in Greece: Post-disaster trends and factors affecting the COVID-19 evolution in affected areas. Saf. Sci. 2021, 138, 105236. [Google Scholar] [CrossRef]
- BBC News. US West Coast fires in maps, graphics and images. BBC News. 18 September 2020. Available online: https://www.bbc.com/news/world-us-canada-54180049 (accessed on 30 May 2020).
- Roser, M.; Ritchie, H.; Ortiz-Ospina, E.; Hasell, J. Our World in Data—Mortality Risk of COVID-19. 2020. Available online: https://ourworldindata.org/mortality-risk-covid (accessed on 30 May 2020).
- ICOLD. Bulletin on Risk Assessment in Dam Safety Management; Technical Report; International Commission on Large Dams: Paris, France, 2005. [Google Scholar]
- FERC. Risk-Informed Decision-Making (RIDM), Risk Guidelines for Dam Safety; Technical Report; Federal Energy Regulatory Commission: Washington, DC, USA, 2016. [Google Scholar]
- USACE. Safety of Dams-Policy and Procedures; Technical Report EM 1110-2-1156; Department of the Army, U.S. Army Corps of Engineers: Washington, DC, USA, 2014. [Google Scholar]
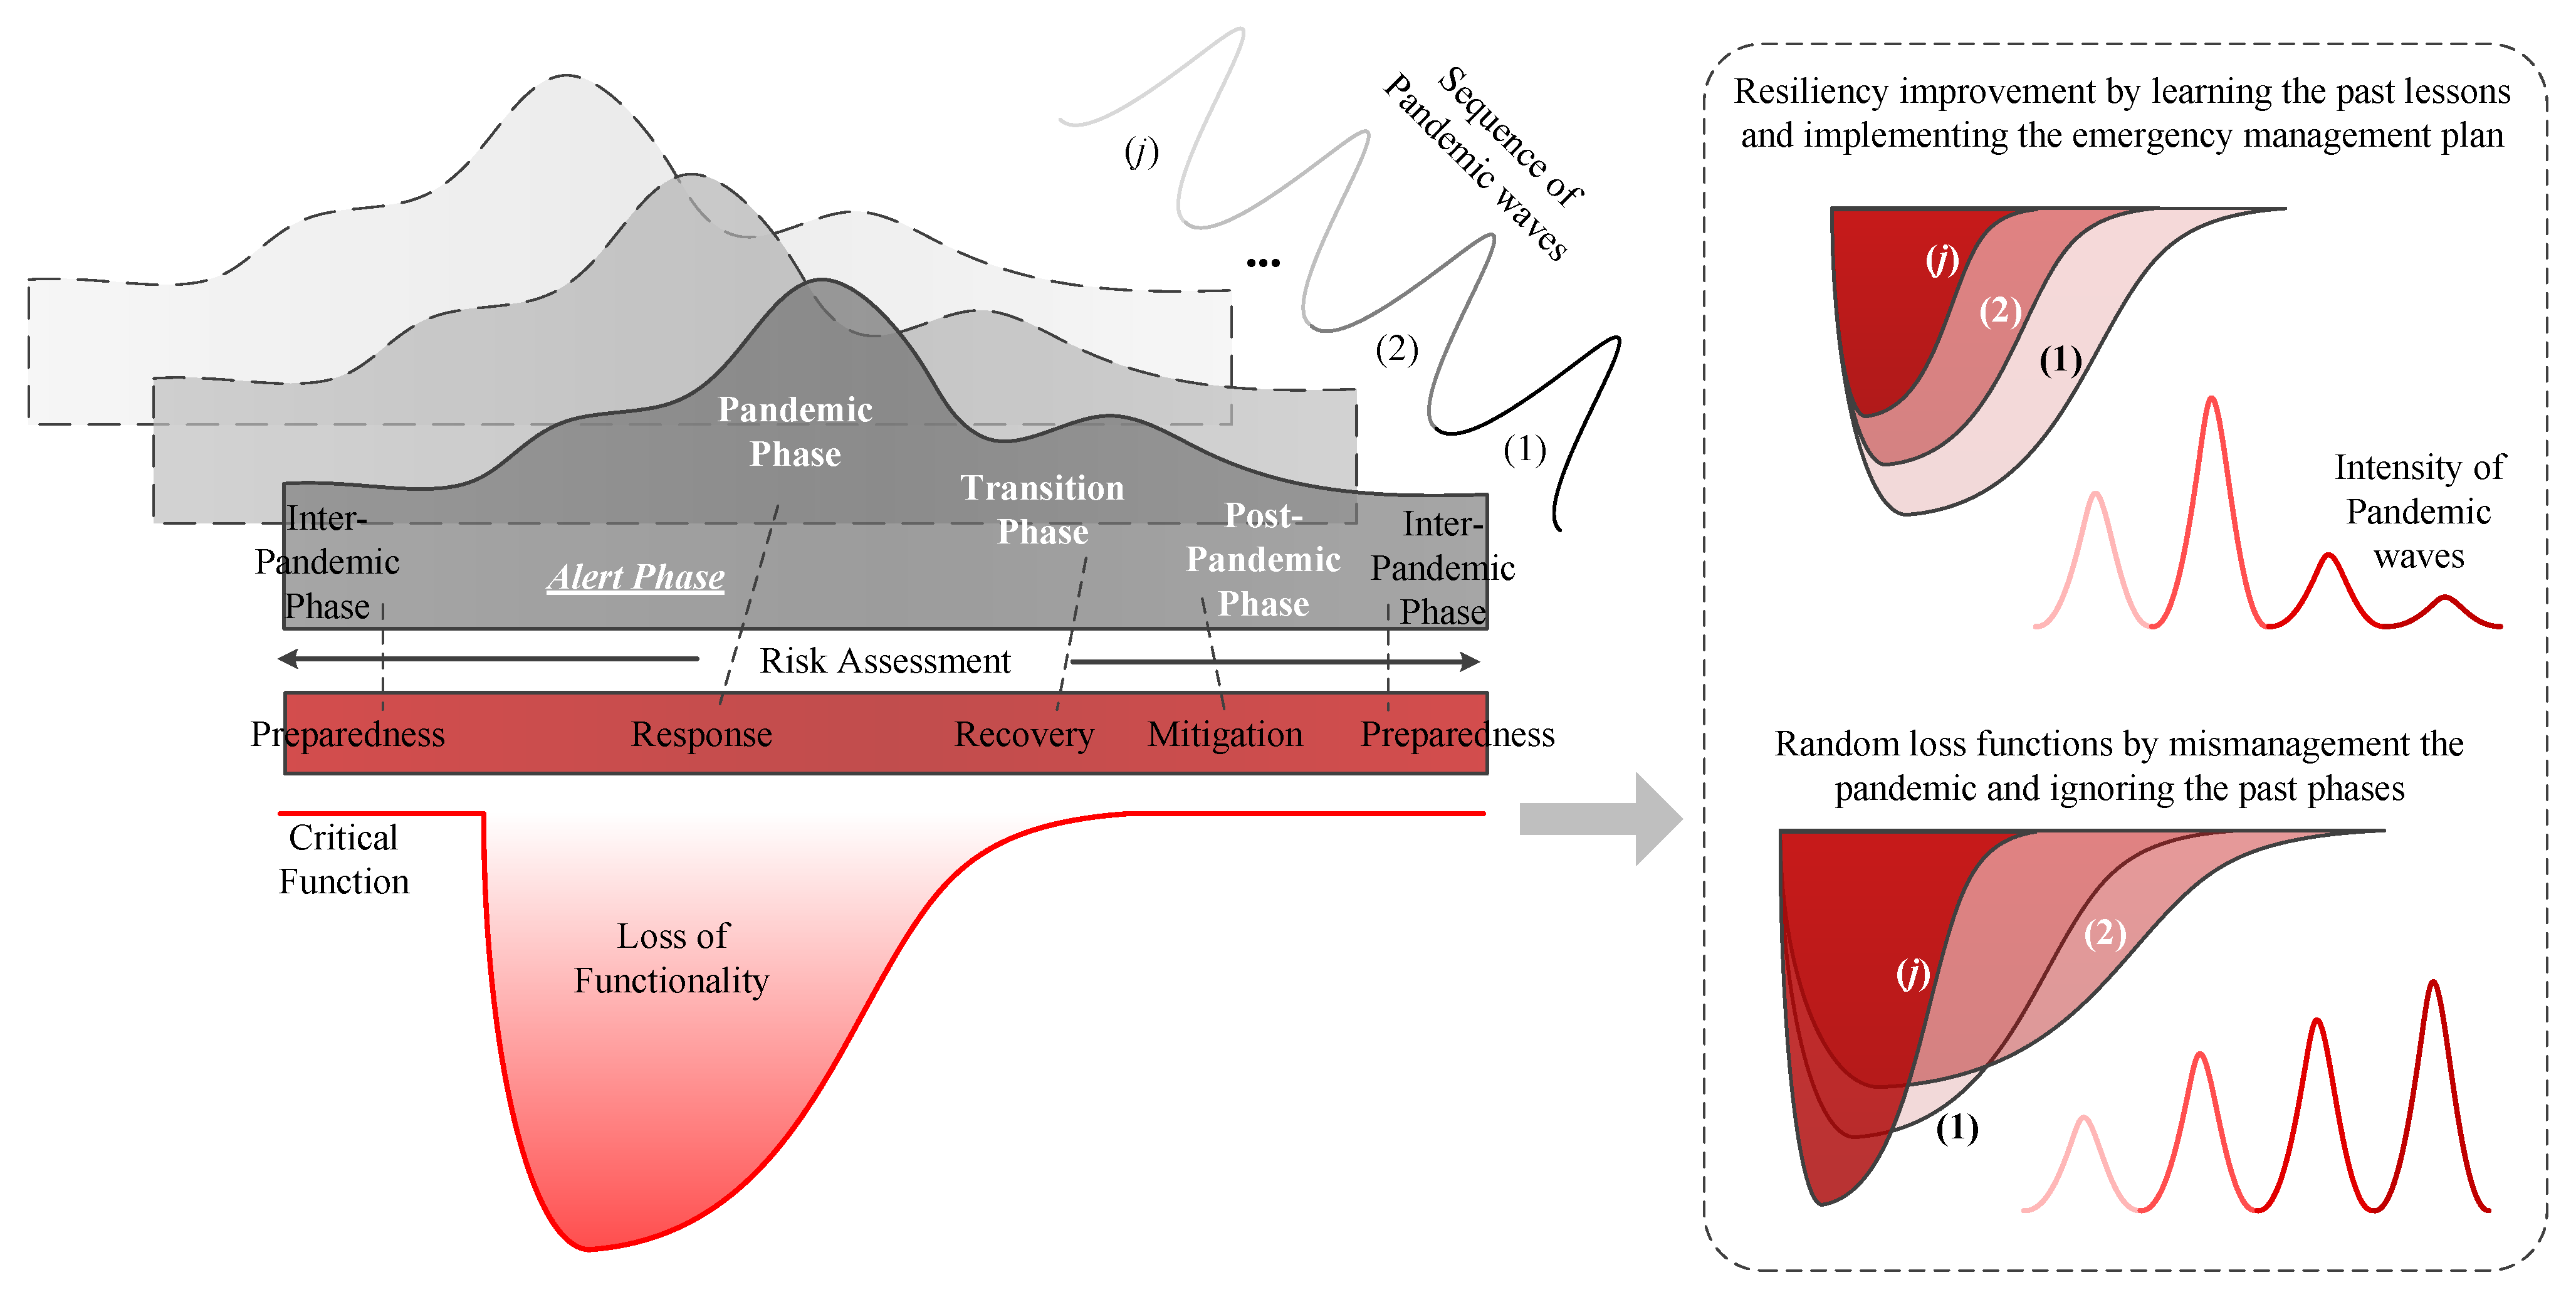
- Fakhruddin, B.; Blanchard, K.; Ragupathy, D. Are we there yet? The transition from response to recovery for the COVID-19 pandemic. Prog. Disaster Sci. 2020, 7, 100102. [Google Scholar] [CrossRef] [PubMed]
- Ashraf, A. Lessons learned from COVID-19 response for disaster risk management. Nat. Hazards 2021, 107, 2027–2032. [Google Scholar] [CrossRef] [PubMed]
- CDC. The Continuum of Pandemic Phases. 2016. Available online: https://www.cdc.gov/flu/pandemic-resources/planning-preparedness/global-planning-508.html (accessed on 30 May 2020).
- Pankow, K.L.; Rusho, J.; Pechmann, J.C.; Hale, J.M.; Whidden, K.; Sumsion, R.; Holt, J.; Mesimeri, M.; Wells, D.; Koper, K.D. Responding to the 2020 Magna, Utah, earthquake sequence during the COVID-19 pandemic shutdown. Seismol. Soc. Am. 2021, 92, 6–16. [Google Scholar] [CrossRef]
- Menoni, S.; Schwarze, R. Recovery during a crisis: Facing the challenges of risk assessment and resilience management of COVID-19. Environ. Syst. Decis. 2020, 40, 189–198. [Google Scholar] [CrossRef]
- Hynes, W.; Trump, B.; Love, P.; Linkov, I. Bouncing forward: A resilience approach to dealing with COVID-19 and future systemic shocks. Environ. Syst. Decis. 2020, 40, 174–184. [Google Scholar] [CrossRef]
- Keenan, J.M. COVID, resilience, and the built environment. Environ. Syst. Decis. 2020, 40, 216–221. [Google Scholar] [CrossRef]
- Anderson, R.M.; Heesterbeek, H.; Klinkenberg, D.; Hollingsworth, T.D. How will country-based mitigation measures influence the course of the COVID-19 epidemic? Lancet 2020, 395, 931–934. [Google Scholar] [CrossRef]
- San Lau, L.; Samari, G.; Moresky, R.T.; Casey, S.E.; Kachur, S.P.; Roberts, L.F.; Zard, M. COVID-19 in humanitarian settings and lessons learned from past epidemics. Nat. Med. 2020, 26, 647–648. [Google Scholar]
- Van Bavel, J.J.; Baicker, K.; Boggio, P.S.; Capraro, V.; Cichocka, A.; Cikara, M.; Crockett, M.J.; Crum, A.J.; Douglas, K.M.; Druckman, J.N.; et al. Using social and behavioural science to support COVID-19 pandemic response. Nat. Hum. Behav. 2020, 4, 460–471. [Google Scholar] [CrossRef] [PubMed]
- High-Level Experts and Leaders Panel on Water and Disasters (HELP). Principles to Address Water-related Disaster Risk Reduction (DRR) under the COVID-19 Pandemic. 2020. Available online: https://www.wateranddisaster.org/principles-to-address-water-related-disaster-risk-reduction-drr-under-the-covid-19-pandemic/ (accessed on 27 July 2021).
- Ishiwatari, M.; Koike, T.; Hiroki, K.; Toda, T.; Katsube, T. Managing disasters amid COVID-19 pandemic: Approaches of response to flood disasters. Prog. Disaster Sci. 2020, 6, 100096. [Google Scholar] [CrossRef] [PubMed]
- McClelland, D.M.; Bowles, D.S. Estimating Life Loss for Dam Safety Risk Assessment: A Review and New Approach; Institute for Water Resources: Alexandria, VA, USA, 2002. [Google Scholar]
- Jonkman, S.N. Loss of Life Estimation in Flood Risk Assessment; Theory and Applications. Ph.D. Thesis, Civil Engineering and Geosciences, Delft, The Netherlands, 2007. [Google Scholar]
- FEMA. Estimating Loss of Life for Dam Failure Scenarios; US Department of Homeland Security: Washington, DC, USA, 2011. [Google Scholar]
- Peng, M.; Zhang, L. Analysis of human risks due to dam-break floods—Part 1: A new model based on Bayesian networks. Nat. Hazards 2012, 64, 903–933. [Google Scholar] [CrossRef]
- Lee, J.S. Uncertainties in the predicted number of life loss due to the dam breach floods. KSCE J. Civ. Eng. 2003, 7, 81–91. [Google Scholar] [CrossRef]
- Bowles, D.S.; Aboelata, M. Evacuation and life-loss estimation model for natural and dam break floods. In Extreme Hydrological Events: New Concepts for Security; Springer: Dordrecht, The Netherlands, 2006; pp. 363–383. [Google Scholar]
- USBR. RCEM—Reclamation Consequence Estimating Methodology—Interim—Guidelines for Estimating Life Loss for Dam Safety Risk Analysis; Technical Report; U.S. Department of the Interior Bureau of Reclamation: Denver, CO, USA, 2015. [Google Scholar]
- Tripathy, S.S.; Bhatia, U.; Mohanty, M.; Karmakar, S.; Ghosh, S. Flood evacuation during pandemic: A multi-objective framework to handle compound hazard. Environ. Res. Lett. 2021, 16, 034034. [Google Scholar] [CrossRef]
- Borowski, E.; Cedillo, V.L.; Stathopoulos, A. Dueling emergencies: Flood evacuation ridesharing during the COVID-19 pandemic. Transp. Res. Interdiscip. Perspect. 2021, 10, 100352. [Google Scholar]
- New Zealand Government. Unite against COVID-19 Alert System. 2020. Available online: https://covid19.govt.nz/alert-system (accessed on 30 May 2020).
- Ge, W.; Qin, Y.; Li, Z.; Zhang, H.; Gao, W.; Guo, X.; Song, Z.; Li, W.; van Gelder, P. An innovative methodology for establishing societal life risk criteria for dams: A case study to reservoir dam failure events in China. Int. J. Disaster Risk Reduct. 2020, 49, 101663. [Google Scholar] [CrossRef]
- Lee, B.S.; You, G.J.Y. An assessment of long-term overtopping risk and optimal termination time of dam under climate change. J. Environ. Manag. 2013, 121, 57–71. [Google Scholar] [CrossRef] [PubMed]
- Fluixá Sanmartín, J.; Altarejos García, L.; Morales Torres, A.; Escuder Bueno, I. Climate change impacts on dam safety. Nat. Hazards Earth Syst. Sci. 2018, 18, 2471–2488. [Google Scholar] [CrossRef] [Green Version]
- Manzanedo, R.D.; Manning, P. COVID-19: Lessons for the climate change emergency. Sci. Total Environ. 2020, 742, 140563. [Google Scholar] [CrossRef]
- Bostrom, A.; Bohm, G.; OConnor, R.E.; Hanss, D.; Bodi-Fernandez, O.; Halder, P. Comparative risk science for the coronavirus pandemic. J. Risk Res. 2020, 23, 902–911. [Google Scholar] [CrossRef]
- Sheehan, M.C. Climate Change and Human Well-Being in the 2020s: Lessons from 2020. Int. J. Health Serv. 2021, 51, 281–286. [Google Scholar] [CrossRef]
- Zambrano-Monserrate, M.A.; Ruano, M.A.; Sanchez-Alcalde, L. Indirect effects of COVID-19 on the environment. Sci. Total Environ. 2020, 728, 138813. [Google Scholar] [CrossRef]
- Espejo, W.; Celis, J.E.; Chiang, G.; Bahamonde, P. Environment and COVID-19: Pollutants, impacts, dissemination, management and recommendations for facing future epidemic threats. Sci. Total Environ. 2020, 747, 141314. [Google Scholar] [CrossRef]
- Ranscombe, P. Rural areas at risk during COVID-19 pandemic. Lancet Infect. Dis. 2020, 20, 545. [Google Scholar] [CrossRef]
- Batista, M. Estimation of the final size of the second phase of coronavirus epidemic by the logistic model. medrxiv. 2020. Available online: https://www.medrxiv.org/content/medrxiv/early/2020/03/16/2020.03.11.20024901.full.pdf (accessed on 27 July 2021).
- Singer, H. The COVID-19 pandemic: Growth patterns, power law scaling, and saturation. arXiv 2020, arXiv:2004.03859. [Google Scholar] [CrossRef]
- Jonkman, S. Loss of Life Caused by Floods: An Overview of Mortality Statistics for Worldwide Floods; DC1-233-6; TU Delft: Delft, The Netherlands, 2003. [Google Scholar]
- Shen, X.; Cai, C.; Yang, Q.; Anagnostou, E.N.; Li, H. The US COVID-19 pandemic in the flood season. Sci. Total Environ. 2021, 755, 142634. [Google Scholar] [CrossRef]
- Davis, J.A. Disaster Preparedness Key Amid Pandemic. 2020. Available online: https://www.sej.org/publications/backgrounders/disaster-preparedness-key-amid-pandemic (accessed on 30 May 2020).
- Ebrahim, S.H.; Memish, Z.A. COVID-19–the role of mass gatherings. Travel Med. Infect. Dis. 2020, 34, 101617. [Google Scholar] [CrossRef]
- Santos-Reyes, J. Factors motivating Mexico City residents to earthquake mass evacuation drills. Int. J. Disaster Risk Reduct. 2020, 49, 101661. [Google Scholar] [CrossRef] [PubMed]
- Seddighi, H. Trust in Humanitarian Aid From the Earthquake in 2017 to COVID-19 in Iran: A Policy Analysis. Disaster Med. Public Health Prep. 2020, 14, e7–e10. [Google Scholar] [CrossRef] [Green Version]
- Dincer, O.C.; Gillanders, R. Shelter in Place? Depends on the Place: Corruption and Social Distancing in American States. Soc. Sci. Med. 2020, 269, 113569. [Google Scholar] [CrossRef]
- VanEgeren, J. 72 COVID Positive After Attending Large Event; WMTV: Madison, WI, USA, 2020. [Google Scholar]
- Andersen, L.; Harden, S.; Sugg, M.; Runkle, J.; Lundquist, T. Analyzing the Spatial Determinants of Local Covid-19 Transmission in the United States. Sci. Total Environ. 2020, 754, 142396. [Google Scholar] [CrossRef]
- Iqbal, M.M.; Abid, I.; Hussain, S.; Shahzad, N.; Waqas, M.S.; Iqbal, M.J. The effects of regional climatic condition on the spread of COVID-19 at global scale. Sci. Total Environ. 2020, 739, 140101. [Google Scholar] [CrossRef] [PubMed]
- Menebo, M.M. Temperature and precipitation associate with Covid-19 new daily cases: A correlation study between weather and Covid-19 pandemic in Oslo, Norway. Sci. Total Environ. 2020, 737, 139659. [Google Scholar] [CrossRef]
- Zhu, L.; Liu, X.; Huang, H.; Avellán-Llaguno, R.D.; Lazo, M.M.L.; Gaggero, A.; Soto-Rifo, R.; Patiño, L.; Valencia-Avellan, M.; Diringer, B.; et al. Meteorological impact on the COVID-19 pandemic: A study across eight severely affected regions in South America. Sci. Total Environ. 2020, 744, 140881. [Google Scholar] [CrossRef] [PubMed]
- Han, J.; He, S. Urban flooding events pose risks of virus spread during the novel coronavirus (COVID-19) pandemic. Sci. Total Environ. 2020, 755, 142491. [Google Scholar] [CrossRef]
- Daughton, C.G. Wastewater surveillance for population-wide Covid-19: The present and future. Sci. Total Environ. 2020, 736, 139631. [Google Scholar] [CrossRef] [PubMed]
- Poch, M.; Garrido-Baserba, M.; Corominas, L.; Perelló-Moragues, A.; Monclús, H.; Cermerón-Romero, M.; Melitas, N.; Jiang, S.C.; Rosso, D. When the fourth water and digital revolution encountered COVID-19. Sci. Total Environ. 2020, 744, 140980. [Google Scholar] [CrossRef] [PubMed]
- Kumar, M.; Patel, A.K.; Shah, A.V.; Raval, J.; Rajpara, N.; Joshi, M.; Joshi, C.G. First proof of the capability of wastewater surveillance for COVID-19 in India through detection of genetic material of SARS-CoV-2. Sci. Total Environ. 2020, 746, 141326. [Google Scholar] [CrossRef] [PubMed]
- Marko, C.; Andro, K.; Petrana, B. Stay home while going out–possible impacts of earthquake co-occurring with COVID-19 pandemic on mental health and vice versa. Brain Behav. Immun. 2020, 87, 82–83. [Google Scholar] [CrossRef]
- Twigg, J. Characteristics of a Disaster-Resilient Community: A Guidance Note; Technical Report; Department for International Development (DFID): London, UK, 2007. [Google Scholar]
- Kappes, M.S.; Keiler, M.; von Elverfeldt, K.; Glade, T. Challenges of analyzing multi-hazard risk: A review. Nat. Hazards 2012, 64, 1925–1958. [Google Scholar] [CrossRef] [Green Version]
- Asprone, D.; Jalayer, F.; Prota, A.; Manfredi, G. Proposal of a probabilistic model for multi-hazard risk assessment of structures in seismic zones subjected to blast for the limit state of collapse. Struct. Saf. 2010, 32, 25–34. [Google Scholar] [CrossRef]
- Kameshwar, S.; Padgett, J.E. Multi-hazard risk assessment of highway bridges subjected to earthquake and hurricane hazards. Eng. Struct. 2014, 78, 154–166. [Google Scholar] [CrossRef]
- Hariri-Ardebili, M.; Saouma, V. Single and multi-hazard capacity functions for concrete dams. Soil Dyn. Earthq. Eng. 2017, 101, 234–249. [Google Scholar] [CrossRef]
- Bryce, C.; Ring, P.; Ashby, S.; Wardman, J. Resilience in the face of uncertainty: Early lessons from the COVID-19 pandemic. J. Risk Res. 2020, 23, 880–887. [Google Scholar] [CrossRef]
- Hakovirta, M.; Denuwara, N. How COVID-19 redefines the concept of sustainability. Sustainability 2020, 12, 3727. [Google Scholar] [CrossRef]
- Sharifi, A.; Khavarian-Garmsir, A.R. The COVID-19 pandemic: Impacts on cities and major lessons for urban planning, design, and management. Sci. Total Environ. 2020, 749, 142391. [Google Scholar] [CrossRef] [PubMed]
- Gunter, P.U.S. Unprepared for Nuclear Accident During Pandemic. 2020. Available online: https://www.commondreams.org/newswire/2020/05/22/us-unprepared-nuclear-accident-during-pandemic (accessed on 30 May 2020).
- Zhao, S.; Lin, Q.; Ran, J.; Musa, S.S.; Yang, G.; Wang, W.; Lou, Y.; Gao, D.; Yang, L.; He, D.; et al. Preliminary estimation of the basic reproduction number of novel coronavirus (2019-nCoV) in China, from 2019 to 2020: A data-driven analysis in the early phase of the outbreak. Int. J. Infect. Dis. 2020, 92, 214–217. [Google Scholar] [CrossRef] [PubMed] [Green Version]
- Liu, Y.; Gayle, A.A.; Wilder-Smith, A.; Rocklöv, J. The reproductive number of COVID-19 is higher compared to SARS coronavirus. J. Travel Med. 2020. [Google Scholar] [CrossRef] [Green Version]
- Ochoa, Y.C.; Sanchez, D.E.R.; Peñaloza, M.; Motta, H.F.C.; Méndez-Fandiño, Y.R. Effective Reproductive Number estimation for initial stage of COVID-19 pandemic in Latin American Countries. Int. J. Infect. Dis. 2020, 95, 316–318. [Google Scholar] [CrossRef] [PubMed]
- Fraser, C.; Donnelly, C.A.; Cauchemez, S.; Hanage, W.P.; Van Kerkhove, M.D.; Hollingsworth, T.D.; Griffin, J.; Baggaley, R.F.; Jenkins, H.E.; Lyons, E.J.; et al. Pandemic potential of a strain of influenza A (H1N1): Early findings. Science 2009, 324, 1557–1561. [Google Scholar] [CrossRef] [PubMed] [Green Version]


| Element | Natural Hazard | Pandemic |
|---|---|---|
| Response | ||
| Conduct risk identification and assessment, early warning | ✓ | ✓ |
| Establish emergency broadcast service for information dissemination | ✓ | ✓ |
| Shorten decision-making process during emergency | ✓ | ✓ |
| Establish temporary shelter and evacuation centers | ✓ | - |
| Establish temporary testing sites, hospitals, and isolation facilities | - | ✓ |
| Protect vulnerable people | ✓ | ✓ |
| Establish data collection and monitoring system | ✓ | ✓ |
| Provide financial and other support to those affected | ✓ | ✓ |
| Control transboundary movements | - | ✓ |
| Coordinate different sectors, including health, transportation, hospitality and others | ✓ | ✓ |
| Coordinate research and development efforts | - | ✓ |
| Establish online education and remote health care services | - | ✓ |
| Develop economic response package | ✓ | ✓ |
| Review and update legislation on surveillance | - | ✓ |
| Develop exit (transition to recovery) strategies | - | ✓ |
| Develop medical treatment and/or vaccines | - | ✓ |
| Recovery | ||
| Restore natural and man-made environment | ✓ | - |
| Develop multi-level recovery framework | ✓ | ✓ |
| Facilitate and ensure business continuity | ✓ | ✓ |
| Ensure equality and inclusion of vulnerable groups in recovery efforts | ✓ | ✓ |
| Clear debris from important nodes and paths | ✓ | - |
| Reconstruct based on a safe building code and land use | ✓ | - |
| Strengthen community capacity | ✓ | ✓ |
| Provide mental health funding | ✓ | ✓ |
| Monitoring and evaluation | ✓ | ✓ |
| Develop strategies for new waves of disaster | - | ✓ |
Publisher’s Note: MDPI stays neutral with regard to jurisdictional claims in published maps and institutional affiliations. |
© 2021 by the authors. Licensee MDPI, Basel, Switzerland. This article is an open access article distributed under the terms and conditions of the Creative Commons Attribution (CC BY) license (https://creativecommons.org/licenses/by/4.0/).
Share and Cite
Hariri-Ardebili, M.A.; Lall, U. Superposed Natural Hazards and Pandemics: Breaking Dams, Floods, and COVID-19. Sustainability 2021, 13, 8713. https://doi.org/10.3390/su13168713
Hariri-Ardebili MA, Lall U. Superposed Natural Hazards and Pandemics: Breaking Dams, Floods, and COVID-19. Sustainability. 2021; 13(16):8713. https://doi.org/10.3390/su13168713
Chicago/Turabian StyleHariri-Ardebili, Mohammad Amin, and Upmanu Lall. 2021. "Superposed Natural Hazards and Pandemics: Breaking Dams, Floods, and COVID-19" Sustainability 13, no. 16: 8713. https://doi.org/10.3390/su13168713
APA StyleHariri-Ardebili, M. A., & Lall, U. (2021). Superposed Natural Hazards and Pandemics: Breaking Dams, Floods, and COVID-19. Sustainability, 13(16), 8713. https://doi.org/10.3390/su13168713