Case Report

The Effect of Land Management Practices on Soil Quality Indicators in Crete

1
Laboratory of Soil Science and Agricultural Chemistry, Department of Natural Resources Management & Agricultural Engineering, Agricultural University of Athens, 75 Iera Odos Street, 118 55 Athens, Greece
2
Soil Physics and Land Management Group, Wageningen University & Research, Droevendaalsesteeg 1, 6708 PB Wageningen, The Netherlands
*
Author to whom correspondence should be addressed.
Sustainability 2021, 13(15), 8619; https://doi.org/10.3390/su13158619
Submission received: 25 May 2021 / Revised: 15 July 2021 / Accepted: 26 July 2021 / Published: 2 August 2021

Abstract

:
The effects of four main practices tillage versus no-tillage, and intensive grazing versus extensive grazing, applied in characteristic agricultural and grazing lands of Crete Island were evaluated in situ using nine soil quality indicators. The following nine representative indicators of soil quality were evaluated using the rapid visual assessment methodology adopted at European level in the context of the EU research project iSQAPER: susceptibility to water and wind erosion, surface ponding (under cropping), formation of tillage pan, soil color, soil porosity, soil structure, susceptibility to slaking, infiltration rate, and biodiversity status. These indicators were measured in 48 agricultural field-plots to adequately represent the four above-mentioned practices and the different types of geomorphological patterns existing in the area. Additionally, 38 agricultural fields were sampled in the topsoil to assess cultivation practices (tillage, no-tillage) on soil organic carbon, cation exchange capacity, exchangeable potassium, available phosphorous, and soil aggregate stability. Based on the indicators rating methodology, the appropriate statistical tests were applied and the soils under different managements were characterized in terms of their potential quality and their general agricultural value. The obtained data showed that in agricultural areas, significant differences were detected between tillage and no-tillage management practices for the indicators of soil structure and consistency and infiltration rate. In grazing land, significant differences were found for the soil quality indicators of susceptibility to erosion and infiltration rate for the corresponding practices of intensive and extensive grazing. Organic carbon content, exchangeable potassium content and aggregate stability were greatly affected in tillage versus no-tillage management practices.

1. Introduction

The concept of soil quality was first introduced by Mausel [1] as totally connected with the yields of the most profitable crops of the local region under high level of land management. Subsequently, Doran and Parkin [2] included biomass production as a soil quality function and linked the quality of soils with their inherent and difficult to change properties, inferred from characteristics related to those suggested by soil taxonomy. Larson and Pierce [3], considered the connection of soil quality with productivity a very narrow form that cannot embrace soil’s contribution to environmental quality. Several studies carried out in early nineties [4,5,6], have supported that environmental quality as well as the human and animal health are the main three broader components that synthesize the concept of soil quality. The National Research Council of United States [7] regarded soil quality as the soil’s capacity to enhance plant growth without aggravating water and air pollution. Warkentin [8], combining the previous approaches, considered soil quality as the basic concept for sustainable agriculture while Karlen et al. [9] focused on the importance of the interaction between several soil attributes and land management characteristics. Bredja et al. [10] more dynamically defined soil quality as the combination of soil’s physical, chemical, and biological properties that are of high sensitivity in various changes of soil conditions.
The way the land is used and the management systems that are applied can differentiate the level of soil quality or maintain it in a stable condition [11,12]. The different land use types and the various agricultural practices influence the physical, chemical, and biological properties, affecting soil quality [13]. Lal [14] considers tillage and grazing as anthropogenic interferences which intensify various natural degradative processes resulting in soil erosion, compaction, reduction in soil’s biodiversity, crusting, etc. According to Gregorich et al. [15] and Yu et al. [16], intense tillage has a great impact on lowering soil organic matter content due to its contribution to soil organic carbon mineralization and through soil erosion sediment losses. Additionally, tillage intensity significantly affects the components of soil structure like soil aggregate stability, porosity, soil biodiversity, etc. [14]. Tillage systems also contribute to soil compaction, an additional soil threat, resulting in low aggregate stability and consequently less stable soil structure in contrast to no-tillage (zero tillage) management [17]. Soils under no tillage management are protected by vegetative surface residues, resulting in less intense wet-dry circles [18] which promote soil dispersion or slaking [19,20].
Unsustainable grazing is considered as a serious environmental degradation cause in natural areas and as a key factor to desertification in lands unfavorable for agriculture [21]. Animal trampling, in arid or semi-arid climate regimes, mainly causes soil compaction, deteriorating crucial soil surface physical properties such as soil bulk density, soil water content, proportion of stable aggregates, and the infiltration rate [22,23,24,25,26]. Sustainable grazing, in contrast to unsustainable grazing, maintains a moderate annual vegetation cover valuable in reducing water runoff, sediment losses, and evaporation of soil water [27,28]. Grazing management systems, depending on their design and implementation, can cause negative, positive, or neutral impacts on rangelands [29].
Soil quality and soil functioning are related to the conditions and processes occurring in soils, and this can be reflected through the analysis and quantification of various physical, chemical, and biological properties. An important physical soil property is the infiltration rate which affects both the ability of the soil profile to provide water to the crops and to reduce soil erosion [30]. A decreased infiltration rate induces water ponding and surface water run-off, contributing to enhanced soil erosion and reduced soil fertility [31]. Soil surface water ponding has a great impact on soil salinization, since the presence of ponding spots do not allow leaching of the previously concentrated salts at the topsoil [32]. The biological activity of earthworms creates macropores promoting both water infiltration into deeper soil horizons [33] and preferential water flow [34,35,36]. The biotic processes induced by earthworms contribute to stabilization of soil structure [37], creating a biologically active soil with stable aggregates closely associated with high porosity [38]. Bünemann et al. [39] considered earthworms as a biological indicator for soil quality.
Soil color is a dominant morphological feature which depicts pedogenesis and provides valuable clues of other soil properties such as mineral composition and processes of soil formation [40]. According to Ahukaemere et al. [41], the dark brown color of soils reflects high organic matter content, which is related with strong soil aggregation and high fertility status. Aggregate stability, which strongly depends on clay and organic matter content [42], highly affects soil slaking, resulting in negative consequences to water infiltration rate, water run-off, and soil sediment loss [43,44,45].
The presence of a tillage pan negatively affects biomass productivity, preventing the deep percolation of water and penetration of roots [46]. In addition, a tillage pan has adverse effects on water infiltration resulting in subsurface lateral flux against the preferential vertical flow [47]. Soils with high content in organic matter present less susceptibility to water and wind erosion [48], because of the fundamental role that organic matter has in soil’s infiltration capacity, water holding capacity, and in aggregation stability [49,50,51,52]. According to Sánchez-Navarro et al. [53], the porosity and soil’s available water are regarded as the most representative physical indicators to soil quality under Mediterranean conditions. Rabot et al. [54] evaluated the potential of observable soil structural attributes in soil functioning assessment.
In accordance with the official definition of Sustainable Soil Management (SSM) [55] adopted by EU [56], a recommended set of indicators for the assessment of SSM has been proposed by the Food and Agriculture Organization of the United Nations [57]. Recognizing this need, the present work aims at providing a set of soil indicators for an easy and rapid assessment of the quality of agricultural soils, evaluating at the same time two different pairs of land management practices. In the framework of the EU research project iSQAPER (European Union’s Horizon 2020 Programme for research & innovation under grant agreement no 635750) the following nine representative soil quality indicators were visually assessed on agricultural soils and grazing land: susceptibility to water and wind erosion, surface ponding—under cropping, formation of tillage pan, soil color, soil porosity, soil structure, susceptibility to slaking, infiltration rate, and biodiversity status. The study was carried out under four different land management practices, namely tillage versus no-tillage, and intensive grazing versus extensive grazing which are dominant in the island of Crete (Greece). Based on the indicator ratings, the soils were characterized in terms of their potential quality to estimate their general agricultural value. Additionally, a set of analytical soil data of representative agricultural soils under tillage versus no-tillage treatments were used to test the sensitivity of soil indicators in evaluating soil quality.

2. Materials and Methods

2.1. Study Area

The broad study area of Crete Island is bordered to the north by the Sea of Crete and to the south by the Libyan Sea. It covers an area of 8336 km2. Cultivated land covers 42.0% of the total island, while dryland, used mainly as pasture, is the next important ecosystem, covering 39.3% of the total area. The island is characterized as a sloping land with slopes greater than 12% in 79.5% of the area, and only 6.9% comprises lowlands with slope less than 6%. Τhe annual rainfall ranges from 262 mm yr−1 to 978 mm yr−1 in the low areas along the coast. In the mountainous areas rainfall ranges from 551 mm yr−1 to 1836 mm yr−1. Crete lies between the isotherms 18.5 °C to 19 °C with an annual amplitude of 14 °C to 15 °C.
The soils of the study fields present a variety of chemical and physical properties. They have been formed in a variety of parent materials such as limestone, shale, marl, conglomerates, flysch, and alluvial deposits. The soils are mainly characterized as moderately fine-textured (clay loam, silty clay loam), followed by fine (clay, silty clay), medium (loam), and coarse (sandy loam). The study fields are mainly characterized from slightly sloping (slope 2–6%) to steep (slope greater than 60%). The soils are characterized as shallow (depth 15–30 cm) to very deep (depth > 150 cm). Organic matter content in the surface A-horizon ranges from 0.5% to 8.6% depending on the land use, parent material, and land management practice. The soils present various degrees of development. Cambisols are widely extended in the study fields followed by Calcicols, Leptosols, Luvisols and Regosols. Cambisols are mainly formed on a variety of parent materials such as marl, conglomerates, flysch, and shale. Regosols are formed mainly on conglomerates parent material. Leptosols are located in mountainous areas, used mainly as grazing land. Fluvisols and Luvisols are mainly located in plain areas covering few cases of the study fields. Climatic and soil characteristics accompanied by the EU policies on subsidizing crops in the last decades have greatly favored the extensive growth of olive and vine plantations in the area providing higher farmer’s income. Orange plantations and vegetables growing in greenhouses have been mainly expanded in the lowlands of the island. The intensification of agriculture resulted in accelerated rates of soil erosion in the hilly areas of the island. The following land management practices are mainly applied in the area of Crete:
(a)
Intensive cultivation of the land accompanied by disk harrowing and application of fertilizers and pesticides;
(b)
Integrated land management in olive groves by applying measures for environmental protection;
(c)
Organic farming in vegetables and olive groves;
(d)
Overgrazing in pasture land.

2.2. Collection of Quantitative and Qualitative Soil Data

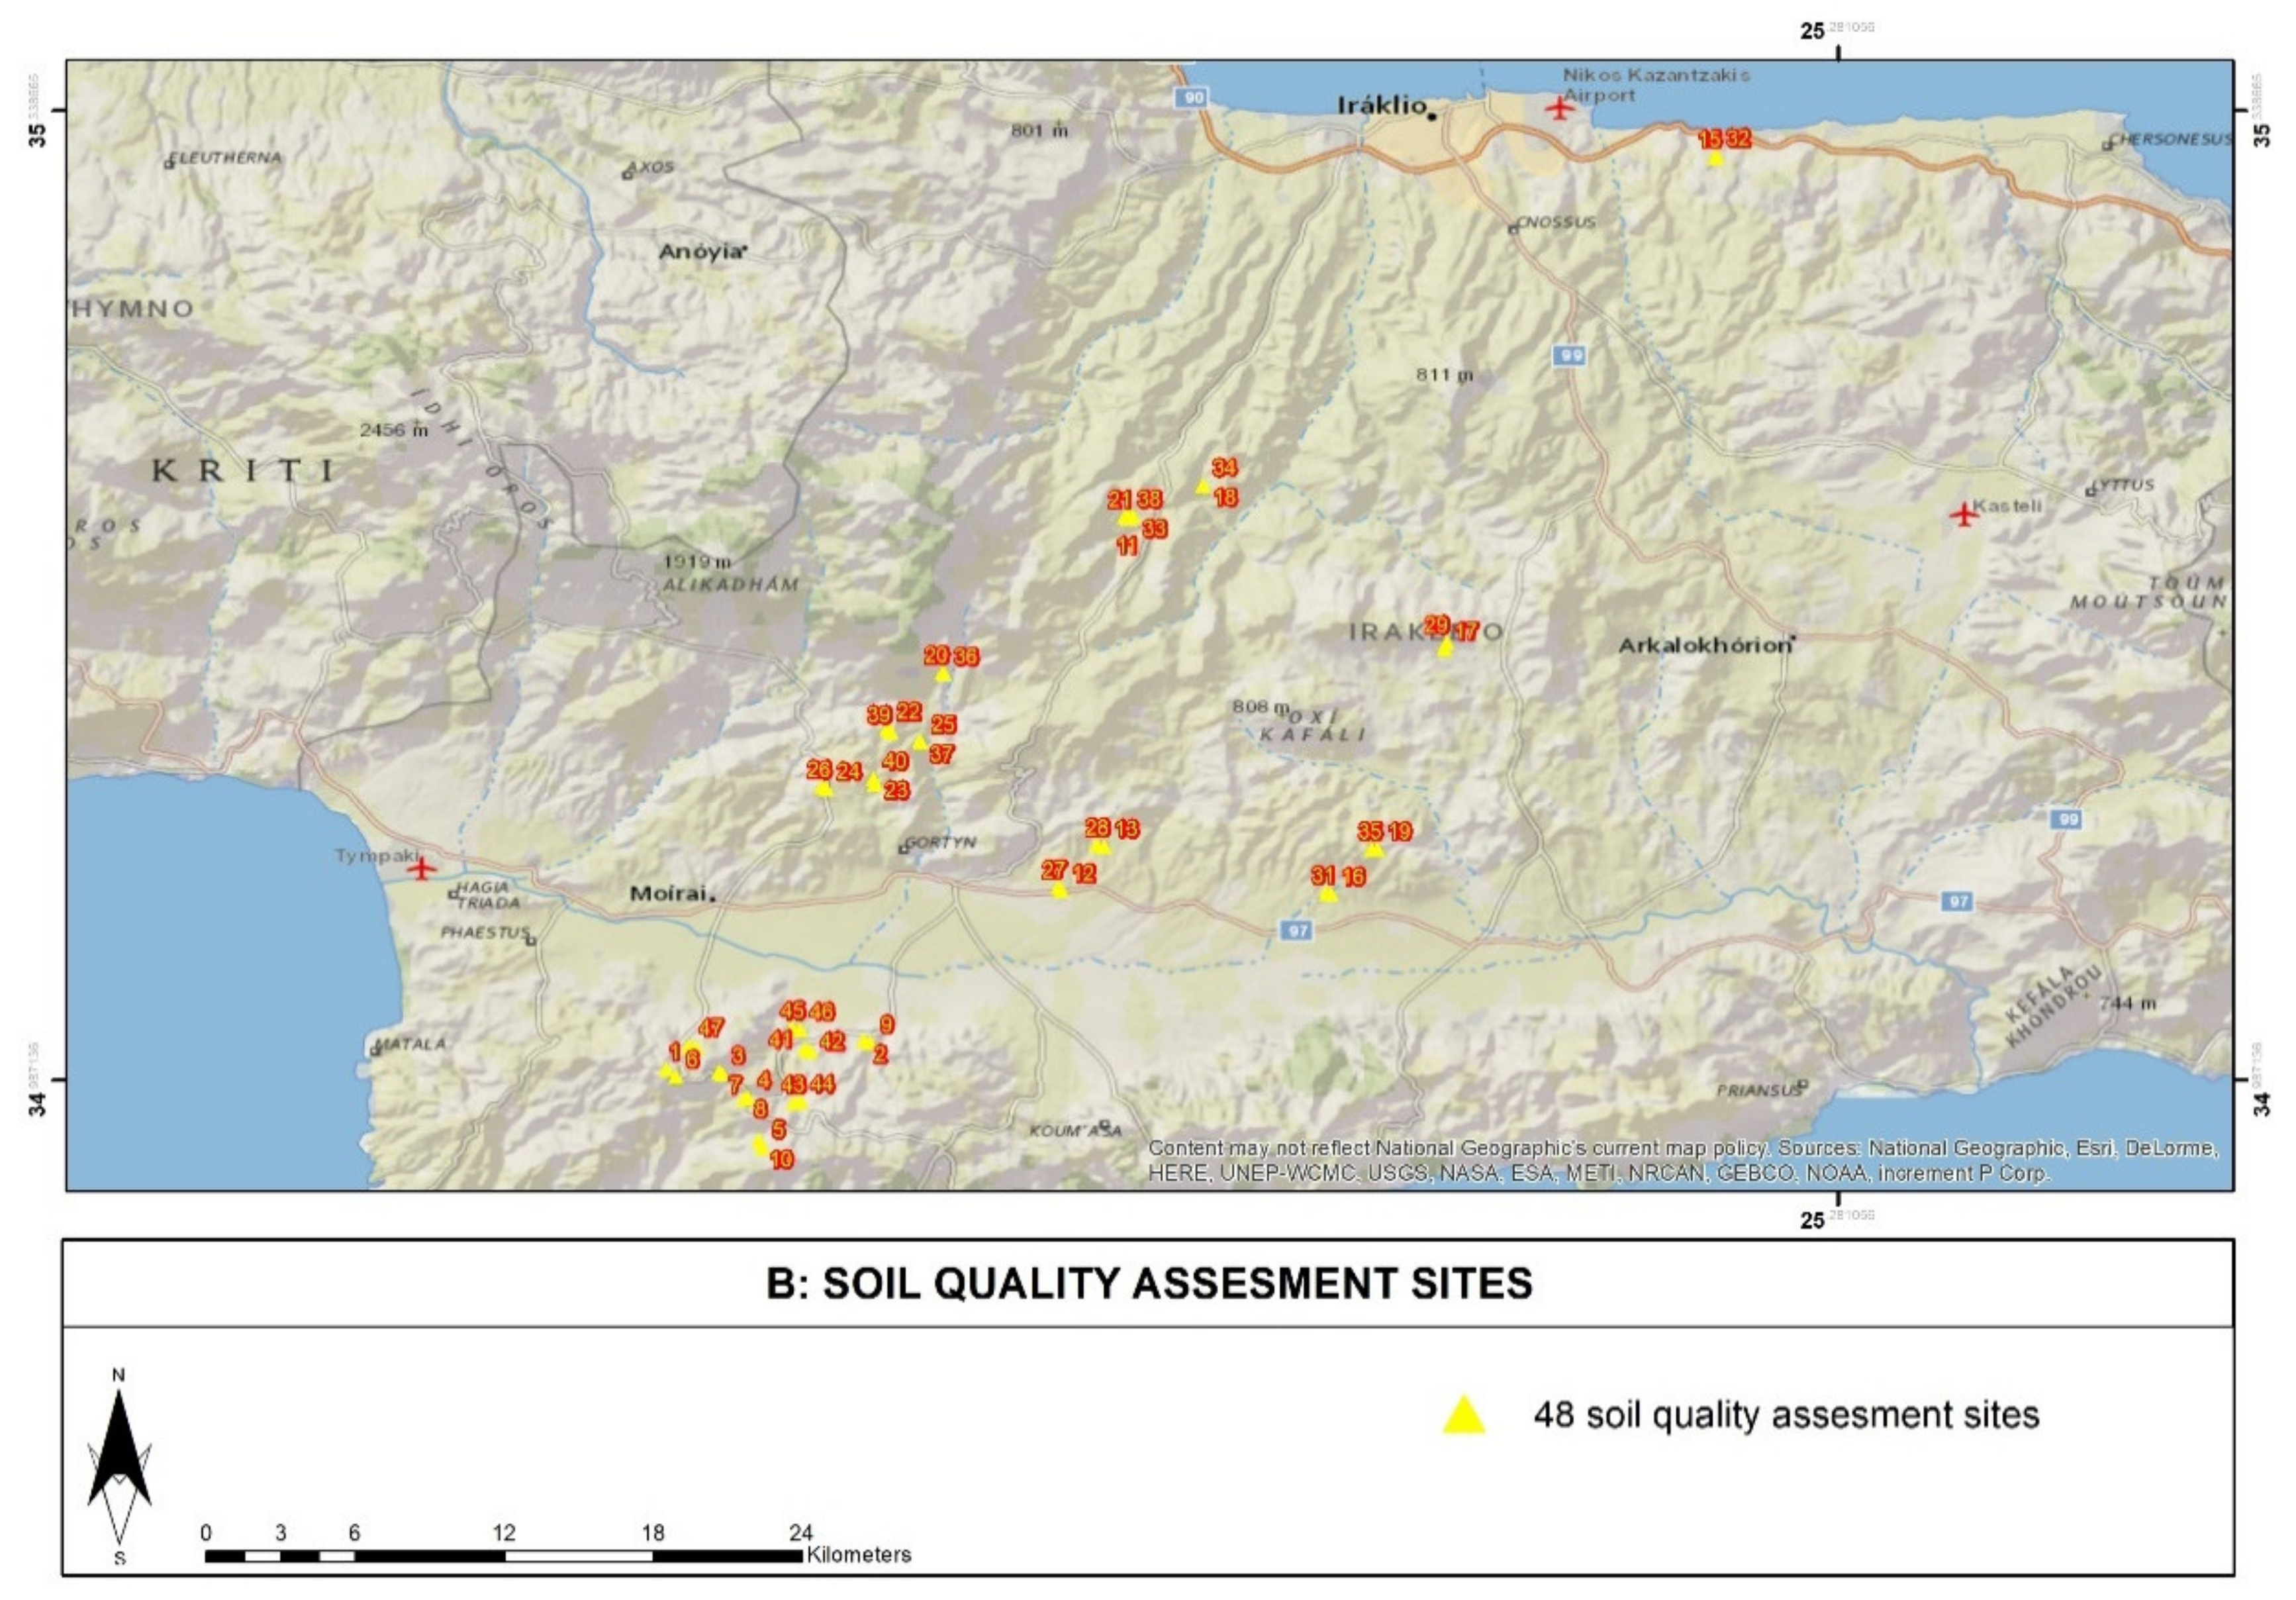
A representative part of Crete island in terms of applied agricultural practices and main land uses was chosen for testing, sampling, and evaluating the soil quality indicators affected by the applied land management practices. Specifically, 48 agricultural fields (plots) (
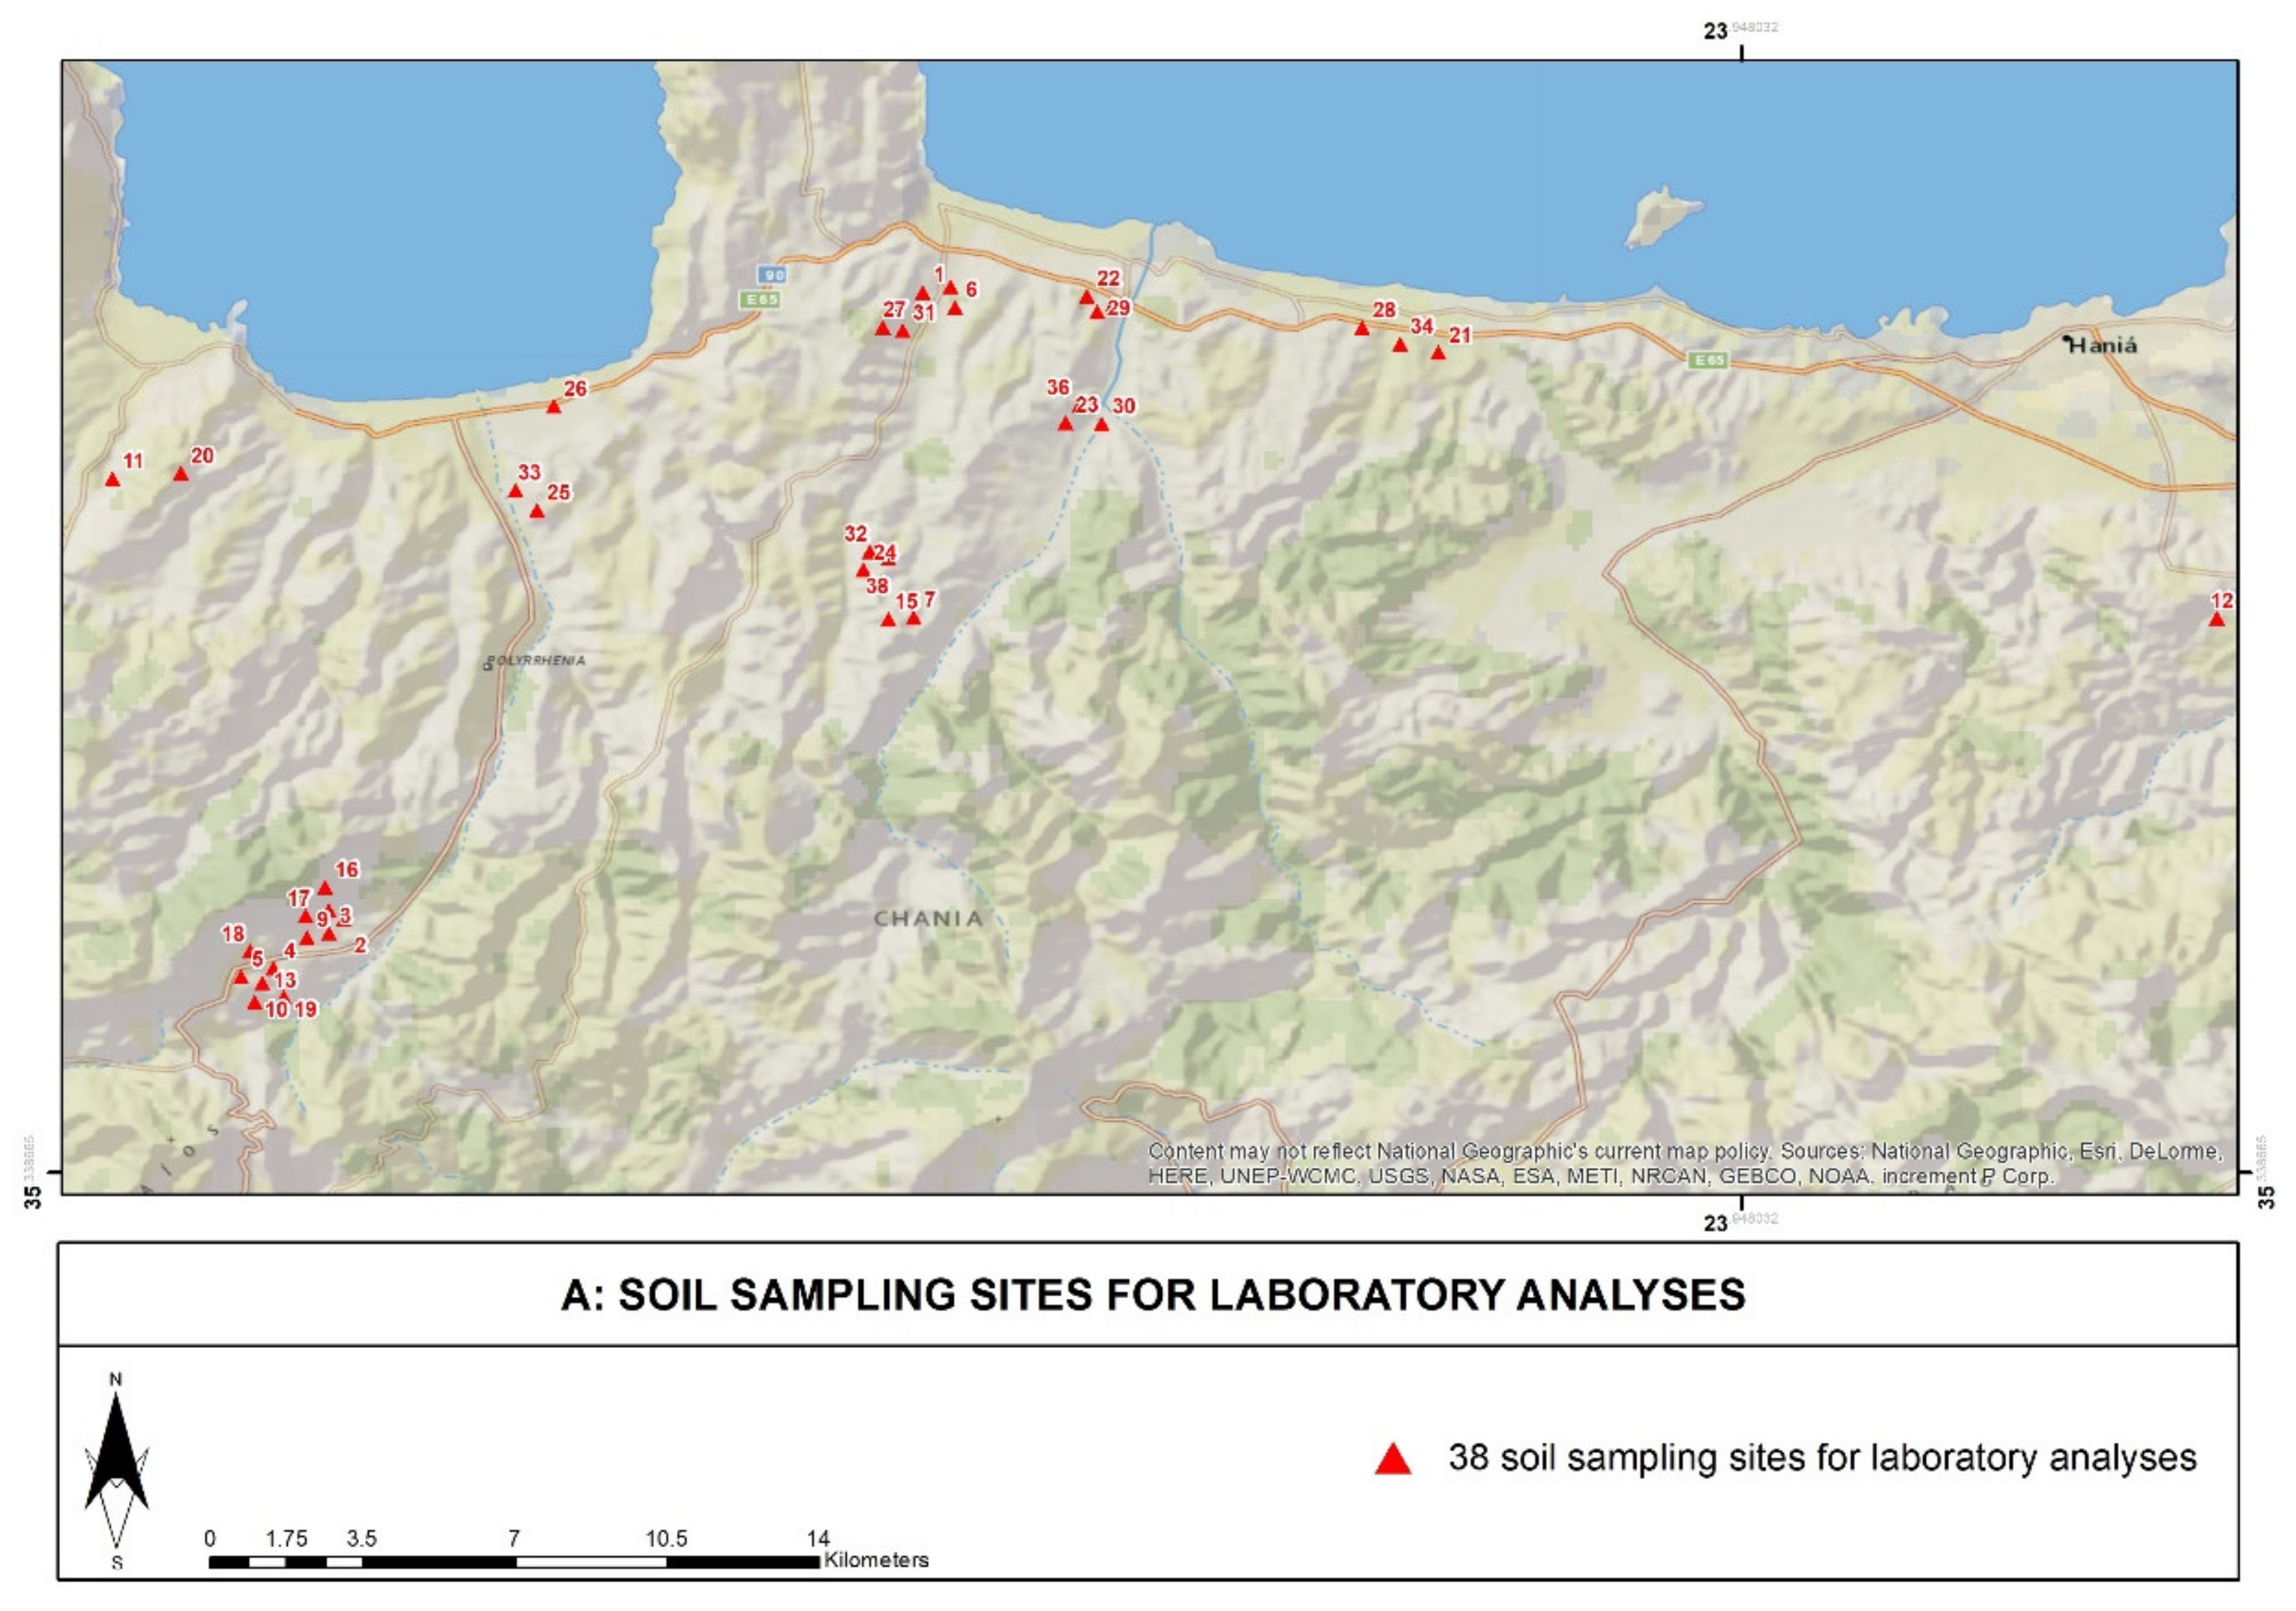
Figure 1) subjected to 4 different agricultural management practices were selected for rapid assessment of soil quality indicators. The selected study fields are located in the municipalities of Phaistos, Gortyna, Archanon, Asterousia, Heraklion, and Hersonissos of the Heraclion region. Furthermore, other 38 representative agricultural fields under tillage versus no-tillage management practices were sampled in the topsoil and used to correlate soil quality with cultivation practices. These fields are located in the western part of Crete in the municipalities of Kissamos and Platanias of the Chania region (Figure 1).
The selected 48 field plots were chosen to be representative of the two main agricultural land uses, namely cropland and pasture land, subjected to the following four principal management practices (a) tillage, (b) no-tillage or minimum tillage in agricultural land, (c) intensive grazing, and (d) extensive grazing applied in pasture land. Furthermore, the 48 field plots have been selected to be taxonomically identical by pair, including the same topographic and geomorphic conditions, and soil taxonomical properties. Fifteen pairs of the 48 plots (30 fields) correspond to cropland under tillage and no-tillage management practices in each pair of field plots. The remaining 9 pairs of the 48 plots (18 fields) correspond to grazing land including intensive and extensive grazing management practices in each pair of field plots.
Soil quality in each field plot was evaluated using the nine representative soil quality indicators described and visually scored in the field following the methodology developed by the EU research project iSQAPER (https://www.isqaper-is.eu/soil-quality/visual-soil-assessment, accessed on 3 November 2020). The scores of each indicator ranged among three evaluation levels: “0 for bad condition”, “1 for moderate condition”, and “2 for good condition” through a set of representative and characteristic photos to each soil indicator state. The scores of the nine indicators assessed in each pair of field plots were compared and a composite soil quality index was calculated by summing all positive and negative effects of each soil variable [58].
The selected soil quality indicators were the following: susceptibility to water and wind erosion, surface ponding (under cropping), tillage pan, soil color, soil porosity, soil structure and consistency, slaking test (aggregate stability), infiltration rate, and biodiversity (earthworms density) The scoring of the susceptibility to wind erosion was based on visual observations and whether the soil material was stable in the field or it was dispersed by the wind in the wider area considering the size of the dust plumes emanated from the cultivators on windy days. Water erosion was estimated by observing the differences in topsoil’s depths between the crest and the bottom of the slope and by recording the amount of sheet and rill erosion, as well as the sedimentation into surrounding drains and streams. The period elapsed (in days) until rain water logging spots disappeared from the soil surface determined the degree of surface ponding. Tillage pan was estimated visually by the presence and degree of soil structure in combination with the compaction state of the subsoil. The visual scoring of soil color was based on the differentiation of the value of soil color, subjecting the higher score to the darker colored topsoil. Soil porosity was estimated visually by recording the presence of macropores using a set of representatives to soil structure development (photographs). The scoring of soil structure and consistency was achieved according to the distribution and the size of aggregates as well as to the degree of clodding. Soil susceptibility to slaking was tested and scored by a slaking test, assessing the ability of soil to maintain its structure when it is subjected rapid wetting placed into a container of water. The indicator infiltration rate was measured by using the experimental method developed in Bern University [59]. The earthworm density was determined by hand-counting of the population of earthworms that appeared in a soil volume of 20 cm3. In each study field spot, measurement of each indicator was carried out by two or three independent experts recording two or three scores for each indicator. Finally, the recorded scores for each indicator were averaged in one value.
For further characterization of the study site, laboratory analytical data, representative for tillage versus no-tillage cultivation practices, were used supplementarily, corresponding to soil samples that had been taken from the A-horizon of the above-mentioned, non taxonomically related, 38 sites (Figure 1). The selected soil samples had been air-dried and sieved to 2 mm mesh for the subsequent laboratory analyses. The following chemical and physical soil properties have been determined: total organic carbon (TOC) determined by the Walkley–Black wet oxidation method [60]; exchangeable potassium (Ex.k) extracted by NH4OAc (1Μ, ΝH4OAc, pH 7) [61]; cation exchange capacity (CEC) determined at pH 7 by ammonium acetate [62]; aggregate stability determined by the Mean Weight Diameter (MWD) throughout wetting and sieving processes [63,64,65,66,67,68] available inorganic ortho-phosphate (Av.P) (PO4-P) by extraction with 0.5 N sodium bicarbonate solution adjusted to pH 8.5 [69].

2.3. Statistical Analysis

According to the used methodology, the obtained data on soil quality indicators belong to the hierarchical scale (qualitative data) of data measurement levels, given that in this subjective scale of scoring there is no objective (quantitative) distance between any two of its points. According to the nature of the data and the purpose of the present work, which was to investigate the impact of the different land management practices on soil quality indicators, the most appropriate statistical test for analyzing the qualitative data is the Wilcoxon Matched Pairs Signed Ranks Test [70]. This test is a non-parametric equivalent of the paired t-test and is used for ordinal scale data (qualitative) that they cannot support the assumptions of normal distribution. The Wilcoxon Matched Pairs Signed Ranks Test treats qualitative data as if they had arisen from an experimental design which was developed to study specific properties of a taxonomically identical couple (pair) of biological material before and after the application of a particular treatment and evaluates group differences of the paired observations with attention to medians. The null hypothesis of the Wilcoxon Matched Pairs Signed Ranks Test is that there are no statistically significant differences in the examined properties between the component units of a pair undergoing different treatments [70]. The obtained data were appropriately ordered per agricultural management practice and per soil quality index to apply the Wilcoxon Matched Pairs Signed Ranks statistical test using the open-source integrated development environment for statistical computing and graphics RStudio v. 1.2.5042 (RStudio Team (2020). RStudio: Integrated Development for R. RStudio, PBC, Boston, MA URL http://www.rstudio.com/; accessed on 3 November 2020).
In contrast to the qualitative data of the rapid assessment methodology for soil quality indicators, the laboratory analytical data of the five soil parameters (MWD, SOM, Ex.K, CEC, Av.P) are quantitative and belong to the interval scale of data measurement levels. Thirty-eight random fields were selected with unique criterion the application of specific cultivation practices (tillage versus no-tillage) in the various but representative geomorphological and land use types of the agricultural soils in Crete. Therefore, by the nature of the specific plots’ selection, the fields are independent of each other or they are not taxonomically related. To assess the effect of the aforementioned cultivation practices on soil quality, through laboratory analyses measurements of parameters, the two samples unpaired t-test was used. The specific statistical test compares the means of two independent or unrelated groups to determine significant differences [71]. The null hypothesis of the two samples unpaired t-test is that there are no statistically significant differences in the examined soil parameters between the two groups undergoing different treatments [72]. The obtained data were appropriately ordered per agricultural management practice and per soil parameter to apply the two samples unpaired t-test using the open-source integrated development environment for statistical computing and graphics RStudio v. 1.2.5042 (RStudio Team (2020). RStudio: Integrated Development for R. RStudio, PBC, Boston, MA URL http://www.rstudio.com/; accessed on 3 November 2020).

3. Results

3.1. Description of Indicators

3.1.1. Susceptibility to Wind and Water Erosion

In agricultural land, independently of the applied land management practices, the indicator susceptibility to wind and water erosion was rated mainly as moderate (15 cases) followed by low or no susceptibility (9 cases) and high susceptibility (6 cases) (Table 1). If the data are distinguished in terms of the applied land management, no tillage management presented mainly low or no susceptibility to wind and water erosion (8 cases), followed by moderate susceptibility class (6 cases) and high susceptibility class (1 case). However, if the tillage management practice is considered, the class of moderate susceptibility to wind and water erosion was recorded in nine cases, followed by high susceptibility in five cases, and only one case characterized with low or no susceptibility to erosion.
In grazing land, independently of management practice, the main class of wind and the water erosion was moderate (12 cases), followed by both high and low or no susceptibility with the same scores (3 cases). If the obtained data are classified according to land management practices, extensive grazing ranged from moderate susceptibility (6 cases) to low or no susceptibility (3 cases), while intensive grazing ranged from moderate susceptibility (6 cases) to high susceptibility (3 cases).

3.1.2. Surface Water Ponding

Surface water ponding was rated as good (cases 29 out of 30) (no ponding) in agricultural land due to the inclination of the land in the majority of the study cases, independent of tillage or no tillage management practice. Rain water in sloping land is temporarily ponded in small spots until surface water runoff is initiated. Similarly, in grazing land, no water ponding was recorded in all study field plots (18 of 18 cases) regardless of extensive or intensive grazing.

3.1.3. Tillage Pan

The majority of the agricultural study field plots (24 cases) have formed a tillage pan rating with a moderate degree of formation, while in some field plots (6 cases), no tillage pan was identified. The rating of the index in relation to the applied management practice showed that no tillage management mainly led to a moderate formation of tillage pan (11 cases), while in some fields (4 cases), no tillage pan formation was observed. A slightly worse rating of the index was recorded under the tillage management practice, with thirteen cases classified as having moderate tillage pan formation and only in two cases of no tillage management a pan was observed.
In grazing land, independently of management practice, no tillage pan was observed in the majority of the cases (13), or in some cases (5), a moderate degree of tillage pan formation was recorded. If the obtained data are distinguished on the basis of management practice, in both cases extensive or intensive grazing, the absence of tillage pan formation was observed in seven and six cases, respectively. In a few cases, the formation of a tillage pan (2 cases for extensive grazing and 3 cases for intensive grazing) was observed.

3.1.4. Soil Color

In the majority of the study field sites in agricultural areas (9 pairs), soil colour was rated by one degree higher in fields under no tillage practices compared to fields subjected to tillage operations. Under the no tillage practice, a moderate dark colour was mainly recorded (9 cases), while the rest of the study fields were classified as having a darker colour (6 cases). Fields under the tillage practice presented mainly a moderate dark soil colour (9 cases) with only two fields having a darker soil colour, while the remaining fields (4 cases) had significantly lighter soil colour.
Similarly, in most of the study fields in grazing land, the colour of the soils under extensive grazing have been characterized as being darker by one degree in six pairs of the field plots. In eight fields of the extensively grazed area, the topsoil colour was dark, and only in one field was the soil colour lighter, belonging to the moderate class. In the opposite, fields under intensive grazing showed only three cases of dark soil colour and six cases with a lighter soil colour rated in the moderate class.

3.1.5. Soil Porosity

The obtained data on soil porosity showed that the dominant classes in agricultural land were moderate and good recorded in thirteen and eleven cases, respectively, independent of the applied management practices. Concerning the management practice of no tillage, in nine fields, the good class was identified, characterized by many macropores between and within aggregates. In addition, under the same management practice, the number of macropores have been declined significantly in six field plots, classified in the moderate class. In contrast, under the tillage management practice, the situation of soil porosity was worse, with only two fields being classified as good, while in seven fields soil porosity was characterized as moderate and as poor in six cases (absence of soil macropores).
In general, the same trend was observed in grazing areas with moderate and good ratings in ten and eight cases, respectively. Specifically, in extensively grazed areas, seven sites were classified as having good class of soil porosity, while only two fields showed a moderate class. In contrast, intensive grazing presented eight fields of moderate soil porosity conditions and only one field was under a good condition of soil porosity.

3.1.6. Soil Structure and Consistency

In agricultural land, thirteen fields were characterized by good soil structural state, eleven presented a moderate class, and six fields presented with poor soil structure. The soil structure in soils under no tillage practice was rated one class higher in the majority of the study field sites (cases 10 out of 15) compared to fields under tillage practice. The poor soil structure class was identified in six cases under tillage management practice.
The soil structure condition in grazing land was characterized in nine fields as good, in eight fields as moderate, and only in one case as poor. In all cases except one, the soil structure was rated one degree higher in extensive grazing compared to intensive grazing.

3.1.7. Susceptibility to Slaking

The stability of soil aggregates assessed by slaking in agricultural land was characterized mainly as good in twenty-three cases, followed by the moderate class in five cases, and as poor in two cases. Soils under no tillage practice were characterized mainly by good soil aggregate stability in twelve cases and only in three cases as moderate. Almost the same pattern was observed in fields under tillage management practices, with the good class identified in eleven cases, while two cases were moderate, and two cases with poor structure stability were assessed. Only in three pairs of fields, the tillage practice had a lower rating by one degree compared to no tillage. In grazing land, the soil susceptibility to slaking was rated as good in most of the cases (8 out of 9, both in extensively and intensively grazing).

3.1.8. Infiltration Rate

The infiltration rate in agricultural land was mainly classified as moderate (17 cases) with several field plots (12 cases) of low ratings and only one case of a high rating. Regarding the indicator status according to the cultivation practices, no tillage management rated mostly in the moderate class (11 cases), followed by the two other classes of low (3 cases) and high (1 case). Soils under tillage management practice were mainly classified with a low score for infiltration rate (9 cases), while the class of the moderate was observed in 6 cases.
The infiltration rate in the soils of grazing land was mainly rated as moderate (12 cases), while in some fields, the infiltration rate was characterized as high (4 cases) or as low (2 cases) status. The studied grazing management practices showed different responses of the indicator. Extensive grazing ranged from moderate (5 cases) to high infiltration rate (4 cases), while under intensive grazing, the moderate infiltration rate was the dominant class (7 cases), followed by low infiltration rate recorded only in two cases.

3.1.9. Biodiversity

Earthworms have been recorded only in cropland in twenty-one cases. Under no tillage practice, the biodiversity was characterized as good in two cases, while the moderate class was identified in ten cases. Under tillage management practices, the moderate class of biodiversity was characterized as dominant in nine cases. In the opposite, the biodiversity in grazing land was characterized mainly as poor (seven cases in extensive grazing and eight cases in intensive grazing), with only three fields of moderate condition (2 cases in extensive grazing and 1 case in intensive grazing).

3.2. Statistical Analysis Results

The Wilcoxon matched pairs signed ranks test was applied for the statistical analysis of the obtained forty-eight (48) qualitative data of the nine (9) representative soil indicators. Since the Wilcoxon test is mainly used to cross check the differences in medians of paired observations, the distribution of the differences of the observations must be symmetrical around the median. According to the visual symmetry checking of distributions, as far as tillage and no-tillage treatments of the agricultural areas were concerned, it was inferred that in a strict manner, paired differences had come from a continuous symmetrical distribution only for the indicators soil porosity, soil structure, and infiltration rate. Significant differences were detected between the control fields (tillage practice) and the fields of no tillage application for the indicators soil porosity, soil structure and consistency, and infiltration rate (Table 2).
The application of Wilcoxon test in grazing land for intensive and extensive grazing practices detected, in a strict manner, paired differences for a continuous symmetrical distribution only for the indicators susceptibility to erosion, surface ponding, biodiversity, and infiltration rate indices. Furthermore, the indicators of susceptibility to wind and water erosion, and infiltration rate presented significant differences between the paired field plots with intensive and extensive grazing practices (Table 3). The indicators of surface ponding and biodiversity were not statistically processed due to low variation of their values (Table 3).
Based on the nine soil quality indicators, the composite soil quality index was determined. The obtained data showed that land management practice had a great impact on the general soil quality index (Table 1). In the majority of the studied field plots, no tillage has positively affected soil quality. The composite soil quality indices were greater in thirteen pairs out of fifteen pair plots in cropland. Furthermore, extensive grazing had positively affected soil quality in the majority of the study field plots (8 cases out of 9) compared to intensive grazing. For the needs of the present publication, the obtained values of the composite soil quality index were grouped in the following three classes: poor < 0.8, moderate 0.8–1.4, and good > 1.4. According to this classification, the soil quality of the study field plots in cropland can be mainly characterized as moderate in eighteen cases, followed by good in eight cases, and poor in four cases. Similarly, in the grazing land, soil quality is mainly evaluated as moderate in twelve cases, followed by good quality in six cases.
For the application of the unpaired two samples t-test, it was prerequisite to check the normality of distributions and the equality of variances [71] of the five analyzed (Table 4) soil parameters (Mean Weight Diameter—MWD, Soil Organic Matter—SOM, Cation Exchange Capacity—CEC, Exchangeable Potassium—Ex.K, and Available Phosphorus—Av.P). For that purpose, the Shapiro–Wilk test was applied for checking the normality of the data [72,73] and the F-test for assessing the equality of variances [74]. The analysis of the data by applying Shapiro–Wilk and F tests showed that only the parameter of available phosphorus was rejected (Table 5 and Table 6). Therefore, the data populations for the following four parameters MWD, SOM, Ex K, and CEC are normally distributed, while the variances between the land practices of tillage and no tillage are equal for the same parameters. Therefore, it was plausible to apply the two samples unpaired t-test only for the previously mentioned four soil parameters. Finally, the application of the two samples unpaired t-test showed that the means of two land management practices (tillage versus no tillage) were statistically significantly different for the parameters MWD, Ex.K, and SOM, while the difference was insignificant for the parameter CEC (Table 7).

4. Discussion

The obtained data have shown that the applied land management practices in agricultural and grazing land had in various degrees affected the analyzed nine indicators. In the agricultural land, the change of agricultural practice from tillage to no tillage had mainly positively affected the studied indicators and the soil quality index. The analysis of the scores showed slight differences for the indicators formation of tillage pan, susceptibility to slaking, and biodiversity or medium for the indicators susceptibility to water and wind erosion, infiltration rate, soil color, soil porosity, soil structure, and consistency.
Tillage pan is mainly related to cultivation. The use of heavy machineries for cultivation under relatively wet soil conditions favored the formation of a compacted subsurface soil layer underlying the plough soil layer. The recorded small differences in the rating of tillage pan index between the tillage and no-tillage practices may be attributed to the tillage management practice applied almost in the whole land in the previous decades. The study area is mainly cultivated with olive trees. For various reasons, farmers have realized that it is more profitable (economically and environmentally) to keep olive plantations under a no tillage practice. However, tillage pans were already formed but not further aggravated. The same explanation could justify the small differences observed in the rating of the soil susceptibility to slaking (slaking test) between no-tillage and tillage management in agricultural areas.
The medium differences in the rating of susceptibility to water and wind erosion, between tillage and no tillage practices, can be mainly attributed to the topographic conditions and the existing land use type. The study area is mainly sloping with various degrees of inclination, cultivated mostly with olive trees. Long term soil erosion experiments carried out in the study area have shown that water erosion is greatly limited, especially under no tillage management practice in olive groves, supporting the findings of the present study [75]. Farmers used to till the soil during February or March, creating favorable conditions for water erosion, especially in the intermediate unprotected soil zone by the stem of successive trees.
Land management practices have affected the indicator infiltration rate. Medium differences of rating between tillage and no-tillage management are mainly attributed to poorer soil porosity and soil surface crusting under tillage, formed after intensive rainfall events. Furthermore, soil porosity index has been related to the soil structure development index. Soils with good macroporosity usually had good structural development. In addition, soil porosity and, therefore, soil structure and consistency were related to land management practices. No tilled soils had better porosity and soil structure than tilled soils. Statistically, only the soil structure and consistency and the infiltration rate indices were significantly different under tillage versus no-tillage management practices of agricultural areas
Soil colour, and particularly soil darkness, is mainly related to the amount of organic matter content. Organic matter content is affected by soil characteristics (soil texture drainage conditions, etc.), climate (rainfall, air temperature), land use (annual, perennial), and land management practices. Most of the studied agricultural field sites are located on the same parent material (marls, conglomerates) under similar climatic conditions and the same land use type (olives). Therefore, land management practices had a big impact on soil colour. No tillage management practice favors both nil water erosion and the growth of understory annual vegetation, resulting in increased soil organic matter content.
Soil biodiversity in agricultural land, defined only by the number of earthworms, has been affected in the study area by various factors such as land use and management practice, soil characteristics, and climate. The climatic conditions in the study area of Crete are largely adverse for long periods of the year, particularly considering the distribution of rainfall. Due to the lack of significant amounts of rains from April until October, the soil in the upper layers remains dry, creating unfavorable conditions for earthworm growth. Therefore, the use of this indicator for assessing soil quality imposes limitations of measurement. However, statistically significant differences were found only for the indicators soil structure and consistency and infiltration rate between the management practices of tillage versus no-tillage.
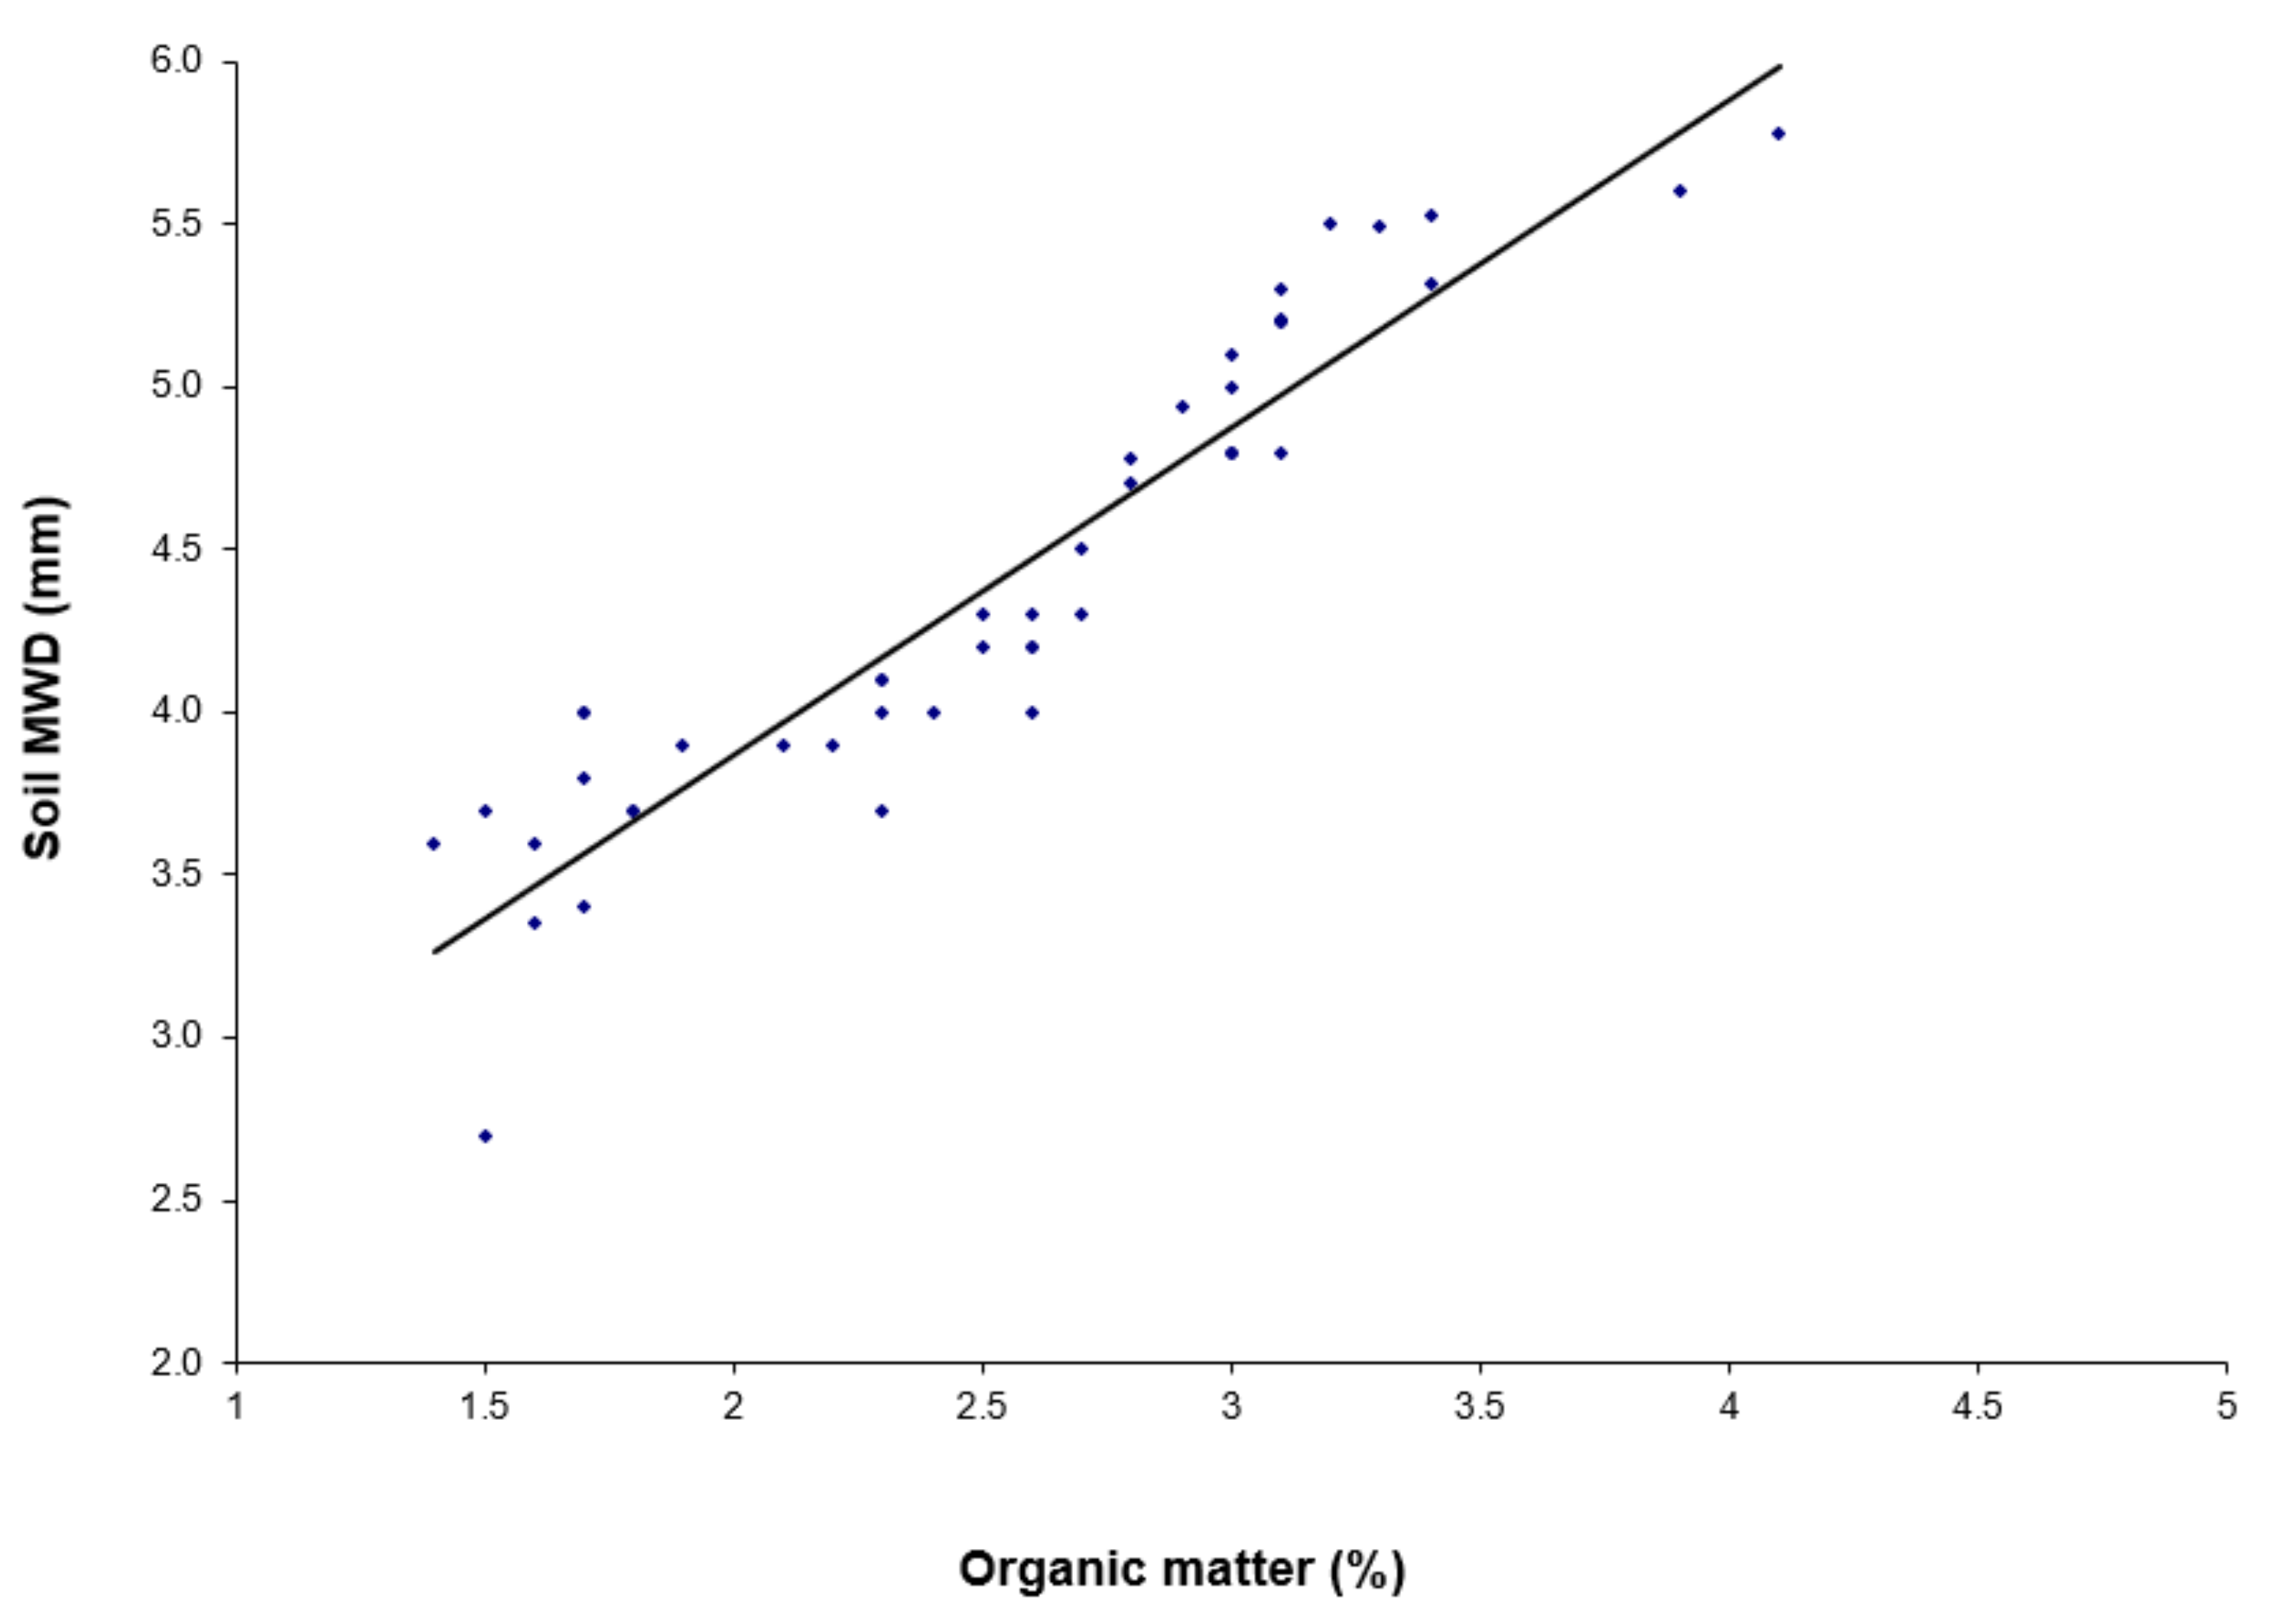
The land management practices in cropland had a great impact on soil chemical and physical properties, especially in the soils’ mean weight diameters and organic matter contents (Table 4). As Figure 2 shows, a linear relation was found between these two parameters, including no-tillage versus tillage management. No tillage land management has favored higher amounts of organic matter content and better aggregate stability compared to soils in which tillage operations were carried out. However, statistically significant differences were found for the parameters organic matter content, mean weight diameter and exchangeable potassium content between the management practices of tillage versus no-tillage.
Visually assessed differences in indicators ratings of grazing land were ranged from slight, for the indicators tillage pan, susceptibility to slaking, biodiversity, to moderate for the indicators susceptibility to water and wind erosion, infiltration rate, soil color, soil porosity, soil structure and consistency. Extensive grazing has mainly positively affected soil quality compared to intensive grazing, except for the indicator susceptibility to slaking for scores in moderate and low classes. The studied grazing land is mainly a sloping land covered by shrubs or cultivated with annual plants used as animal fodder. The small differences of scores in tillage pan formation index and susceptibility to slaking between extensive and intensive grazing management can be attributed to the periodic and rotational cultivation of the grazing land in combination with the pressures exerted by animal trampling. Regarding the indicator of biodiversity, the justification of the recorded small differences between extensive and intensive grazing is the same as those mentioned for agricultural land. The moderate differences in the indicator susceptibility to water and wind erosion can be attributed to the favorable conditions for soil erosion created first for few weeks in November during sowing the soil and second in early spring after intensive grazing of the corresponding fields leaving the soil partially covered by adequate vegetation.
The following indicators had big differences between extensive versus intensive grazing: infiltration rate, soil colour, soil porosity, and soil aggregate stability. Specifically, the existing higher amount of organic matter content under extensive grazing created favorable conditions for the development of a good soil structure and of a darker surface soil colour. Consequently, good soil structure in the extensively grazed areas enhanced infiltration rate and soil porosity. However, statistically significant differences were found only for the indicators susceptibility to wind and water erosion and infiltration rate between the management practices of extensive versus intensive grazing.

5. Conclusions

Soil quality can be considered as a composite indicator affected by several single soil indicators. In the present work, soil quality was assessed through nine qualitative and visually assessed indicators in cropland and pastures and supplementary through five quantitative indicators, only for agricultural areas. Among the most important indicators affecting soil quality were soil erosion susceptibility, soil structure and consistency, infiltration rate, aggregate stability (mean weight diameter), and soil organic matter content. However, the analyzed indicators have been affected by the land management practices of no tillage versus tillage in cropland and extensive grazing versus intensive grazing in grazing land. No tillage and extensive grazing presented a great positive effect on soil quality indicators. Tillage operations and intensive grazing tend to promote accelerated soil erosion, to enhance loss in soil organic matter content, to reduce soil aggregate stability and infiltration rate, and to deteriorate the biodiversity of soils. Qualitative soil quality indicators can be a valuable tool at the disposal of farmers and scientists for improving soil quality. The methodology of visual assessed indicators in the field is proposed to be used for specific purposes of monitoring the effects of the applied agricultural land management practices. An important advantage of using the suggested rapid methodology, of soil’s general agricultural value assessment through the visually scoring of soil quality indicators, is that the required data are immediately and easily obtained in the field in contrast to indicators requiring expensive and time-consuming laboratory analyses or processing.

Author Contributions

Conceptualization, O.K., C.K.; methodology, O.K., C.K.; software, O.K., C.A. and A.F.; field supervision, C.K., C.A. and M.v.M.; data analysis, O.K., C.K., C.A. and A.F.; writing—original draft preparation, O.K. and C.K.; writing—review and editing, O.K., C.K. and C.A. All authors have read and agreed to the published version of the manuscript.

Funding

This research was partially funded by the European Union’s Horizon 2020 Program for research & innovation iSQAPER research project (Interactive Soil Quality Assessment in Europe and China for Agricultural Productivity and Environmental Resilience—grant agreement number 635750).

Acknowledgments

The authors must acknowledge and thank Kasidonis Evangelos because in the present work, measurements from his master’s thesis were used.

Conflicts of Interest

The authors declare no conflict of interest.

References

  1. Mausel, P.W. Soil quality in Illinois—An example of a soil’s geography resource analysis. Prof. Geogr. 1971, 23, 127–136. [Google Scholar] [CrossRef]
  2. Doran, J.W.; Parkin, T.B. Defining and assessing soil quality. In Defining Soil Quality for a Sustainable Environment; Doran, J., Coleman, D., Bezdicek, D., Stewart, B., Eds.; SSSA: Madison, WI, USA, 1994; Volume 35, pp. 3–21. [Google Scholar]
  3. Larson, W.E.; Pierce, F.J. Conservation and enhancement of soil quality. In Evaluation for Sustainable Land Management in the Developing World, Proceedings of the International Workshop, Chiang Rai, Thailand, 15–21 September 1991; Dumanski, J., Ed.; International Board for Soil Research and Management: Bangkok, Thailand, 1991; Volume 2, pp. 175–203. [Google Scholar]
  4. Parr, J.; Papendick, R.; Hornick, S.; Meyer, R. Soil quality: Attributes and relationship to alternative and sustainable agriculture. Am. J. Altern. Agric. 1992, 7, 5–11. [Google Scholar] [CrossRef]
  5. Granatstein, D.; Bezdicek, D.F. The need for a soil quality index: Local and regional perspectives. Am. J. Altern. Agric. 1992, 7, 12–16. [Google Scholar] [CrossRef] [Green Version]
  6. Arshad, M.; Coen, G. Characterization of soil quality: Physical and chemical criteria. Am. J. Altern. Agric. 1992, 7, 25–31. [Google Scholar] [CrossRef]
  7. Sims, J.T.; Cunningham, S.D.; Summer, M.E. Assessing Soil Quality for Environmental Purposes: Roles and Challenges for Soil Scientists. J. Environ. Qual. 1997, 26, 20–25. [Google Scholar] [CrossRef]
  8. Warkentin, B.P. The changing concept of soil quality. J. Soil Water Conserv. 1995, 50, 226–228. [Google Scholar]
  9. Karlen, D.L.; Mausbach, M.J.; Doran, J.W.; Cline, R.G.; Harris, R.F.; Schuman, G.E. Soil quality: A concept, definition, and framework for evaluation. Soil Sci. Soc. Am. J. 1997, 61, 4–10. [Google Scholar] [CrossRef] [Green Version]
  10. Brejda, J.J.; Karlen, D.L.; Smith, J.L.; Allan, D.L. Identification of regional soil quality factors and indications II. Northern Mississippi Loess Hills and Palouse Prairie. Soil Sci. Soc. Am. J. 2000, 64, 2125–2135. [Google Scholar] [CrossRef] [Green Version]
  11. Lal, R. Basic concepts and global issues: Soil quality and agricultural sustainability. In Soil Quality and Agricultural Sustainability; Ann Arbor Press: Chelsea, MI, USA, 1998; pp. 3–12. [Google Scholar]
  12. Shukla, M.K.; Lal, R.; Ebinger, M. Soil Quality Indicators for Reclaimed Minesoils in Southeastern Ohio. Soil Sci. 2004, 169, 133–142. [Google Scholar] [CrossRef]
  13. Caravaca, F.; Masciandaro, G.; Ceccanti, B. Land use in relation to soil chemical and biochemical properties in a semiarid Mediterranean environment. Soil Tillage Res. 2002, 68, 23–30. [Google Scholar] [CrossRef]
  14. Lal, R. Tillage effects on soil degradation, soil resilience, soil quality, and sustainability. Soil Tillage Res. 1993, 27, 1–8. [Google Scholar] [CrossRef]
  15. Gregorich, E.G.; Drury, C.F.; Baldock, J.A. Changes in Soil Carbon under Long-Term Maize in Monoculture and Legume-Based Rotation. Can. J. Soil Sci. 2001, 81, 21–31. [Google Scholar] [CrossRef] [Green Version]
  16. Yu, G.; Fang, H.; Gao, L.; Zhang, W. Soil organic carbon budget and fertility variation of black soils in Northeast China. Ecol. Res. 2006, 21, 855–867. [Google Scholar] [CrossRef]
  17. Busari, M.A.; Kukal, S.S.; Kaur, A. Conservation tillage impacts on soil, crop and the environment. Int. Soil Water Conserv. Res. 2015, 3, 119–129. [Google Scholar] [CrossRef] [Green Version]
  18. Denef, K.; Six, J.; Bossuyt, H.; Frey, S.D.; Elliott, E.T.; Merckx, R.; Paustian, K. Influence of dry–wet cycles on the interrelationship between aggregate, particulate organic matter, and microbial community dynamics. Soil Biol. Biochem. 2001, 33, 1599–1611. [Google Scholar] [CrossRef]
  19. Piccolo, A.; Pietramellara, G.; Mbagwu, J.S.C. Use of humic substances as soil conditioners to increase aggregate stability. Geoderma 1997, 75, 267–277. [Google Scholar] [CrossRef]
  20. Cerdan, O.; Govers, G.; Le Bissonnais, Y.; Van Oost, K.; Poesen, J.; Saby, N.; Gobin, A.; Vacca, A.; Quinton, J.; Auerswald, K.; et al. Rates and spatial variations of soil erosion in Europe: A study based on erosion plot data. Geomorphology 2010, 122, 167–177. [Google Scholar] [CrossRef]
  21. Brunner, A.C.; Park, S.J.; Ruecker, G.R.; Vlek, P.L.G. Erosion modelling approach to simulate the effect of land management options on soil loss by considering catenary soil development and farmer’s perception. Land Degrad. Dev. 2008, 19, 623–631. [Google Scholar] [CrossRef]
  22. Mayel, S.; Jarrah, M.; Kuka, K. How does grassland management affect physical and biochemical properties of temperate grassland soils? A review study. Grass Forage Sci. 2021, 1–30. [Google Scholar] [CrossRef]
  23. Zhou, Z.C.; Gan, Z.T.; Shangguan, Z.P.; Dong, Z.B. Effects of grazing on soil physical properties and soil erodibility in semiarid grassland of the Northern Loess Plateau (China). Catena 2010, 82, 87–91. [Google Scholar] [CrossRef]
  24. Nawaz, M.F.; Bourrié, G.; Trolard, F. Soil compaction impact and modelling. A review. Agron. Sustain. Dev. 2013, 33, 291–309. [Google Scholar] [CrossRef] [Green Version]
  25. Ferrero, A.; Lipiec, J. Determining the effect of trampling on soils in hillslope-woodlands. Int. Agrophys. 2000, 14, 9–16. [Google Scholar]
  26. Naeth, M.A.; Chanasyk, D.S.; Rothwell, R.L.; Bailey, A.W. Grazing impacts on soil water in mixed prairie and fescue grassland ecosystems of Alberta. Can. J. Soil Sci. 1991, 71, 313–325. [Google Scholar] [CrossRef]
  27. Papanastasis, V. Description of Reasons Leading to Overgrazing and Why It Is an Issue in the Context of Desertification. Project DESERTLINKS (EVK2-CT-2001-00109), DIS4ME: Desertification Indicator System for Mediterranean Europe. Available online: http://www.unibas.it/desertnet/dis4me/issues/issue_overgrazing.htm#description (accessed on 1 August 2013).
  28. Bernués, A.; Ruiz, R.; Olaizola, A.; Villalba, D.; Casasús, I. Sustainability of pasture-based livestock farming systems in the European Mediterranean context: Synergies and trade-offs. Livest. Sci. 2011, 139, 44–57. [Google Scholar] [CrossRef]
  29. Virgilio, A.; Lambertucci, S.; Morales, J. Sustainable grazing management in rangelands: Over a century searching for a silver bullet. Agric. Ecosyst. Environ. 2019, 283, 106561. [Google Scholar] [CrossRef]
  30. Lowery, B.; Hickey, W.J.; Arshad, M.A.; Lal, R. Soil water parameters and soil quality. In Methods for Assessing Soil Quality; Doran, J.W., Jones, A.J., Eds.; SSSA Special Publications: Madison, WI, USA, 1997; pp. 143–155. [Google Scholar]
  31. Herrick, J.E.; Van Zee, J.W.; Belnap, J.; Johansen, J.R.; Remmenga, M. Fine gravel controls hydrologic and erodibility responses to trampling disturbance for coarse textured soils with weak cyanobacterial crusts. Catena 2010, 83, 119–126. [Google Scholar] [CrossRef]
  32. Dowling, T.; Summerell, G.K.; Walker, J. Soil wetness as an indicator of stream salinity: A landscape position index approach. Environ. Model. Softw. 2003, 18, 587–593. [Google Scholar] [CrossRef]
  33. Shuster, W.D.; Subler, S.; McCoy, E.L. The influence of earthworm community structure on the distribution and movement of solutes in a chisel-tilled soil. Appl. Soil Ecol. 2002, 21, 159–167. [Google Scholar] [CrossRef]
  34. Angers, D.A.; Caron, J. Plant-induced Changes in Soil Structure: Processes and Feedbacks. Biogeochemistry 1998, 42, 55–72. [Google Scholar] [CrossRef]
  35. Beven, K.; Germann, P. Macropores and water flow in soils revisited. Water Resour. Res. 2013, 49, 3071–3092. [Google Scholar] [CrossRef] [Green Version]
  36. Edwards, W.M.; Shipitalo, M.J.; Owens, L.B.; Norton, L.D. Effect of Lumbricus terrestris L. burrows on hydrology of continuous no-till corn fields. Geoderma 1990, 46, 73–84. [Google Scholar] [CrossRef]
  37. Six, J.; Bossuyt, H.; Degryze, S.D.; Denef, K. A History of Research on the Link between (Micro) Aggregates, Soil Biota, and Soil Organic Matter Dynamics. Soil Tillage Res. 2004, 79, 7–31. [Google Scholar] [CrossRef]
  38. Zacharias, S.; Wessolek, G. Excluding Organic Matter Content from Pedotransfer Predictors of Soil Water Retention. Soil Sci. Soc. Am. J. 2007, 71, 43–50. [Google Scholar] [CrossRef]
  39. Bünemann, E.K.; Mäder, P.; Wohlfahrt, J.; Brussaard, L.; Bongiorno, G.; de Goede, R.; Sukkel, W.; Bai, Z.G.; Caspari, T. Concepts and Indicators of Soil Quality—A Review; EUfunded iSQAPER project report; FIBL: Frick, Switzerland, 2016; p. 60. [Google Scholar]
  40. Schwertmann, U. Relations between Iron Oxides, Soil Color and Soil Formation. In Soil Color; Bigham, J.M., Ciolkosz, E.J., Eds.; Soil Science Society of America: Madison, WI, USA, 1993; Volume 31, pp. 51–69. [Google Scholar]
  41. Ahukaemere, C.M.; Akamigbo, F.O.R.; Onweremadu, E.U. Soil color and organic matter content as indicators of soil quality in False bedded Sandstones soils in Southeastern Nigeria. Niger. J. Agric. Food Environ. 2013, 9, 6–11. [Google Scholar]
  42. Kemper, W.D.; Koch, E.J. Aggregate Stability of Soils from Western U.S. and Canada; Tech. Bull. No. 1355; US Government Printing Office: Washington, DC, USA, 1966.
  43. Le Bissonnais, Y.; Singer, M.J. Crusting, runoff, and erosion response to soil water content and successive rainfalls. Soil Sci. Soc. Am. J. 1992, 56, 1898–1903. [Google Scholar] [CrossRef]
  44. Levy, G.J.; Miller, W.P. Aggregate stabilities of some Southeastern, U.S. soils. Soil Sci. Soc. Am. J. 1997, 61, 1176–1182. [Google Scholar] [CrossRef]
  45. Levy, G.J.; Goldstein, D.; Mamedov, A. Saturated Hydraulic Conductivity of Semiarid Soils: Combined Effects of Salinity, Sodicity, and Rate of Wetting. Soil Sci. Soc. Am. J. 2005, 69, 653–662. [Google Scholar] [CrossRef]
  46. Finch, H.J.S.; Samuel, A.M.; Lane, G.P.F. Lockhart & Wiseman’s Crop Husbandry Including Grassland, 9th ed.; Woodhead Publishing: Sawston, UK, 2014. [Google Scholar]
  47. Shaw, J.N.; Bosch, D.D.; West, L.T.; Truman, C.C.; Radcliffe, D.E. Lateral flow in loamy to sandy Kandiudults of the Upper Coastal Plain of Georgia (USA). Geoderma 2001, 99, 1–25. [Google Scholar] [CrossRef]
  48. He, Z.; Wu, F. Labile Organic Matter: Chemical Compositions, Function, and Significance in Soil and the Environment; SSSA Special Publication 62: Madison, WI, USA, 2015; p. 382. [Google Scholar]
  49. Davies, D.B.; Payne, D. Management of soil physical properties. In Russell’s Soil Conditions and Plant Growth, 11th ed.; Wild, A., Ed.; Longman: Harlow, UK, 1988; pp. 412–448. [Google Scholar]
  50. Haynes, R.; Naidu, R. Influence of lime, fertilizer and manure applications on soil organic matter content and soil physical conditions: A review. Nutr. Cycl. Agroecosyst. 1998, 51, 123–137. [Google Scholar] [CrossRef]
  51. Khaleel, R.; Reddy, K.R.; Overcash, M.R. Changes in soil physical properties due to organic waste applications: A review. J. Environ. Qual. 1981, 10, 133–141. [Google Scholar] [CrossRef]
  52. Lavelle, P. Earthworm activities and the soil system. Biol. Fertil Soils 1988, 6, 237–251. [Google Scholar] [CrossRef]
  53. Sánchez-Navarro, A.; Gil-Vázquez, J.M.; Delgado-Iniesta, M.J.; Marín-Sanleandro, P.; Blanco-Bernardeau, A.; Ortiz-Silla, R. Establishing an index and identification of limiting parameters for characterizing soil quality in Mediterranean ecosystems. Catena 2015, 131, 35–45. [Google Scholar] [CrossRef]
  54. Rabot, E.; Wiesmeier, M.; Schlüter, S.; Vogel, H.-J. Soil structure as an indicator of soil functions: A review. Geoderma 2018, 314, 122–137. [Google Scholar] [CrossRef]
  55. FAO. Voluntary Guidelines for Sustainable Soil Management Food and Agriculture Organization of the United Nations Rome, Italy. 2017. Available online: http://www.fao.org/3/a-bl813e.pdf (accessed on 8 July 2021).
  56. Montanarella, L.; Panagos, P. The relevance of sustainable soil management within the European Green Deal. Land Use Policy 2020, 100. [Google Scholar] [CrossRef]
  57. FAO. 2021. Available online: http://www.fao.org/fileadmin/user_upload//GSP/SSM/SSM_Protocol_EN_006.pdf (accessed on 9 July 2021).
  58. Alaoui, A.; Barão, L.; Ferreira, C.S.; Schwilch, G.; Basch, G.; Garcia-Orenes, F.; Morugan, A.; Mataix-Solera, J.; Kosmas, C.; Glavan, M.; et al. Visual assessment of the impact of agricultural management practices on soil quality. Agron. J. 2020, 112, 2608–2623. [Google Scholar] [CrossRef]
  59. Alaoui, A.; Schwilch, G. Soil Quality and Agricultural Management Practices Inventory at Case Study Sites; iSQAPER Report; CDE-University of Bern: Bern, Switzerland, 2016; p. 28. [Google Scholar]
  60. Nelson, D.W.; Sommers, L.E. Total carbon, organic carbon, and organic matter. In Methods of Soil Analysis: Part 3 Chemical Methods; Sparks, D., Page, A., Helmke, P., Loeppert, R., Soltanpour, P.N., Tabatabai, M.A., Johnston, C.T., Sumner, M.E., Eds.; American Society of Agronomy Inc.: Madison, WI, USA, 1996; Volume 9, pp. 961–1010. [Google Scholar]
  61. Helmke, P.A.; Sparks, D.L. Lithium, Sodium, Potassium, Rubidium, and Cesium. In Methods of Soil Analysis: Part 3 Chemical Methods; Sparks, D., Page, A., Helmke, P., Loeppert, R., Soltanpour, P.N., Tabatabai, M.A., Johnston, C.T., Sumner, M.E., Eds.; American Society of Agronomy Inc.: Madison, WI, USA, 1996; pp. 551–574. [Google Scholar]
  62. Chapman, H.D. Cation-exchange capacity. In Methods of Soil Analysis: Part 2 Chemical and Microbiological Properties; American Society of Agronomy Inc.: Madison, WI, USA, 1965; Volume 9, pp. 891–901. [Google Scholar]
  63. Akhromeiko, M.A. Recherches sur la stabilite de la structure du sol. Comptes rendus de la conference de la première commission (physique dü sol). Au centre national de recherches agronomiques. 2–5 Juillet 1934, Versailles. 1934, 109–113.
  64. Yoder, R.E. A direct method of aggregate analysis of soils and a study of the physical nature of erosion losses. J. Am. Soc. Agric. 1936, 28, 337–351. [Google Scholar] [CrossRef]
  65. Van Bavel, C.H.M. Mean Weight-Diameter of Soil Aggregates as a Statistical Index of Aggregation. Soil Sci. Soc. Am. J. 1950, 14, 20–23. [Google Scholar] [CrossRef] [Green Version]
  66. Gardner, W.R. Representation of Soil Aggregate-Size Distribution by a Logarithmic-Normal Distribution. Soil Sci. Soc. Am. J. 1956, 20, 151–153. [Google Scholar] [CrossRef]
  67. Youker, R.E.; McGuinness, J.L. A Short Method of Obtaining Mean Weight-Diameter Values of Aggregate Analyses of Soils. Soil Sci. 1957, 83, 291–294. [Google Scholar] [CrossRef]
  68. Kemper, W.D.; Chepil, W.S. Size Distribution of Aggregates. In Methods of Soil Analysis; Black, C.A., Ed.; American Society of Agronomy: Madison, WI, USA, 1965; pp. 499–510. [Google Scholar]
  69. Olsen, S.R.; Sommers, L.E. Phosphorus. In Methods of Soil Analysis: Part 2 Chemical and Microbiological Properties, 2nd ed.; Page, A.L., Ed.; Agron. Mongr. ASA and SSSA: Madison, WI, USA, 1983; pp. 403–430. [Google Scholar]
  70. MacFarland, W.T.; Yates, J.M. Introduction to Nonparametric Statistics for the Biological Sciences Using R.; Springer International Publishing: Cham, Switzerland, 2016; p. 341. [Google Scholar]
  71. Beukelman, T.; Brunner, H. Chapter 6—Trial Design, Measurement, and Analysis of Clinical Investigations. In Textbook of Pediatric Rheumatology, 7th ed.; Ross, E., Petty, R.M., Laxer, C.B., Lindsley, L.R., Wedderburn, W.B., Eds.; Saunders: Philadelphia, PA, USA, 2016; pp. 54–77. [Google Scholar]
  72. Shapiro, S.S.; Wilk, M.B. An analysis of variance test for normality (complete samples). Biometrika 1965, 52, 591–611. [Google Scholar] [CrossRef]
  73. Shapiro, S.S.; Wilk, M.B.; Chen, H.J. A comparative study of various tests of normality. JASA 1968, 63, 1343–1372. [Google Scholar] [CrossRef]
  74. Snedecor, G.W.; Cochran, W.G. Statistical Methods, 8th ed.; Iowa State University Press: Ames, IA, USA, 1989; p. 491. [Google Scholar]
  75. Kairis, O.; Karavitis, C.; Kounalaki, A.; Salvati, L.; Kosmas, C. The effect of land management practices on soil erosion and land desertification in an olive grove. Soil Use Manag. J. 2013, 29, 597–606. [Google Scholar] [CrossRef]
Figure 1. Study area map with the corresponding sampling field plots. (A): Soil sampling sites for laboratory analysis (Chania region), (B): Soil quality assessment sites (Heraclion region).
Sustainability 13 08619 g001aSustainability 13 08619 g001b
Figure 2. Relation of organic matter content and mean soil weight diameter.
Sustainability 13 08619 g002
Table 1. Soil quality indicator and soil quality scores of the nine indicators per pair of management practices in the examined fields.
SN-FCSWWESP1TPSCSP2SSCSTBIRCSQI
1-NT11211221111.5
2-T21212220111.0
3-NT32212222111.5
4-T41211112111.3
5-NT152222221011.7
6-T162222221011.4
7-NT172221222011.2
8-T181221111010.5
9-NT192211121111.2
10-T201211100101.2
11-NT1M1211122111.2
12-T2M0210002011.3
13-NT4M1221222121.4
14-T3M1211112111.1
15-NT5M2211112101.6
16-T6M0210002001.4
17-NT7M2222222211.5
18-T8M1111102101.0
19-NT9M2212222211.2
20-T10M1211002100.7
21-NT12M1211222111.6
22-T11M1211112101.1
23-NT14M2211112101.6
24-T13M0210012001.2
25-NT17M1212112111.3
26-T16M1211112101.1
27-NT17M1212222111.5
28-T20M0211002100.8
29-NT18M0211112000.9
30-T15M0210012000.7
31-EG52222222121.9
32-IG61221112111.3
33-EG131222222021.7
34-IG141221112011.2
35-EG212222222021.8
36-IG221222112011.3
37-EG242222222021.8
38-IG231222111011.2
39-EG24M1222222011.6
40-IG21M0221112011.1
41-EG22M1222122011.4
42-IG23M0211112000.9
43-EG26M1221112011.2
44-IG25M1222222011.6
45-EG28M1212222011.4
46-IG27M0211102010.9
47-EG30M1212222011.4
48-IG29M1211112001.0
SN-FC = Serial numbers and field codes, SWWE = Susceptibility to wind and water Erosion, SP1 = Surface ponding, TP = Tillage pan, SC = Soil colour, SP2 = Soil porosity, SSC = Soil structure and consistency, ST = Susceptibility to slaking, B = Biodiversity (earthworm. density), IR = Infiltration rate, CSQI = Composite soil quality index, T = Till, NT = No Till, EG = Extensive Grazing, IG = Intensive Grazing.
Table 2. The acceptance or rejection of the null hypothesis of the Wilcoxon Matched Pairs Signed Ranks Test and the corresponding levels of statistical significance for tillage and no tillage practices.
Soil PorositySoil Structure and ConsistencyInfiltration Rate
Pairs151515
Confidence level0.840.950.95
Level of statistical significance0.160.050.05
Wilcoxon estimated p value0.0020.0040.008
Acceptance or rejection of the null hypothesisRejectRejectReject
Table 3. The acceptance or rejection of the null hypothesis of the Wilcoxon Matched Pairs Signed Ranks Test and the corresponding levels of statistical significance for intensive and extensive grazing practices.
Susceptibility to ErosionSurface PondingBiodiversity Infiltration Rate
Pairs9999
Confidence level0.950.950.950.95
Level of statistical significance0.050.050.050.05
Wilcoxon estimated p value0.014--0.014
Acceptance or rejection of the null hypothesisReject--Reject
Table 4. The results of the five soil parameters analyses per pair of treatments across the examined fields.
Sample Codes and NumbersMWD (mm)SOM (%)Exchangeable Potassium (mg/kg of Soil)Available Phosphorous (mg/kg of Soil)C.E.C. (cmolc/kg of Soil)
NT13.21.51101.09.0
T22.71.5800.313.0
NT33.71.51204.513.9
T431.51002.413.4
NT53.72.31205.114.0
T63.351.61102.513.8
NT742.41405.314.7
T83.41.71202.513.8
NT942.51405.515.3
T103.71.81202.514.5
NT1142.61405.515.5
T123.71.81202.614.5
NT134.22.61505.617.0
T143.91.91302.714.8
NT154.52.71506.217.0
T163.92.11302.815.1
NT174.782.81607.617.8
T183.92.21303.915.2
NT194.92.91607.818.0
T2042.31404.516.0
NT214.942.91609.018.0
T224.12.31404.616.2
NT235.1316011.718.6
T244.22.51404.716.3
NT255.213.117015.919.0
T264.22.61505.017.0
NT275.33.118017.019.5
T284.32.61505.317.7
NT295.33.218021.621.0
T304.32.71507.019.8
NT315.323.418023.821.0
T324.72.81508.021.0
NT335.533.418024.221.2
T344.8316014.521.2
NT355.63.919029.721.7
T365316015.224.0
NT375.784.124051.526.5
T385.23.118015.424.4
T = Till, NT = No Till.
Table 5. The acceptance or rejection of the null hypothesis of the Shapiro–Wilk test for tillage and no tillage practices.
Soil Propertiesp-Value for Tillage p-Value for No-Tillage Accept or Reject the Null Hypothesis
MWD (mm)0.9370.269Accepted
SOM (%)0.2570.509Accepted
Ex.K (mg/kg of soil) 0.8160.239Accepted
Av.P. (mg/kg of soil)0.0010.001Rejected
CEC (cmolc/kg of soil)0.0140.760Accepted
Table 6. The acceptance or rejection of the null hypothesis of the F-test for tillage and no tillage practices.
Soil Propertiesp-ValueAccept or Reject the Null Hypothesis
MWD (mm)0.506Accepted
SOM (%)0.346Accepted
Ex.K (mg/kg of soil) 0.309Accepted
Av.P (mg/gr of soil)0.0001Rejected
C.E.C. (cmolc/kg of soil)0.762Accepted
Table 7. The acceptance or rejection of the null hypothesis of the t-test for tillage and no tillage practices.
Soil Propertiesp-ValueAccept or Reject the Null Hypothesis
MWD (mm)0.006Rejected
SOM (%)0.006Rejected
Ex.K (mg/kg of soil) (mg/kg of soil) 0.008Rejected
CEC (cmolc/kg of soil)0.459Accepted
Publisher’s Note: MDPI stays neutral with regard to jurisdictional claims in published maps and institutional affiliations.

