
Improving Experienced Mathematics Teachers’ Classroom Talk: A Visual Learning Analytics Approach to Professional Development


Abstract
:1. Introduction
- How does the use of visual learning analytics in professional development influence experienced mathematics teachers’ classroom talk?
- What are the teachers’ perceptions of the program?
- How does the program influence students’ mathematics achievement?
2. Conceptual Framework
2.1. Formative Assessment and Classroom Talk
2.2. Video Viewing and Visual Learning Analytics in Professional Development
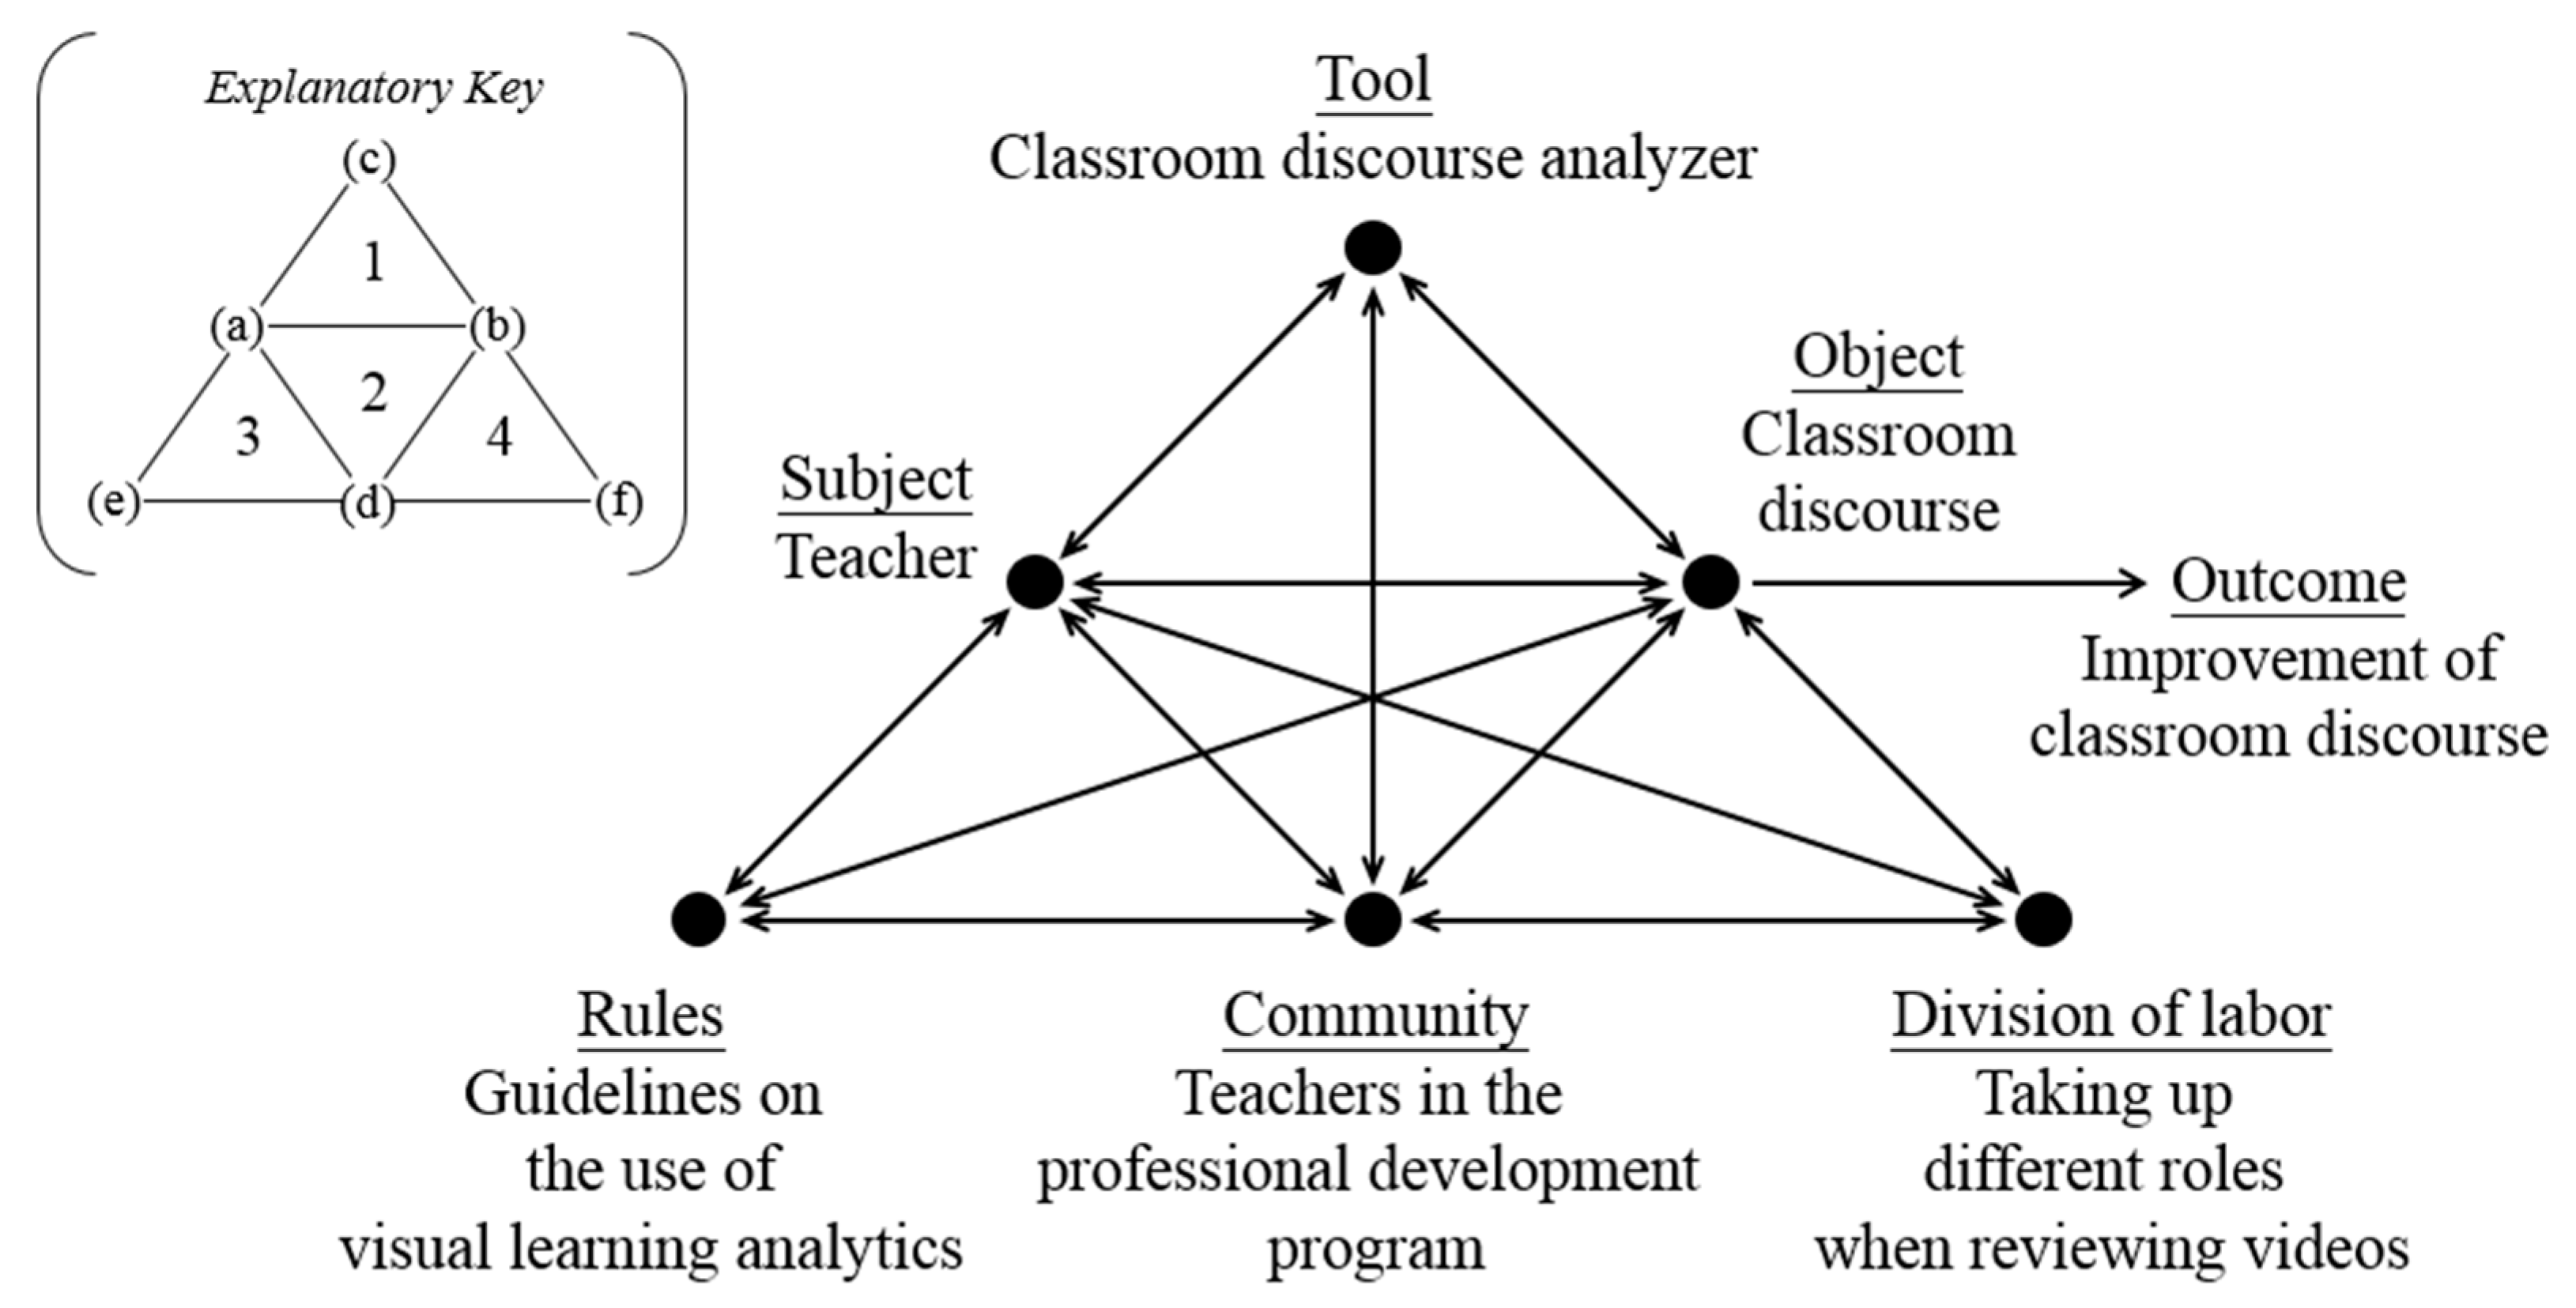
2.3. Theorizing the Use of Visual Learning Analytics with Activity Theory
- Triangle 1 (Vygotsky’s mediated-action model): a human agent pursuing an object is mediated by tools;
- Triangle 2: the human agent entering a community to pursue the object is facilitated by coordinated action and communication;
- Triangle 3: a set of rules mediates between the human agent and community; and
- Triangle 4: division of labor (or roles) mediates between the community and object.
3. Method
3.1. Research Context and Participants
3.2. Procedure and Professional Development Program
3.3. Data Collection and Analysis
4. Results
4.1. RQ1: How Does the Use of Visual Learning Analytics in Professional Development Influence Experienced Mathematics Teachers’ Classroom Talk?
4.2. RQ2: What Are the Teachers’ Perceptions of the Program?
“Now, I would give students more chances to talk and express themselves, asking simple yes/no questions to draw their attention or probing for further elaboration. For example, I would ask them: Why do you think so? How did you come up with this solution?”
“In the past, I provided students with limited time to think about my questions. When a student did not respond instantly, I would invite another student to answer. After participating the program, I would give my students more time—maybe around one to two minutes.”
“I would show their common mistakes using an overhead projector. Some students made mistakes repeatedly, meaning that they had some difficulties understanding the concepts. When their work was shown in class, all of the students helped analyze the reasons for the mistakes: Why is it wrong here? How can we avoid the problem? … Letting students correct other students’ mistakes seems quite effective.”
4.3. RQ3: How Does the Program Influence Students’ Mathematics Achievement?
“They simply don’t care about the [open-ended] questions because they perceive that the questions are not posed for them. … Then, they will not think about the questions, lack the sense of involvement, and disengage. Therefore, they learn nothing.”
“I find that there is a need of designing various levels of questions. Some questions should be simpler. Also, the teacher should invite the underperforming students to answer the questions because they can never learn if we only ask those outstanding students.”
“Students still require our guidance. The efficiency of our lesson should be ensured. Otherwise, if we allow our students free to speak, they may talk casually. The lesson then goes to waste.”(Tiffany)
“For the conversation between students, what they said may not be to the point. Of course, we can spend time on such a conversation, but class time is limited.”(Tana)
5. Discussion
5.1. The Use of Visual Learning Analytics Technology
5.2. Sustainable Development of Analytics-Supported, Video-Based Professional Development Programs
5.3. Ways to Improve Professional Development Content for Experienced Teachers
6. Conclusions and Limitation
Author Contributions
Funding
Institutional Review Board Statement
Informed Consent Statement
Data Availability Statement
Conflicts of Interest
Appendix A
References
- Doan, K.; Peters, M. Scratching the seven-year itch. Principal 2009, 89, 18–22. [Google Scholar]
- Hargreaves, A.; Fullan, M. The power of professional capital: With an investment in collaboration, teachers become nation builders. J. Staff Dev. 2013, 34, 36–39. [Google Scholar]
- Black, P.; Harrison, C.; Lee, C.; Marshall, B.; Wiliam, D. Assessment for Learning: Putting It into Practice; Open University Press: Maidenhead, UK, 2003. [Google Scholar]
- Jiang, Y. Exploring teacher questioning as a formative assessment strategy. RELC J. 2014, 45, 287–304. [Google Scholar] [CrossRef]
- Black, P.; Wiliam, D. Developing the theory of formative assessment. Educ. Assess. Eval. Account. 2009, 21, 5–31. [Google Scholar] [CrossRef] [Green Version]
- Borko, H.; Koellner, K.; Jacobs, J.; Seago, N. Using video representations of teaching in practice-based professional development programs. ZDM 2011, 43, 175–187. [Google Scholar] [CrossRef]
- Kang, H.; van Es, E.A. Articulating design principles for productive use of video in preservice education. J. Teach. Educ. 2019, 70, 237–250. [Google Scholar] [CrossRef]
- Sherin, M.G.; Dyer, E.B. Mathematics teachers’ self-captured video and opportunities for learning. J. Math. Teach. Educ. 2017, 20, 477–495. [Google Scholar] [CrossRef]
- Watters, J.J.; Diezmann, C.M.; Dao, L. Using classroom videos to stimulate professional conversations among pre-service teachers: Windows into a mathematics classroom. Asia-Pac. J. Teach. Educ. 2018, 46, 239–255. [Google Scholar] [CrossRef]
- Erickson, F. Ways of seeing video. In Video Research in the Learning Sciences; Goldman, R., Pea, R., Barron, B., Derry, S.J., Eds.; Routledge: New York, NY, USA, 2007; pp. 145–155. [Google Scholar]
- Gaudin, C.; Chaliès, S. Video viewing in teacher education and professional development: A literature review. Educ. Res. Rev. 2015, 16, 41–67. [Google Scholar] [CrossRef]
- Chen, G.; Clarke, S.N.; Resnick, L.B. Classroom discourse analyzer (CDA): A discourse analytic tool for teachers. Technol. Instr. Cogn. Learn. 2015, 10, 85–105. [Google Scholar]
- Vieira, C.; Parsons, P.; Byrd, V. Visual learning analytics of educational data: A systematic literature review and research agenda. Comput. Educ. 2018, 122, 119–135. [Google Scholar] [CrossRef]
- Blayone, T.J.B. Theorising effective uses of digital technology with activity theory. Technol. Pedagog. Educ. 2019, 28, 447–462. [Google Scholar] [CrossRef]
- Major, L.; Watson, S. Using video to support in-service teacher professional development: The state of the field, limitations and possibilities. Technol. Pedagog. Educ. 2018, 27, 49–68. [Google Scholar] [CrossRef]
- Roca-Campos, E.; Renta-Davids, A.I.; Marhuenda-Fluixá, F.; Flecha, R. Educational impact evaluation of professional development of in-service teachers: The case of the dialogic pedagogical gatherings at Valencia “on giants’ shoulders”. Sustainability 2021, 13, 4275. [Google Scholar] [CrossRef]
- Ramírez-Montoya, M.S.; Andrade-Vargas, L.; Rivera-Rogel, D.; Portuguez-Castro, M. Trends for the future of education programs for professional development. Sustainability 2021, 13, 7244. [Google Scholar] [CrossRef]
- Choi, Y.; Cho, Y.I. Learning analytics using social network analysis and Bayesian network analysis in sustainable computer-based formative assessment system. Sustainability 2020, 12, 7950. [Google Scholar] [CrossRef]
- Jeong, J.S.; González-Gómez, D.; Prieto, F.Y. Sustainable and flipped STEM education: Formative assessment online interface for observing pre-service teachers’ performance and motivation. Educ. Sci. 2020, 10, 283. [Google Scholar] [CrossRef]
- Villa-Ochoa, J.A.; Sánchez-Cardona, J.; Rendón-Mesa, P.A. Formative assessment of pre-service teachers’ knowledge on mathematical modeling. Mathematics 2021, 9, 851. [Google Scholar] [CrossRef]
- Haug, B.S.; Ødegaard, M. Formative assessment and teachers’ sensitivity to student responses. Int. J. Sci. Educ. 2015, 37, 629–654. [Google Scholar] [CrossRef]
- Nguyen, P.M.; Terlouw, C.; Pilot, A. Culturally appropriate pedagogy: The case of group learning in a Confucian heritage culture context. Intercult. Educ. 2006, 17, 1–19. [Google Scholar] [CrossRef]
- Michaels, S.; O’Connor, C.; Resnick, L.B. Deliberative discourse idealized and realized: Accountable talk in the classroom and in civic life. Stud. Philos. Educ. 2008, 27, 283–297. [Google Scholar] [CrossRef]
- Resnick, L.B.; Michaels, S.; O’Connor, M.C. How (well-structured) talk builds the mind. In Innovations in Educational Psychology: Perspectives on Learning, Teaching, and Human Development; Preiss, D.D., Sternberg, R.J., Eds.; Springer: New York, NY, USA, 2010; pp. 163–194. [Google Scholar]
- Garcia-Mila, M.; Miralda-Banda, A.; Luna, J.; Remesal, A.; Castells, N.; Gilabert, S. Change in classroom dialogicity to promote cultural literacy across educational levels. Sustainability 2021, 13, 6410. [Google Scholar] [CrossRef]
- Shute, V.J. Focus on formative feedback. Rev. Educ. Res. 2008, 78, 153–189. [Google Scholar] [CrossRef]
- Gröschner, A.; Schindler, A.K.; Holzberger, D.; Alles, M.; Seidel, T. How systematic video reflection in teacher professional development regarding classroom discourse contributes to teacher and student self-efficacy. Int. J. Educ. Res. 2018, 90, 223–233. [Google Scholar] [CrossRef]
- Martín-García, R.; López-Martín, C.; Arguedas-Sanz, R. Collaborative learning communities for sustainable employment through visual tools. Sustainability 2020, 12, 2569. [Google Scholar] [CrossRef] [Green Version]
- Thomas, J.J.; Cook, K.A. A visual analytics agenda. IEEE Comput. Graph. Appl. 2006, 26, 10–13. [Google Scholar] [CrossRef] [PubMed]
- Chen, G. A visual learning analytics (VLA) approach to video-based teacher professional development: Impact on teachers’ beliefs, self-efficacy, and classroom talk practice. Comput. Educ. 2020, 144, 103670. [Google Scholar] [CrossRef]
- Baldonado, M.Q.; Woodruff, A.; Kuchinsky, A. Guidelines for using multiple views in information visualization. In AVI ‘00: Proceedings of the Working Conference on Advanced Visual Interfaces, Palermo, Italy, May 2000; Association for Computing Machinery: New York, NY, USA, 2000; pp. 110–119. [Google Scholar]
- Shneiderman, B. The eyes have it: A task by data type taxonomy for information visualizations. In The Craft of Information Visualization: Readings and Reflections; Bederson, B.B., Shneidermanm, B., Eds.; Morgan Kaufmann: San Francisco, CA, USA, 2003; pp. 364–371. [Google Scholar]
- Engeström, Y. Learning by Expanding: An. Activity-Theoretical Approach to Developmental Research, 2nd ed.; Cambridge University Press: New York, NY, USA, 2015. [Google Scholar]
- Wertsch, J.V.; Tulviste, P.L.S. Vygotsky and contemporary developmental psychology. Dev. Psychol. 1992, 28, 548–557. [Google Scholar] [CrossRef]
- Corbin, J.M.; Strauss, A.L. Basics of Qualitative Research: Techniques and Procedures for Developing Grounded Theory; SAGE: Los Angeles, CA, USA, 2008. [Google Scholar]
- Maxwell, J.A. Qualitative Research Design: An Interactive Approach, 2nd ed.; SAGE: Thousand Oaks, CA, USA, 2005. [Google Scholar]
- Johnson, R.B. Examining the validity structure of qualitative research. Education 1997, 118, 282–292. [Google Scholar]
- Mullis, V.S.; Martin, M.O. TIMSS 2019 Assessment Frameworks; Boston College: Chestnut Hill, PA, USA, 2017. [Google Scholar]
- International Association for the Evaluation of Educational Achievement. TIMSS 2011 Grade 8 Released Mathematics Items. 2013. Available online: https://nces.ed.gov/timss/pdf/TIMSS2011_G8_Math.pdf (accessed on 1 July 2021).
- López, X.; Valenzuela, J.; Nussbaum, M.; Tsai, C.C. Some recommendations for the reporting of quantitative studies. Comput. Educ. 2015, 91, 106–110. [Google Scholar] [CrossRef]
- Field, A. Discovering Statistics Using SPSS, 3rd ed.; SAGE: London, UK, 2009. [Google Scholar]
- Jeong, J.S.; González-Gómez, D. Adapting to PSTs’ pedagogical changes in sustainable mathematics education through flipped e-learning: Ranking its criteria with MCDA/F-DEMATEL. Mathematics 2020, 8, 858. [Google Scholar] [CrossRef]
- Kelly, S.; Olney, A.M.; Donnelly, P.; Nystrand, M.; D’Mello, S.K. Automatically measuring question authenticity in real-world classrooms. Educ. Res. 2018, 47, 451–464. [Google Scholar] [CrossRef]
- Duan, D.; Liang, S.; Han, Z.; Yang, W. Pinyin as a feature of neural machine translation for Chinese speech recognition error correction. In Chinese Computational Linguistics. CCL 2019. Lecture Notes in Computer Science; Sun, M., Huang, X., Ji, H., Liu, Z., Liu, Y., Eds.; Springer: Cham, Switzerland, 2019; Volume 11856, pp. 651–663. [Google Scholar]
- Lindvall, J.; Ryve, A. Coherence and the positioning of teachers in professional development programs. A systematic review. Educ. Res. Rev. 2019, 27, 140–154. [Google Scholar] [CrossRef]
- Li, H.C.; Tsai, T.L. Investigating teacher pedagogical changes when implementing problem-based learning in a year 5 mathematics classroom in Taiwan. Asia-Pac. Educ. Res. 2018, 27, 355–364. [Google Scholar] [CrossRef]
- Resnick, L.B.; Asterhan, C.S.; Clarke, S.N.; Schantz, F. Next generation research in dialogic learning. In The Wiley Handbook of Teaching and Learning; Hall, G.E., Quinn, L.F., Gollnick, D.M., Eds.; John Wiley & Sons: Newark, NJ, USA, 2018; pp. 323–338. [Google Scholar]
- Topping, K.J.; Ehly, S.W. Peer-Assisted Learning; Lawrence Erlbaum Associates: Mahwah, NJ, USA, 1998. [Google Scholar]
- Chen, G.; Chan, C.K.; Chan, K.K.; Clarke, S.N.; Resnick, L.B. Efficacy of video-based teacher professional development for increasing classroom discourse and student learning. J. Learn. Sci. 2020, 29, 642–680. [Google Scholar] [CrossRef]
- Chen, G. Visual learning analytics to support classroom discourse analysis for teacher professional learning and development. In International Handbook of Research on Dialogic Education; Mercer, N., Wegerif, R., Major, L., Eds.; Routledge: Abingdon, UK, 2019; pp. 167–181. [Google Scholar]


| Group | Teacher (Pseudonym) | Education Level | Role in School | Class Size |
|---|---|---|---|---|
| Treatment | Tiffany | Bachelor’s (Mathematics education) | Mathematics teacher; leader of lesson preparation group | 30 |
| Tana | Bachelor’s (Mathematics education) | Mathematics teacher | 42 | |
| Comparison | Cherry | Bachelor’s (Mathematics) | Mathematics teacher; leader of lesson preparation group | 37 |
| Chloe | Bachelor’s (Mathematics education) | Mathematics teacher | 25 |
| Speaker | Dialog | Productive Talk Move |
|---|---|---|
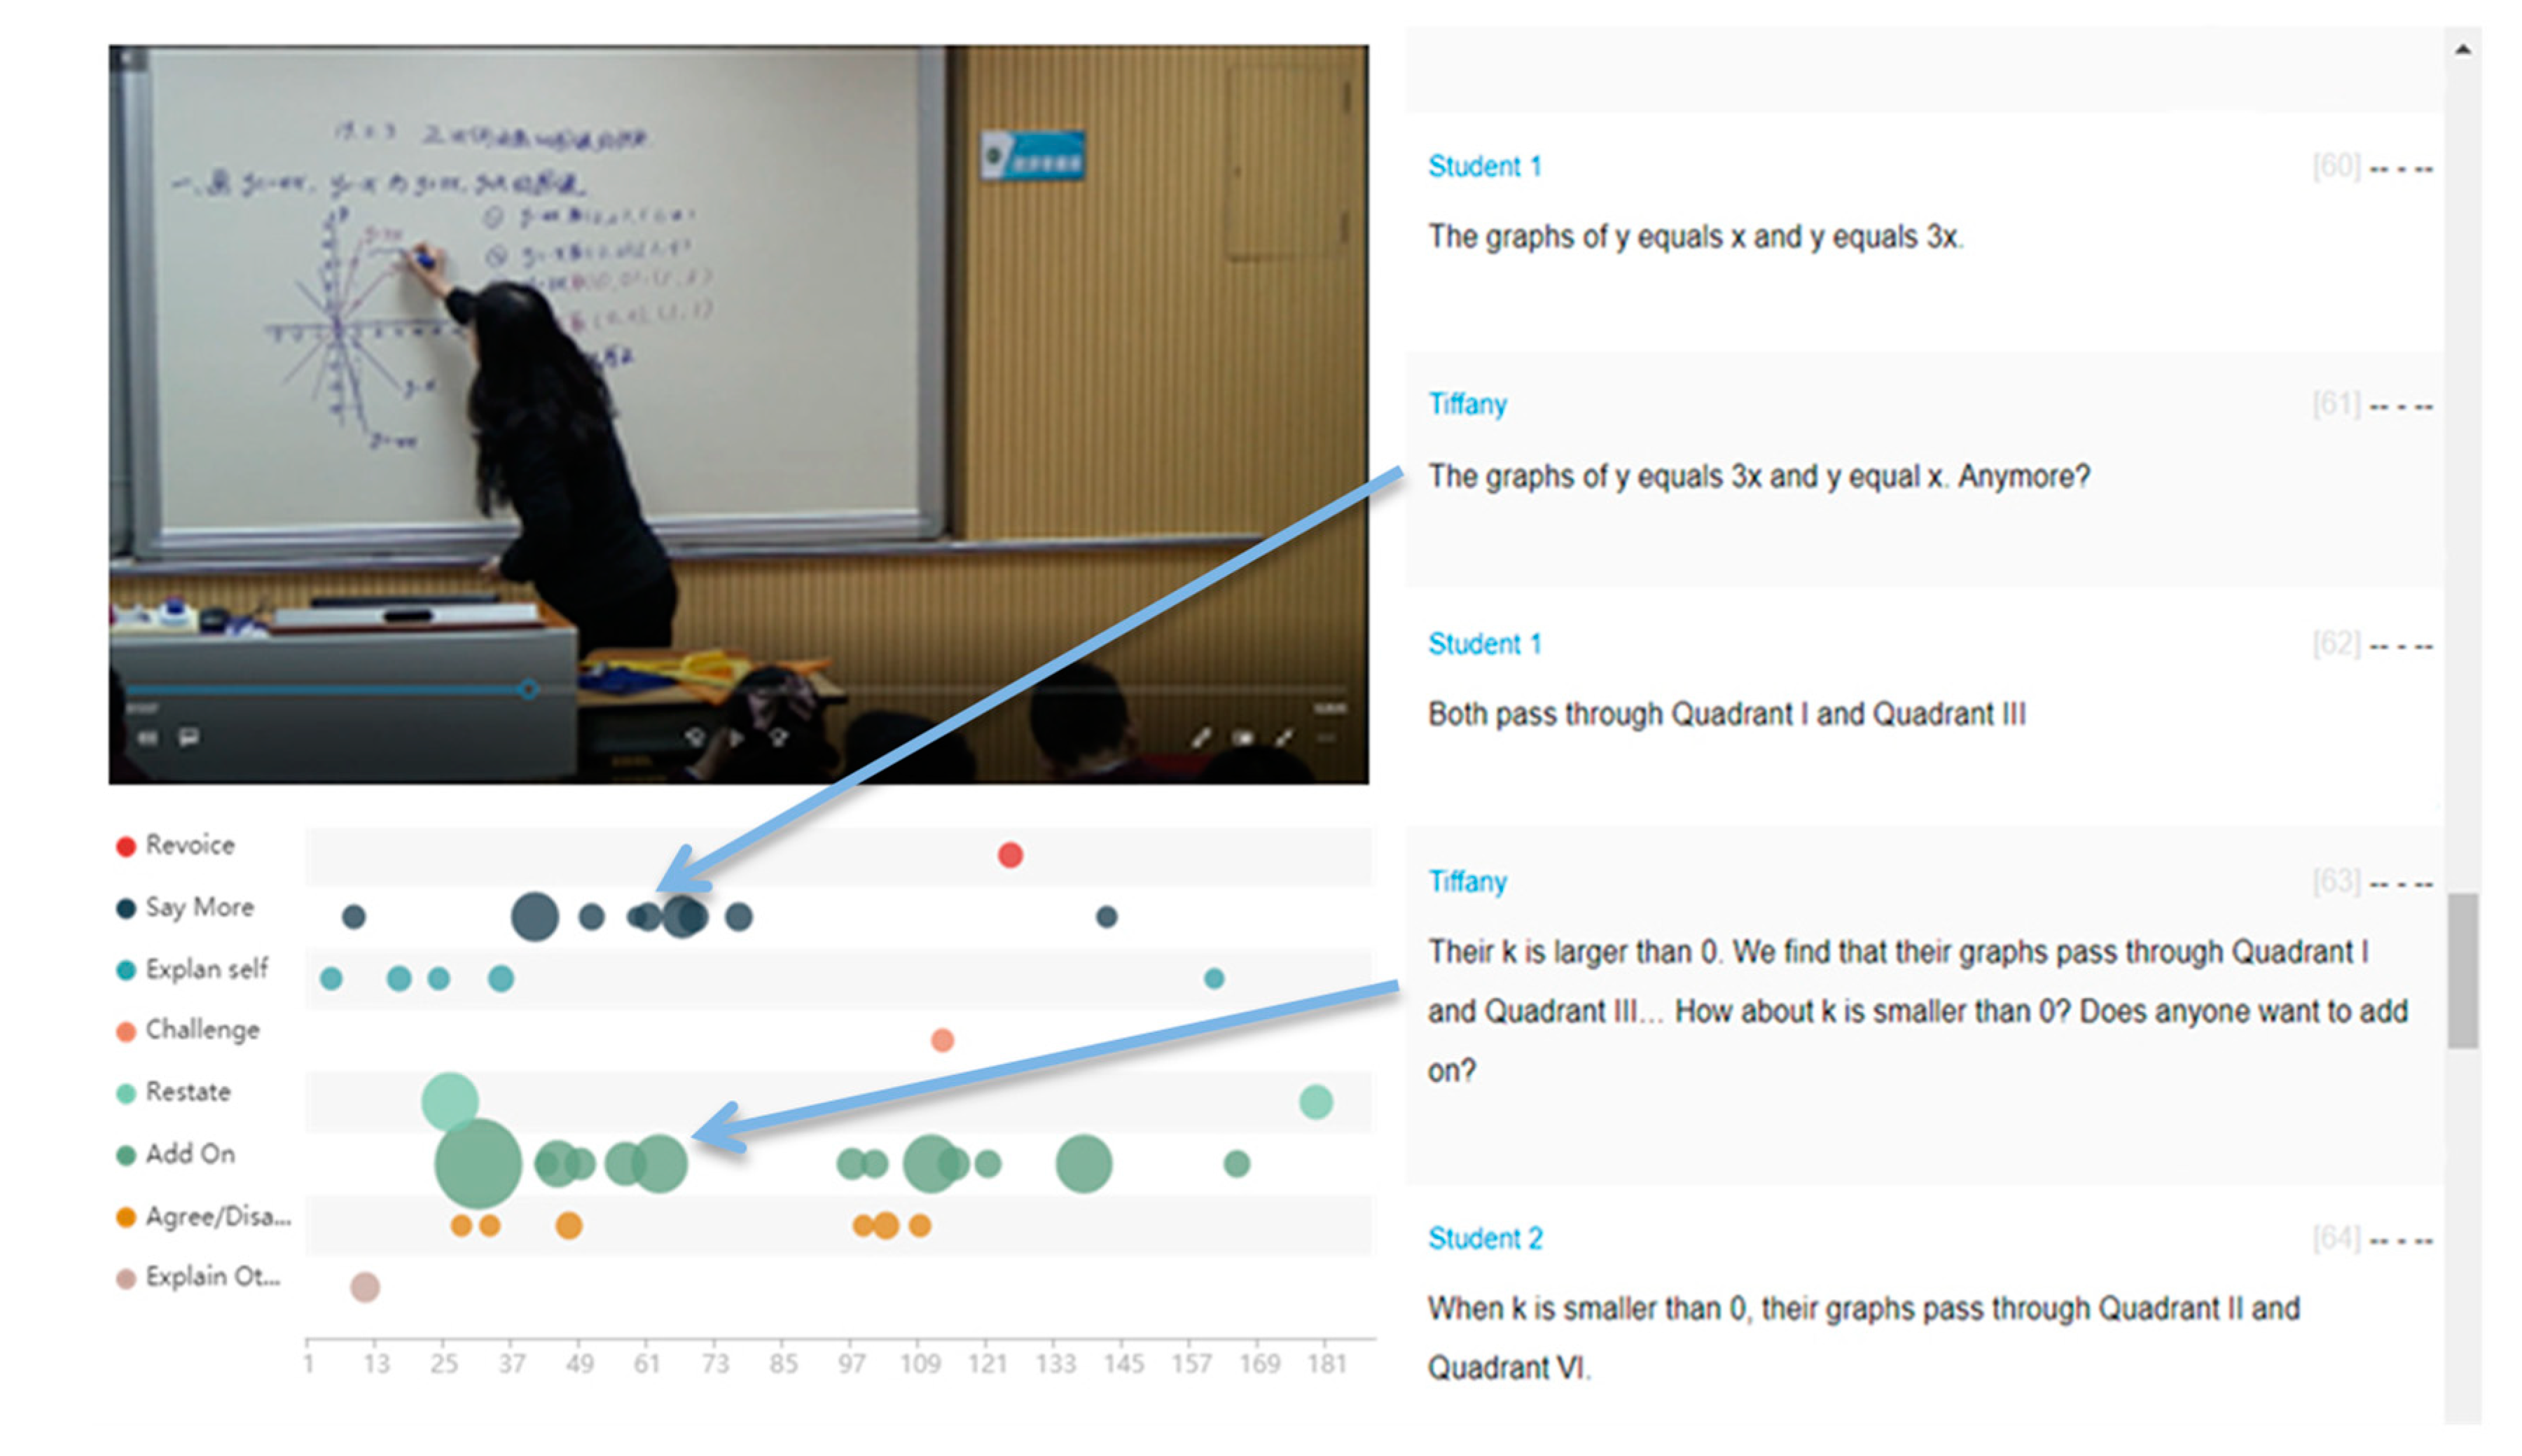
| Student 1 | The graphs of y equals x and y equals 3x. | |
| Tiffany | The graphs of y equal 3x and y equal x. Anymore? | Say more |
| Student 1 | Both pass through Quadrant I and Quadrant III. | |
| Tiffany | Their k is larger than 0. We find that their graphs pass through Quadrant I and Quadrant III… How about k is smaller than 0? Does anyone want to add on? | Add on |
| Student 2 | When k is smaller than 0, their graphs pass through Quadrant II and Quadrant VI. |
| Group | Teacher | Time | SM | PR | RV | CH | RS | AD | EO | AO | Total |
|---|---|---|---|---|---|---|---|---|---|---|---|
| Treatment | Tiffany | Start | 6 | 0 | 0 | 0 | 0 | 0 | 0 | 1 | 7 |
| Middle | 7 | 13 | 0 | 0 | 0 | 1 | 0 | 1 | 22 | ||
| End | 9 | 5 | 1 | 1 | 2 | 6 | 1 | 13 | 38 | ||
| Tana | Start | 1 | 3 | 4 | 0 | 0 | 3 | 2 | 3 | 16 | |
| Middle | 9 | 13 | 0 | 1 | 0 | 0 | 4 | 4 | 31 | ||
| End | 27 | 10 | 0 | 2 | 0 | 3 | 4 | 21 | 67 | ||
| Comparison | Cherry | Start | 7 | 1 | 1 | 1 | 0 | 1 | 1 | 3 | 15 |
| Middle | 1 | 3 | 0 | 0 | 0 | 0 | 0 | 6 | 10 | ||
| End | 6 | 2 | 1 | 0 | 0 | 0 | 0 | 10 | 19 | ||
| Chloe | Start | 9 | 2 | 2 | 1 | 0 | 1 | 0 | 2 | 17 | |
| Middle | 6 | 6 | 0 | 0 | 0 | 0 | 0 | 9 | 21 | ||
| End | 9 | 7 | 3 | 0 | 0 | 2 | 0 | 9 | 30 |
| Domain | Full Mark | Group | M (SD) | Q1 | Mdn | Q3 | z | p |
|---|---|---|---|---|---|---|---|---|
| Overall scores | 47 | Treatment | 38.28 (6.97) | 37.00 | 40.00 | 42.00 | −0.66 | 0.51 |
| Control | 38.80 (4.97) | 38.00 | 39.00 | 42.00 | ||||
| Knowing | 9 | Treatment | 8.16 (1.54) | 8.00 | 9.00 | 9.00 | −0.14 | 0.89 |
| Control | 8.27 (1.17) | 8.00 | 9.00 | 9.00 | ||||
| Applying | 15 | Treatment | 12.03 (2.17) | 11.00 | 13.00 | 14.00 | −0.55 | 0.58 |
| Control | 12.04 (1.89) | 11.00 | 12.00 | 13.00 | ||||
| Reasoning | 23 | Treatment | 18.08 (4.07) | 17.00 | 19.00 | 21.00 | −0.49 | 0.96 |
| Control | 18.50 (2.71) | 17.00 | 19.00 | 20.00 |
Publisher’s Note: MDPI stays neutral with regard to jurisdictional claims in published maps and institutional affiliations. |
© 2021 by the authors. Licensee MDPI, Basel, Switzerland. This article is an open access article distributed under the terms and conditions of the Creative Commons Attribution (CC BY) license (https://creativecommons.org/licenses/by/4.0/).
Share and Cite
Lo, C.K.; Chen, G. Improving Experienced Mathematics Teachers’ Classroom Talk: A Visual Learning Analytics Approach to Professional Development. Sustainability 2021, 13, 8610. https://doi.org/10.3390/su13158610
Lo CK, Chen G. Improving Experienced Mathematics Teachers’ Classroom Talk: A Visual Learning Analytics Approach to Professional Development. Sustainability. 2021; 13(15):8610. https://doi.org/10.3390/su13158610
Chicago/Turabian StyleLo, Chung Kwan, and Gaowei Chen. 2021. "Improving Experienced Mathematics Teachers’ Classroom Talk: A Visual Learning Analytics Approach to Professional Development" Sustainability 13, no. 15: 8610. https://doi.org/10.3390/su13158610
APA StyleLo, C. K., & Chen, G. (2021). Improving Experienced Mathematics Teachers’ Classroom Talk: A Visual Learning Analytics Approach to Professional Development. Sustainability, 13(15), 8610. https://doi.org/10.3390/su13158610