Article

Optimization of Granulation Process for Binder-Free Biochar-Based Fertilizer from Digestate and Its Slow-Release Performance

1
School of Agriculture and Biology, Shanghai Jiao Tong University, 800 Dongchuan Road, Shanghai 200240, China
2
Shanghai Pudong Agriculture Technology Extension Centre, Shanghai 201201, China
3
Shanghai Liming Resources Reuse Co., Ltd., Shanghai 201209, China
*
Author to whom correspondence should be addressed.
Sustainability 2021, 13(15), 8573; https://doi.org/10.3390/su13158573
Submission received: 9 July 2021 / Revised: 25 July 2021 / Accepted: 27 July 2021 / Published: 31 July 2021

Abstract

:
Granulation of biochar-based fertilizer is one potential method to reduce transportation costs, provide for enhanced handling, and decrease the loss of fertilizer during soil application. This study aimed to synthesize binder-free biogas residue biochar-based fertilizer (RBF) pellets and investigate their physical properties and slow-release potential. Results showed that the physical properties and forming quality of the pellets reached the best when the moisture content was 7.84%, the diameter was 7 mm, the compression speed was 49.54 mm/min, and the molding pressure was 7.5 MPa. Sustained-release kinetic analysis and characterization results identified that the RBF had excellent nitrogen (N), phosphorus (P), and potassium (K) sustained release properties. The sustained release of nutrients gradually increased with the drying temperature, and the sustained-release effect of P was the best, followed by that of N and K. Therefore, RBF pellets may be applied as a green slow-release fertilizer in agricultural production. Physical, chemical, and slow-release properties could be improved by optimizing the drying and granulation process parameters, thus providing a new idea for the combination of kitchen waste recycling and sustainable agricultural development.

1. Introduction

Large amounts of kitchen waste are produced as the population increases, resulting in potential environmental and economic burdens [1]. Anaerobic digestion, as an environmental friendly method to dispose of kitchen waste, has received increasing attention due to its significant potential in waste reuse and environmental climate change [2]. However, the biogas residues produced during the anaerobic digestion of kitchen waste remain a burden. Having regenerated biomass, biogas residues are used as soil amendments and organic fertilizers [3]. However, the use of unprocessed biogas residues also has its drawbacks. First, their nutrients feature high mobility [4], which allows them to be easily lost from soils and increases the eutrophication of water. Notably, the application of biogas residue as soil fertilizer requires P fertilizer supplementation to avoid P deficits [5]. Second, problems of phytotoxicity, soil toxic substances [6], viscosity, and odor exist when the applied amount exceeds the acceptable capacity of farmland. Converting biogas residue to biochar through pyrolysis could compensate for these deficiencies.
Biochar is a highly aromatic solid product obtained through the thermal decomposition of biomass under oxygen-limited conditions [7]. It has developed pore structure, a large specific surface area, abundant functional groups, an active surface charge, and strong adsorption performance [8]. It could be used as a slow-release fertilizer carrier material to be mixed with chemical fertilizers for biochar-based fertilizer, showing higher utilization rate for fertilizer and plant growth-promoting effects [9]. Biochar-based fertilizer is considered to be a valid method to solve the low utilization rate of traditional fertilizer and alleviate the water eutrophication caused by excessive fertilizer application [10].
At present, the preparation methods for biochar-based fertilizer mainly include mixing, coating, adsorption, and mixed granulation. Steiner et al. prepared biochar-based fertilizer via mixing, and this method could prolong the N supply time [11]. Khan et al. used fertilizer solution containing N, P, and K to impregnate charcoal and prepared biochar-based fertilizer; they found that the nutrient leaching loss was slow [12]. However, biochar-based fertilizers, which have the characteristics of brittleness, low density, and wide particle-size distribution, prepared by traditional synthetic methods are not convenient for long-term storage, transportation, and large-area production [13]. Majo et al. concluded that 20–53% of biochar in soil was lost from surface runoff during heavy rainfall [14]. Husk et al. showed that 25% of biochar was lost during transportation to the field [15]. Pelletization of biochar is one potential method to reduce transportation and handling costs and significantly decrease the loss of biochar during soil application [16]. However, little information is available on fertilizer-embedded biochar pellets produced from biogas residue.
Mixed granulation is a main preparation method with the highest production efficiency at present. In this method, the biochar is mixed with chemical fertilizer and a certain amount of binder and then granulated by mechanical extrusion or disc granulation. However, the binder may cause environmental damage due to non-degradation and prevent the biochar from improving the soil environment after the release of fertilizer by blocking the biochar pores [17]. Mostafa et al. argued that pellet properties mainly depend on raw material characteristics, such as particle size and moisture content, and operating conditions, such as applied pressure and mold temperature [18]. Kim et al. found that the mechanical and slow-release properties of biochar-based fertilizer increased with the increase in drying temperature [13].
The present study aimed to optimize the drying and pelletization process parameters to prepare binder-free biogas residue biochar-based fertilizer (RBF) by using biochar derived from biogas residue and chemical fertilizer as raw materials. It also aimed to optimize compressive strength, hydrophobicity, and durability as evaluation indices of the pellet properties. The distribution of fertilizers on the surface and pores of biochar at different drying temperatures was studied. Moreover, the chemical reactions between fertilizer and biochar functional groups were explored. A series of laboratory experiments was carried out to study the N, P, and K slow-release properties and related mechanisms of RBF from digestate.

2. Materials and Methods

2.1. Biochar-Based Fertilizer Preparation

Residues from biogas production were collected from the anaerobic fermentation tanks of Shanghai Liming Resources Reuse Co., Ltd. in China. The air-dried biogas residue was ground into pellets with a size less than 100 meshes. The powdered material was pyrolyzed at a temperature of 500 °C (heating rate: 15 °C/min) for 120 min under nitrogen flow to obtain biogas residue-based biochar (RB).
After the RB powder was dried in a 105 °C oven to a constant weight, the commercial compound fertilizer (CF, N: P2O5: K2O = 4:3:3) and biochar with a mass ratio of 2:1 were mixed evenly with a mixer. Then, different proportions of distilled water were added to obtain RBF pellets with water contents of 5%, 7.5%, 10%, 12.5%, and 15%.
The RBF pelletization was conducted using a universal material testing machine (WDE-100E, Chuance, Jinan, China), and self-made cylindrical forming molds with different apertures were connected to the universal material testing machine. The molding equipment was provided with a compressive bar with a limiting device, a die sleeve, two gaskets, and a pedestal. The rendering of the mold produced for compression specimens is shown in Figure S1. The RBF was pelletized in accordance with the optimal parameters, and then the pelletized RBF was processed at 25 °C, 65 °C, 105 °C, 145 °C, and 185 °C for 24 h to dry in the oven. Upon cooling, it was stored and sealed. The RBF pellets produced at different drying temperatures are referred to as RBF-T (RBF-25, RBF-65, RBF-105, RBF-145, and RBF-185).

2.2. Determination of Pellet Properties

Compression strength, durability, and hydrophobicity are important indicators to measure the quality of pellets. Compressive strength was measured using a digital hardness tester (YHKC-2A, particle strength tester, Xinghuan, Jiangsu, China), which records the maximum force that the pellet can withstand. The durability of pellets was evaluated by MICUM test [19]. The hydrophobicity of a sample can be expressed by equilibrium moisture content (ECM). The better the hydrophobicity is, the lower the ECM of the pellets. The ECM of the pellets was measured by placing them in a controlled environment (relative humidity of 82–84% at 24–25 °C) for 18 h. The ECM was calculated as follows [20]:
ECM = M M i M × 100 % ,
where Mi(g) and M(g) are the initial and instantaneous masses of the pellets, respectively.

2.3. Single-Factor Experiment

Four factors, comprising compression speed, molding pressure, moisture content, and diameter, were selected as single-factor test variables to explore the influence of each factor on compressive strength, hydrophobicity, and durability and obtain the optimal parameter range. RBF was pelletized on the basis of the basic operating parameters (compression speed: 40 mm/min, molding pressure: 7.5 MPa, moisture content: 10%, and diameter: 7 mm). The compression speed in the basic parameters was tested at 30, 40, 50, 60, 70, 80, 90, and 100 mm/min to analyze the influence of compression speed change on the particle properties. Similarly, the molding pressure was tested at 2.5, 5, 7.5, and 10 Mpa. The moisture content was tested at 5%, 7.5%, 10%, 12.5%, and 15%, and the diameter was tested at 5, 6, 7, and 8 mm, respectively. The compressive strength, hydrophobicity, and durability of the pellets were then measured.

2.4. Synthesis Process Optimization

A classic response surface methodology (RSM) was selected to investigate the factors that could affect the pellet properties. On the basis of a single-factor test, compression speed (X1), moisture content (X2), and diameter (X3) were selected as independent variables, and compressive strength (Y1), hydrophobicity (Y2), and durability (Y3) were selected as response variables for optimization. The Box–Behnken design (BBD) model using Design Expert (version 12.0.3.0) was selected to optimize the experimental design. The codes and levels of experimental factors are provided in Table 1. For the prediction of the optimal point, a quadratic regression model was selected for ANOVA and significance experiments. Applicability was determined using the coefficient of determination (R2) and R2 was adjusted in accordance with the relative accuracy of the test results. The significance of the regression model was evaluated by ANOVA, signal–noise ratio, p-values, F-values, and lack of fits.
The quadratic polynomial equation was as follows:
Y = β 0 + i = 1 n β i X i + i = 1 n β i i X i 2 + i , j = 1 ( i j ) n β i j X i X j ,
where Y represents the response variables predicted in the model (compressive strength, hydrophobicity, and durability); β 0 , β i , and β i i are the regression coefficients for intercept, linear quadric, and interaction terms, respectively; and   X i and X j represent the independent variables in the model.

2.5. Characterization

FTIR analysis of the changes in the surface functional groups that belonged to the pelletized RBF was performed using a Fourier transform infrared spectrometer (Nicolet 6700, Thermo Scientific Instrument, ThermoFisher, Waltham, MA, USA). The crystallographic structures of the samples were characterized using X-ray diffractometry (XRD, XRD-6100, Shimazu, Tokyo, Japan). The N2 adsorption isotherms, Brunauer–Emmett–Teller (BET) surface area, pore volume, pore diameter distribution (Barrett–Joyner–Halenda method), and average pore diameter were determined by standard N2 adsorption at 77 K (Autosorb IQ3, Quantachrome Instrument). Thermal stability was measured using a TG analyzer (NETZSCH STA449FC, Germany). Analyses were conducted under 30 mL/min nitrogen flow rate at a heating rate of 20 °C/min from room temperature to 1000 °C, and at least 10 mg of samples was used for each test [21].

2.6. Slow Release of N, P, and K

RBF pellets with different drying temperatures were used as raw materials, and CF was used as control. The slow-release experiment was designed in reference to National Standard GB/T 23348-2009. In brief, approximately 1 g of pellet was weighed and placed in a 150 μm (100 mesh) nylon gauze mesh bag, which was placed in 200 mL deionized water and cultured in a sealed container at room temperature (25 °C ± 0.5 °C). The mixed extract was extracted to determine the concentration of N, P, and K. The data generated from N, P, and K release from CF and RBF-T pellets were fitted into the first order kinetics model as follows:
ln ( q e q t ) = ln q e kt ,
where qe(mg/g) and qt(mg/g) refer to the releasing amount of N, P, or K at equilibrium and time t (h), respectively, and k is the rate constant (h−1).

3. Results

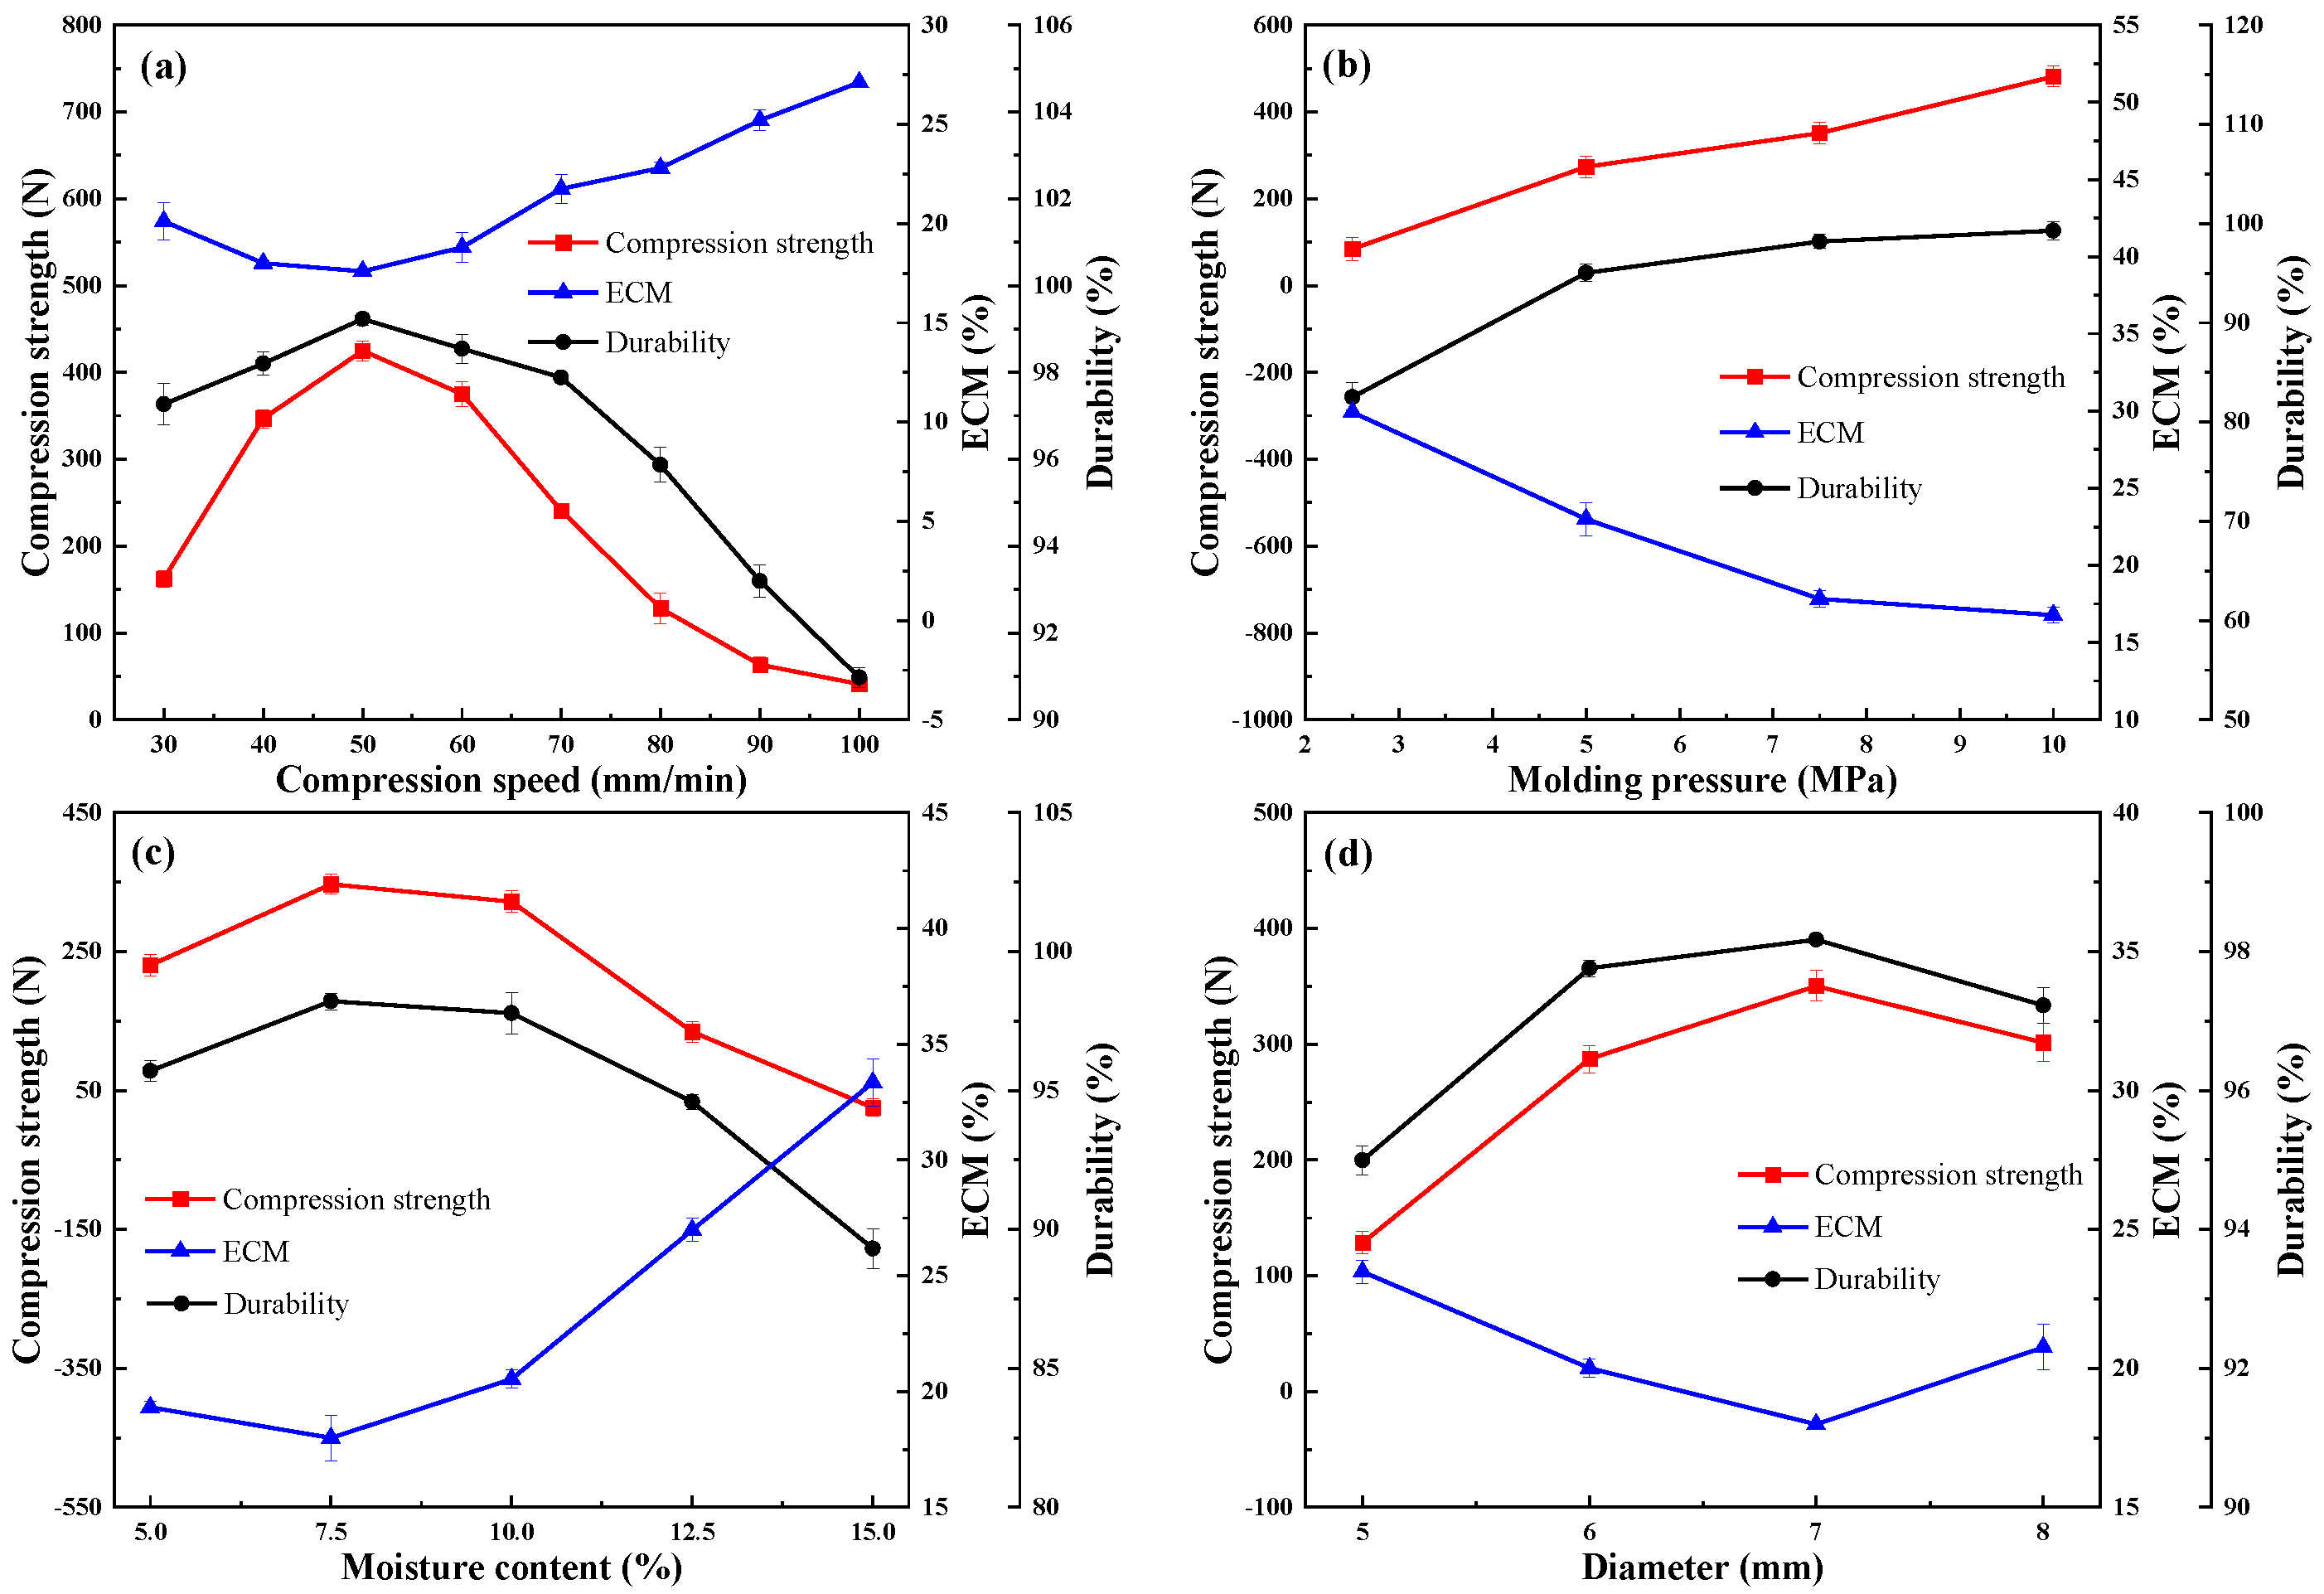
3.1. Single-Factor Impact Analysis

3.1.1. Effect of Compression Speed

As described in Figure 1a, with the increase in compression speed, the compressive strength and durability of the pellets first increased and then decreased. However, ECM showed an opposite trend. Meanwhile, from the demolding perspective, the surface layer of the pellet could loosen or fall off under increased compression speed. The compressive strength and durability ranged from 400.90 N to 424.75 N and from 90.97% to 99.23%, respectively, reaching the maximum at a compression speed of 50 mm/min. The peak height of the compressive strain was found to be lower at higher speeds [22] due to the longer interaction time between the material and the inner wall of the mold when using lower compression speed. The ECM reached the minimum at a compression speed of 50 mm/min, indicating that hydrophobicity was maximized around this compression speed. This finding may be related to the increase in particle densification with the increase in interaction time. Combined with the above results, the suitable compression speed range of pellets was 40–60 mm/min.

3.1.2. Effect of Molding Pressure

Figure 1b shows that the average compressive strength and durability increased as the molding pressure increased, but ECM decreased. Further analysis revealed that the compression strength increased almost linearly with the molding pressure. The data points were fitted with a linear function, with R2 = 0.97 (adjusted R2 = 0.96) indicating excellent linear correlation. However, when the molding pressure was increased up to 7.5 MPa, the material was closely packed with the inner wall of the mold, and the demolding rate of the pellets significantly decreased. The particles could not be separated from the mold at all when the pressure was more than 10 MPa. According to EN ISO 17831-1 [23], when the molding pressure is 7.5 Mpa, the durability of the pellets was 98.19% to be classified as compliant. The trend of EMC was relatively flat after the molding pressure exceeded 7.5 Mpa, indicating that the hydrophobicity attribute performed well under this pressure. Considering the higher molding pressure, total energy, and energy consumed during pelletization, the optimal pressure value was determined to be 7.5 MPa from the perspective of forming quality and reducing energy consumption.

3.1.3. Effect of Moisture Content

The moisture content of the raw material is regarded as one of the most significant factors affecting the quality of particles. The contact area could be increased by increasing the water content in the raw material, in turn making the water become a film-type binder with hydrogen bonding that may enhance its aggregation [24]. Figure 1c shows that with the increase in moisture content, the compressive strength had the same tendency as the durability and hydrophobicity; that is, it first increased then decreased. Peaks may also exist in the water content range of 5–10%. Meanwhile, during the pelleting process, the surface of the pellets was smooth and uniform when in the water content range of 5–10%.
The compressive strength of the pellets decreased when the moisture content was increased from 10% to 15%, possibly because the moisture content filled the pore space between the pellets and developed a larger bonding area, which showed a positive influence on pellets with high strength [25]. However, the water molecules could not be adsorbed on the surface of the particles in the presence of excess water, leading to the formation of a thick water layer, which hinders particle compaction and reduces particle strength at higher moisture content. The gradual increasing trend of the durability could be associated with the bonds promoted via Van der Walls’ forces between individual pellets [26]. The durability of the pellets decreased after reaching the optimal moisture content, which may have been due to the excess water used to fill the voids in the saturated mixture as a buffer, thus preventing the process of compression to some extent. The peak of hydrophobicity could be reached when the moisture content was approximately 7.5%. Therefore, raw materials with a moisture content of 5–10% were selected for subsequent experiments.

3.1.4. Effect of Diameter

As plotted in Figure 1d, with the increase in the diameter of pellets, the compressive strength, durability, and hydrophobicity approximately first increased and then decreased. This trend is the result of multiple factors, such as the length to diameter ratio (L/D), the cross-sectional area, and the friction force of particles. Extensive studies have shown that the compressive strength generally decreased as the L/D ratio increased [27]; the largest drop in compressive strength was found when the L/D ratio was between 0.75 and 1.2. Meanwhile, if the L/D ratio was less than or equal to 1, the increase in the cross-sectional area of pellets could also positively influence the compressive strength. However, because the length of particles was fixed to 4 mm, the L/D ratios were reduced with the diameter of pellets. Figure 1d clearly shows that the magnitude of change in compressive strength was comparatively larger when the diameter ranged between 5 (L/D ratios of 0.8) and 6 (L/D ratios of 0.67) mm. However, the decrease in the mechanism of friction force in the die of the pelletizer with increasing particle diameter was responsible for the decrease in compressive strength. Therefore, in terms of the overall change, one peak of compressive strength was present in the diameter between 6 and 8 mm.
In the process of compression, the stressed area of particles increased with the increase in diameter, thus improving the pressure-holding effect to some extent and making the particles more compact, which also promoted the durability and hydrophobicity of the particles. In turn, the surface area of pellets increased extensively with the diameter of particles, and this increase was not conducive to durability and hydrophobicity because more particles were exposed to the surface. Therefore, the durability and hydrophobicity also showed a trend of increasing first and then decreasing. These results indicated that the best value existed between 6 and 8 mm; thus, this range was chosen for subsequent discussion.

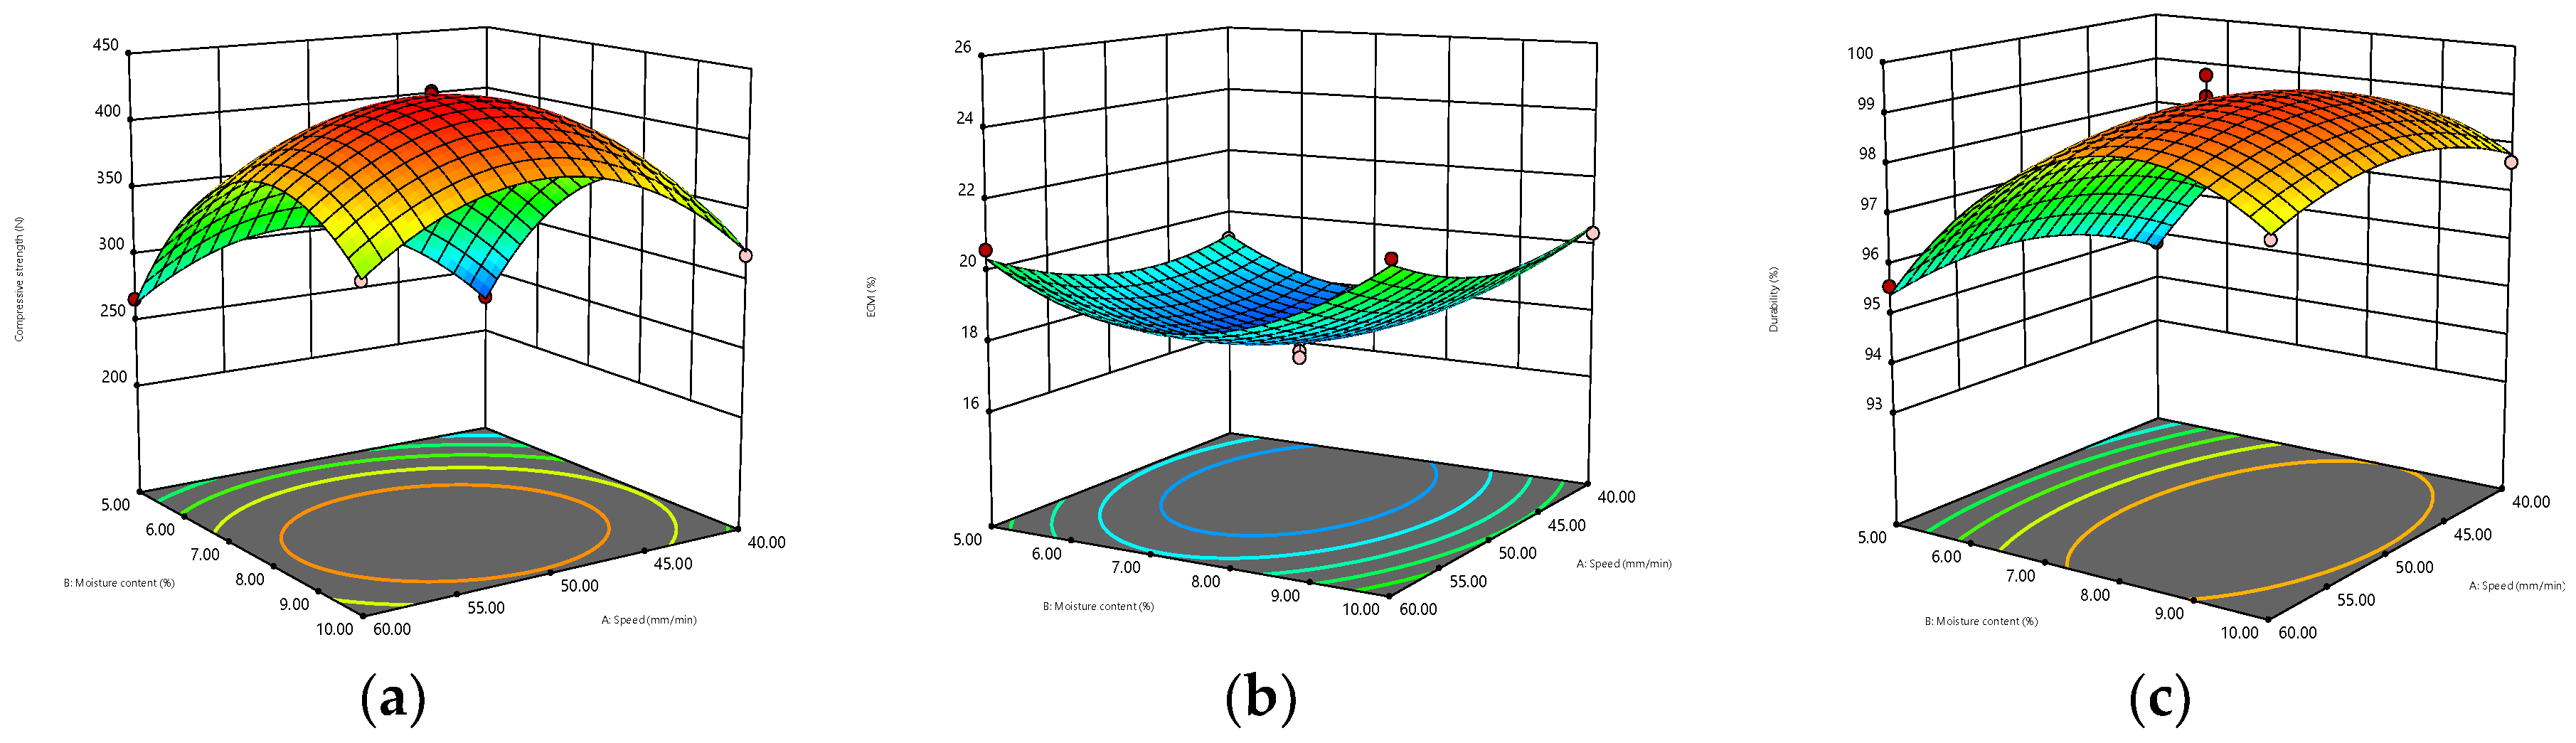
3.2. Comprehensive Optimization Analysis

3.2.1. Fitting of Process Model and Statistical Analysis

Seventeen experimental runs were carried out as designed by RSM to examine the effects of the three independent variables on the physicochemical properties of RBF pellets. As shown in Table S1, the observed compressive strength, ECM, and durability values were 203.73–427.77 N, 17.05–24.12%, and 93.70–99.58%, respectively. Based on the results of regression analysis (Table 2), the predicted and adjusted R2 of the model for compressive strength, ECM, and durability were 0.9892 and 0.9978, 0.8890 and 0.9609, and 0.8537 and 0.9625, respectively. The difference was less than 0.5, which indicated that the quadratic model was valid, and R2 > 0.90 for all parameters demonstrated significance [28]. Furthermore, the value of adequate precision that ranged from 19.6562 to 72.4015 (greater than 4) is desirable [29]. The values of coefficient variation (CV%) and standard deviation (Sd. Dev.) were lower than 2.15% and 3.89, respectively. This showed that the experimental values were reliable in this regression model [30]. The relationship between the actual and predicted recoveries of all responses is shown in Figure S2, and the results of ANOVA are displayed in Table 3. The p-values from the F-test of the model were less than 0.0001, which indicated that the models were of high significance and the lack of fit was not significant, suggesting that the test error was small and the regression model could better reflect the test results. In addition, the quadratic polynomial equation showing the relationship between the response value and independent experimental parameters in significant terms (terms with p-value ≤ 0.05) of coded factors was presented as below:
Y 1 = 423.98 + 13.82 X 1 + 42.64 X 2 + 23.74 X 3 4.41 X 1 X 2 + 28.39 X 2 X 3 59.60 X 1 2 76.94 X 2 2 92.05 X 3 2  
Y 2 = 17.60 + 0.4498 X 1 + 0.5589 X 2 + 0.8262 X 3 + 0.8320 X 1 2 + 1.94   X 2 2 + 3.30 X 3 2  
Y 3 = 99.0968 + 1.35 X 2 + 0.5921 X 3 0.6630 X 1 2 2.02 X 2 2 1.17 X 3 2    

3.2.2. Pareto Analysis

Graphical information about the quantification results of the influence of every operation parameter for the response value could be obtained through graphical Pareto analysis using the following equation [31]:
P i = b i 2 b i 2 × 100 ( i 0 )
where bi represents the estimation of the significant effect of the operational parameters as indicated by the quadratic equation. The results of correlational analysis are presented in Figure S3. Taken as a whole, compression speed ( X 1 ) showed the minimum contribution, which indicated that the compression speed had the least effect on particle quality. Furthermore, the influences of various factors on compression speed ( X 1 ) were in the following order: moisture content ( X 2 ), diameter ( X 3 ), and compression speed ( X 1 ). Meanwhile, the order of influence on ECM and durability was diameter ( X 3 ), moisture content ( X 2 ), and compression speed ( X 1 ), respectively, and moisture content ( X 2 ), diameter ( X 3 ), and compression speed ( X 1 ), respectively. However, except for the significant interaction between X 2 X 3 and compressive strength, no other significant interactions were observed. Among them, interaction factor X 3 2   showed a substantial effect on ECM, with a percentage contribution of 64.38%.

3.2.3. Optimal Synthesis Parameters
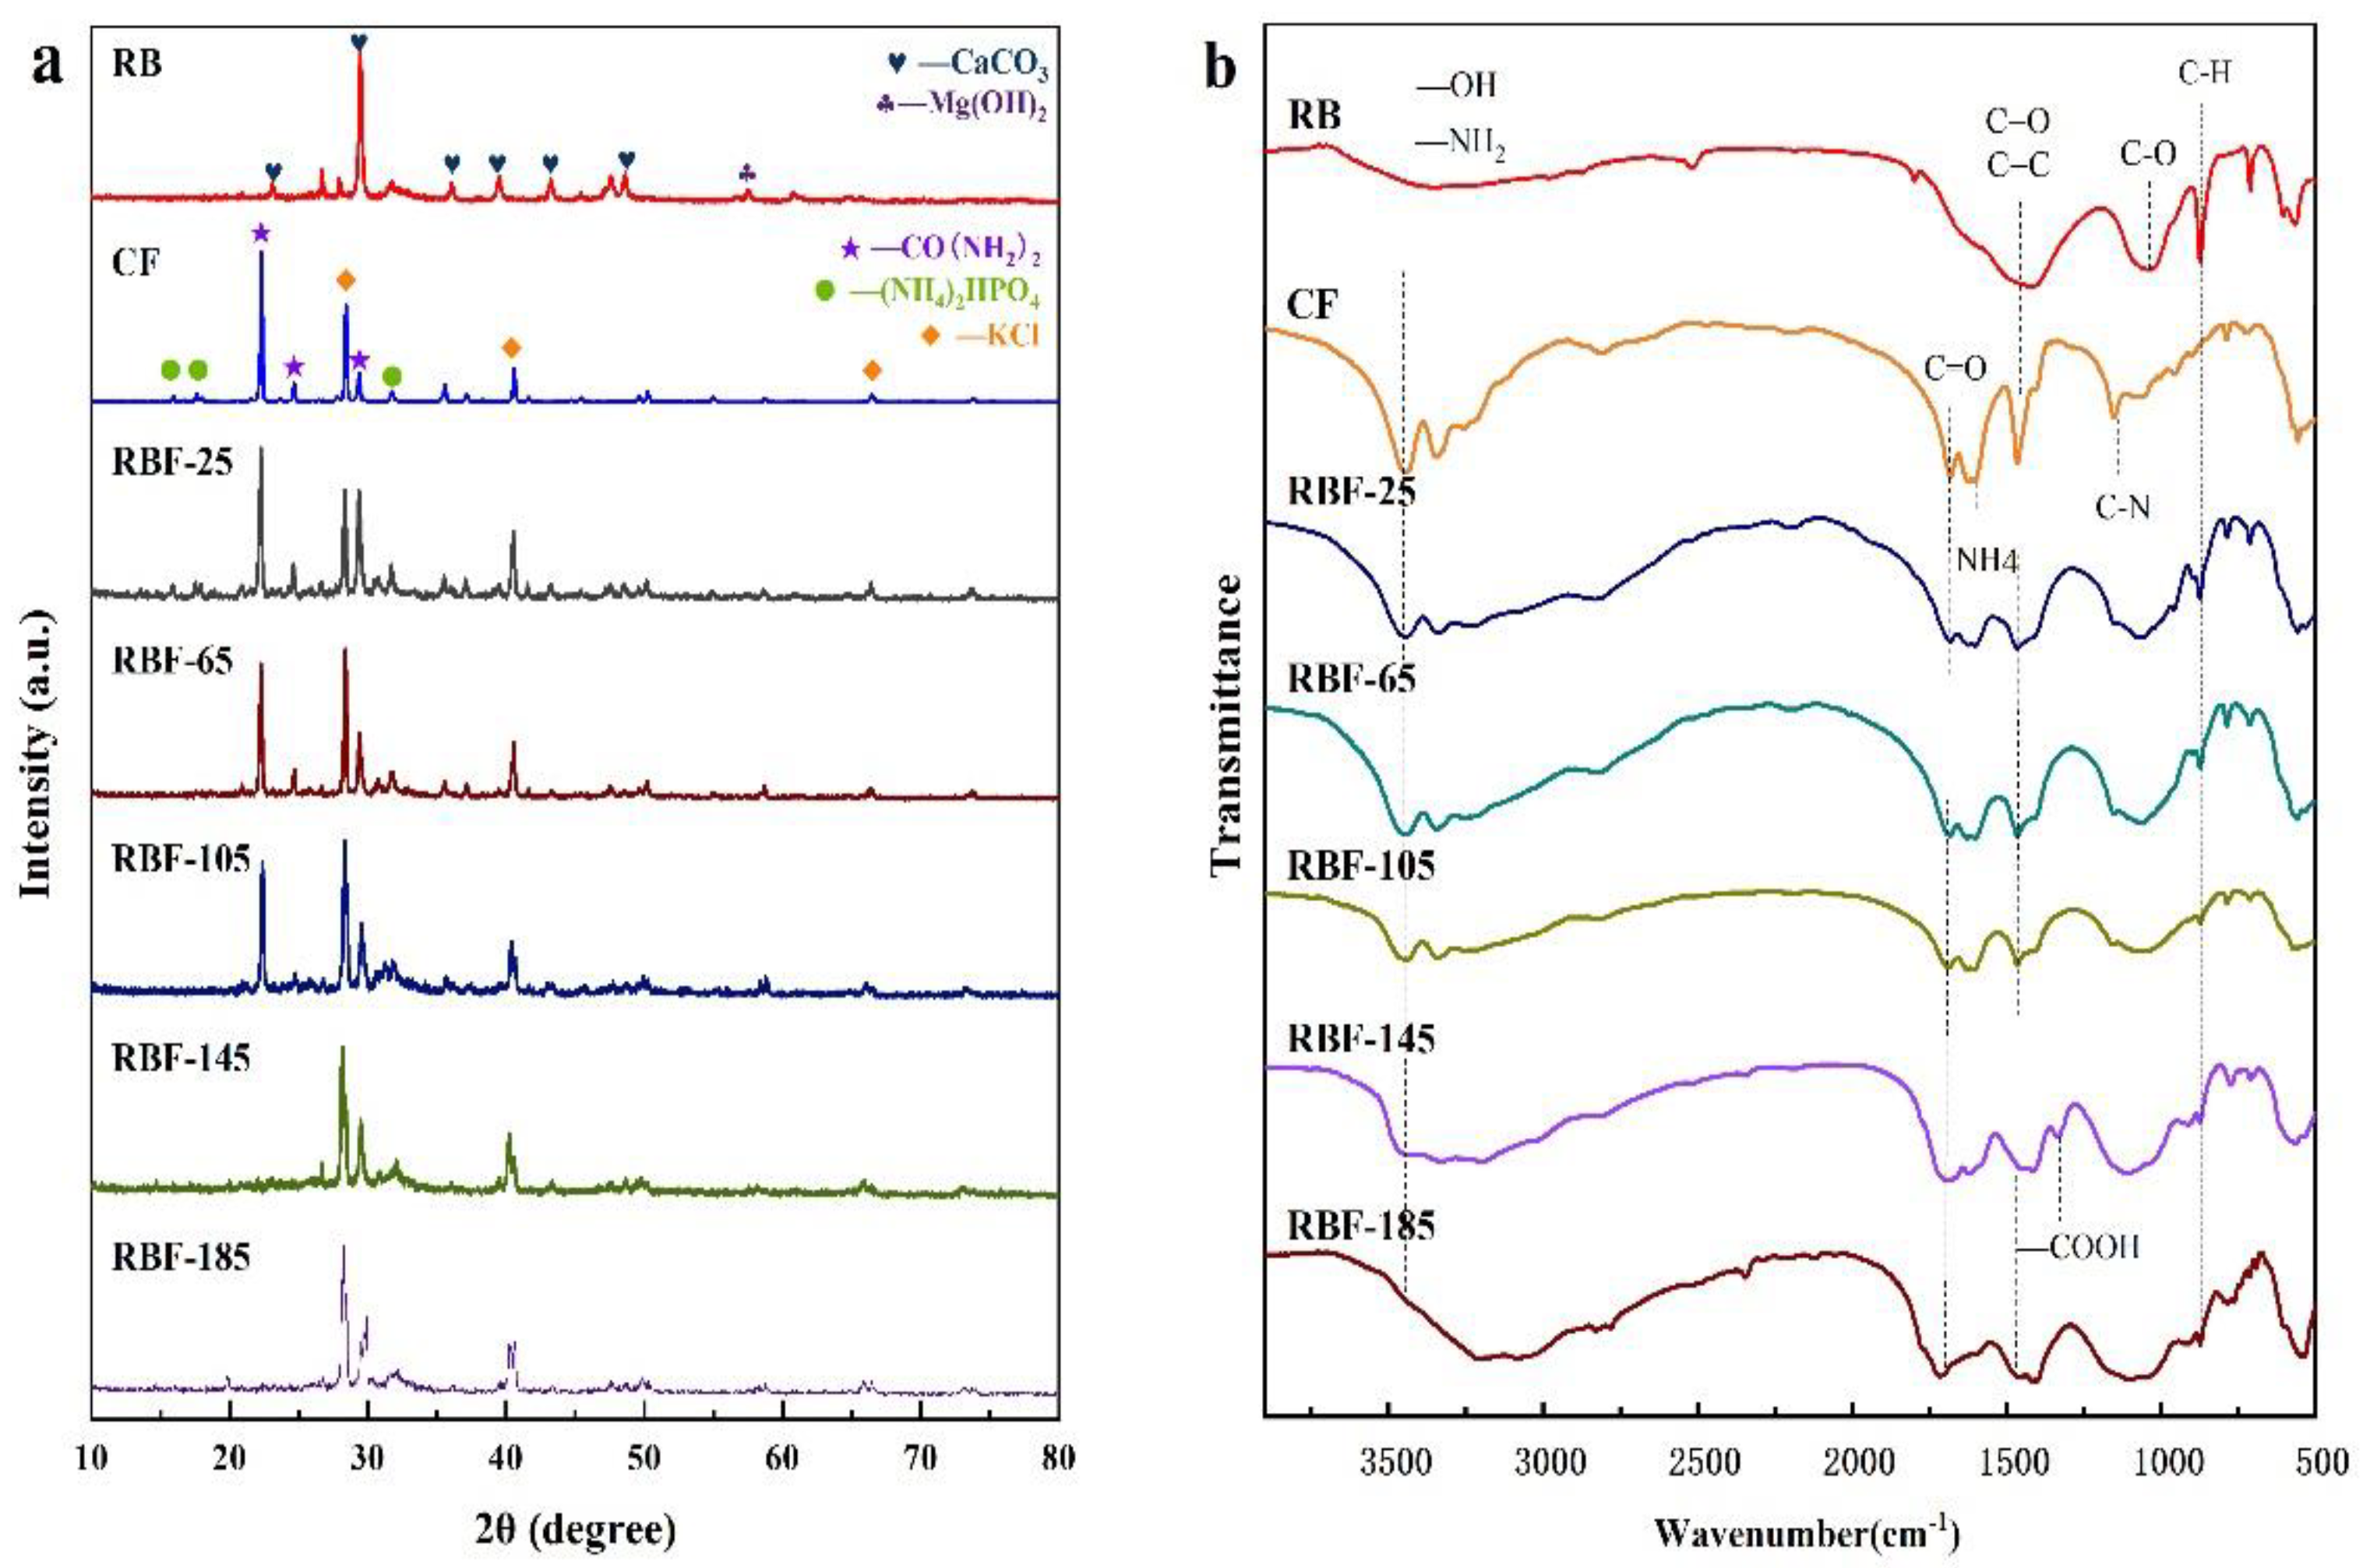
The 3D surfaces obtained by the BBD model are displayed in Figure 2. The warmer colors (close to red) of the 3D surfaces correspond to higher compressive strength, ECM, and durability, while the cooler colors (close to blue) correspond to lower compressive strength, ECM, and durability. Meanwhile, the greater the interaction between the two parameters is, the more curved the response surface is, and the more regular the circle of the 2D projection is. Figure 2a–c shows that when the diameter was constant, the interaction of moisture content and compression speed had the most significant effect on the compressive strength, and the response surface could reach the maximum bending degree. Meanwhile, from the perspective of 2D projection, the warm color circle tended to the position where the velocity and water content were relatively high. For ECM, the interaction of the two parameters was less influential, and the response surface was relatively flat, which may be due to the already high level of the exploration range selected for this response surface. However, ECM decreased first and then increased with the increase in water content, but the change in speed was small. The interaction of the two parameters was marginally non-significant for durability, and the warm color circle skewed towards a high moisture content (7.5–10%). When the moisture content remained constant, the effect of the interaction between compression speed and diameter on the response value could be obtained, as shown in Figure 2d–f. The response surface of compressive strength was relatively curved, increasing first and then decreasing with the increase in diameter, and decreasing first and then increasing with the increase in speed. The interaction of ECM was not significant, and the 2D projection was elliptical. ECM decreased first and then increased with the increase in diameter, but it did not change remarkably with the compression speed, and the relatively flat 3D surface of durability was likely caused by its high overall durability level. As shown in Figure 2g–i, the interaction of moisture content and diameter had a significant effect on the three response values when the compression speed remained constant. In particular, the effect on ECM and durability was significantly stronger than the previous two interactions.
In summary, in accordance with the 3D surface and analysis results of the BBD model, the optimum parameters were determined as follows: compression speed of 49.54 mm/min, moisture content of 7.84%, diameter of 7 mm, with the highest compressive strength, highest durability, and lowest ECM (corresponding to the highest hydrophobicity) as the optimization objectives. Under these conditions, the compressive strength was 427.77 N, the ECM was 17.70%, and the durability was 99.24%. Table 4 provides the optimized operating parameters and the corresponding predicted and actual response values. The relative errors of compressive strength, ECM, and durability between the predicted and measured values were 0.43%, 1.24%, and 0.11%, respectively, indicating that the model fitted well.

3.3. XRD Analysis

The crystal structures of RB, CF, and RBF-T are shown in Figure 3a. The XRD pattern of RB clearly showed six diffraction peaks from CaCO3 (JCPDS no. 86-0174) at around 23.14°, 29.48°, 36.05°, 39.54°, 43.26°, and 48.64°. At around 26.71°, the peaks of Mg(NO3)2 crystals were displayed (JCPDS no. 19-0765). Meanwhile, the XRD pattern of CF presented three main diffraction peaks of CO(NH2)2 (JCPDS no. 83-1436) at around 22.35°, 24.73°, and 29.44°; KCl (JCPDS no. 41-1476) at around 28.41°, 40.60°, and 66.49°; and (NH4)2HPO4 (JCPDS no. 70-1461) at around 15.94°, 17.60°, and 31.74°. More caudally, the diffraction peaks assigned to CO(NH2)2, (NH4)2HPO4, and KCl were obviously observed in the patterns of RBF-25, RBF-65, and RBF-105, and no new diffraction peaks occurred, indicating that RB was effectively filled by CF while keeping the structure stable. However, the characteristic reflection of CO(NH2)2 gradually decreased with the increase in temperature. Combined with the results of FTIR analysis, this finding may be due to the fact that CO(NH2)2 reacted with the –COOH of RB while filling the porous structure of CO(NH2)2, resulting in the decrease in the crystallinity of CO(NH2)2 [7]. In parallel, after the temperature reached 65 °C, the diffraction peak distributed by KCl was found to be significantly enhanced, indicating that higher temperature is more conducive to KCl crystal. Interestingly, when the temperature reached 145 °C, the peak assigned to CO(NH2)2 almost disappeared and the diffraction peak intensity of (NH4)2HPO4 weakened. Meanwhile, due to oxidation, the peak assigned to CaCO3 and Mg(NO3)2 almost disappeared. These results indicate that the crystal structures of RBF-145 and RBF-185 considerably changed.

3.4. FTIR Analysis

The FTIR spectra of RB, CF, and RBF are shown in Figure 3b. The most prominent chemical bond vibration peaks of RB were mainly distributed at 3361, 1461, 1064, and 873 cm−1. The –OH stretching vibration of hydroxyl groups corresponded to the vibration peak at 3400 cm−1. The peak at 1438 cm−1 in the spectrum of biochar may be the stretching vibration of C=O functional groups of quinine acid and ketoic acid or C=C of an aromatic nucleus. Meanwhile, the infrared spectrum showed C–N overlapping with C–O at around 1064 cm−1, and the peak located at 883 cm−1 was assigned to the −CH2 and C=C–H bond stretching vibrations [32]. These observations confirmed that −COOH could be found on the surface of RB. One part of −COOH was the initial functional group of the biomass residue itself, and the other part was generated on the surface of biochar due to the decomposition of oxygen-containing organic macromolecules at high temperature.
In addition, the FTIR spectrum of CF demonstrated four sharp vibrational bands at 3361, 1620, 1461, and 1157 cm−1, which corresponded to –NH2, C=O, C=C, and C–N, respectively. In addition, compared with that of RB, the spectra of CF and RBF showed a weak vibration peak around 788 cm−1, which may be attributed to the vibration of the PO43− group [33]. However, with the increase in reaction temperature, the reduction in vibration summit could be obviously seen in the infrared spectrum of RBF-185, possibly because when the temperature was higher than 145 °C, the molten CF diffused into the pores of biochar and flowed to the surface of biochar after filling all the pores completely. Moreover, the decrease in vibration peaks at 3361, 1602, and 1157 cm−1 in the spectrum of RBF-185 indicated N-loss when the temperature was higher than 145 °C.
Compared with RB and other RBFs, RBF-145 and RBF-185 showed a weak stretching peak of –COOH at around 1330 cm−1. The probable reason was that when the temperature was higher than 145 °C, the weakly alkaline –NH2 in molten CF was dissociated, while –H was ionized from −COOH or −OH of RB, resulting in the formation of amide through a hydrogen bond binding reaction [13]. When the processing temperature was below 145 °C, no significant difference was found between the FTIR spectra of RB, CF, and RBF, suggesting that no new chemical bonds emerged. However, the study suggested that the N atom of −NH2 in CF could attack the C atom of C=O in CF and RB, leading to the breaking of the double bond. Meanwhile, the H atom migrated to C=O and formed C–OH, which was further confirmed by the XRD spectra, and this reaction could occur at room temperature [17]. The infrared spectrum may not change because the new chemical bonds overlapped with the initial one.
The active functional groups on the RB surface were the main reason for the chemisorption of metal elements, and the carboxyl functional groups and C–O bonds play a crucial role in the surface complexation action of K ions [34]. Therefore, the higher the content of carboxyl functional groups and C-O bonds is, the higher the content of K nutrients fixed in biochar materials, and the more stable and solid the combination with K ions. A free hydroxyl functional group (·OH) could react with K ions through inner layer complexation. Thus, the firm binding degree of K ions to biochar is also related to –OH. The infrared spectrum showed that RB could adsorb K ions, and with the increase in binding temperature, the area of vibration peaks representing −OH and C–O (located around 3361 and 1064 cm−1, respectively) increased continuously, resulting in the stronger binding of K to biochar.

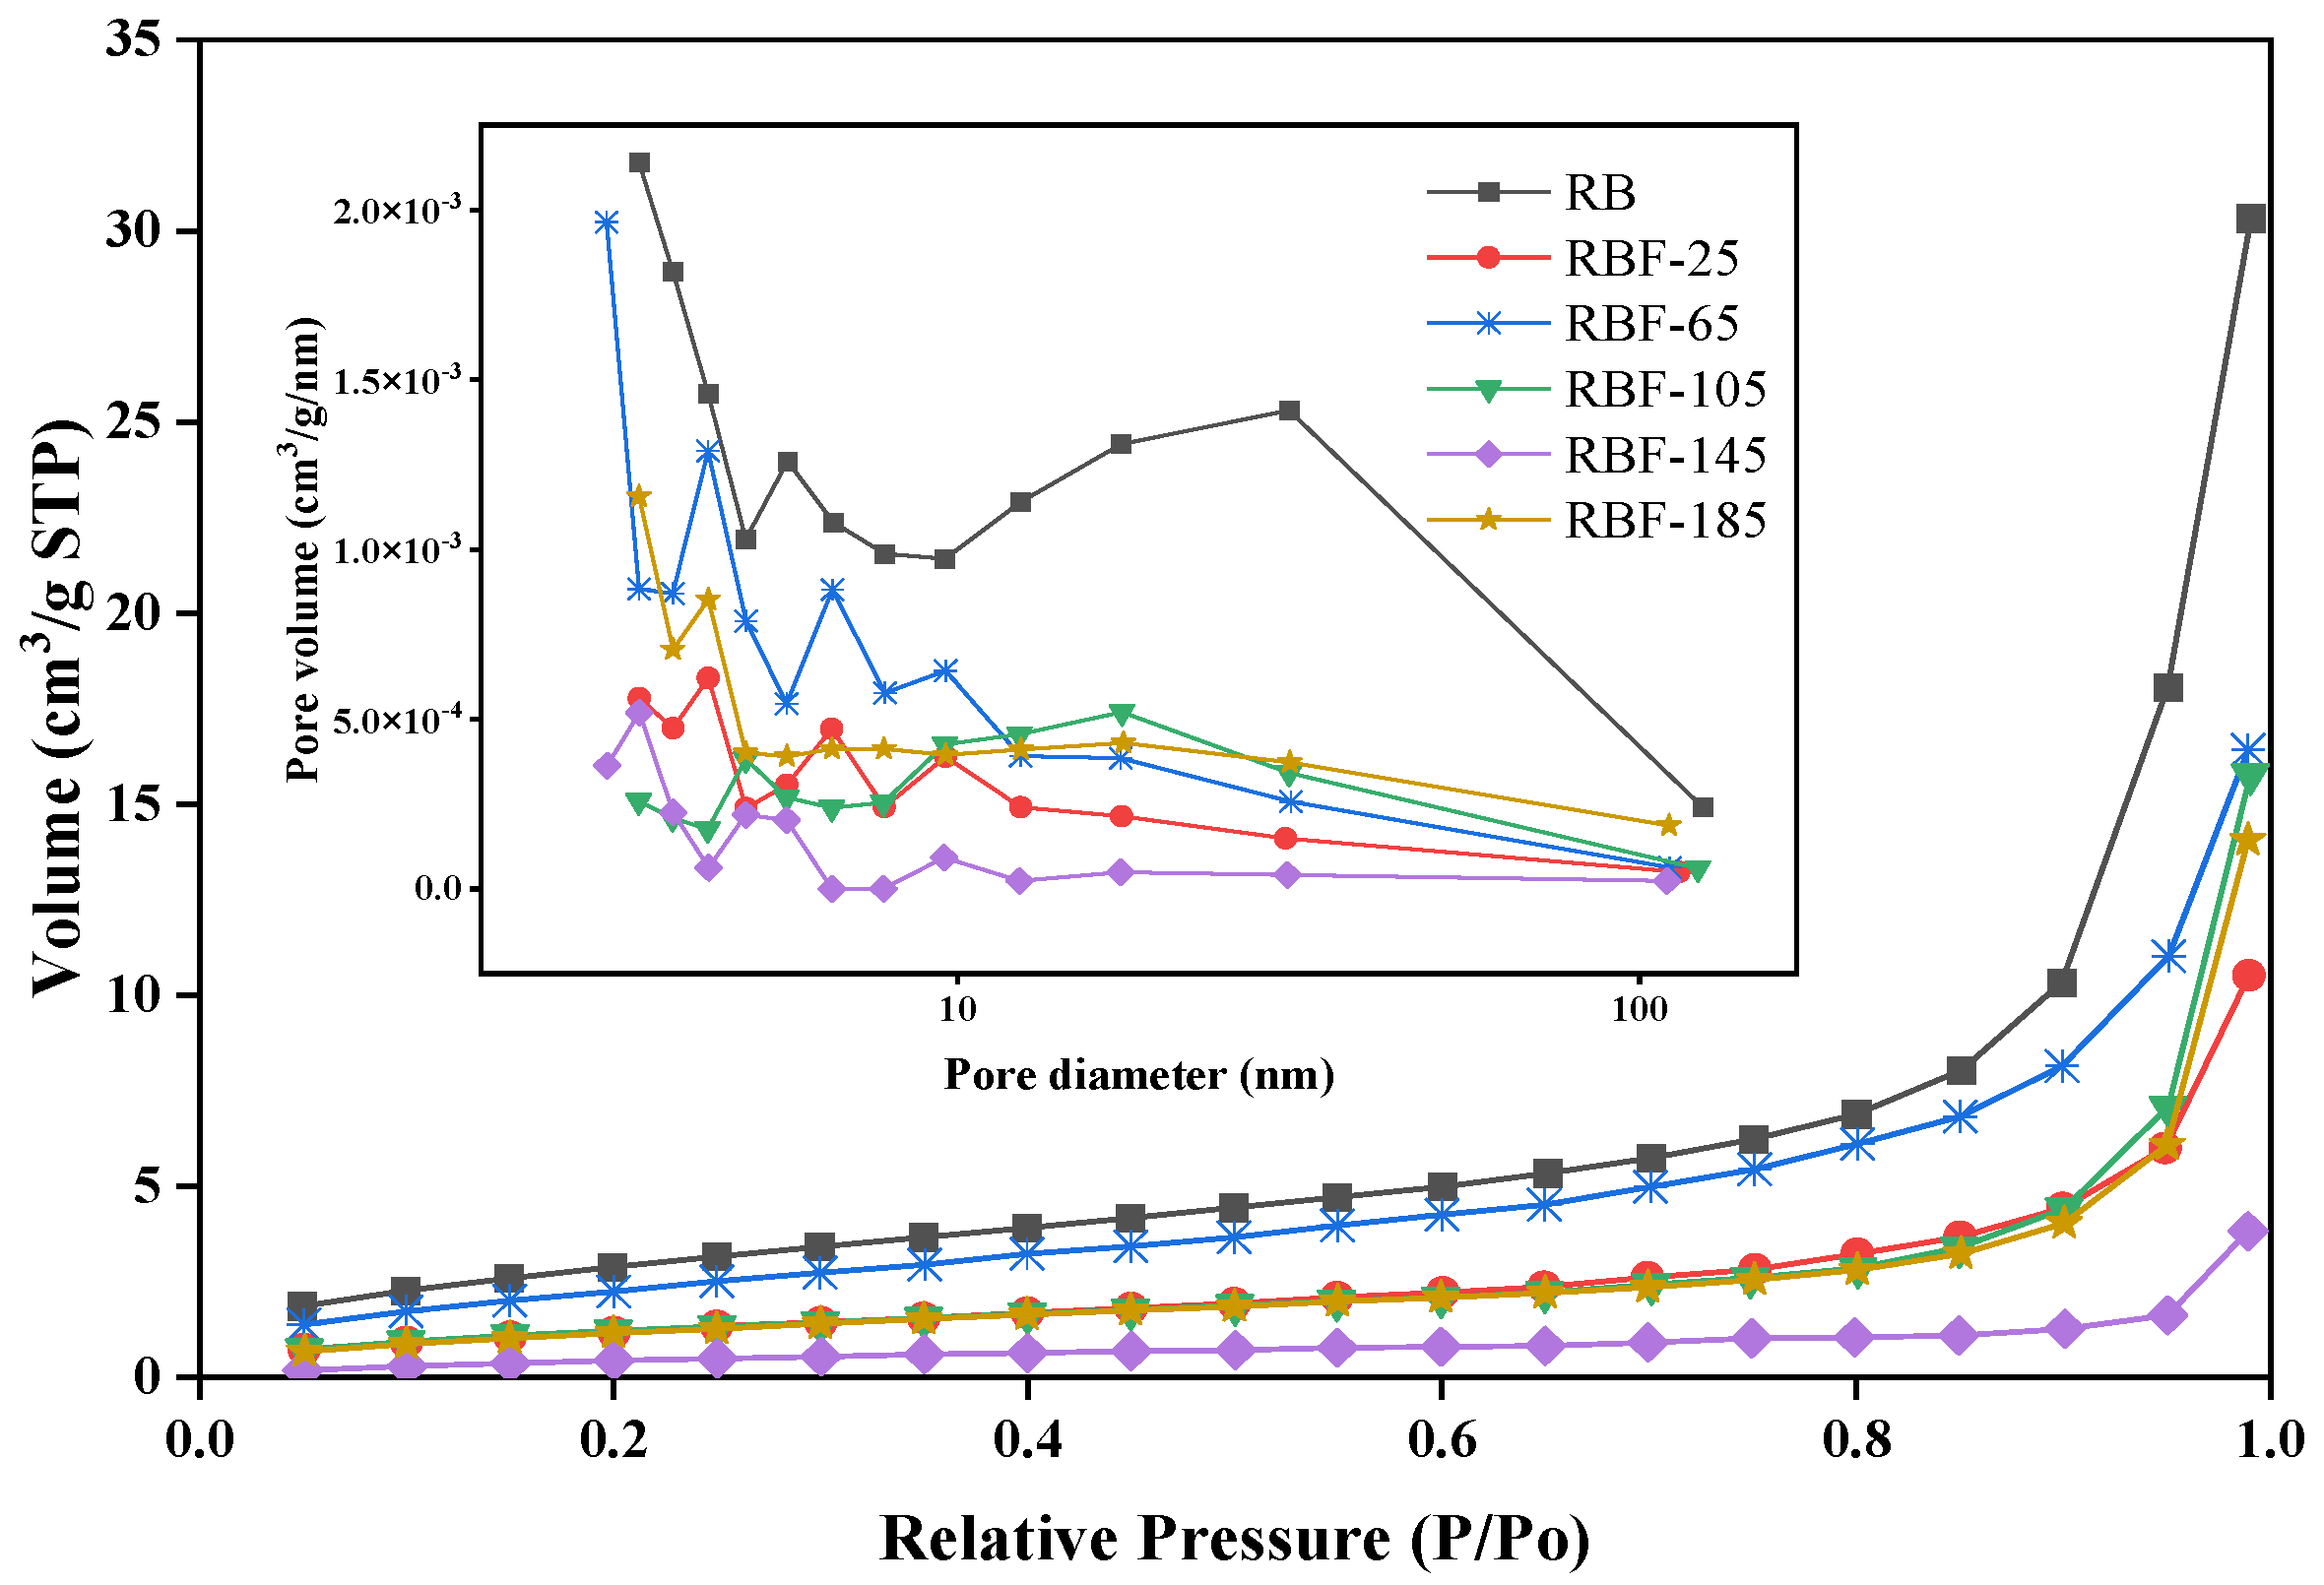
3.5. BET Surface Area and Porosity

As presented in Figure 4 and Table S2, the N2 adsorption isotherms showed type II characteristic (according to the IUPAC classification), indicating that mesopores and macropores existed in RB and RBF-T [35]. Further, the N2 adsorption capacity of RB was significantly higher than that of RBF-T, and the pore size decreased obviously (especially for macropores), indicating that CF could be inserted into the micropores and mesopores in RB and fill the macropores and exposed cavities of RB. The surface area of RBF-25 decreased by 57% and its pore volume and average pore size decreased by 65.34% and 19.39%, respectively, compared with those of RB as a result of CF covering the surface of RB and filling its macropores. However, the surface area and pore volume of RBF-65 increased by approximately 50% compared with those of RBF-25, and the average pore size continued to decrease, which may be related to the decomposition of CF and the reaction with RB. CO(NH2)2 could be decomposed into NH3 and HNCO. Then, as CF continued to fill in RB and when the mesopores that were originally covered were exposed again, the surface area and pore volume eventually increased to a certain extent. Compared with the surface area of RBF-65, that of RBF-105 decreased and its average pore size reached the maximum due to the number of macrospores that increased. This finding could be attributed to CF beginning to melt and infiltrate into RB at 105 °C. However, due to the low temperature and poor fluidity of molten CF, several mesopores were exposed again and the molten CF crystallized on the surface of the particles, resulting in reduced surface area.
The surface area, total pore volume, and average pore size of RBF-145 were all at minimum, indicating that CF could melt into the interior of RB to the maximum extent and interact with RB to produce new organic macromolecules at this temperature. This finding is consistent with the aforementioned XRD and FTIR analyses. Concomitantly, as the temperature reached room temperature, the molten CF crystallized on the surface or in the pores of RB, and the RBF pellets were held together by hydrogen bonding and intermolecular forces, which further improved the compressive strength, durability, and hydrophobicity of the pellets. However, when the temperature was greater than 145 °C, the surface area and pore size increased slightly. Combined with the results of FTIR analysis, this phenomenon was due to the excessive fluidity and high decomposition degree of molten CF, resulting in certain CF loss, which may be improved with the reduction in treatment time.

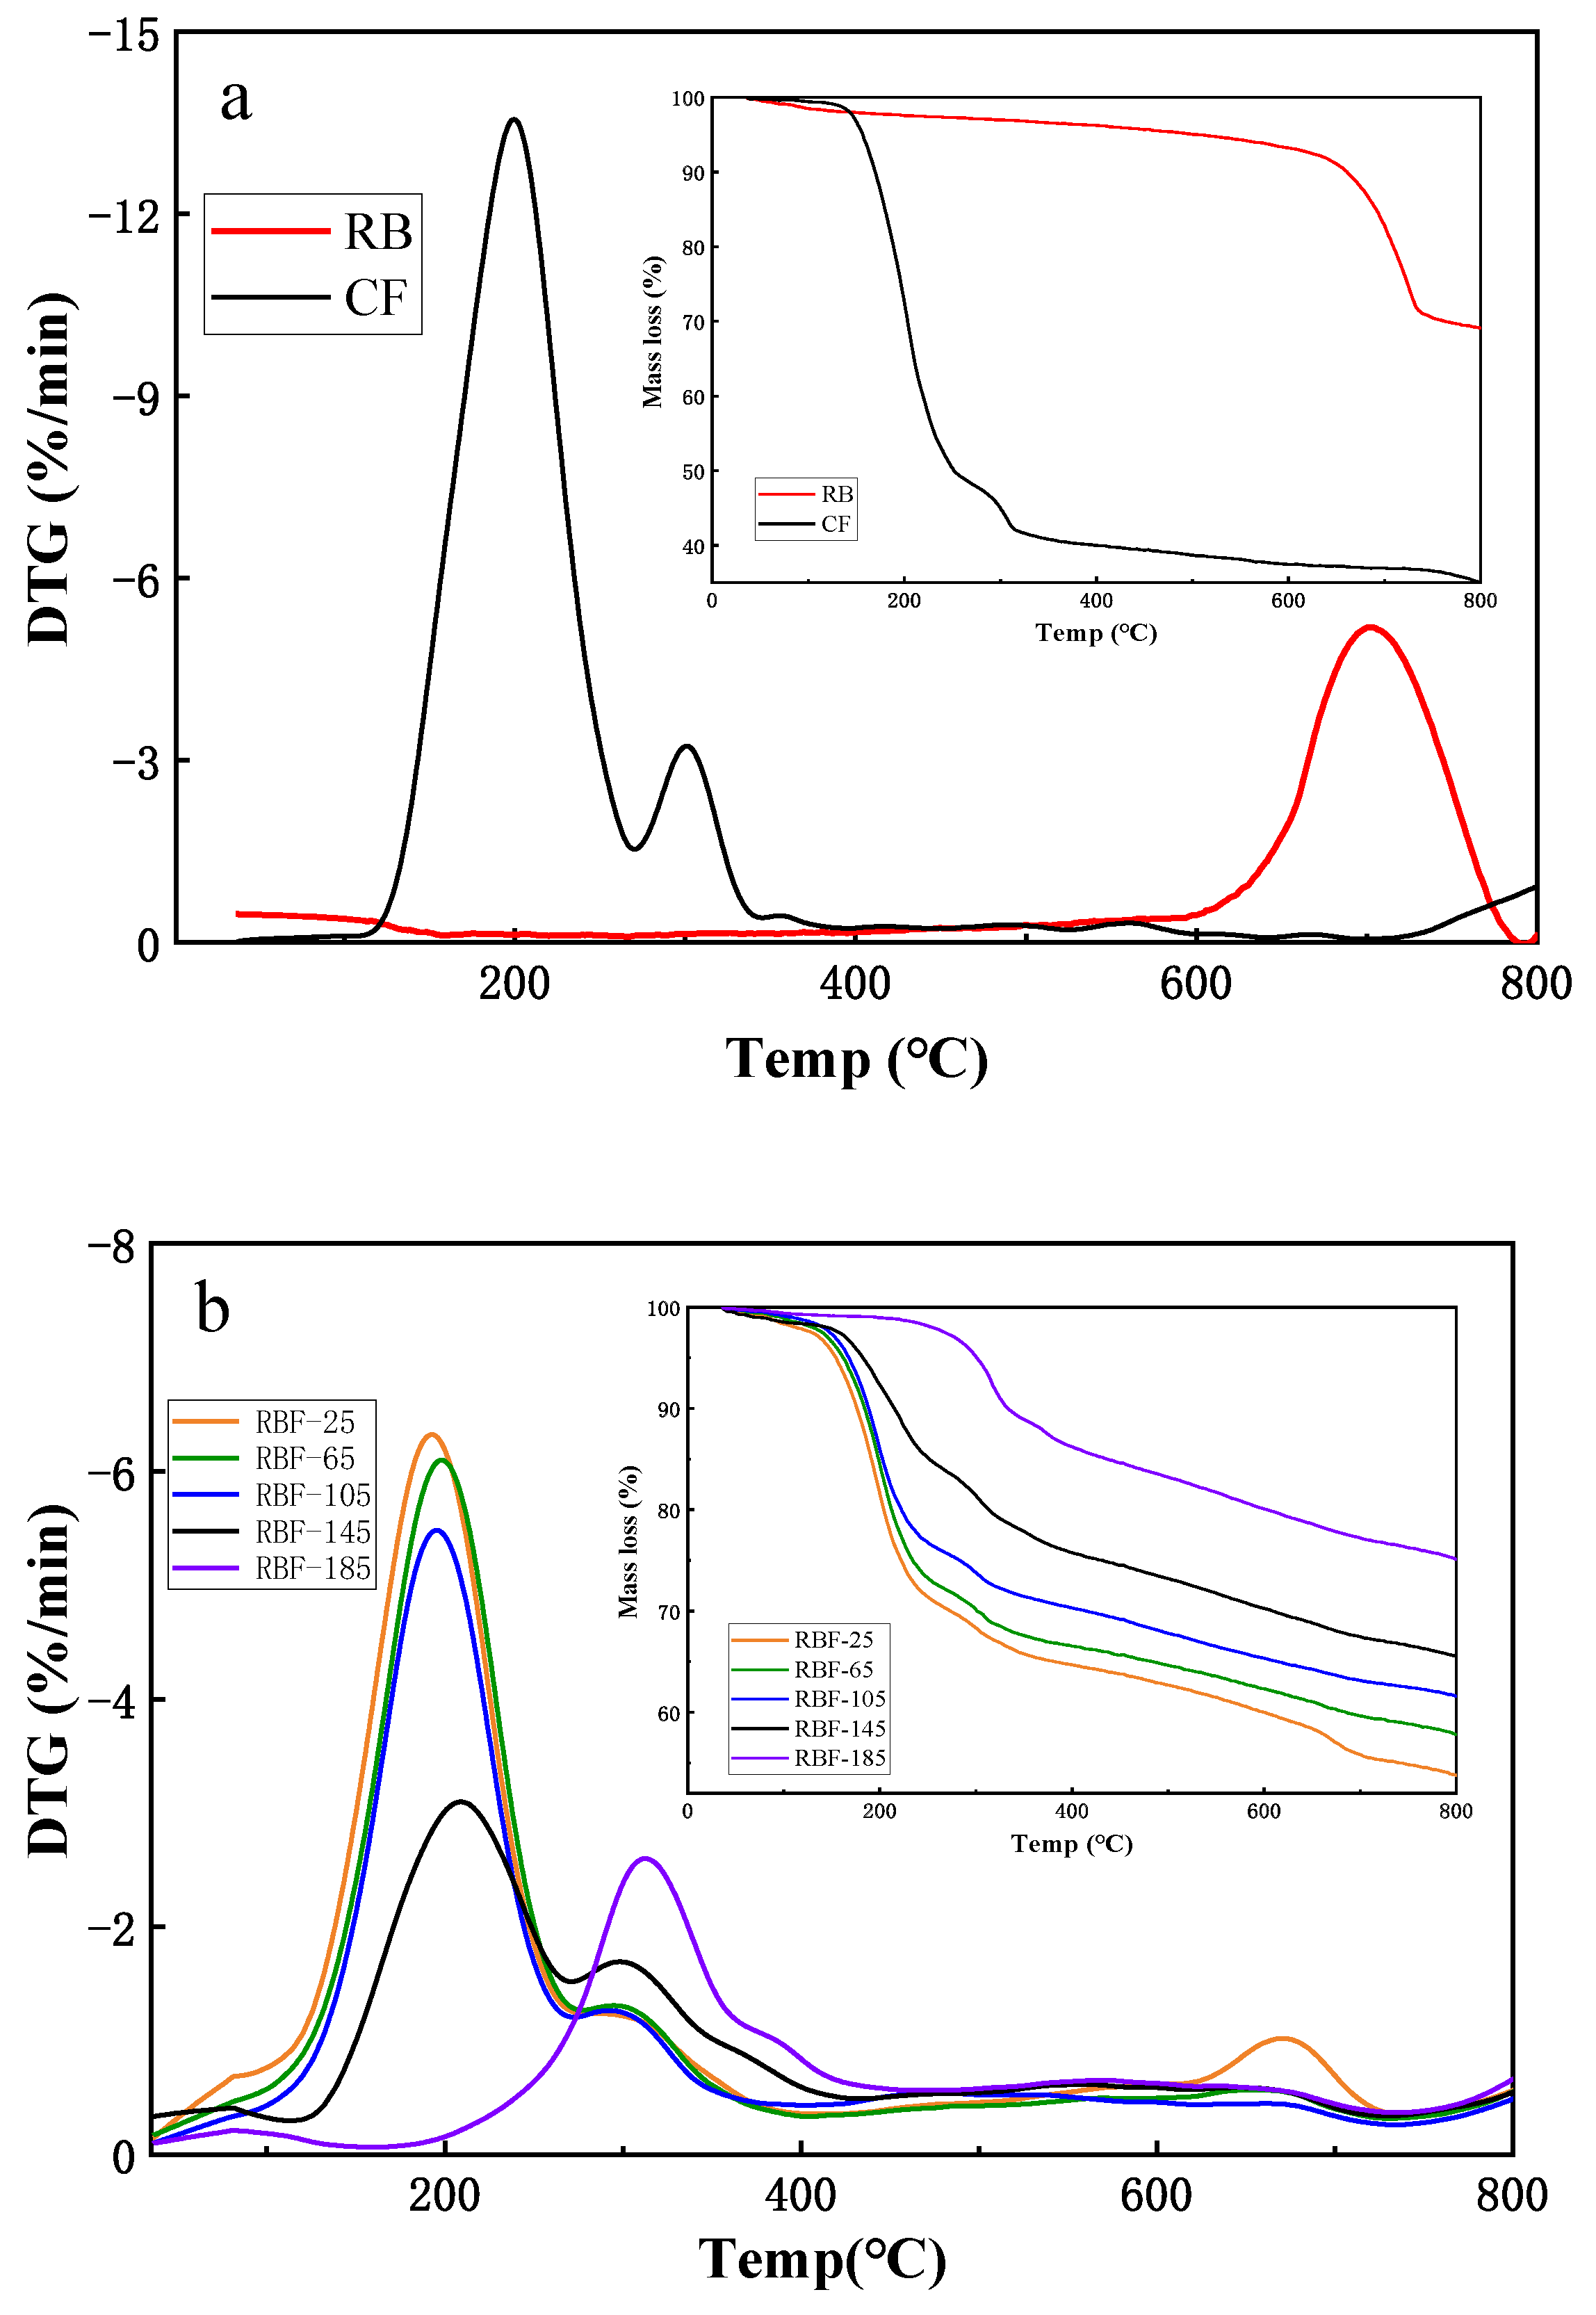
3.6. Thermal Characteristics

The thermal stability of RB, CF, and RBF-T were studied using thermogravimetric analysis plots and the derivative of the TG curves (DTG) under a nitrogen environment, as illustrated in Figure 5. In accordance with the pyrolysis process, the TG and DTG curves of RB could be divided into two stages, as shown in Figure 5a. In the first stage (from 35 °C to 600 °C), a small amount of water was removed, resulting in a slight loss of RB mass and almost no drying peak. The second stage (from 600 °C to 800 °C) was the main stage of decomposition of CaCO3 and other long-chain macromolecules; small gas molecules, such as CO2, were generated to escape outwards, resulting in a large loss of RB mass, and the residues were mainly fixed carbon and ash (Equation (4)) [36].
The TG and DTG curves of CF showed that CF had a slight initial mass loss between 35 °C and 105 °C due to water evaporation. In the subsequent temperature range, the thermal decomposition of CF underwent two stages of mass loss. The mass loss at stage 1 was nearly 50%, from 105 °C to 266 °C, which was attributed to the gas escaping that was produced by the thermal decomposition of CO(NH2)2 and (NH4)2HPO4. CO(NH2)2 was consumed in large quantities through three reactions, and it produced large amounts of NH3 between 132.5 °C and 160 °C. A molecule of CO(NH2)2 was decomposed into NH3 and HCNO (Equation (5))) [37], while two CO(NH2)2 molecules produced a biuret molecule via condensation reaction (Equation (6)) [38]. Through a self-binding reaction, three molecules of CO(NH2)2 were converted to cyanuric acid (CYA) and produced three molecules of NH3 (Equation (7)) [38]. The biuret generated by the reaction of the previous step changed from generation to decomposition above 170 °C, and CO(NH2)2 was regenerated and continued to be decomposed into NH3 molecules [39]. Meanwhile, at around 200 °C, (NH4)2HPO4 decomposed into NH3 molecules by the reactions of Equation (8). Several NH3 molecules escaped from the above series of reactions, resulting in mass loss of CF. The second stage occurred between 266 °C and 341 °C with approximately 10% mass loss, which was caused by the continued decomposition of the remaining biuret and CO(NH2)2 to produce NH3 molecules. In addition, the P2O5 molecules and H2O generated by the decomposition of H3PO4 (Equation (9)) contributed in part to mass loss. The TG and DTG curves of CF were flat, and the quality of CF did not change significantly above 341 °C.
CaCO 3 CaO + CO 2
CO ( NH 2 ) 2 NH 3 + HCNO
2 CO ( NH 2 ) 2 NH 3 + C 2 H 5 N 3 O 2
3 CO ( NH 2 ) 2 3 NH 3 + CYA  
( NH 4 ) 2 HPO 4 2 NH 3 + H 3 PO 4
2 H 3 PO 4 P 2 O 5 + 3 H 2 O
As with the similar pyrolysis trend in CF, the TG and DTG curves of RBF-T are shown in Figure 5b. However, the mass loss at each stage of RBF-T was significantly smaller than that in CF, and it decreased with the increase in drying temperature. Interestingly, according to the DTG curve, RBF-25 had a mass loss similar to that of RB (from 600 °C to 800 °C) compared with other treatment temperatures, but the mass loss and weight loss rate were much less than those in RB, illustrating that RB and CF could react at room temperature. These results confirmed the speculation in FTIR analysis.
In addition, Figure 5b shows that the weight loss rates of RBF-25, RBF-65, and RBF-105 were similar to that of CF; the upper limit was reached at approximately 200 °C and 298 °C in both stages, while those of RBF-145 and RBF-185 significantly shifted to the right by 10 °C and 102 °C, respectively, and the maximum weight loss rates appeared at 210 °C, 308 °C, 300 °C, and 398 °C, respectively. The difference between the TG and DTG curves at different drying temperatures was related to the decomposition temperature and melting state of CF. When the drying temperature was below 132.5 °C, the decomposition effect of CF was insufficient, and the fluidity of molten CF enhanced with the increase in temperature, which promoted the molten CF on the surface of RBF to penetrate into the pores of RB and combine closely. When the drying temperature was higher than 132.5 °C, the molten CF could easily react with the organic matter in RB to generate new macromolecules, which increased the pyrolysis temperature of RBF. Therefore, the thermal stability of RBF was better than that of CF, and higher drying temperature indicated better thermal stability.

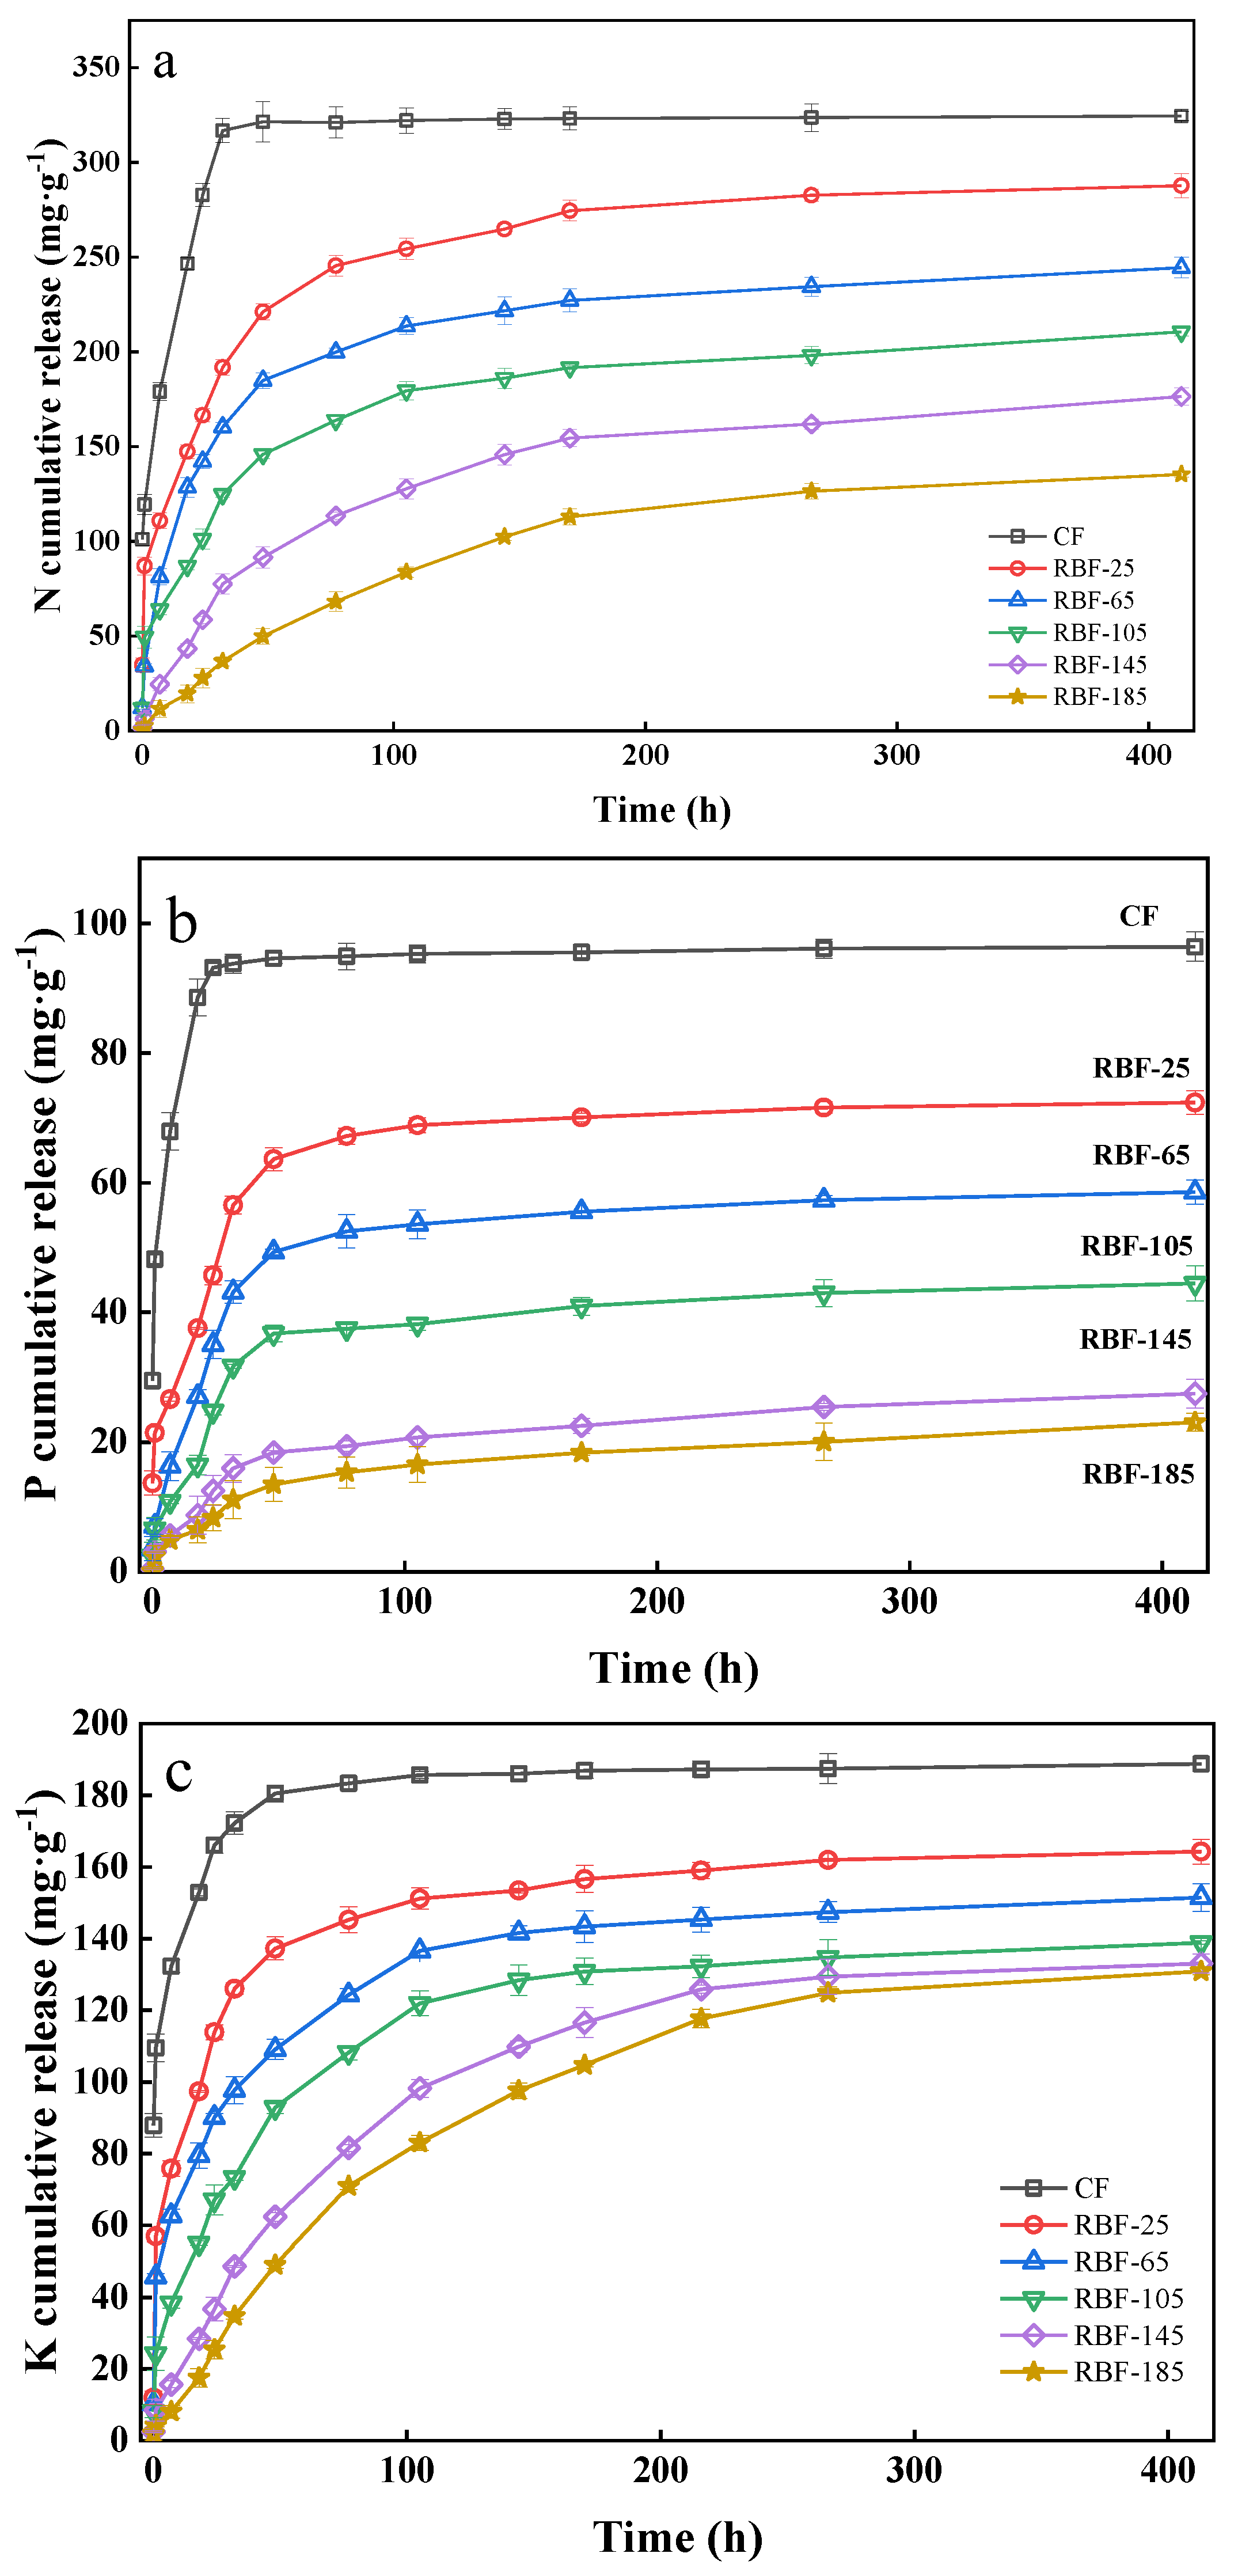
3.7. N, P, and K Release

As evident from Figure 6, the release curves of N, P, and K from CF and RBF-T could be divided into two stages: rapid release in the first stage and slow release in the second stage. The release times of N, P, and K in RBF-T was also longer than that in CF. The N release from CF reached equilibrium at approximately 32 h (Figure 6a), with 93.64% release, while RBF-25, RBF-65, RBF-105, RBF-145, and RBF-185 showed 59.12%, 49.41%, 38.44%, 23.90%, and 11.31% release within 32 h, respectively. Afterwards, the cumulative N release of RBF-25, RBF-65, RBF-105, RBF-145, and RBF-185 increased and finally reached 88.68%, 75.35%, 64.89%, 54.39%, and 41.71% after 413 h, respectively. With the increase in drying temperature, the duration of RBF in the first stage notably increased, and the slow-release rate constant (k) in the first stage was significantly higher than that in the second stage (Table 5).
As expected, the slow release of P from RBF completed the first stage at approximately 77 h, while CF reached equilibrium at around 32 h, releasing 94.60% of P (Figure 6b). After 413 h, the P release rates of RBF-25, RBF-65, RBF-105, RBF-145, and RBF-185 were 72.07%, 58.75%, 44.12%, 27.48%, and 23.93%, respectively, which were far below those of CF (97.67%). Besides, the cumulative release rate of P at 413 h was lower than that of N, indicating that the long-term control effect of RBF on P was better than that of N, and the P in RBF could be released slowly and for a long time.
The release law of K was similar to that of N (Figure 6c). As the drying temperature was increased, the time for RBF to reach the second stage lengthened. Remarkably, the time for CF to reach the equilibrium value was 48 h, which was delayed compared with that for N and P, indicating that the release efficiency of K was low. However, the final K release rate of RBF (25–185) was significantly higher than that of N and P, indicating that RB had a poor binding effect on K. This finding may be related to the strong water-solubility of KCl and the difficulty of K ion binding with biochar macromolecules.
As shown in Table 5, the N, P, and K release curves of CF and RBF-T fitted to first-order kinetics, suggesting that the release rates of these nutrients were manipulated by a diffusion mechanism [40]. The diffusion effect is conducive to the improvement of the slow-release performance and the extension of the nutrient release time [41]. The release regularity of N, P, and K could be divided into two stages: the first stage was the rapid release of nutrients to plants in the short term, and the second stage was the slow release of nutrients in the long term. Combined with the above characterization analysis, the results showed that RBF exhibited a good sustained-release effect. The slow-release effect was also enhanced with the increase in drying temperature, and the sustained release effect of RBF on P was the best, while that on K was the worst. In addition, Shi et al. prepared RBF pellets by adding bentonite as binder, which released 69% of N within 20 days [17], while Kim et al. prepared RBF pellets by adding 10–20% lignin as binder, which cumulatively released 77–87% of K and 73–95% of P within 432 h [13]. This indicates that the same or even better N, P, and K sustained-release effect can be achieved for the binder-free RBF pellets prepared by granulation optimization compared with other RBF pellets with added binder.

4. Conclusions

In this study, it was shown that the parameters in the granulation process for making binder-free biochar-based fertilizer from digestate may significantly influence the pellet properties. When the moisture content was 7.84%, the diameter was 7 mm, the compression speed was 49.54 mm/min, and the molding pressure was 7.5 MPa, the obtained pellets had the best forming quality, with compressive strength of 427.77 N, ECM of 17.7%, and durability of 99.24%. Furthermore, the binding of N, P, and K in CF to functional groups on RB strongly increased with pellet drying temperature, resulting in the excellent sustained-release performance of RBF and helping maintain nutrients for a long time. The sustained-release effect of RBF was obviously better than that of CF, and the release curves were fitted to first-order kinetics. Meanwhile, the excessive fluidity and high decomposition degree of molten CF could cause certain CF loss when the drying temperature reached 185 °C. Thus, the drying temperature should not be too high. The physical and chemical properties of pellets could be improved by optimizing the granulation process parameters, and RBF pellets could be used as a green slow-release fertilizer in agricultural production.

Supplementary Materials

The following are available online at https://www.mdpi.com/article/10.3390/su13158573/s1, Figure S1: Piston mold. Figure S2. Relationship between actual and predicted recoveries of (a) compressive strength, (b) ECM, and (c) durability. Figure S3. Graphical Pareto analysis of the effect of significant parameters on selected responses. Table S1. Experimental design matrix and response of experiments for pelletization optimization. Table S2. BET surface area, pore volume, and average pore size of RB and RBF-T calculated from nitrogen adsorption isotherms at 77 K.

Author Contributions

Conceptualization, Z.Y. and G.S.; investigation, J.Z.; writing—original draft preparation, Z.Y. and X.L.; writing—review and editing, Q.C. and G.S.; project administration, Y.H.; All authors have read and agreed to the published version of the manuscript.

Funding

National Natural Science Foundation of China (Grant NO. 21876109) and China Postdoctoral Science Foundation (NO. 2020M681284).

Institutional Review Board Statement

Not applicable.

Informed Consent Statement

Not applicable.

Data Availability Statement

Not applicable.

Conflicts of Interest

The authors declare that they have no conflict of interest in the study.

References

  1. Bellemare, M.F.; Cakir, M.; Peterson, H.H.; Novak, L.; Rudi, J. On the Measurement of Food Waste. Am. J. Agric. Econ. 2017, 99, 1148–1158. [Google Scholar] [CrossRef]
  2. Stefaniuk, M.; Oleszczuk, P. Characterization of biochars produced from residues from biogas production. J. Anal. Appl. Pyrolysis 2015, 115, 157–165. [Google Scholar] [CrossRef]
  3. Chambers, B.J.; Taylor, M. The use of digestate as a substitute for manufactured fertilizer. In Bioenergy Production by Anaerobic Digestion: Using Agricultural Biomass and Organic Wastes; Taylor and Francis: London, UK, 2013; Volume 9780203137697, pp. 359–374. [Google Scholar] [CrossRef]
  4. Zhu, J.; Zheng, Y.; Xu, F.; Li, Y. Solid-state anaerobic co-digestion of hay and soybean processing waste for biogas production. Bioresour. Technol. 2014, 154, 240–247. [Google Scholar] [CrossRef]
  5. Svensson, K.; Odlare, M.; Pell, M. The fertilizing effect of compost and biogas residues from source separated household waste. J. Agric. Sci. 2004, 142, 461–467. [Google Scholar] [CrossRef]
  6. Johansen, A.; Nielsen, H.B.; Hansen, C.M.; Andreasen, C.; Carlsgart, J.; Hauggard-Nielsen, H.; Roepstorff, A. Survival of weed seeds and animal parasites as affected by anaerobic digestion at meso- and thermophilic conditions. Waste Manag. 2013, 33, 807–812. [Google Scholar] [CrossRef] [PubMed]
  7. Xiang, A.; Qi, R.; Wang, M.; Zhang, K.; Jiang, E.; Ren, Y.; Hu, Z. Study on the infiltration mechanism of molten urea and biochar for a novel fertilizer preparation. Ind. Crop. Prod. 2020, 153. [Google Scholar] [CrossRef]
  8. Lehmann, J.; Joseph, S. Biochar for Environmental Management: Science, Technology and Implementation; Routledge: London, UK, 2015. [Google Scholar] [CrossRef]
  9. El-Naggar, A.; El-Naggar, A.H.; Shaheen, S.M.; Sarkar, B.; Chang, S.X.; Tsang, D.C.W.; Rinklebe, J.; Ok, Y.S. Biochar composition-dependent impacts on soil nutrient release, carbon mineralization, and potential environmental risk: A review. J. Environ. Manag. 2019, 241, 458–467. [Google Scholar] [CrossRef]
  10. Manoli, K.; Morrison, L.M.; Sumarah, M.W.; Nakhla, G.; Ray, A.K.; Sharma, V.K. Pharmaceuticals and pesticides in secondary effluent wastewater: Identification and enhanced removal by acid-activated ferrate(VI). Water Res. 2019, 148, 272–280. [Google Scholar] [CrossRef] [PubMed]
  11. Steiner, C.; Garcia, M.; Zech, W. Effects of charcoal as slow release nutrient carrier on NPK dynamics and soil microbial population: Pot experiments with ferralsol substrate. In Amazonian Dark Earths: Wim Sombroek’s Vision; Springer: Dordrecht, The Netherlands, 2009; pp. 325–338. [Google Scholar] [CrossRef]
  12. Khan, M.A.; Kim, K.-W.; Mingzhi, W.; Lim, B.-K.; Lee, W.-H.; Lee, J.-Y. Nutrient-impregnated charcoal: An environmentally friendly slow-release fertilizer. Environment 2008, 28, 231–235. [Google Scholar] [CrossRef]
  13. Kim, P.; Hensley, D.; Labbe, N. Nutrient release from switchgrass-derived biochar pellets embedded with fertilizers. Geoderma 2014, 232, 341–351. [Google Scholar] [CrossRef]
  14. Major, J.; Lehmann, J.; Rondon, M.; Goodale, C. Fate of soil-applied black carbon: Downward migration, leaching and soil respiration. Glob. Chang. Biol. 2010, 16, 1366–1379. [Google Scholar] [CrossRef]
  15. Husk, B.; Major, J. Commercial Scale Agricultural Biochar Field Trial in Québec, Canada over Two Years: Effects of Biochar on Soil Fertility, Biology and Crop Productivity and Quality; Dynamotive Energy Systems: Suite, QC, Canada, 2010. [Google Scholar]
  16. Kambo, H.S.; Dutta, A. Strength, storage, and combustion characteristics of densified lignocellulosic biomass produced via torrefaction and hydrothermal carbonization. Appl. Energy 2014, 135, 182–191. [Google Scholar] [CrossRef]
  17. Shi, W.; Ju, Y.; Bian, R.; Li, L.; Joseph, S.; Mitchell, D.R.G.; Munroe, P.; Taherymoosavi, S.; Pan, G. Biochar bound urea boosts plant growth and reduces nitrogen leaching. Sci. Total Environ. 2020, 701, 134424. [Google Scholar] [CrossRef] [PubMed]
  18. Mostafa, M.E.; Hu, S.; Wang, Y.; Su, S.; Hu, X.; Elsayed, S.A.; Xiang, J. The significance of pelletization operating conditions: An analysis of physical and mechanical characteristics as well as energy consumption of biomass pellets. Renew. Sustain. Energy Rev. 2019, 105, 332–348. [Google Scholar] [CrossRef]
  19. Gil, M.V.; Oulego, P.; Casal, M.D.; Pevida, C.; Pis, J.J.; Rubiera, F. Mechanical durability and combustion characteristics of pellets from biomass blends. Bioresour Technol. 2010, 101, 8859–8867. [Google Scholar] [CrossRef] [PubMed] [Green Version]
  20. ASAE S358.2—Moisture Measurement—Forages. 2006. Available online: https://www.researchgate.net/publication/313730122_ASAE_S3582_-_moisture_measurement_-_forages (accessed on 9 July 2021).
  21. Gil, M.V.; Casal, D.; Pevida, C.; Pis, J.J.; Rubiera, F. Thermal behaviour and kinetics of coal/biomass blends during co-combustion. Bioresour Technol. 2010, 101, 5601–5608. [Google Scholar] [CrossRef] [PubMed] [Green Version]
  22. Maurya, D.; Khaleghian, S.; Sriramdas, R.; Kumar, P.; Kishore, R.A.; Kang, M.G.; Kumar, V.; Song, H.C.; Lee, S.Y.; Yan, Y.; et al. 3D printed graphene-based self-powered strain sensors for smart tires in autonomous vehicles. Nat. Commun. 2020, 11, 5392. [Google Scholar] [CrossRef]
  23. European Committee for Standardization (CEN). Solid Biofuels. In Determination of Mechanical Durability of Pellets and Briquettes. Part 1: Pellets. EN 15210-1: 2010; CEN Brussels: London, UK, 2010. [Google Scholar]
  24. Samuelsson, R.; Larsson, S.H.; Thyrel, M.; Lestander, T.A. Moisture content and storage time influence the binding mechanisms in biofuel wood pellets. Appl. Energy 2012, 99, 109–115. [Google Scholar] [CrossRef]
  25. Huang, Y.; Finell, M.; Larsson, S.; Wang, X.H.; Zhang, J.L.; Wei, R.; Liu, L. Biofuel pellets made at low moisture content—Influence of water in the binding mechanism of densified biomass. Biomass. Bioenergy 2017, 98, 8–14. [Google Scholar] [CrossRef]
  26. Agar, D.A.; Rudolfsson, M.; Kalen, G.; Campargue, M.; Perez, D.D.; Larsson, S.H. A systematic study of ring-die pellet production from forest and agricultural biomass. Fuel Process. Technol. 2018, 180, 47–55. [Google Scholar] [CrossRef]
  27. Du, K.; Su, R.; Tao, M.; Yang, C.Z.; Momeni, A.; Wang, S.F. Specimen shape and cross-section effects on the mechanical properties of rocks under uniaxial compressive stress. Bull. Eng. Geol. Environ. 2019, 78, 6061–6074. [Google Scholar] [CrossRef]
  28. Fan, T.; Hu, J.; Fu, L.; Zhang, L. Optimization of enzymolysis-ultrasonic assisted extraction of polysaccharides from Momordica charabtia L. by response surface methodology. Carbohydr. Polym. 2015, 115, 701–706. [Google Scholar] [CrossRef]
  29. Iftikhar, M.; Asghar, A.; Ramzan, N.; Sajjadi, B.; Chen, W.Y. Biomass densification: Effect of cow dung on the physicochemical properties of wheat straw and rice husk based biomass pellets. Biomass Bioenergy 2019, 122, 1–16. [Google Scholar] [CrossRef]
  30. Jentzer, J.B.; Alignan, M.; Vaca-Garcia, C.; Rigal, L.; Vilarem, G. Response surface methodology to optimise Accelerated Solvent Extraction of steviol glycosides from Stevia rebaudiana Bertoni leaves. Food Chem. 2015, 166, 561–567. [Google Scholar] [CrossRef] [Green Version]
  31. Ahmadzadeh, S.; Asadipour, A.; Pournamdari, M.; Behnam, B.; Rahimi, H.R.; Dolatabadi, M. Removal of ciprofloxacin from hospital wastewater using electrocoagulation technique by aluminum electrode: Optimization and modelling through response surface methodology. Process. Saf. Environ. 2017, 109, 538–547. [Google Scholar] [CrossRef]
  32. El-Qanni, A.; Nassar, N.N.; Vitale, G.; Hassan, A. Maghemite nanosorbcats for methylene blue adsorption and subsequent catalytic thermo-oxidative decomposition: Computational modeling and thermodynamics studies. J. Colloid Interface Sci. 2016, 461, 396–408. [Google Scholar] [CrossRef] [PubMed]
  33. Li, R.H.; Wang, J.J.; Zhou, B.Y.; Zhang, Z.Q.; Liu, S.; Lei, S.; Xiao, R. Simultaneous capture removal of phosphate, ammonium and organic substances by MgO impregnated biochar and its potential use in swine wastewater treatment. J. Clean. Prod. 2017, 147, 96–107. [Google Scholar] [CrossRef] [Green Version]
  34. Fourest, E.; Volesky, B. Contribution of Sulfonate Groups and Alginate to Heavy Metal Biosorption by the Dry Biomass ofSargassum fluitans. Environ. Sci. Technol. 1996, 30, 277–282. [Google Scholar] [CrossRef]
  35. Ravikovitch, P.I.; Vishnyakov, A.; Neimark, A.V.; Ribeiro Carrott, M.M.; Russo, P.A.; Carrott, P.J. Characterization of micro-mesoporous materials from nitrogen and toluene adsorption: Experiment and modeling. Langmuir 2006, 22, 513–516. [Google Scholar] [CrossRef] [PubMed]
  36. Zhang, L.; Chen, K.; He, L.; Peng, L. Reinforcement of the bio-gas conversion from pyrolysis of wheat straw by hot caustic pre-extraction. Biotechnol. Biofuels 2018, 11. [Google Scholar] [CrossRef]
  37. Lundström, A.; Andersson, B.; Olsson, L. Urea thermolysis studied under flow reactor conditions using DSC and FT-IR. Chem. Eng. J. 2009, 150, 544–550. [Google Scholar] [CrossRef]
  38. Chen, J.P.; Isa, K. Thermal Decomposition of Urea and Urea Derivatives by Simultaneous TG/(DTA)/MS. J. Mass Spectrom. Soc. Jpn. 1998, 46, 299–303. [Google Scholar] [CrossRef]
  39. Wang, D.; Dong, N.; Hui, S.; Niu, Y. Analysis of urea pyrolysis in 132.5–190 °C. Fuel 2019, 242, 62–67. [Google Scholar] [CrossRef]
  40. An, X.; Wu, Z.; Yu, J.; Ge, L.; Li, T.; Liu, X.; Yu, B. High-Efficiency Reclaiming Phosphate from an Aqueous Solution by Bentonite Modified Biochars: A Slow Release Fertilizer with a Precise Rate Regulation. ACS Sustain. Chem. Eng. 2020, 8, 6090–6099. [Google Scholar] [CrossRef]
  41. Luo, W.; Qian, L.; Liu, W.; Zhang, X.; Wang, Q.; Jiang, H.; Cheng, B.; Ma, H.; Wu, Z. A potential Mg-enriched biochar fertilizer: Excellent slow-release performance and release mechanism of nutrients. Sci. Total Environ. 2021, 768, 144454. [Google Scholar] [CrossRef]
Figure 1. Effect of (a) compression speed, (b) molding pressure, (c) moisture content, and (d) diameteron compressive strength, ECM, and durability.
Sustainability 13 08573 g001
Figure 2. Three-dimensional contour plots for the interaction effects of speed and moisture content (diameter = 7 mm) on (a) compressive strength, (b) ECM, and (c) durability. Interaction effects of speed and diameter (moisture content = 7.5%) on (d) compressfive strength, (e) ECM, and (f) durability. Interaction effects of moisture content and diameter (speed = 50 mm/min) on (g) compressive strength, (h) ECM, and (i) durability.
Sustainability 13 08573 g002aSustainability 13 08573 g002b
Figure 3. (a) XRD patterns of RB, CF, and RBF-T. (b) FTIR spectra of RB, CF, and RBF-T.
Sustainability 13 08573 g003
Figure 4. Nitrogen adsorption isotherms at 77 K and BJH pore size distributions of RB and RBF-T.
Sustainability 13 08573 g004
Figure 5. TGA and DTG analysis of CF, RB, and RBF-T shown at images (a,b), respectively.
Sustainability 13 08573 g005
Figure 6. (a) N release kinetics from CF and RBF-T. (b) P release kinetics from CF and RBF-T. (c) K release kinetics from CF and RBF-T.
Sustainability 13 08573 g006
Table 1. Control factors and their respective levels in BBD design.
FactorNameLevels
−101
ACompressive speed (mm/min)405060
BMoisture content (%)57.510
CDiameter (mm)678
Table 2. RSM model fit summary output for pelletization optimization.
ParameterMeanR2Adjusted R2Predicted R2Sd. Dev.CV (%)Adeq. Precision
Compressive strength (N)316.410.99900.99780.98923.891.2372.4015
ECM (%)20.410.98290.96090.88900.43872.1519.6562
Durability (%)97.280.98360.96250.85370.32700.336220.2997
Table 3. ANOVA output for RBF pelletization.
SourceSum of SquaresdfMean SquareF-Valuep-ValueRemarks
Compressive strength (N)
Model108000911996.22790.80<0.0001significant
Lack of fit69.13323.042.490.1998not significant
ECM (%)
Model77.4498.6044.70<0.0001significant
Lack of fit0.460130.15340.69140.6033not significant
Durability (%)
Model44.9394.9946.68<0.0001significant
Lack of fit0.381730.12721.390.3683not significant
Table 4. Optimized operating parameters.
Operating ParameterResponses
Compression SpeedMoisture ContentDiameterCompressive StrengthECMDurability
mm/min%MmN%%
Optimized conditions
49.547.847427.7717.7099.24
Mean of experimental results
---425.8917.9299.13
Relative error
---0.43%1.24%0.11%
Table 5. Rate constants (k) calculated from the first-order kinetic model on the release of K, P, and K from CF and RBF-T.
SamplePhase 1Phase 2
Kinetics
Parameter
Inorganic CompoundKinetics
Parameter
Inorganic Compound
NPKNPK
CFk (h−1)0.07900.06140.0920k (h−1)0.00940.00420.007
R20.98100.97890.9326R20.99560.91790.9648
RBF-25k (h−1)0.07030.05490.0659k (h−1)0.01540.00760.0102
R20.96550.97390.9611R20.98270.96990.9834
RBF-65k (h−1)0.06920.04710.0601k (h−1)0.00580.01000.0105
R20.99590.94980.9683R20.96590.98460.9619
RBF-105k (h−1)0.05840.03250.0435k (h−1)0.00910.00890.0081
R20.93710.97610.9845R20.96600.97650.9875
RBF-145k (h−1)0.04220.03150.0414k (h−1)0.00880.01200.0024
R20.93220.98600.9495R20.98190.90330.9019
RBF-185k (h−1)0.03820.02330.0342k (h−1)0.00120.00160.0026
R20.95830.92960.9393R20.99830.93860.9918
Publisher’s Note: MDPI stays neutral with regard to jurisdictional claims in published maps and institutional affiliations.

