1. Introduction
Climate change presents a pressing and complex global challenge. Furthermore, the built environment consumes large amounts of energy and water, and produces pollution and waste during construction and operation. Against this background, environmentally-driven development approaches need to be adopted to improve the planning, designing and operating of buildings which are adaptive to changes brought about by the climate and the everyday needs of occupants while being sustainable over the long term.
Governments around the world continue to develop and actively adopt sustainable codes and standards, as well as green building rating systems. However, traditional practices for design, construction, and operation of buildings are in desperate need of review. Relevant research has found that decisions made early in the design stage affect the building’s performance during operation [
1], and integration of design, engineering and construction is key for the development and delivery of sustainable, high-performance buildings [
2]. Yet, integration of engineering disciplines remains as one of the main challenges when adopting environmental sustainability assessment methods [
3]. Hence, research and practice concerned with sustainability of the built environment are required to focus on investigating the role of design and integration in the environmental impacts across the life cycle of a building.
In the United Arab Emirates (UAE), the environmental impact of energy and water use, and the transition to a lower carbon economy present significant challenges. Rapid economic and population growth, leading to a high level of urbanization, coupled with the harsh hot climate, are the main reasons for the UAE’s increased energy demands and ecological footprint [
4,
5,
6]. Contemporary buildings in the UAE use almost six times more energy than traditional buildings [
7]. Not only that, but UAE buildings consume about 68–76% of electricity, compared to the global average of 40%, with almost half of this energy used for air conditioning [
8]. Moreover, water is a challenge in the Middle Eastern countries, having only 1% of the available fresh water in the world [
9]. The scarcity of oil reserves’ resiliency and water shortages in the Gulf region are mainly the reason for prioritizing energy and water categories when assessing the environmental sustainability of buildings in this region [
10].
There is a major possibility of decreasing the energy consumption of both new and existing buildings, which leads us to the concept of retrofitting, which is the process of modifying existing solutions with new or improved ones. The retrofitting of an existing office building in the UAE to move towards achieving a low-energy building shows a significant energy saving of 41.7% compared to the base case. This achievement has been obtained by improving the values of some sensitive parameters in the retrofitting alternatives, such as roof insulation, wall insulation, and the type of AC system [
11]. To reduce the energy consumption of buildings, engineering methods/approaches have been developed, which include building energy simulation tools and software packages, which deals with a building’s parameters and the surrounding environment; for example, the operation schedules, the heating, ventilation, and air conditioning (HVAC) system, climate conditions, shading information, insulation, and new building technologies [
12,
13].
The reduction of building energy and water consumption is a priority for the UAE government; this is evident by the use of different sustainability codes and regulations. While international established rating systems such as the Building Research Establishment Environmental Assessment Method (BREEAM) and Leadership in Energy and Environmental Design (LEED) have been used in the UAE since 2007, more UAE-centered systems have been emerging since 2009. Estidama, Al Sa’fat and Barjeel systems are now used for environmental sustainability assessment in Abu Dhabi, Dubai and Ras Al-Khaimah emirates, respectively. These emerging rating systems were found to diffuse environmental sustainability across the UAE through different mechanisms, such as: raising clients’ awareness, training and certifying construction professionals in sustainability, and managing the use of sustainable systems and products [
14]. The Al Sa’fat green building rating system [
15], which was introduced in 2016 to replace the Dubai Green Code, has been in place since 2010. It focuses on water use reduction and waste water reuse; and encourages indoor water efficiency. The overall reduction goal of Al Sa’fat is 20% in energy consumption as well as carbon dioxide emissions, 15% of water consumption and 50% of waste. Therefore, the main objective of the research presented in this paper is to address this challenge through a case study focusing on the design process to improve building performance in response to energy and water use.
The city of Dubai is an appropriate model for the rapid urban growth in the UAE, as it had an annual urban growth rate of more than 10% between 1985 and 2015. This makes the city one of the fastest growing cities in the world. The aim of the case study presented in this paper was to design a high-performance building in the city of Dubai that saves on energy and water consumption and follows the Al Sa’fat green rating system of Dubai. This aim has been achieved through following an integrated design process, which was mainly focused on the evaluation and specification of the building engineering systems based on performance, to design an exhibition building as a pavilion to present the UAE’s Mars mission achievements, besides the goal of achieving a visually appealing building with advanced structural design.
The paper is organized as follows;
Section 2 provides an overview of the integrated design process for the Hope Pavilion project as well as the details of the different systems of the building, which is followed by the analysis of the building performance in
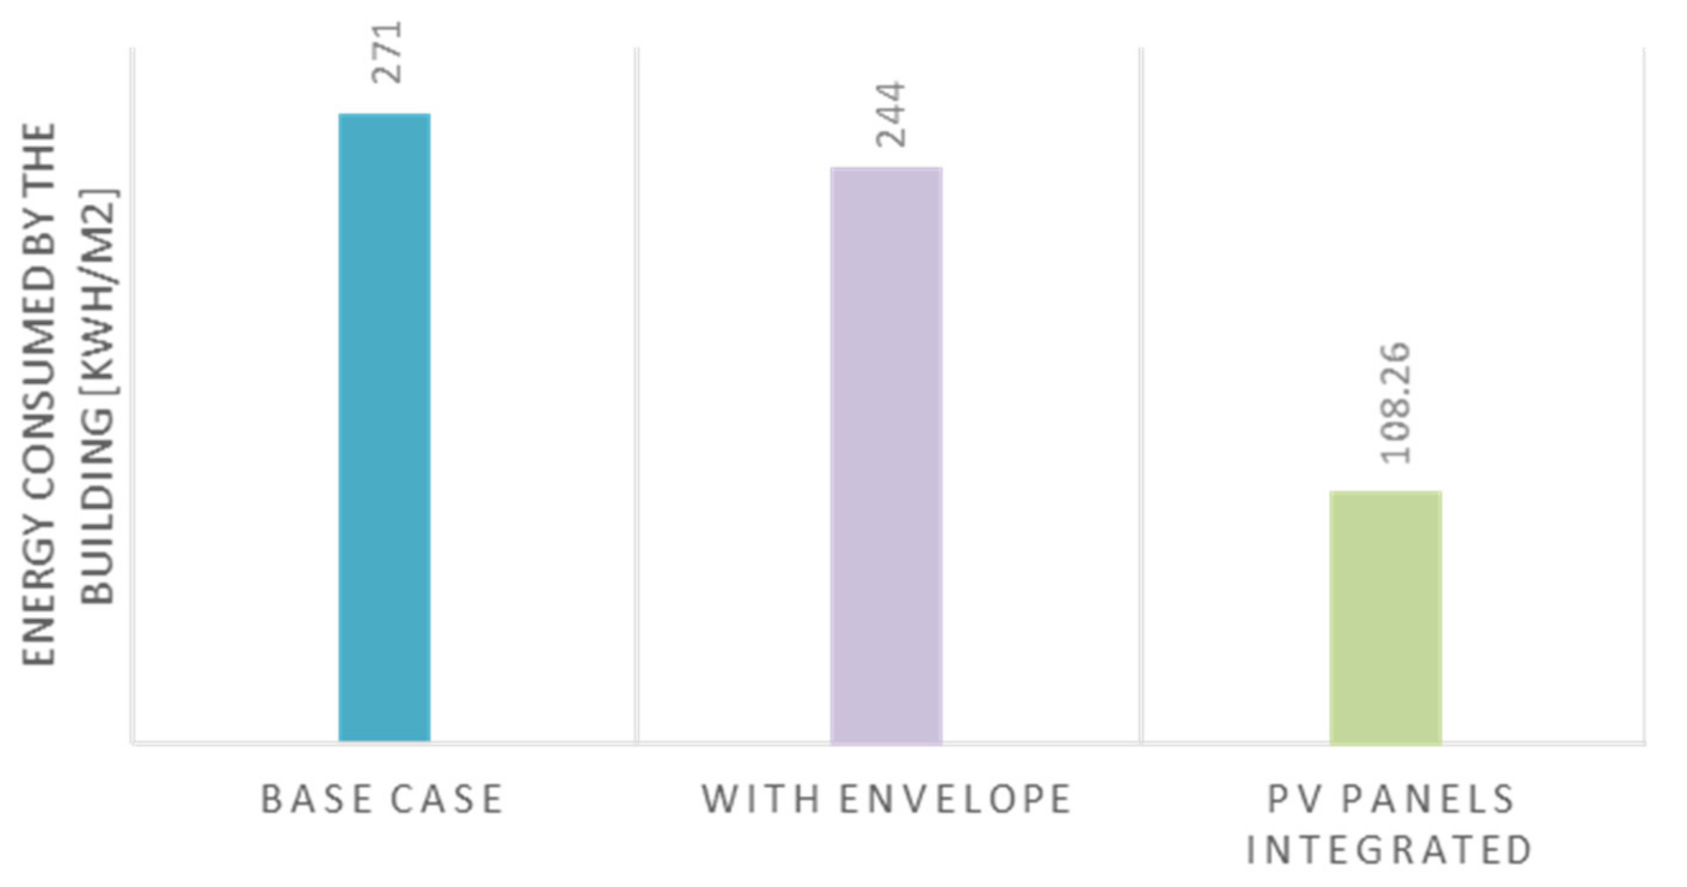
Section 3, which shows that the final building design revealed a 15% reduction in water consumption and a 60% reduction in energy (electricity) consumption; lighting performance has also improved as a result of the focus on the external envelope. Finally,
Section 4 discusses these results and their impact on design and practice.
2. Building Integrated Design Process
The design process is a methodical series of steps that helps in planning and producing a product [
16], and, with regard to buildings, develops and improves the identification of the risks and opportunities for delivering the project successfully. The building design process is very complex, and it involves different participants from different professions. Additionally, design is a highly information dependent process, it consumes and produces a huge amount of information following a complex exchange of design information between various design spheres.
Design can be seen as problem solving, decision making, and an information processing activity. While there is no one definition for design, from a systems point of view, Gray and Hughes [
17] defined building design as a system to solve a user problem by breaking it into smaller problems, integrating knowledge from experts about the problem, exchanging information and making decisions. Gray and Hughes [
17] go further to divide building design into two stages; first: the concept (scheme) design stage, and second: engineering design, which they further divide into two stages: engineering design by architects and engineering design by engineers. While useful, it implies that building engineering systems are to be considered later in the design process, losing the opportunity to improve performance. Furthermore, focus should be given to the integration processes and activities between the different design disciplines as early as concept design, in order to meet the various requirements for sustainable design.
To meet the requirements for high-performance sustainable design in the climatic and site conditions in Dubai, the approach followed in the case study presented in the following section, draws from Al-Bizri and Gray conceptualization of design as “
an interaction between design processes triggered by the selection of its objects”, where the selection of one building component to satisfy a set of key performance criteria affects the choice of other design elements [
18]. Al-Bizri and Gray assert that when several design problems—such as water and energy consumption in this case study, besides aesthetics and structural stability—are considered either simultaneously or as an interlinked set, the output from one design problem may become the input to another design problem, for example, the layout of the floor plans was optimized several times to accommodate the right size for the service rooms which house part of the mechanical ventilation system. This was the approach used to iteratively and simultaneously evaluate different options for the different building systems (architecture, construction, structure, mechanical and electrical) for the Hope Pavilion project (example of the decision matrix used for evaluating three mechanical ventilation systems is provided in
Table 1), using decision matrixes with continuous feedback loops, especially when one decision about one building system or component affects another decision, in order to achieve the overall goal of designing a high-performance building which addresses the two main challenges associated with energy and water consumption in Dubai. The main performance constraints used in the evaluation process were drawn from the Al Sa’fat system requirements [
15] as well as time, cost, and constructability.
2.1. Integrated Design Process for the Hope Pavilion Building
The integrated design process for the Hope Pavilion building is achieved through the following phases: problem definition; research and case study analysis to develop the program; systems research to develop the concept design; detailed building design; and finally, performance verification to test and validate that the design achieves the high-performance targets. These phases unfolded in an iterative manner rather than linear, while ethical and environmental impacts were considered through the design process.
The research and case studies analysis phase considered different case studies for relevant buildings; it led to more focus on the building envelope as it plays a strategic role in the energy and environmental performance of the building. The main objective was that the building envelope is required to respond accordingly to outside factors, provide occupant comfort and meet energy efficiency requirements. High-performance sustainable facades can be defined as exterior enclosures that use the least possible amount of energy to maintain a comfortable internal environment, which promotes health and productivity for the building’s occupants [
19]. As a result, it was decided to focus on the building envelope, which should contribute to energy reduction as well as to reflect the essence of the Hope Pavilion building as a reflection of the technological advancements of the UAE and its Mars mission. Moreover, as a result of the users’ analysis the building itself was sought to be designed to fit 10–15 people in the exhibition area at one time, to provide a unique experience for visitors.
Then, the systems research phase focused on evaluating different options for the different building systems—construction, structure, mechanical, lighting, and waste water—against relevant criteria which were developed based on the project aim of designing a high performance building envelope that addresses the environmental sustainability requirements and challenges of Dubai, as requested by Dubai building codes and the Al Sa’fat system. Furthermore, the building was sought to be aesthetically pleasing and demonstrate the advancements of UAE science and technology developments manifested by the Mars mission. The evaluation criteria included time, cost, constructability, and performance aspects. Concept development then emerged as a result of the systems evaluation process [
18]. First, the focus was on the shape and form of the main building in response to the site and climate requirements, and then more focus was given to the design of the external envelope to address the high-performance and futuristic aesthetic needs.
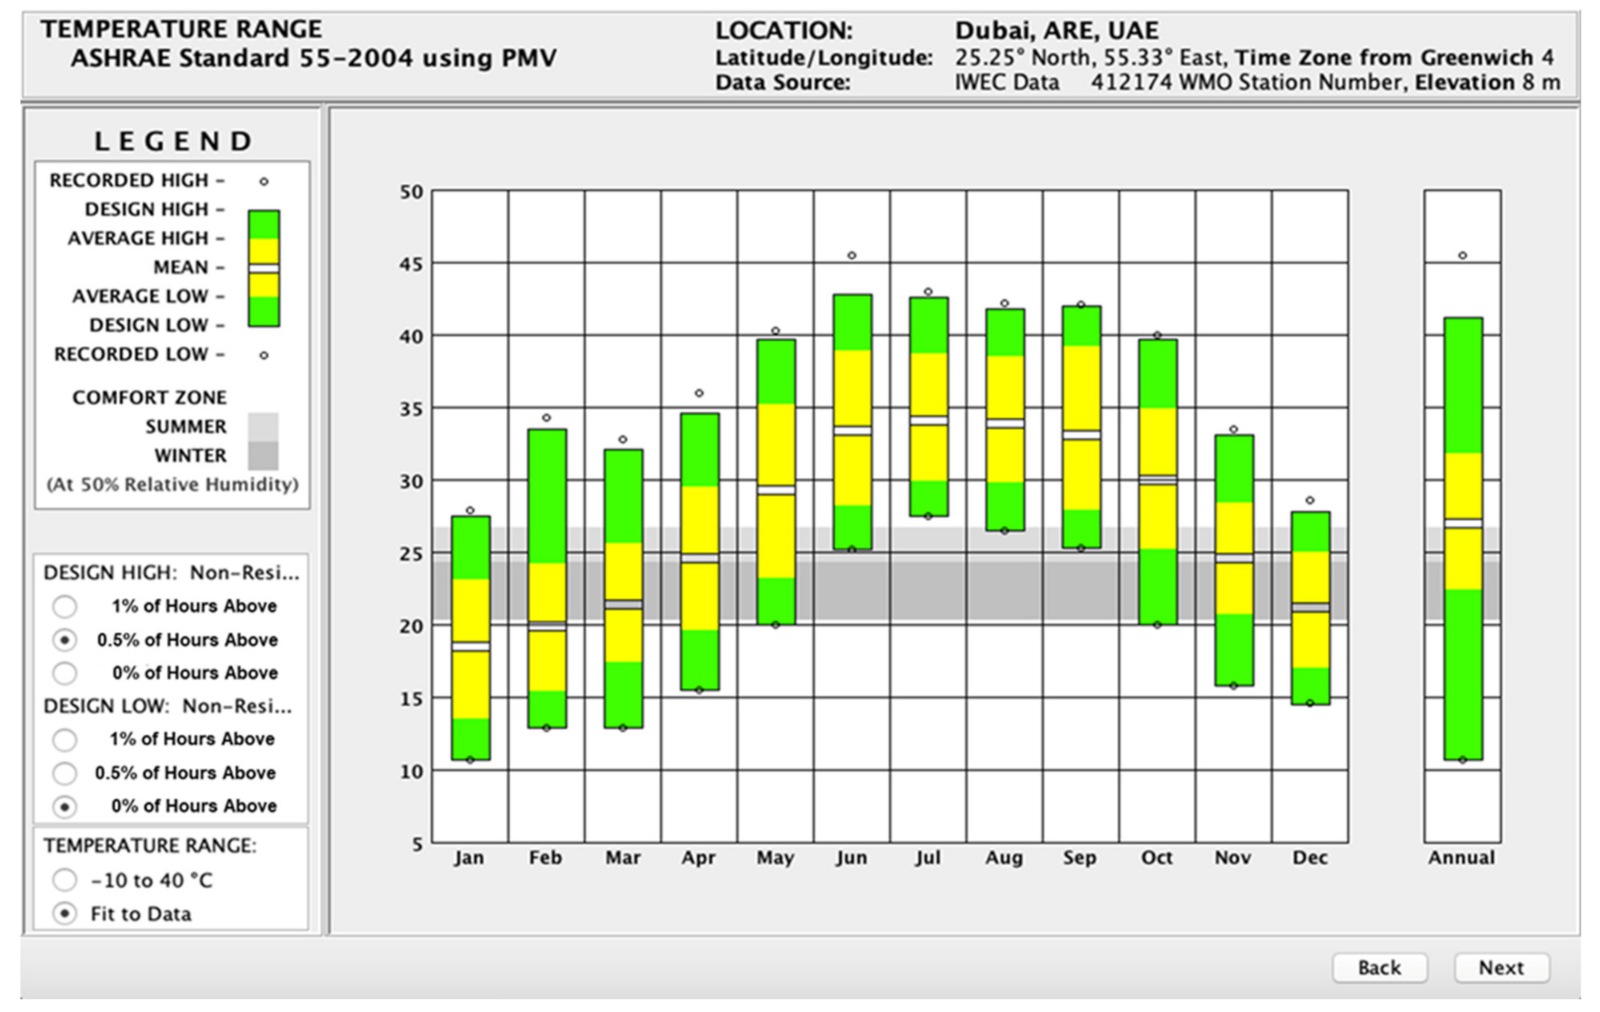
Climate-specific guidelines must be considered during the design process of high-performing building enclosures. Therefore, following the site selection, climate analysis was conducted to study the monthly radiation and temperature for Dubai, as shown in
Figure 1 and
Figure 2. Furthermore, the design was guided by psychrometric charts for Dubai, which are shown in
Figure 3. This information has been obtained using climate consultant software, by using an existing Energy Plus weather (epw) file of the Dubai city climate which was imported into the software. The psychrometric chart helps the designers develop design strategies to create comfortable indoor environments by designing the envelope of the building to help in modifying or filtering the external climate conditions.
The climate analysis showed that Dubai is mostly hot in the summer while it has some records of cold weather during the winter. Accordingly, the best single cooling design strategy is sun shading, which accounts for 22.2% of the hours in a day, which can be considered along with other cooling strategies. The internal heat gain accounts for 15.7% of hours of the day, which is due to internal loads such as appliances, lights and users. As Dubai is relatively humid in the summer, the direct evaporative cooling strategy could account for 6.5% hours of the day. Referring to the data shown, air conditioning will always be needed, but it can be reduced if the building design minimizes heat gain. Additionally, the glazing on the west side should be minimized to reduce heat gain in summer and during the fall, specifically in the afternoon, which can also be solved by incorporating planting. Most of the glass openings should be oriented to the north and shaded by vertical fins since there are no passive solar needs. All of these recommendations were adopted for the design of the Hope Pavilion building.
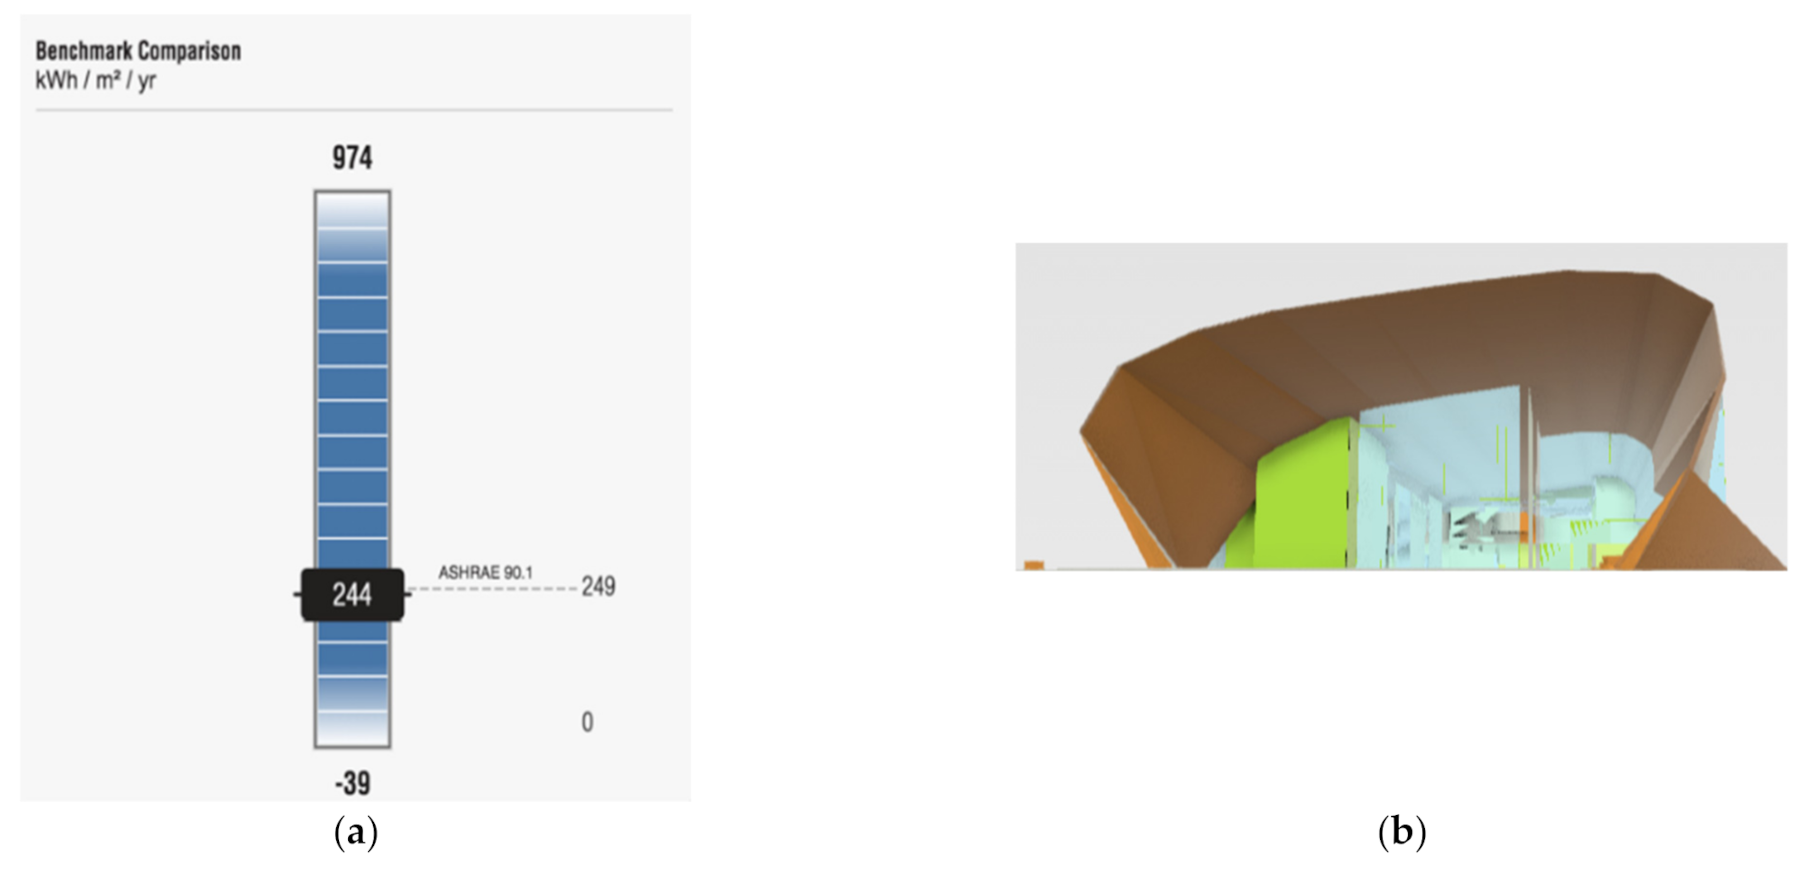
The detailed design phase was focused on the assessment of the building’s passive and active systems in terms of their environmental performance and impact. The detailed design is presented in the following parts of this section. Finally, the final phase focused on the performance verification and the optimization of the design and its engineering systems in order to achieve and exceed energy and water reduction targets as prescribed by the Al Sa’fat rating system. The results of this phase are presented in
Section 3 of this paper.
As described above, this design process considered the different building systems from the start and used decision matrixes to evaluate different building systems and components, the process was sought to be iterative and integrated, no one system was designed in isolation from other systems. For example, when considering the construction system, a comparison was conducted between prefabrication, 3D printing and on-site construction methods in terms of construction time, cost, energy and waste generation, and while 3D and prefabrication scored similar in the decision matrix, but prefabrication was used because its use was more cost-efficient than 3D printing. Another example was the research and evaluation conducted for the external envelope, which considered the aesthetics besides the integration of the PV panels into the chosen system. Moreover, different software applications were used to enable the design and analysis process.
2.2. Description of the Hope Pavilion Building
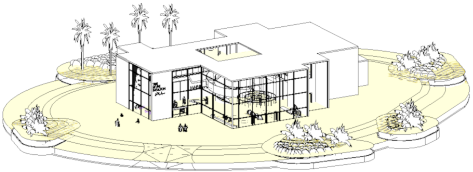
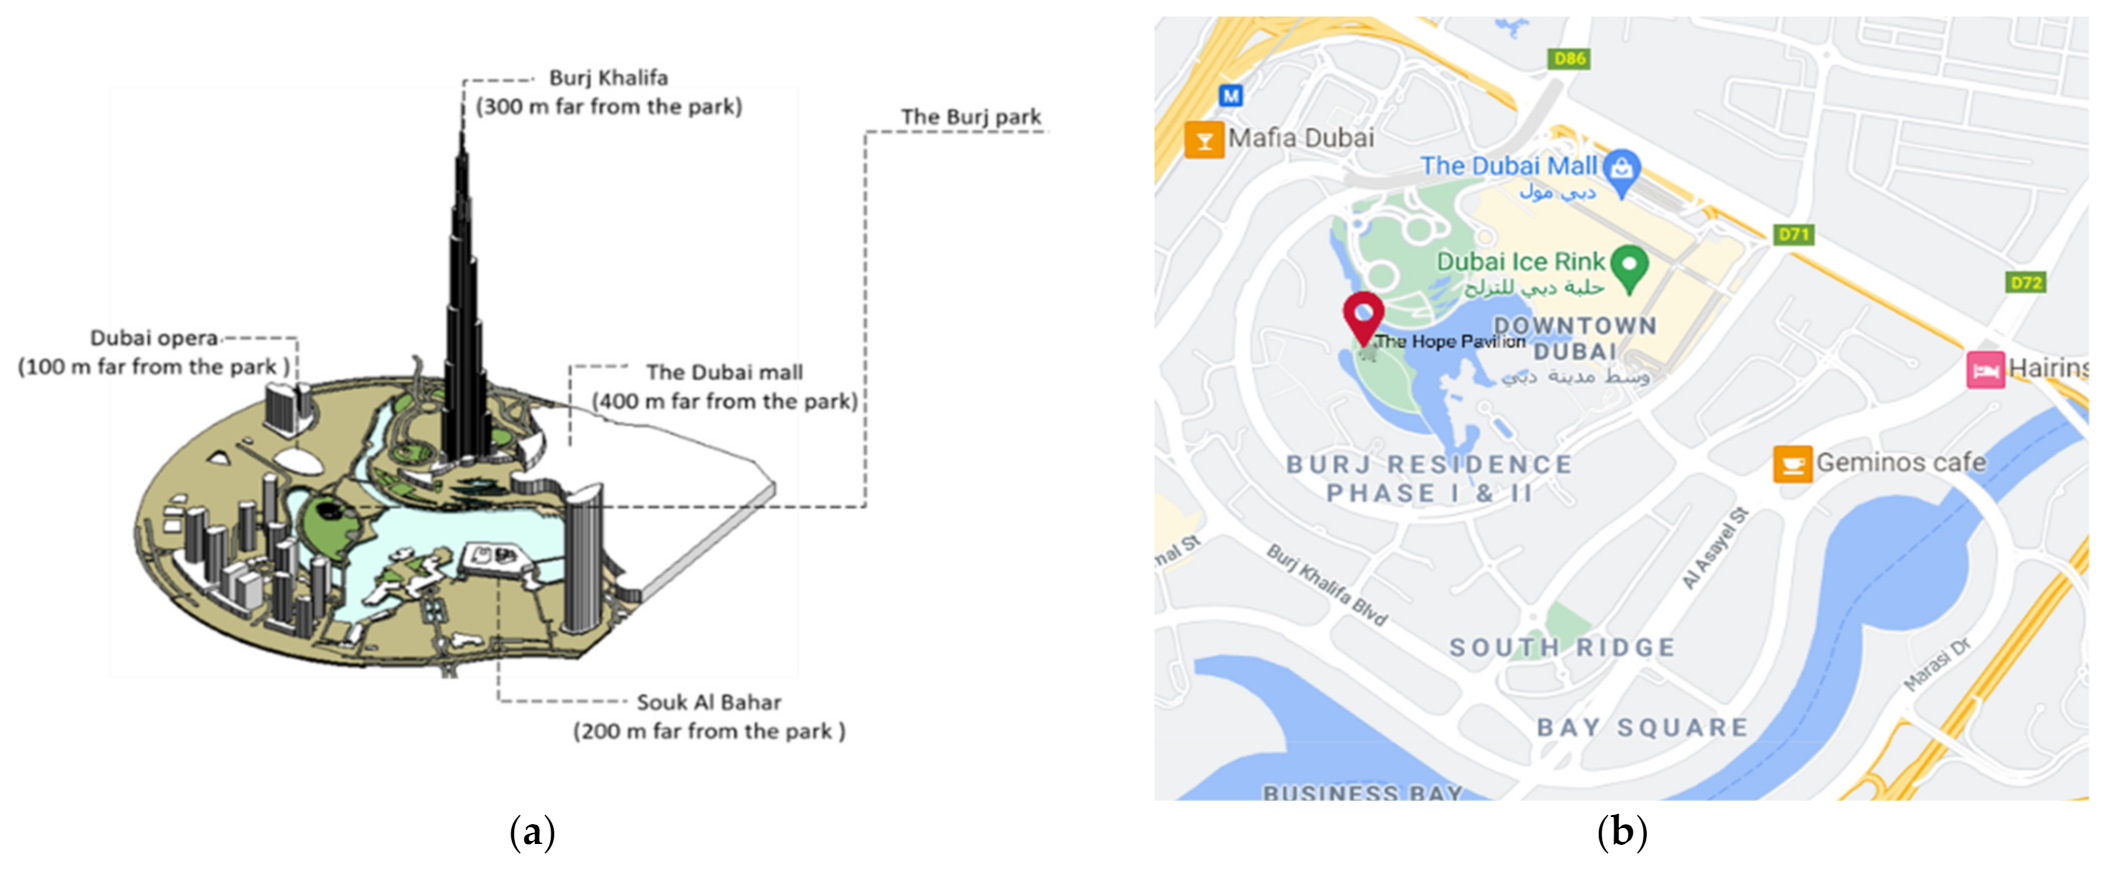
The Hope Pavilion building is located in the Burj Park area in downtown Dubai as shown in
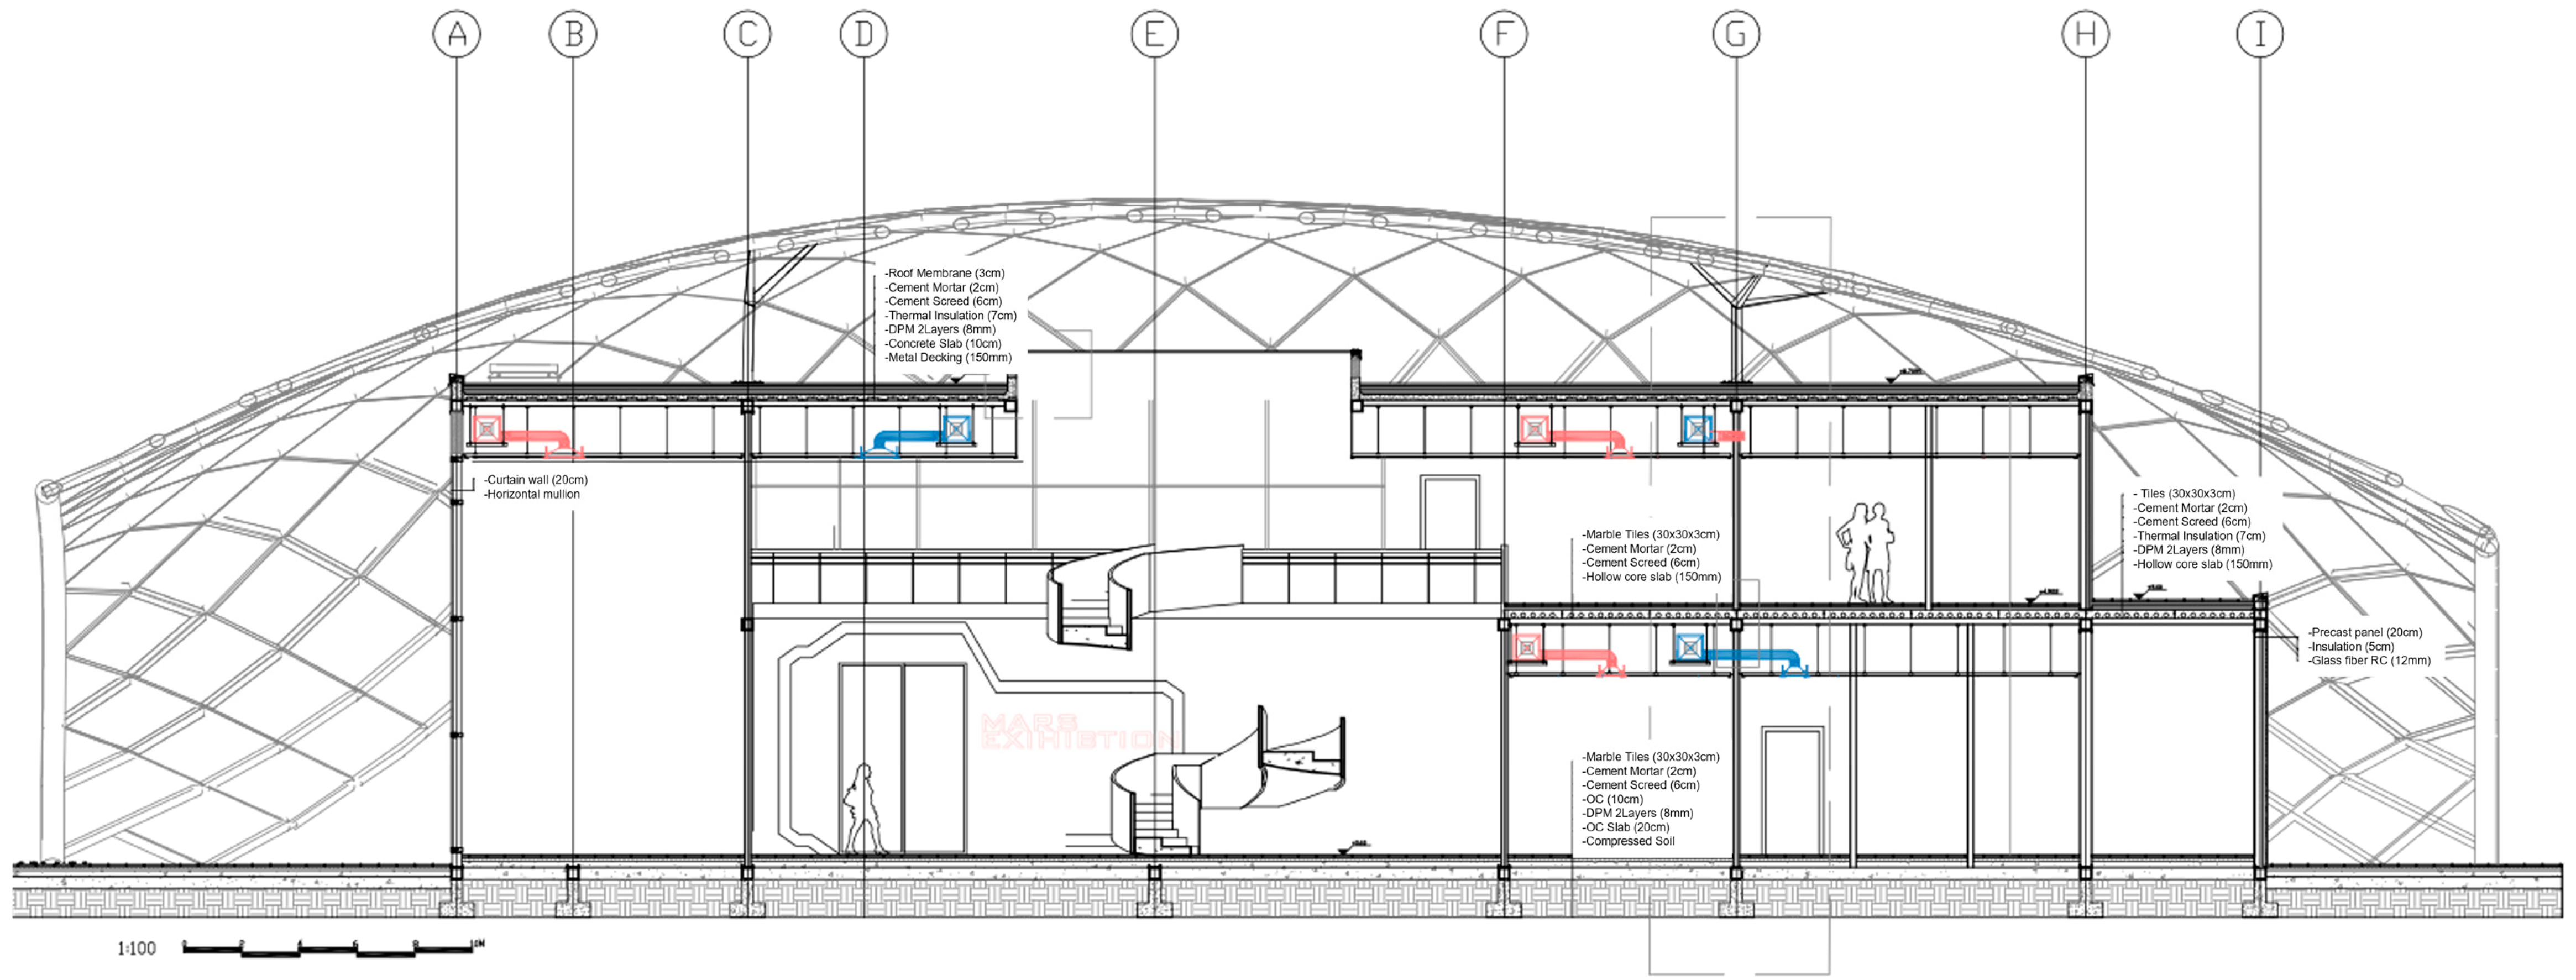
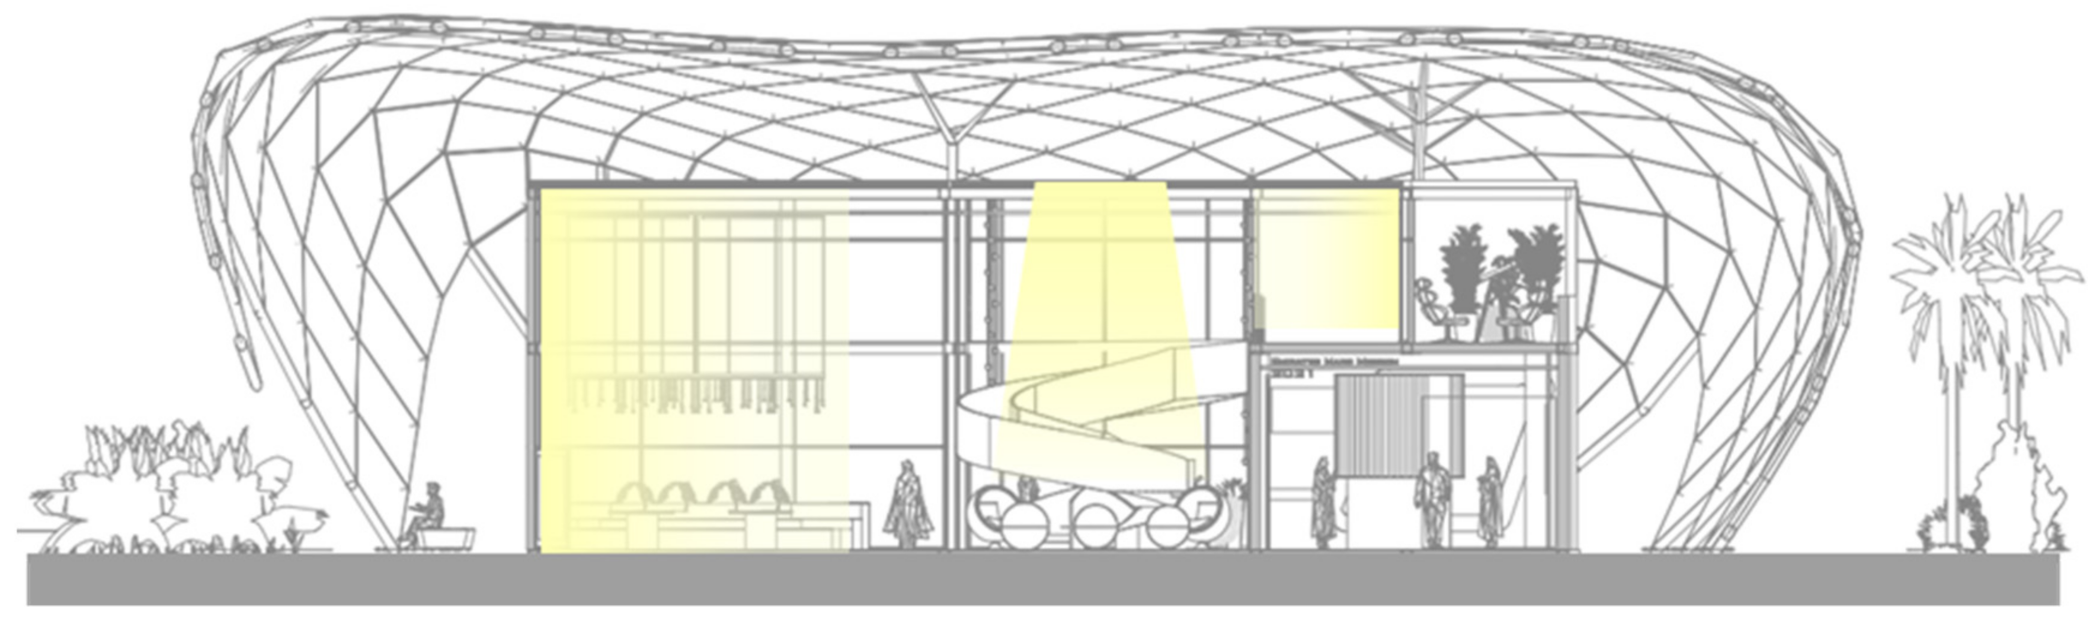
Figure 4a,b below, which both show the site in 3D and plan views. The pavilion’s building is designed with two floors, and divided into three main areas: first, the ground floor exhibition area, which enables a unique insight into the Hope probe’s journey to Mars by using smart screens to reflect the different stages from its launch to its arrival on Mars. It will allow the visitor to explore Mars’ life and atmosphere and visualize the conditions on Mars. Additionally, some information will be displayed by suspension from the ceiling, then the visitor will be able to exit the exhibition by entering the Mars walkway. Second, the café, which is also located on the ground floor, has an outdoor area facing the Dubai fountain. Third, offices for the employees are located on the first floor with a viewing balcony.
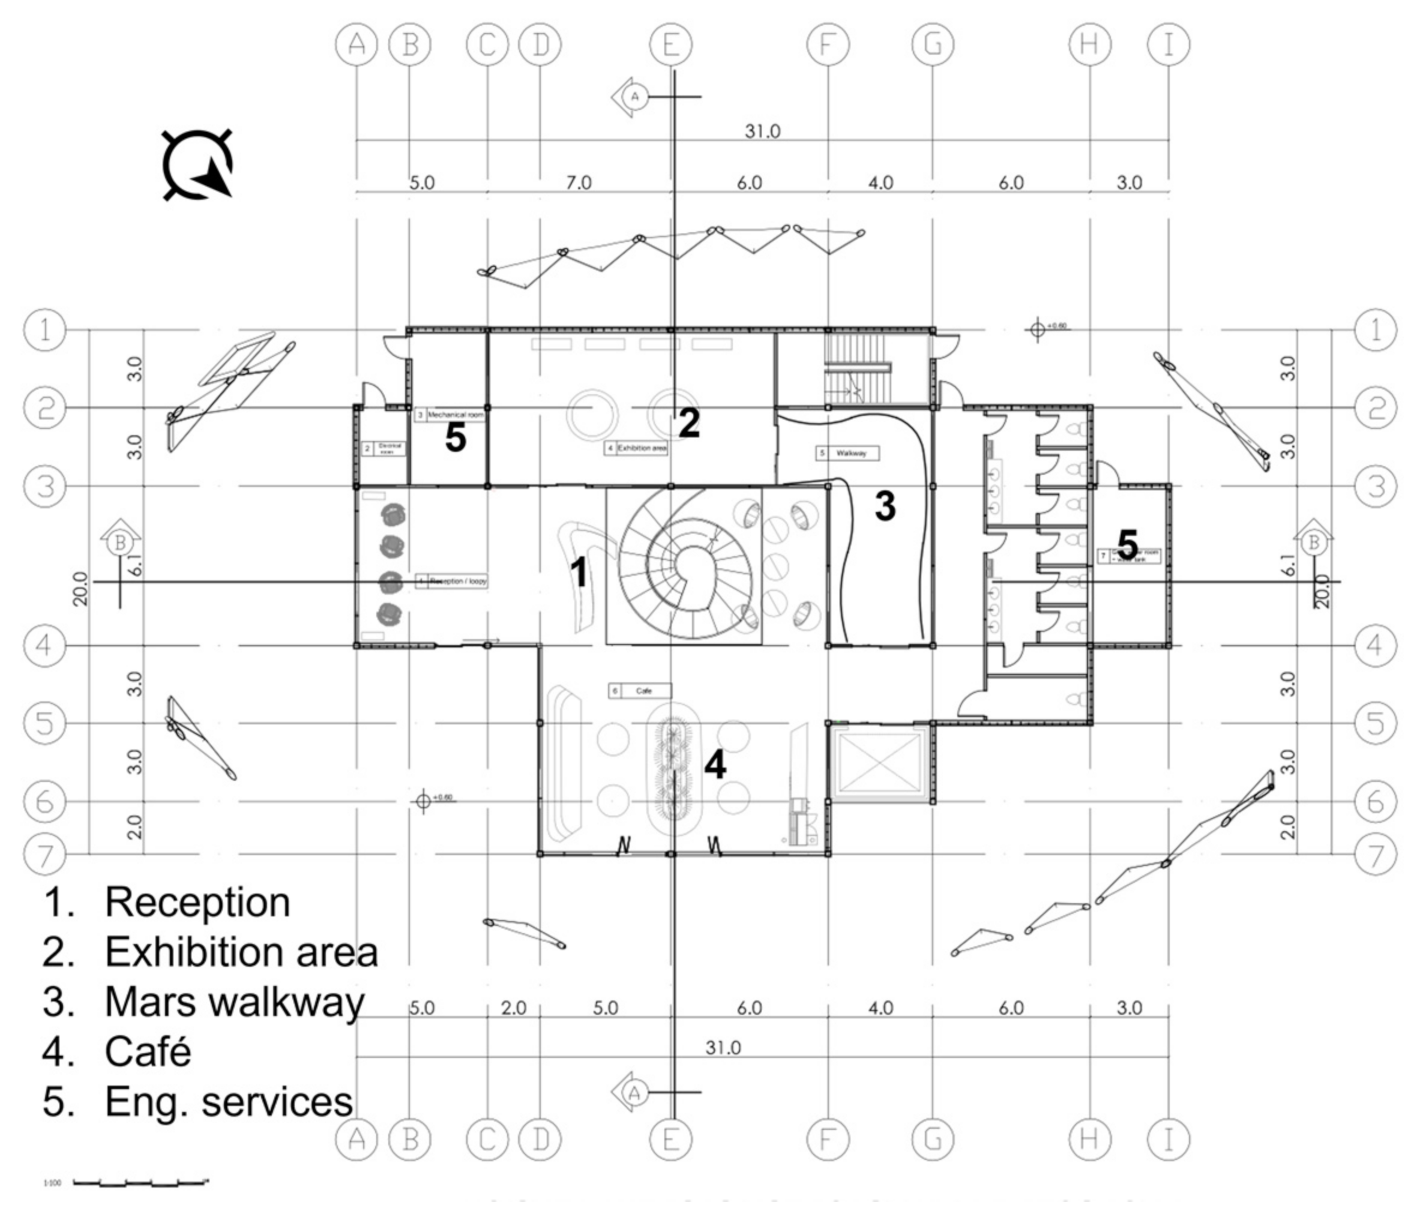
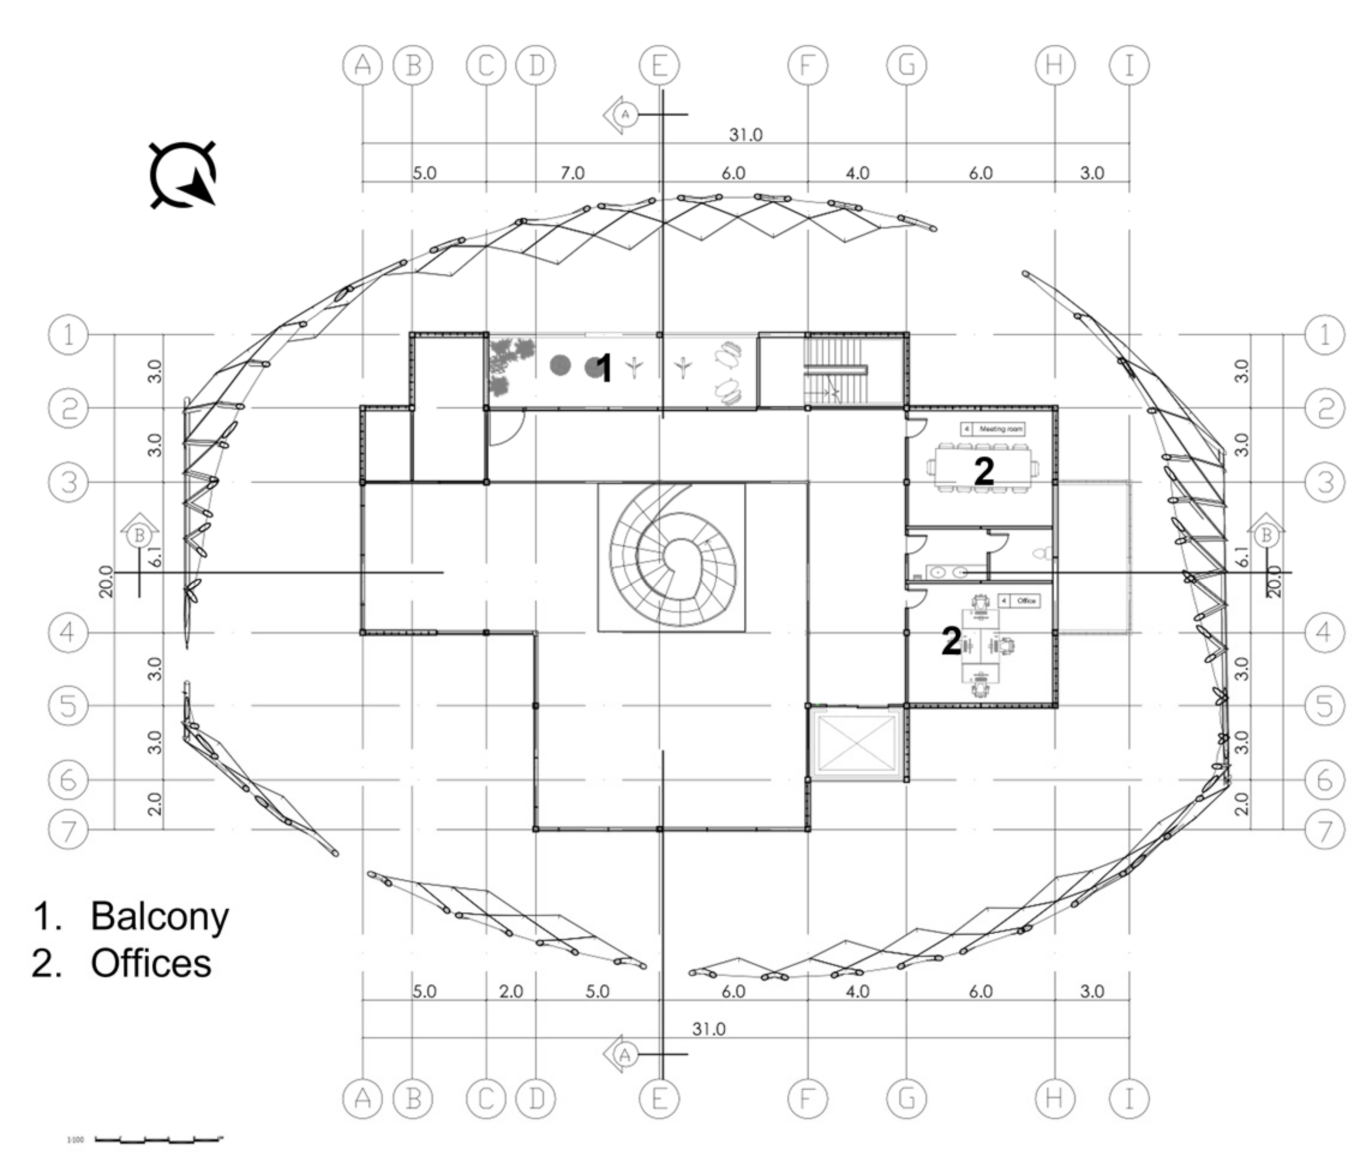
Figure 5,
Figure 6 and
Figure 7 present the building plans and section, and the following sub-sections describe the final design of the Hope Pavilion building as a result of the integrated design process described above.
2.2.1. Construction System
The construction system for the building is comprised of: (a) the walling system, which is a combination of fully insulated precast concrete panels with a U-value of 0.15 W/m
2K finished with GRC cladding, and specially designed glass curtain walls to increase the panoramic views with U-value of 1.6 W/m
2K; (b) hollow core slab for the first floor from the same supplier of the precast concrete panels to ensure integration, and; (c) metal decking roof from King span. These components comply with the Al Sa’fat code and were chosen based on energy performance, constructability, cost and time criteria.
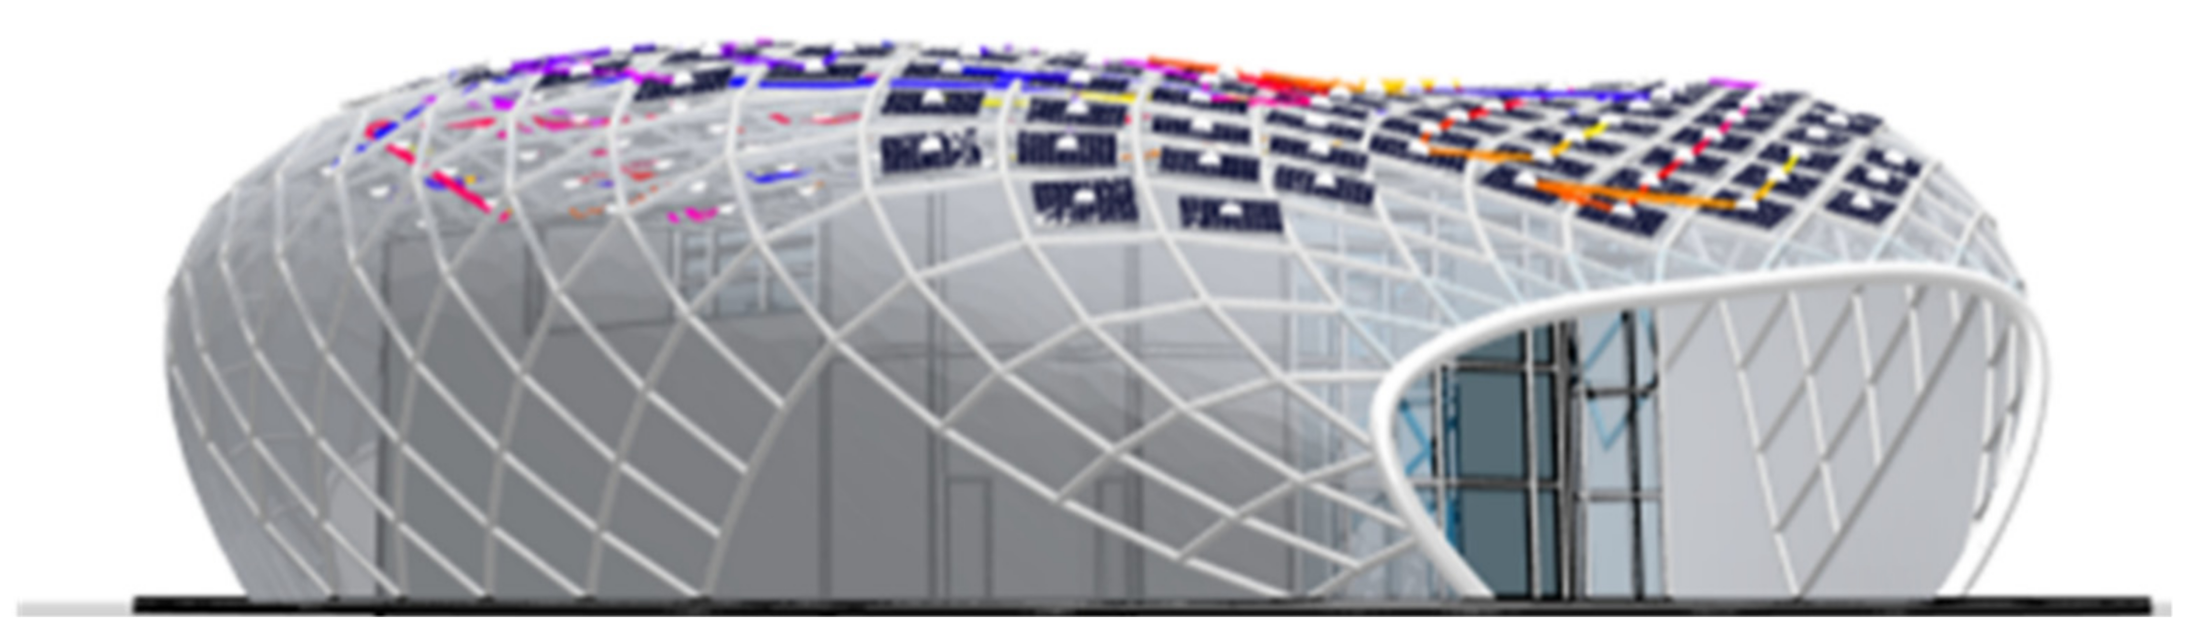
Table 2 summarizes the components of the construction system. Suitable internal finishes and components, such as the suspended ceiling, internal partitions, walkway finishing material, and the panoramic elevator, were chosen based on their evaluation to integrate the engineering systems, improve performance, and provide aesthetical appeal. Steel circular hollow sections were used for the external envelope where building integrated photovoltaic (BIPV) were fixed. The structural system is explained in the following section.
The pertinent values of the visual light transmittance and solar heat gain coefficient (SHGC) of the curtain wall and the skylight are 0.9, 0.86, 0.95, and 0.7, respectively.
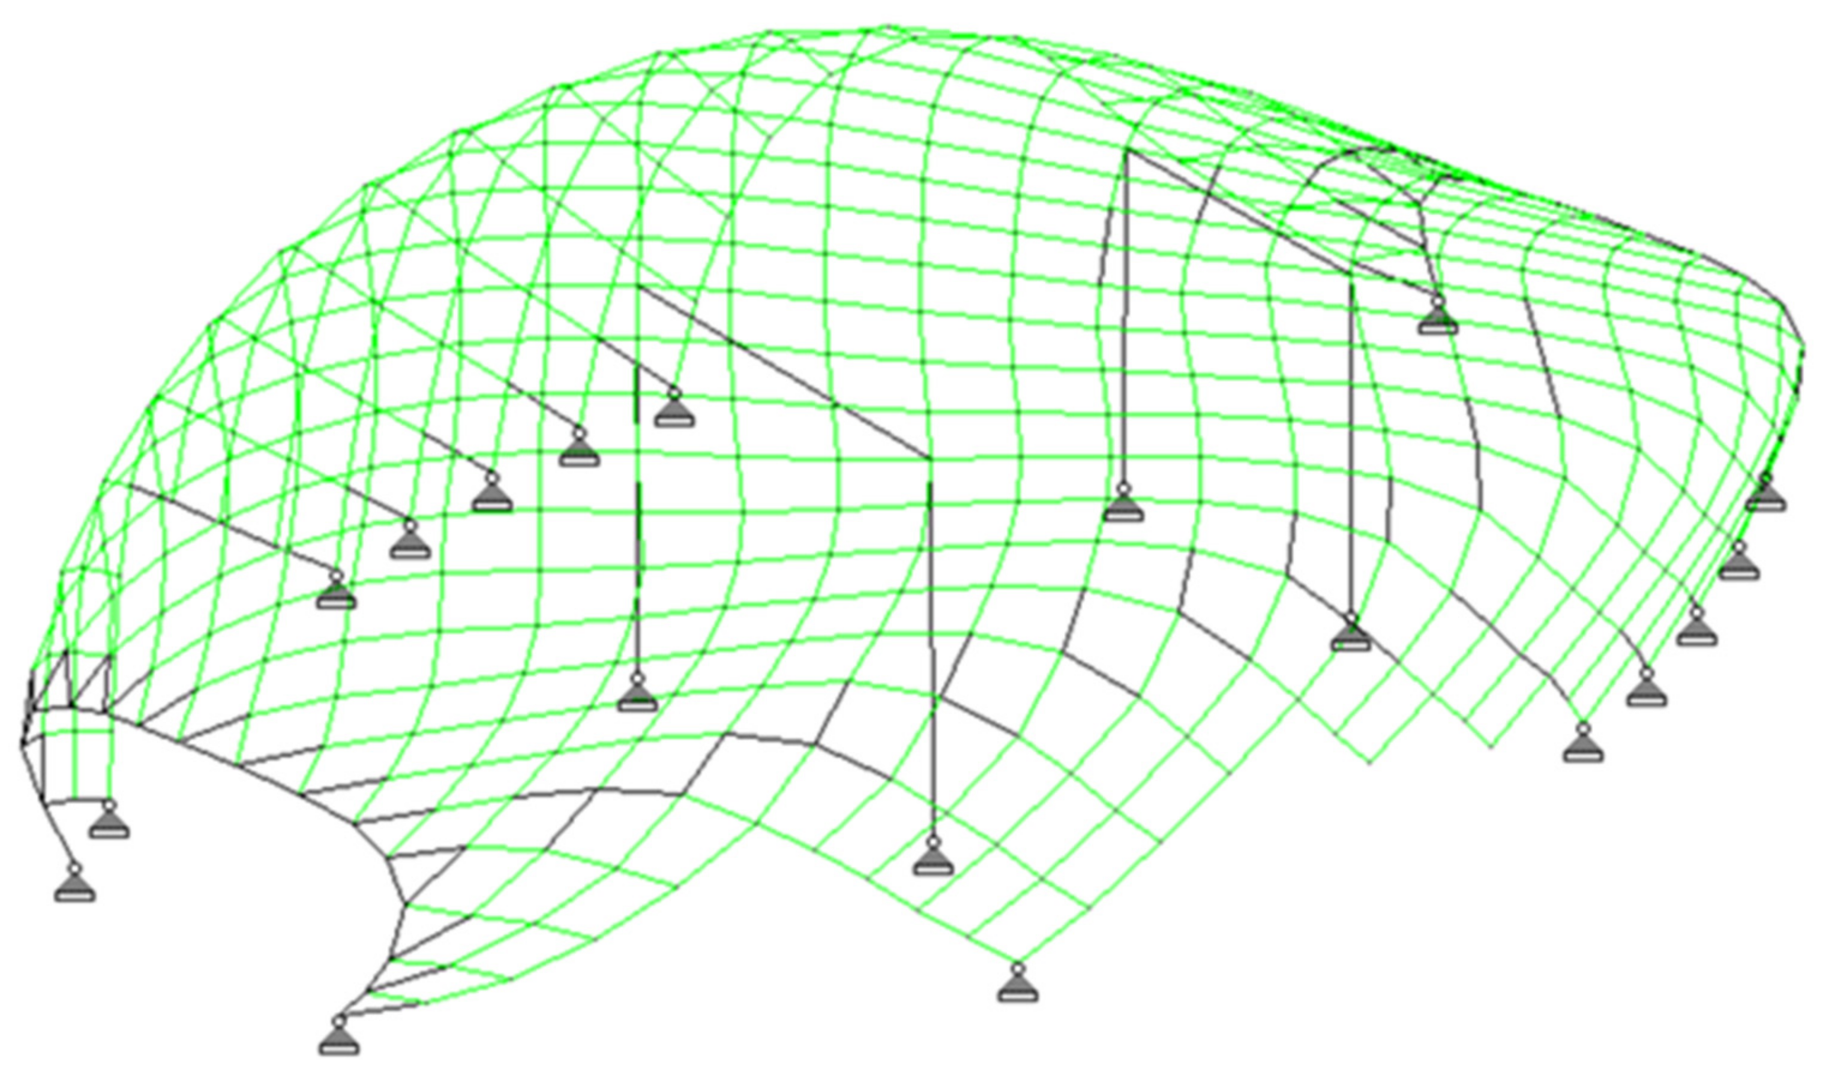
2.2.2. Structure System
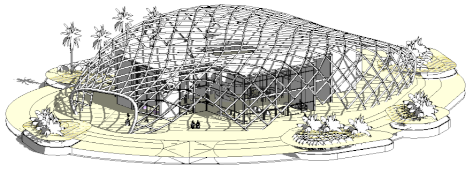
The Hope Pavilion’s architectural form is developed as a steel structural system formed by interconnected pipes arranged as a beam-to-beam grid, forming a curvy surface enclosing the main building structure, which is supported by steel frames as shown in
Figure 8.
The Hope Pavilion’s curved form is developed by a curved-edges barrel vault-shaped structural system with a curvature pointing outward at the mid-span and shoulders. The curvatures of the barrel vault help to support the outer structure’s self-weight and prevent roof buckling, and stabilize the whole building by preventing lateral movement. Furthermore, the form curvatures contribute to the building’s aesthetic form, which appears as a self-inflating capsule.
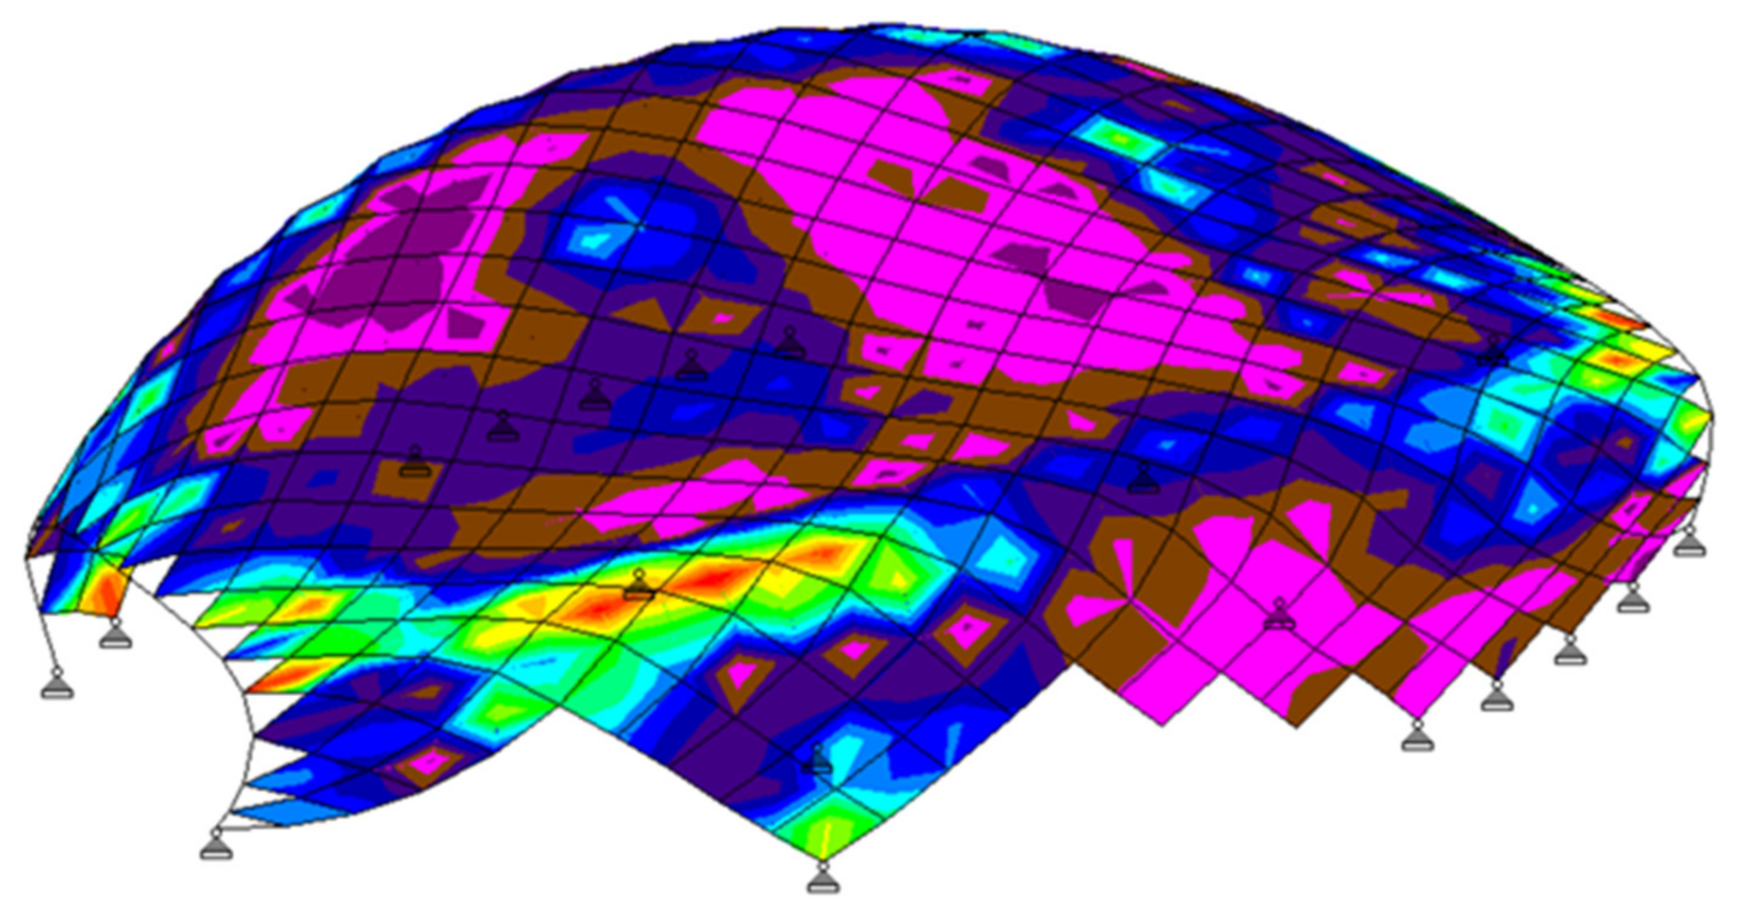
Figure 9 presents the final stress analysis of the building’s outer surface with a distribution of stresses with no major high-intensity areas.
The Hope Pavilion building geometry is optimized to support the architectural form. The maximum span of the envelope at mid-height is 32.3 m and the barrel vault curved edges are spaced at 30.3 m (maximum vault width). The highest maximum curvature of the roof is 10.5 m. The Hope Pavilion serviceability performance, in terms of deflection, is less than the maximum acceptable limits; see
Table 3.
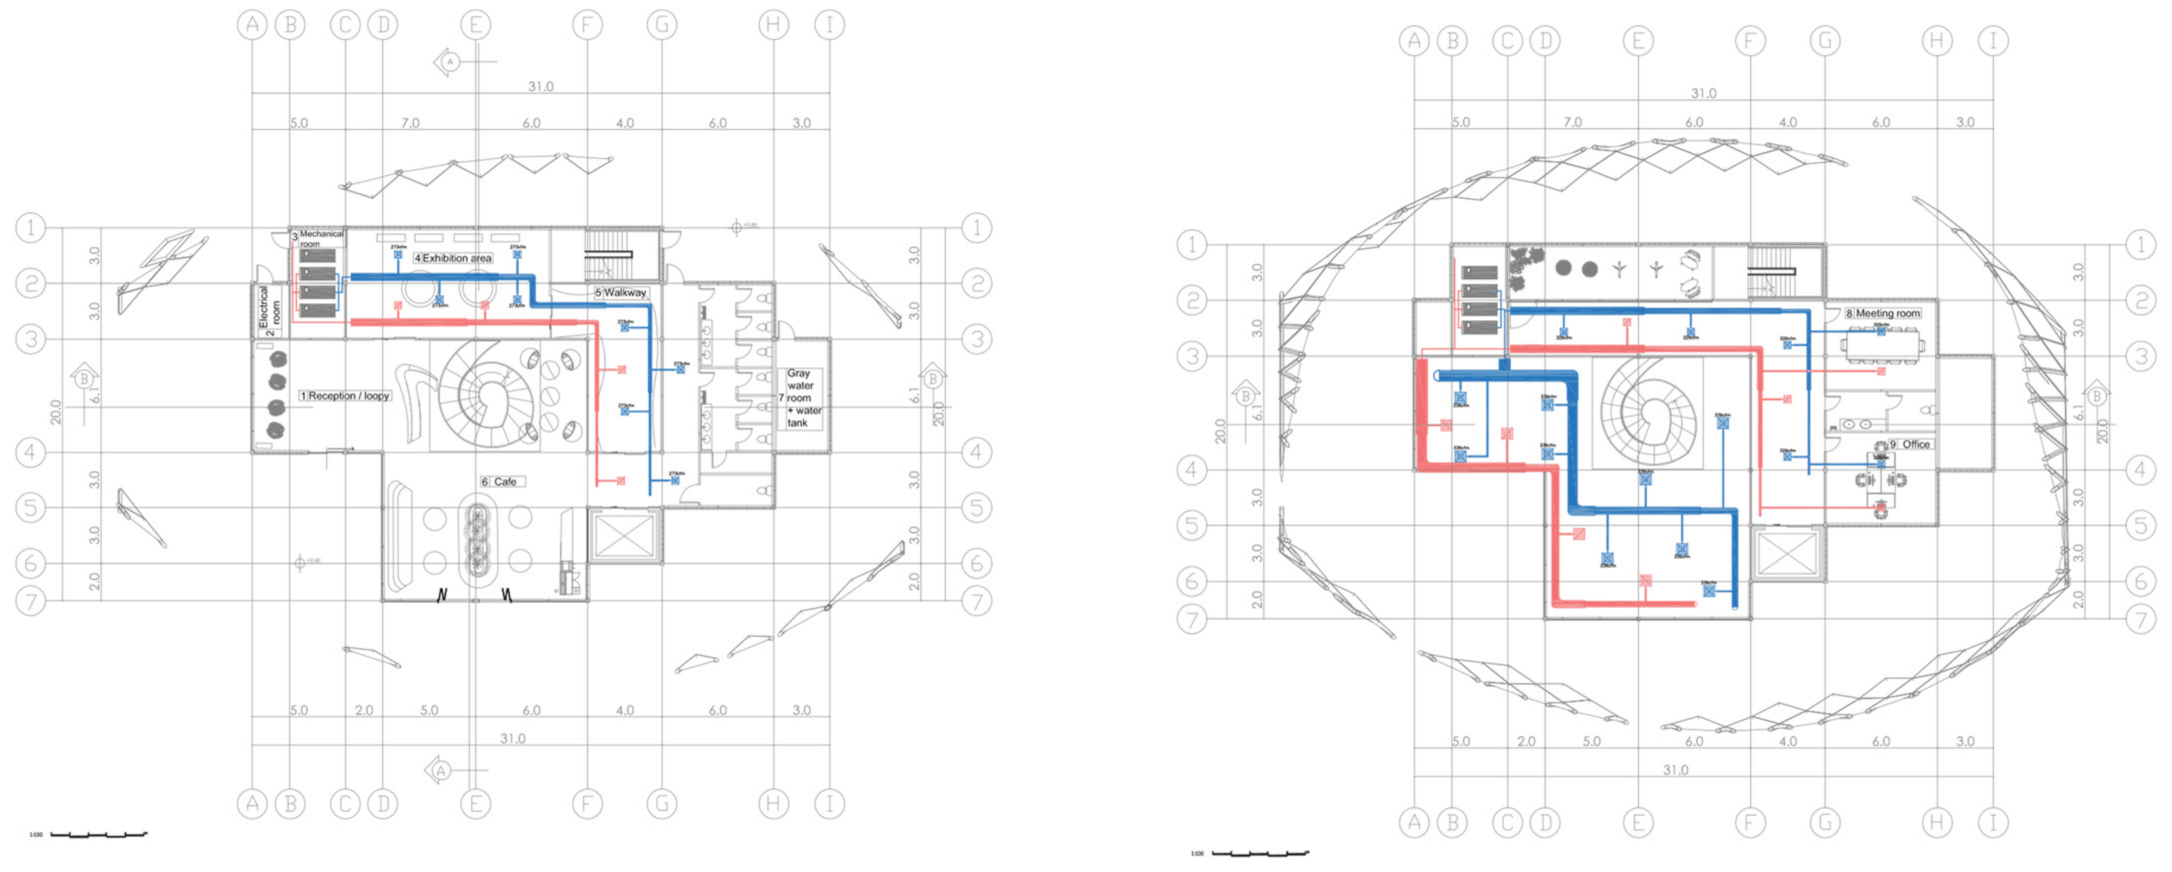
2.2.3. Mechanical System
For the HVAC system, variable air volume (VAV) is used to cool the pavilion. The VAV systems vary the airflow at a constant temperature. The advantages of VAV systems over constant-volume systems include more precise temperature control, reduced compressor wear, lower energy consumption by system fans, less fan noise, and additional passive dehumidification.
Table 4 shows the load calculation for each zone. Zone 1 is located on the ground floor with a total area of 143.5 m
2. Zone 2 and zone 3, which are located on the first floor, have a total area of 173 m
2 and 203.5 m
2, respectively.
Table 3 provides all the details regarding the size of the main duct and the cooling capacity for each zone, including the volume flow rate and the air volume for each zone. The duct supply and return layouts for the ground floor and the first floor are shown in
Figure 10.
2.2.4. Lighting System
The light level and the power density for each space in the Hope Pavilion have been defined according to the function of each space and the given area with the selected luminaire type for each to give the most benefit for the project, as shown in
Table 5. The luminaire type is also provided for each space according to its function. The table below provides recommended light levels from the Illuminating Engineering Society of North America (IESNA) Lighting Handbook and LPD levels from the IECC 2021 (using the Space-By-Space Method for calculations) [
20].
2.2.5. Wastewater System
The design of the Hope Pavilion considered the recycling of wastewater. Grey water is a very cost effective and convenient method of reusing water for many applications, and is especially appropriate for a building that implements high sustainability to save clear water input. Different companies were considered for the grey water product selection, which are Emvees Grey Water Sewer Systems, Green Water UAE, and Al Kafaah. Based on the decision matrix selection criteria, the Al Kafaah system was selected because it is highly efficient and cost-effective.
4. Discussion and Conclusions
The design of the Hope Pavilion project followed an integrated engineering process to achieve a high performing, futurist, and aesthetically pleasing building. The design integrated efficient building construction components to reflect modern building technology, a unique steel structure to ensure strength and durability, and high performing mechanical and electrical engineering systems to save energy and reduce water consumption. The focus of the project was on the design of the external envelope, which provided the image for the Hope Pavilion to reflect the achievements of the Mars mission, as well as providing a source of active energy for the operation of the building and the envelope itself. As shown in the analysis presented above, 15% of the water is recycled through the total water use; natural lighting and ventilation were improved using passive design approaches such as orientation, location of openings, and the addition of the external envelope; and 60% of the savings have been achieved through the integration of the envelope and the PV panels for electrical power generation.
The contribution of this case study is twofold. First, it provides an example of the adoption of the integrated engineering design process, which considers the different building systems from the concept phase, through the iterative evaluation of the different building components and elements, to achieve high performance. Second, it demonstrates a case study to improve lighting performance through the use of external envelopes, which also provided active sources of energy for the building when PV panels were integrated into it, leading to a more sustainable and high-performing, as well as architecturally and aesthetically pleasing building.
However, the analysis presented in this paper comes with limitations, because only the design data was considered. More data needs to be analyzed during the use of the building. Building occupants’ behavior might play a significant role in the energy consumption of the completed building [
23], leading to the question of how the actual energy usage compares to the design. Therefore, future research is needed to re-evaluate building performance using actual energy data. Furthermore, a detailed analysis of the whole life cost will also be useful to support the findings of this case study.


 ,
, 


