Article

The Evolving Economic Employment of ICT Education: The Case of Norway

by
Marco Capasso
* and
Michael Spjelkavik Mark
NIFU (Nordic Institute for Studies in Innovation, Research and Education), Postboks 2815 Tøyen, NO-0608 Oslo, Norway
*
Author to whom correspondence should be addressed.
Sustainability 2021, 13(15), 8476; https://doi.org/10.3390/su13158476
Submission received: 24 June 2021 / Revised: 26 July 2021 / Accepted: 27 July 2021 / Published: 29 July 2021
(This article belongs to the Special Issue Digital Competences for a Sustainable Society)

Abstract

:
Digitisation breaks down traditional industry and sector boundaries and fuels new work structures and networks. By using linked employer–employee data for Norway (years 2013–2017), we address two research questions: whether some parts of the economy increasingly need people who are “specialised” in ICT, in the sense that the main focus of their formal education is ICT, and whether the ongoing digitisation processes in the Norwegian economy have altered the complementarities between ICT education and other types of formal education. By means of a shift-share analysis, we disentangle the contributions to employment deriving from variation in the education mix within the sectors. We also observe the recent labour flows of ICT-educated workers across sectors of the Norwegian economy. Then, an establishment-level analysis sheds light on possible evolutions of the complementarity of ICT education with other types of education. Public administration and health are revealed to be increasingly important attractors for ICT-educated people. Nonetheless, the ICT industries still employ many ICT-educated individuals and they are becoming more specialised, possibly as outsourcees of services to other industries. Finally, flows of ICT-educated employees from and to the sales sector and the publishing and audiovisual industries suggest an evolving knowledge content in these areas of the economy.

1. Introduction

Digitisation breaks down traditional industry and sector boundaries and fuels new work structures and networks [1]. ICT is a general purpose technology which can be adopted across several industries [2], and investments in ICT, along with investments in R&D, account for a large part of the productivity growth experienced in the last decades in the OECD area [3] and Norway in particular [4]. Whereas R&D investments lead to increased productivity through innovation, ICT investments affect productivity directly [5]. However, high-level ICT competences currently appear to be scarce both in Norway and in other European countries [6].
The development and diffusion of digital technologies has characterised the recent decade and defined a “second machine age” [2] and a “fourth industrial revolution” [7]. While a first phase of digitisation, begun in the 1990s, increased the share of production, consumption and communication based on the use of data, a second digitisation phase is currently increasing the interaction between physical systems and global data networks [8]. In many parts of the economy, digitisation goes hand in hand with the development of new forms of automation and artificial intelligence, which could potentially substitute human intelligence for a relatively large share of tasks and a relevant share of jobs [9]. At the macro level, digitisation rejuvenates discussions on the relation between innovation and employment [10,11]. Some recent empirical analyses tend to downsize the overall negative effects of the new technologies on employment [12], while confirming that individuals in routine jobs may display a higher probability to become unemployed [13]. Questions arise about both the complementary role of human intelligence for existing tasks which have been digitised [14] and the influence of technology-induced capital accumulation can have on the creation of new tasks [15]. Policies on migration and trade [16], on industrial organisation and data protection [17] and on transformation of educational institutions [18] could dramatically alter the future scenarios for employment. Indeed, ICT skills differ between countries [19] and “digital divides” still exist also within Western countries [20].
The existing literature thus shows digitisation from different points of view. Interest has been revived towards studying the potential of ICT in affecting productivity growth or the range of goods and services offered by an economy. At the same time, strands of literature cover the substitution and complementarity of ICT with other factors of production, including primarily labour. In particular, many scholars have argued in favour of education and training policies for increasing the complementarity of humans with digital devices and networks. However, less light has been shed on the formal degrees in ICT and how their economic employment has varied in recent times. We explore this research gap by considering employees whose main formal education has led to an ICT degree, according to the ISCED education categories defined by UNESCO (see Section 3 for details). In particular, we focus our attention on all the workers in the Norwegian economy whose highest formal degree is on an ICT subject. The first research question we address is about whether some parts of the economy are increasingly needing people who are “specialised” in ICT, in the sense that the main focus of their formal education is ICT. A second and related research question is about whether the ongoing digitisation processes in the Norwegian economy have altered the complementarities between ICT education and other types of formal education. Our study thus adds to other existing studies which have highlighted the increasing need of ICT skills, in that we explicitly account for the specialisation of some employees on ICT skills, as attained through formal education, which can give rise to new divisions of labour within the digitised sectors.
By using data on intersectoral labour flows and establishment-level employment composition (years 2013–2017), we study the recent evolution of the Norwegian job market for ICT-educated people. Our study addresses several shortcomings in the literature. First, it allows for a detailed analysis of how ICT education is employed throughout a whole economy and how such employment has varied in recent years (2013–2017). The data cover every person and economic establishment with detailed information on both. Our study considers both public and private sectors and covers not only manufacturing but also primary and service sectors. While the existing literature already shows that digitisation is redefining the traditional industry boundaries, the empirical evidence is often narrowed to specific entities, a single industry or a snapshot from a survey. By tracing the mobility of workers with ICT education, we are able to uncover new structures and networks and confirm otherwise anecdotal developments, such as the increasingly pervasive role of ICT in the healthcare or education sectors. We address the question about whether changes in the amount of ICT educated workers in specific sectors are only mirroring general growth or point at structural changes in the economy. We also check whether new complementarities are emerging in some sectors between ICT education and other forms of education, at establishment level.
Section 2 provides an overview of the relevant literature. Section 3 details the methodology and describes the data used for our empirical example. Section 4 shows the results and Section 5 concludes.

2. Literature

Economies are complex systems, functioning through the interactions of a large number of different agents [21]. Interactions allow the combination of different capabilities, adding to a country’s economic complexity [22]. Skills are a capability, and specific labour skills available within a country are among the determinants of a country’s export mix; they also define the paths on which the export mix can be extended [23,24]. Analogously, a country’s industry tends to extend its production mix, by adding products that belong to the production mix of “skill-related” industries [25]. The implication we draw, and on which we base our paper, is: if the same skill can be used in different industries, and if the same education can contribute to different skills, then it is possible to associate a particular education to different sets of industries, each one constituting an outlet for the given education path.
The methodological steps we use relate to the increasing availability of microdata from the national statistical offices. During the last decade, new types of microdata have started to be available to social researchers, thus making it possible to adopt different methodologies to answer research questions in social sciences. An important development has been registered in the acquisition of individual-level data connecting employers to employees. This type of datasets allows tracking the careers of every resident in a given country, and especially its movement across firms, often even across establishments. The association between workers and establishments makes it possible to understand the match between skills at the individual level and the sets of skills available altogether within an establishment, thus creating the possibility of a complementation of skills which will translate into a good produced or a service provided. Most importantly, this type of employer–employee data shows the evolution of careers over time, as well as the evolution of the sets of skills within establishments. The establishments are often defined by an industry code (e.g., a NACE code), usually made available by the same statistical office which provides the individual-level data. Then, a connection between people and sectors can be defined. Moreover, by looking, in the aggregate, at the movements of people between economic sectors, a connection between sectors themselves can also be defined.
While the economic agents interact in many different settings, and the economy can be disaggregated at different levels for study, considering sectors as units of analysis is an established and fruitful practice to understand the knowledge evolution within an economy [26,27]. However, while innovation studies have often analysed the economy as a network of knowledge relations across sectors, tools originating in network theory have often been directed towards other types of analyses [28]. In particular, visualisation tools grounded in network theory and employed for input–output economic analyses [29] can provide additional intuitions to the visualisation of knowledge relations among sectors.
The construction of a “skill-relatedness” index by Neffke and Henning [25] was made possible by increased data availability: by observing labour flows between industries, a measure of industry “skill-relatedness” was inferred. Given that skill-relatedness can be estimated for any pair of economic sectors, and be marked as a particular connection between sectors, then a whole economy can be seen as a network, where each sector is a node and skill-relatedness is a link. This intuition has given rise to an entire strand of literature, which, during the last decade, has crystallised into a specific methodological approach to evolutionary economic geography. In particular, industry skill-relatedness has connected with the concept of related variety [30], which, at regional level, can affect diversification [31] and resilience [30]. The same methodology has then been applied in other national context, such as Germany [32] and Norway [33].
We want to point out that individual-level education data are often left out of the picture by this same scientific literature, although education contributes to shape skills. Education helps to develop the ability to perform tasks, and this ability allows a person to be active in the economy (and thus be employed in an economic sector). We hold on to the idea, particularly stressed by Hidalgo and Hausmann [22] in a macro-setting, that specific capabilities are needed to complement physical capital (as well as other capabilities), in order to produce a given good or service. Considering, instead, generic measures of human capital (e.g., measured in years of schooling) might limit the analysis’s depth [22]. In our paper, we assume that employment of a worker in an economic industry often signals a skill, also derived from education, which is useful in that industry and possibly also in other specific industries. Although the skills of a worker are also influenced directly by specific industry in which work occurs or has occurred, we place more emphasis on employment as a signal rather than as a cause of the skill.
We complement education data with linked employer–employee data, within a framework inspired by the skill-relatedness literature. In particular, we use data-driven procedures which summarise the fields of application of ICT education and illustrate how such application relates to the country’s employment dynamics. Drawing on a renewed interest in skill complementarity and human capital interconnectedness [34], our walk-through also incorporates statistics about the establishment-level education mixes observed in the country. We are aware that other micro-data sources, providing observed variables related to the workers’s skills, could provide valid alternative empirical paths. Alabdulkareem et al. [35] showed that occupation-related data can set the basis for extensions of the Neffke and Henning [25] framework, which can build skill taxonomies and explain job polarisation phenomena. While we recognise that occupation data have opened promising empirical avenues for understanding employment dynamics [36,37,38], including in connection with the concept of skill-relatedness (although with different methodological approaches [39,40]), we stress that education data have not been sufficiently exploited (with a notable exception [41]).
Our study sheds light on how the economy is being changed by the ongoing digitisation and whether ICT education helps sustaining the production of goods and services in the economy, throughout such change. Human–machine interactions, by means of information and communication technologies, have also become the norm in those parts of the economy which had only marginally been affected by the ICT revolution of the 1980s. Most importantly, the evolving way in which economic activities are able to satisfy the needs and desires of the population is under our scrutiny. The prevailing industrial classifications of economic activities, such as the NACE classification we adopt in our study, suggest an ideal division of the economy into sectors, based on the goods and services produced by each economic activity. The observation of the employee education mix within each economic sector thus helps us explain how the production of the sector’s goods and services can persist over time while digitisation processes take place. The sustained economic relevance of ICT formal education paths, contributing to provide specialised digital competences where needed in the economy during these times, is our main object of investigation.

3. Materials and Methods

3.1. Approach

Our question is: Have there been changes in the way ICT education is employed by the Norwegian economy? We address particularly the match between the acquisition of skills through education and the application of those skills within specific sectors of the economy. We investigate whether ICT education is, in year 2017, employed differently by the Norwegian economy than four years before. Given that “skills” and “economy” are concepts which cannot be uniquely reduced to measures, an essential element for our analysis lies in the reference to “education” and “sectors” (for simplicity, we use the words “sector” and “industry” interchangeably, independently of the aggregation level). Specifically, in our analysis, we call “ICT education” an education classified as “06—Information and Communication Technology” according to the ISCED-F 2013 codes (International Standard Classification of Education Fields of Education and Training 2013, as defined by UNESCO [42]; see Section 3.4 for details) and we call “sectors” the ones defined by NACE codes (the statistical classification of economic activities in the European Union; see Section 3.4 for details).
A main point here is that the relation between specific skills, on the one side, and the economy as a whole, on the other side, occurs through the application of skills within specific activities, performed by workers within economic establishments. Given that a NACE code is associated, in Norway, to each economic establishment in the country, and it is possible, through data from the national statistical office, to observe the education of each employee in each establishment, then it is also possible to abstract an overall picture of what has happened recently in the country.
We approach our research question in two ways. First, we look at the ongoing reallocation of ICT-educated workers (years 2013–2017) within the Norwegian economy, measured through the absolute and relative increase of ICT-educated workers within each sector. We also observe the recent labour flows of ICT-educated workers across sectors of the Norwegian economy. Then, an establishment-level analysis, conducted separately for each economic sector, sheds light on possible evolutions of the complementarity of ICT education with other types of education.
Two premises are due. The first premise is that our study is not about “how much” the ICT education fits the economy; we do not aim at providing a univoque quantitative measure of fit. Our goal is instead to discuss “the way in which” ICT education fits the economy. We do not ask ourselves whether the ICT education fits now the Norwegian economy “more than” before, but we wonder about “how” the ICT education is today contributing to the production of goods and services in Norway, how it comes into use for the country in economic terms, and whether such economic use changed with respect to before. The sectoral classifications we use to describe the economy are, in practical terms, the tool we use for identifying the production of given goods and services and its connection to ICT education. Ours are broad research questions, since we study both ICT education (quite a general theme) and a whole national economy (an even more general theme); we leave more narrow research questions, and deeper analyses, to further research.
A second premise is that, as mentioned above, the availability of data for researchers has changed dramatically in recent times: a much higher availability of microdata (also at personal level) pushes for new suggestions for the selection of statistics to use, even for descriptive purposes. Our paper operates indeed at a descriptive level; the array of descriptive statistics we build from microdata can be seen as building blocks for future analyses. They do not give conclusive answers, but they hint towards temptative answers and may help formulate future narrower research questions. To answer those questions, we would have to go much deeper in the analysis and out of the scope of this paper, by focussing only on some sectors and adding additional variables to our dataset (for instance about wages), in order to grasp an idea of education “demand” and “supply” functions and not simply on their actual match.
However, the next two subsections are still able to bring two different perspectives: in the next subsection, we look at ICT education and NACE sectors, which can be seen as one “input” and the “output” of the economy. In the following subsection, we also look at other types of education, that is on several “inputs” as well as the “output” of the economy. To simplify such a complex picture, we adopt the education macrocategories defined by the ISCED education codes from UNESCO, so that we can allocate the working population to ISCED education macrocategories. ICT education is one of the ISCED macrocategories and might be slightly more extended than the definitions of ICT education given in some strands of the literature. In any case, categories (both of education and of economic activities) must be taken with a grain of salt, since their borders are often blurred and risks always arise from imposing borders between categories and from choosing degrees of aggregation.

3.2. ICT-Educated Workforce Allocation

We employ the A38 sectoral aggregation level, which is used by Eurostat as an intermediate step between 1-digit and 2-digit NACE codes, and builds upon an aggregation of the 88 2-digit sectors into 38 macrosectors [43]. The “A38” macrosectors provide an intuitive disaggregation of a national economy, since they also allow a first disaggregation across manufacturing sectors which would not be achieved by using 1-digit level disaggregations. On the other hand, this level of aggregation keeps visible the important distinction, which would exist already at 1-digit, between private and public sectors, as well as between primary, secondary and tertiary sectors.
We restrict our attention on recent changes of the match, and so we measure, in each of the 38 “A38” macrosectors, the number of people with an ICT education at the beginning and at the end of a recent period of interest; in our empirical application, such period covers the years between 2013 and 2017. We then concentrate the attention on those A38 sectors which have contributed the most, in absolute terms, to the overall change in the economy. We must highlight the expression “in absolute terms”, since the overall change in the economy can result from a partial offset of strongly positive contributions, by some macrosectors, and of strongly negative contributions, by some other macrosectors.
The strongly positive contributions and strongly negative contributions can be disentangled by looking at all macrosectors which exhibited a high change in absolute value. In particular, we suggest to, first, rank all the macrosectors which have increased their number of ICT-employees, according to the increase amount. Then, we compute the sums of the increases: this could be named as a positive “collective push”. Finally, we progressively sum the contributions of each macrosector to the “collective push”, starting from the macrosector having the highest increase, until we reach a given percentage of the “collective push”. For instance, if we chose a threshold of 75%, we would concentrate on the lowest number of macrosectors which can, taken altogether, provide 75% of the “collective push”; roughly speaking, these macrosectors represent the part of the economy that mainly pushes toward an overall increase of ICT employees in the whole economy. The procedure is then repeated for the macrosectors which have decreased their number of ICT-educated employees during the reference period.
In order to disentangle the contributions to employment coming from a change in the national industry mix, leading to the overall employment of specific sectors, from the contributions that derive from variations in the education-mix within the sectors, we conduct a “shift-share analysis” [44]. The shift-share analysis was originally conceived to look at changes in the comparative advantage of a region (i.e., changes in the specific advantages of one region in an economic sector [45]); instead, we substitute the regional aspects of the methodology with educational aspects, in order to investigate changes in the specific utilisation of ICT education in each economic sector.
Our shift-share analysis decomposes the change e in employment of ICT-educated workers within industry i between the two years t and t + n (where t = 2013 and n = 4 ) as the sum of three effects: national growth effect ( N S i ), industry mix effect ( I M i ) and education share effect ( E S i ).
e i t + n e i t = N S i + I M i + E S i
Each of the three effects is defined as an increase of the beginning value e i t of ICT-educated workers in the sector:
N S i = e i t × G
I M i = e i t × ( G i G )
E S i = e i t × ( g i G i )
where the total per cent change in workers in the Norwegian economy for all industries and educations combined is G, while the sector-specific per cent changes for sector i, respectively, for all educations and only for ICT-educated, are Gi and gi. Indeed, the definition of gi, as expressed by the identity g i ( e i t + n e i t ) / e i t , can be shown by substituting Equations (2)–(4) into Equation (1). In other words, the change in ICT-educated employees in each sector is interpreted, in our application of the shift-share analysis, as residual employment dynamics which cannot be simply reduced to changes in the industry mix of the country. As shown below, both sectoral restructuring of the country and skill variations within sectors seem to influence the current allocation of ICT-educated workers.
If a sector has increased the number of ICT-educated employees, such increase may be fuelled either by employees who have just entered, or re-entered, the labour force or, more often, by employees coming from other sectors of the economy. A representation of the network of recent labour flows (between years 2013 and 2017) provides an idea of how the rearrangement of ICT-educated employees within the economy is happening by a reallocation of workers across sectors. Moreover, drawing on the intuitions by Neffke and Henning [25] and Fitjar and Timmermans [46], we also consider intersectoral labour flows of ICT-educated workers as a signal for novel uses of existing ICT skills.

3.3. Education Complementarity Evolution

The first part of our methodology, described in the previous subsection, focusses on analysing the recent dynamics within economic sectors and the labour flows between economic sectors, especially to check whether the ICT-educated workforce has found new types of allocation. The ICT education has been ideally considered as the source of an input, in terms of human capital, to an economic process, whose output can instead be qualified according to the NACE sector where the enterprise belongs. We can see the NACE sector as the expression of an output, and the education as the building-up of an input. The second part of our methodology, described in this subsection, orients the analysis toward the interaction of the ICT-education “input” with other types of input, also in the form of skills or embedded human capital, which are brought to a sector by all the employees who are not educated in an ICT discipline. In other words, the contribution of the ICT-education “input” to the NACE category “output” is seen, in this second part of the methodology, as mediated by the collaboration and interaction with other people working in the same establishments as the ICT-educated employees. We ask ourselves whether the increased participation, as observed by the previous methodological steps, of ICT education to some economic sectors has been accompanied by an increased observed complementarity with other types of education.
When talking about complementarity between inputs, we need to keep in mind the level at which the analysis is conducted. It is a known empirical regularity that economic inputs may appear as substitutes at higher forms of sectoral aggregation and as complements at lower forms of sectoral aggregation. For instance, establishments within a sector can adopt different types of production processes, where inputs appear in different proportion across different establishments (i.e., they are complementary in different ways), while the variation of processes across firms (also for similar quantities of output) can appear, on aggregate in an empirical study, as a substitution of inputs at sectoral level. In addition, when focussing on intellectual inputs, as for our case, an increased complementarity between inputs within a sector, deriving for instance from an increasing adoption of a new economic process, would best appear through an analysis conducted at very low level of disaggregation, possibly at establishment-level. Therefore, we analyse the evolution of complementarity between ICT education and other types of education, by looking at the correlation, within-sector and across-establishment, of changes in the share of ICT-educated people in the establishment, on the one hand, and changes in the share of people educated in each of the other ISCED-2013 categories, on the other hand.
More precisely, for each A38 sector, we consider all establishments present in both the year 2013 register and the year 2017 register. For each establishment, we categorise all employees according to the field of their highest education degree, using the 11 macrocategories of the ISCED-2013 system (as mentioned, one of these categories, ISCED “06”, is ICT education). The 11 ISCED categories are: “00 Generic programmes and qualifications”, “01 Education”, “02 Arts and humanities”, “03 Social sciences, journalism and information”, “04 Business, administration and law”, “05 Natural sciences, mathematics and statistics”, “06 Information and Communication Technologies”, “07 Engineering, manufacturing and construction”, “08 Agriculture, forestry, fisheries and veterinary”, “09 Health and welfare”, and “10 Services”. Each establishment, in each of the two years, is thus associated to an 11-cell “compositional” vector where each cell of the vector reports the share, within the establishment, of employees having a given education. Such compositional vector is computed for both year 2017 and 2013, and the difference between the two vectors is called by us a “difference compositional vector”, whose cells contain, for each establishment, the change of the share of employment associated to each given ISCED category.
Within each A38 sector, we compute the correlation matrix of all these “difference compositional vectors” obtained for all establishments in the sector: an 11-by-11 correlation matrix is thus obtained which contains, in each cell, a correlation index for each pair of ISCED education categories. Whenever such index is positive for a cell i j , an increase in the share of employment educated in the ISCED field i in an establishment is typically accompanied by an increase in the share of employment, in the same establishment, educated in the ISCED field j. Instead of showing the whole matrix, we focus, for each A38 sector, on the column of the matrix pertaining to the ICT-education category (ISCED “06”). The row-index associated to the highest positive value of the column signals the ISCED education field which, in that particular A38 sector, has tended to be “used” more (less) by the same establishments where the ICT education, moving from year 2013 to year 2017, has been “used” more (less).

3.4. Data

We use data on employment from Statistics Norway, made available to us by means of two different datasets. The first dataset contains data at the individual employee level covering all persons working in Norway and covering (in the data form available to us) each year from 2013 to 2017 inclusive. The data include an employer variable in the form of a unique firm identifier where the employee works; the firm identifier is available at establishment level. If a person is employed by more than one firm, the person is registered as employed by the firm where he or she works the most hours per week. For the years between 2013 and 2014, the employment has been registered in one given reference week each year [47]; for the years between 2015 and 2017, the employment has been registered throughout the whole of each year, and we consider only the one defined as “main occupation” for the year [48]. Firms are here defined at the individual plant or establishment level, rather than at the enterprise level. The enterprise is here the legal unit, and may comprise several establishments; each establishment is associated to a 5-digit NACE sector code.
Instead, the “education” variables are obtained by matching our data with a third dataset containing, for each year, the NUS (Norwegian Standard Classification of Education) code of the highest degree obtained by each person in Norway; the NUS code is a 6-digit code containing information about both the level and the field of education [49]. The education, reported as a NUS code, is registered on 1 October each year. Here, we adopt a restrictive approach as well: we consider an education degree as already achieved, for a given year, if this is registered as achieved on 1 October the previous year. A worker is considered as ICT-educated, in a given year, if the highest education degree achieved until 1 October the previous year is in an ICT subject, i.e., with a 6-digit NUS education code which can be associated to to the 2-digit “ISCED-F 2013” education code “06-Information and Communication Technologies”. “ISCED-F 2013” codes have been defined by UNESCO [42] (see the website: http://uis.unesco.org/sites/default/files/documents/international-standard-classification-of-education-fields-of-education-and-training-2013-detailed-field-descriptions-2015-en.pdf, accessed on 30 June 2016). The association between 6-digit NUS education codes and 2-digit “ISCED-F 2013” education codes (henceforth, simply named “ISCED”) is made by employing the existing association, provided by Statistics Norway, between 6-digit NUS education codes and 4-digit ISCED education codes (see the website: https://www.ssb.no/klass/klassifikasjoner/141/korrespondanser/525, accessed on 15 July 2020). For a worker having more than one degrees of the same level, only the latest achieved degree is considered.

4. Results

4.1. Focus

The following presents the results of our empirical application. We address the questions:
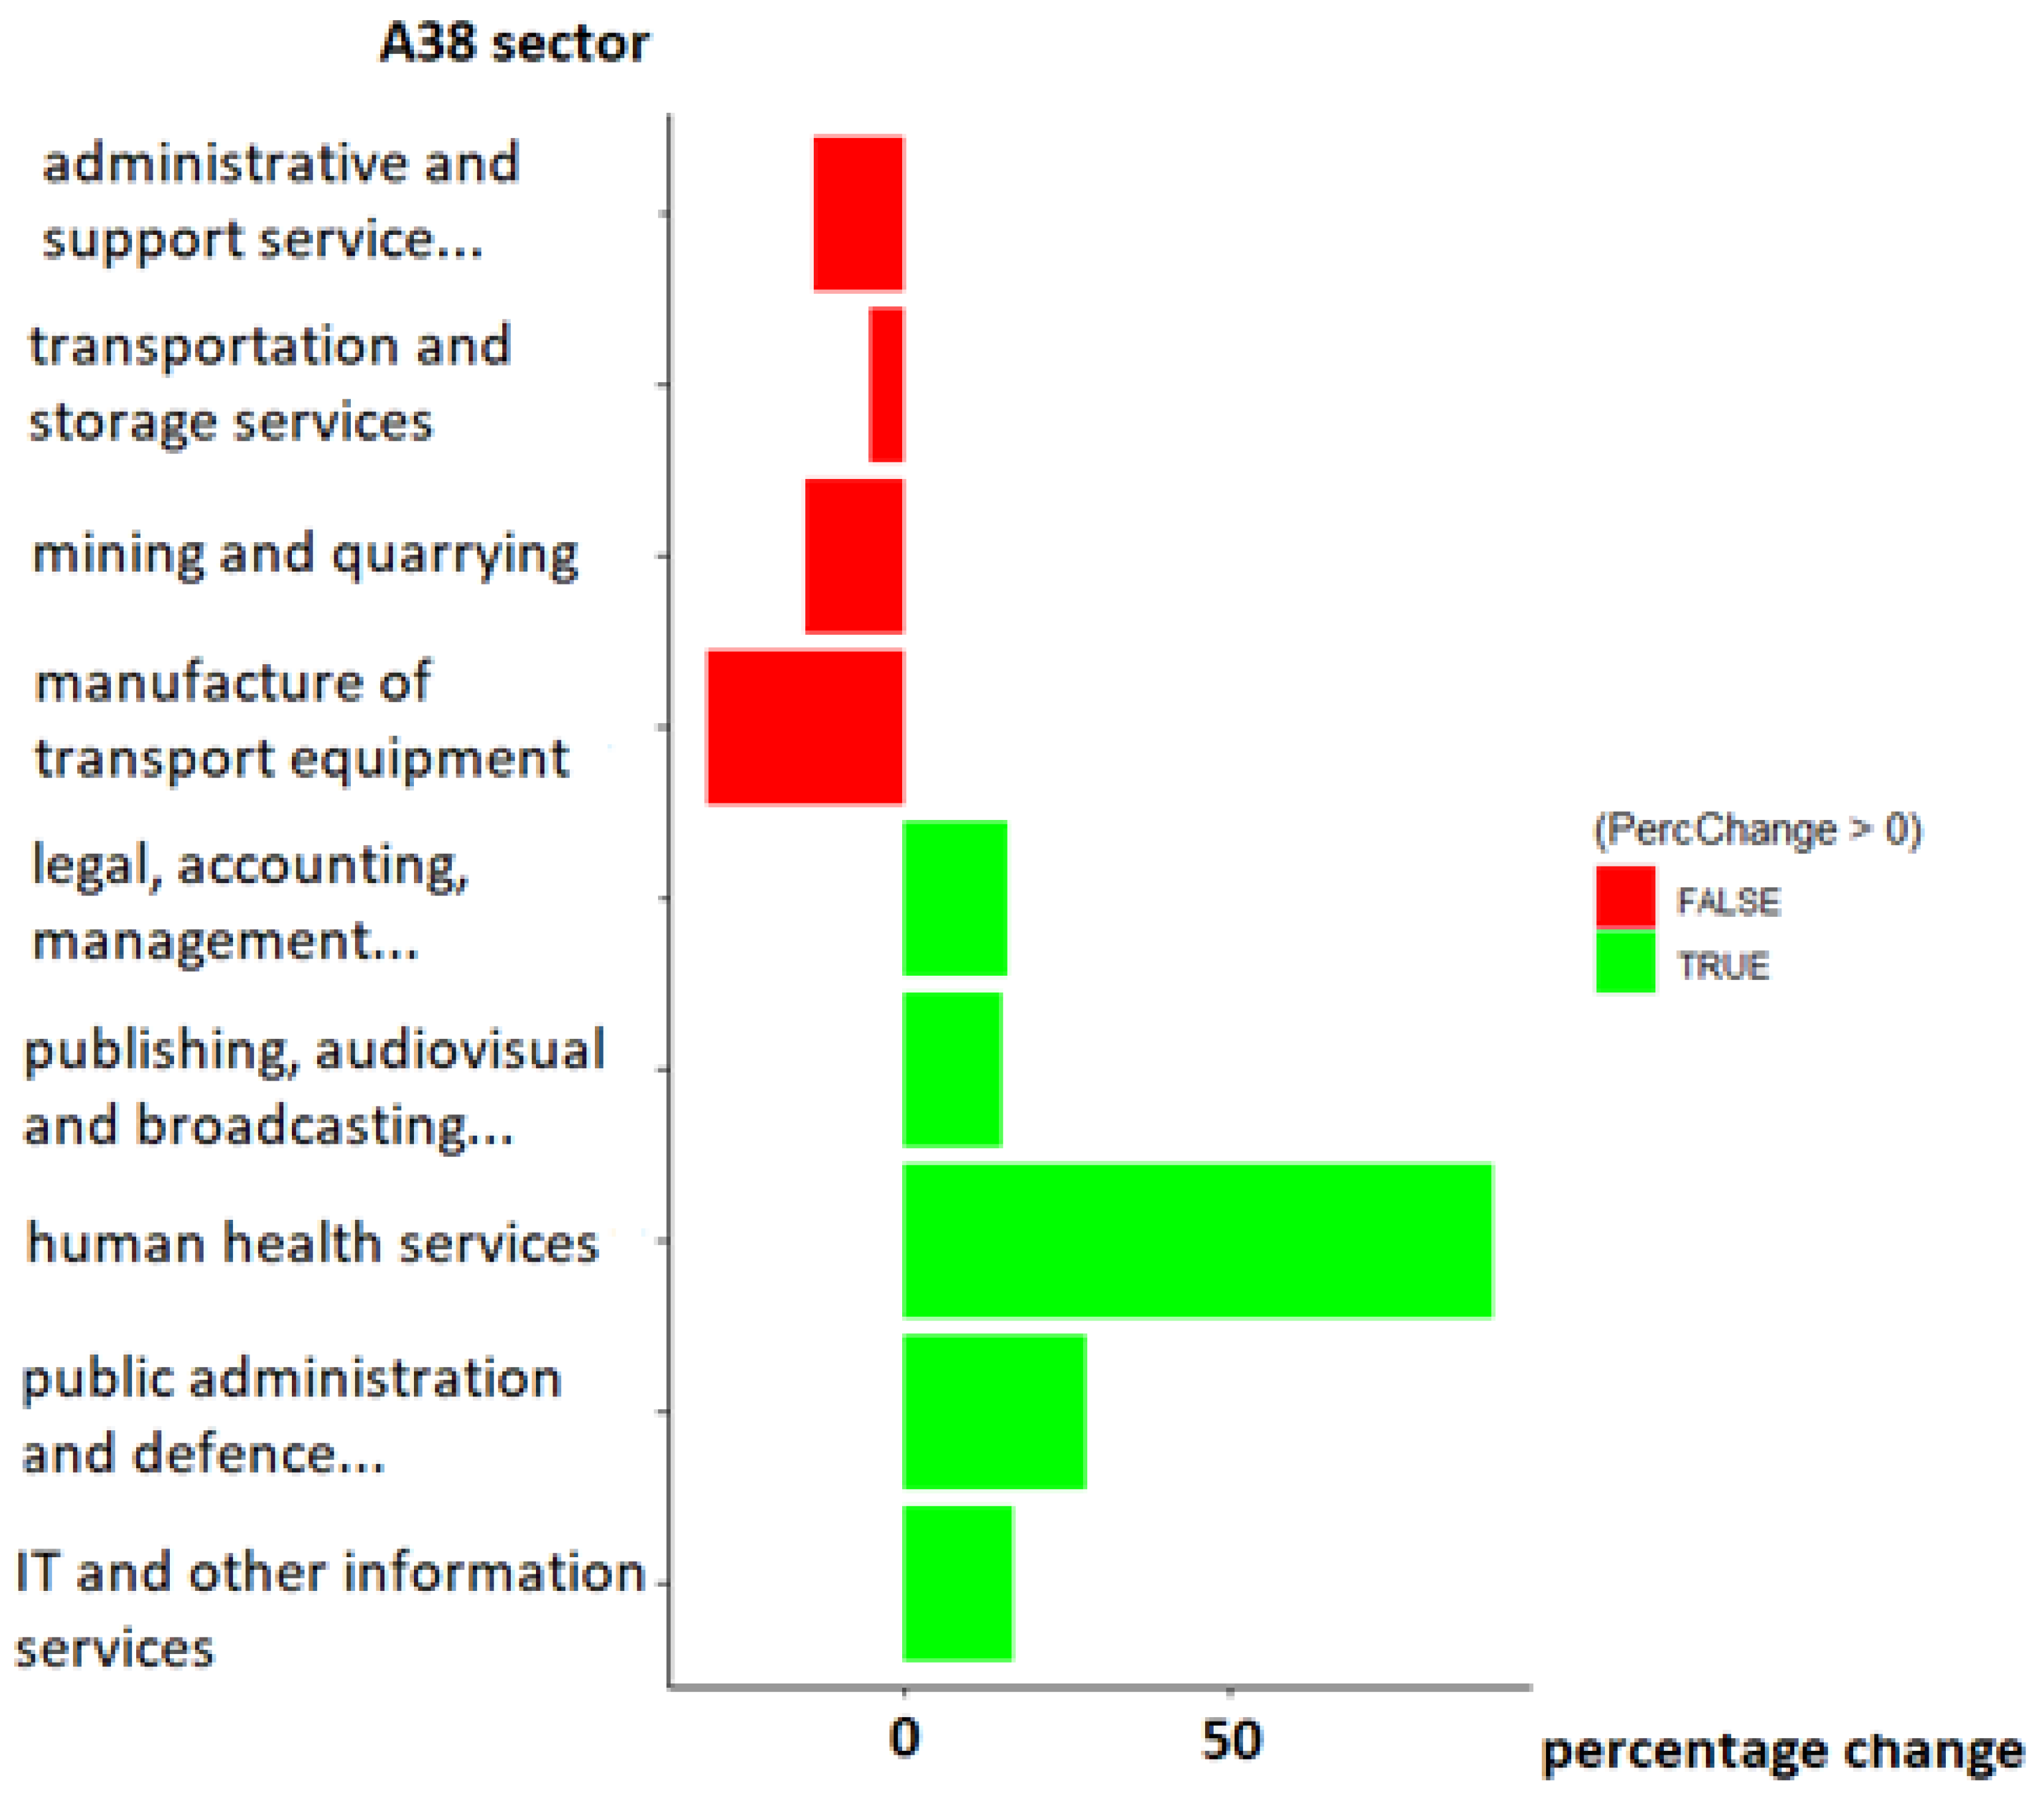
  • What sectors have recently shown an increase and decrease in ICT-educated employees?
  • What is the magnitude of increase and decrease?
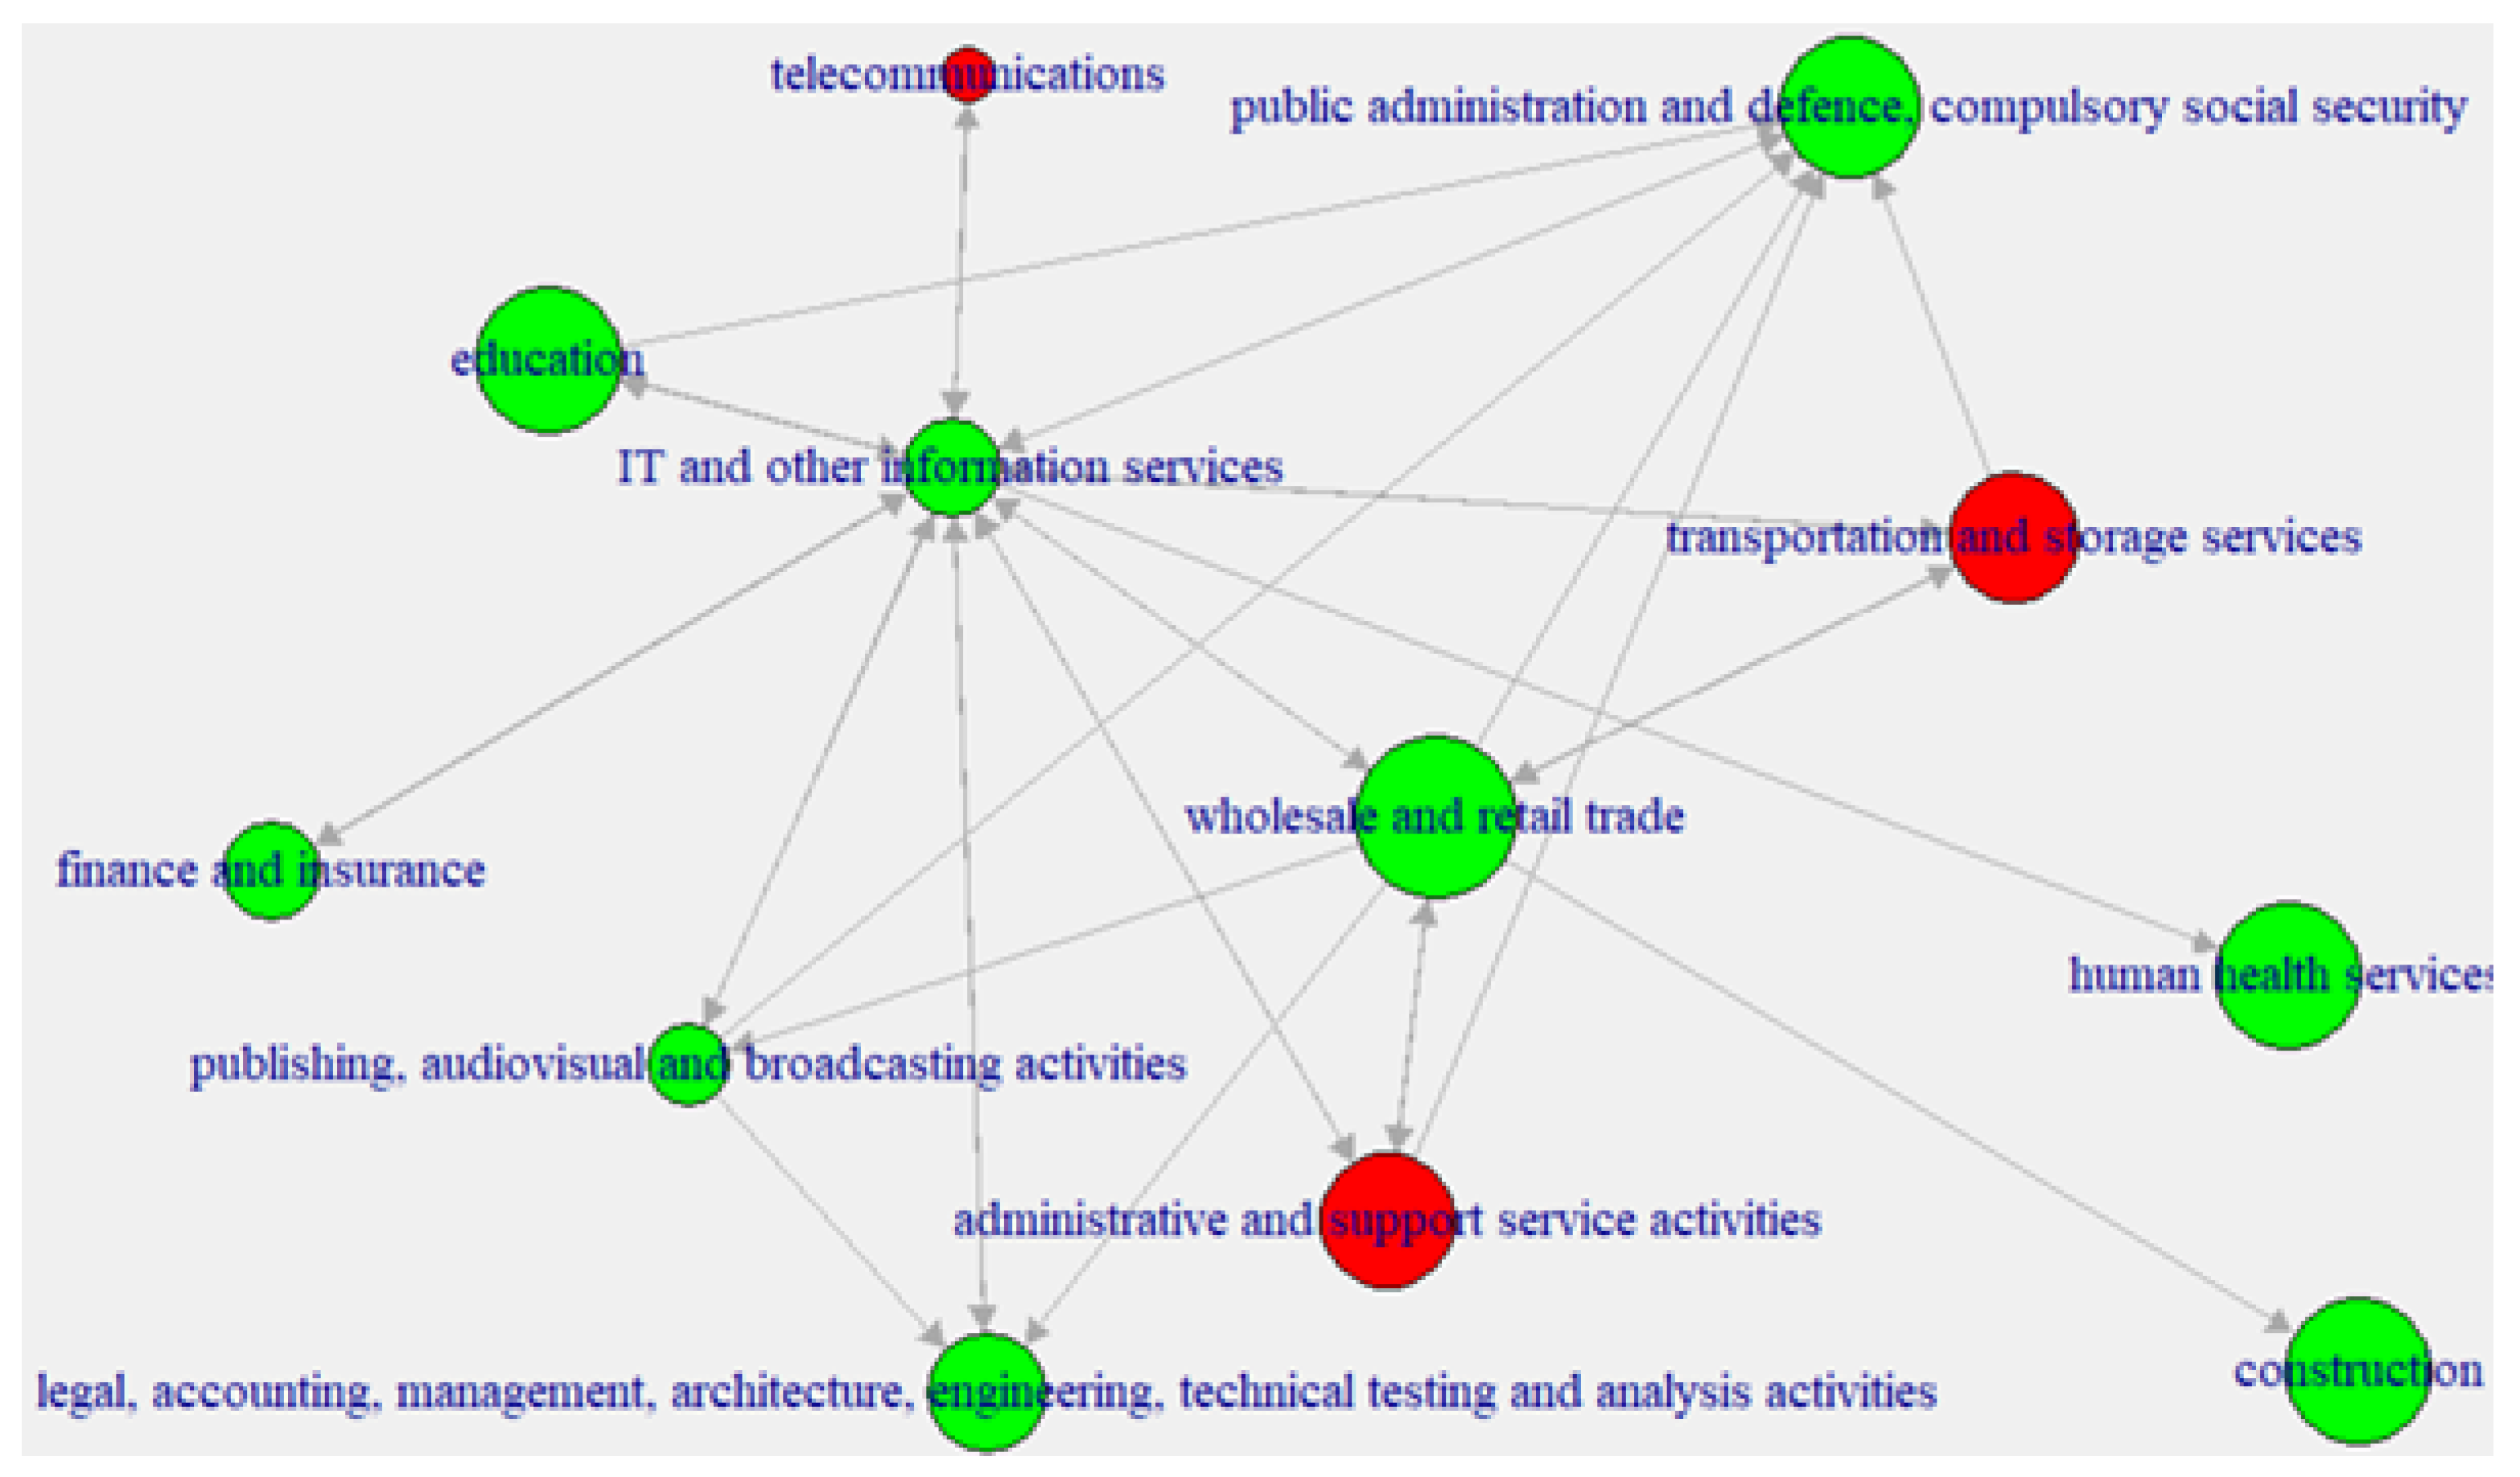
  • What are the significant flows of ICT-educated workers to and from sectors?
  • Has ICT-education been increasingly complementary to other types of education?
This exercise does not provide complete answers as to the labour market situation of ICT-educated persons; however, it does provide valuable insights as to where ICT-educated persons work, what sectors are blooming or fading in terms of work opportunities for ICT-educated people and insights about restructuring processes within the economy.

4.2. ICT-Educated Workforce Allocation

We first check what sectors are increasing and decreasing, in terms of ICT-educated people, between years 2013 and 2017. In total, the amount of ICT-educated people has increased by 3342. If we divide the figures according to the A38 macrosectors, we can identify the macrosectors contributing positively or negatively to the overall increase. In particular, the macrosectors that contribute with 75% of the total increase are, in ranked order:
  • NACE 62–63: IT and other information services;
  • NACE 84: Public administration and defence, compulsory social security;
  • NACE 86: Human health services;
  • NACE 58–60: Publishing, audiovisual and broadcasting activities;
  • NACE 69–71: Legal, accounting, management, architecture, engineering, technical testing and analysis activities.
These five macrosectors add up to more than 75% of the total increase of high skilled ICT employees. It is not surprising that the traditional ICT sectors, usually associated to two-digit sectors between 58 and 63, are included in the list, through the two A38 macrosectors 62–63 and 58–60. Even more interesting is the presence of the public sectors: both NACE 84 (public administration) and NACE 86 (health) are among the five sectors contributing the most to increased employment. This can obviously be seen as deriving from an increased digitisation of the public sector in Norway. It can also be seen as a consequence of an overall increase in the number of employees in these sectors.
We also identify the macrosectors having experienced a decrease in the number of ICT-educated employees. Again, we point at macrosectors whose cumulative contribution amounts to at least 75% of the overall decrease. These are, in ranked order:
  • NACE: 77–82: Administrative and support service activities;
  • NACE: 49–53: Transportation and storage;
  • NACE 05–09: Mining and quarrying;
  • NACE 29–30: Manufacture of transport equipment.
One should bear in mind that the decrease in ICT-educated people in the “negatively pushing” macrosectors is limited compared to the increase in the “positively pushing” macrosectors. In total, the positive contribution from macrosectors having an increase amounts to 3754, while the negative contribution from macrosectors having a decrease amounts to 412. The latter is a much smaller number and thus more sensitive to idiosyncratic fluctuations. However, we can see that lower-skilled services, along with medium-high tech industries and mining and oil, are sectors with an outflow of ICT-educated people. For the lower-skilled service sectors, this could be expected, since the potential need for ICT-educated people is presumably becoming lower. On the other hand, the decrease registered for medium-high tech industries, as well as for mining and oil, is somewhat surprising. These are sectors presumably strengthening their ICT capabilities. However, the decrease might be a consequence of an overall decrease in the number of employees and thus a consequence of a broader restructuring of the Norwegian economy.
Figure 1 provides us with information as to whether, for each macrosector, the absolute change in ICT-educated employees derives from a high offset, in terms of the initial high number of ICT employees, or from a significant change in the workforce composition. We can see, for instance, that the change for IT and other information services (NACE 62–63) is coming from a high initial number of ICT-educated employees; thus, although the registered increase is the largest in absolute terms, it does not signal the same compositional change as for the health sector (NACE 86).
Both Public administration (NACE 84) and Health (NACE 86) have increased their share of ICT employees, even if the initial share was rather low: for NACE 84, the increase has been from 2.4% to 2.8%, while, for NACE 86, the share has almost doubled from 0.3% to 0.5%. Finally, we can focus on the sectors having a decrease in ICT-educated employees and notice that the decrease is in line with a general decrease in employees, rather than indicating a lower need of high skilled ICT employees.
Table 1 provides additional details about the relation between absolute and relative increases in ICT-educated workers; the numbers result from a particular application of “shift-share” analysis which follows the steps described above in Section 3.2. This table addresses, in a synthetic way, the doubt about which sectors might be absorbing ICT-educated workers because of an increased weight of the sectors in the economy as opposed to an altered skill demand within the sectors. We restrict our attention on the A38 sectors whose cumulative contribution, as previously identified, amounts to at least 75% of, respectively, the overall increase and decrease of ICT-educated workers in the Norwegian economy. When looking at Table 1, a contrast immediately appears between Gi and gi for publishing, audiovisual and broadcasting activities: here, the decreased weight in sectoral employment within the Norwegian economy would have probably driven down the number of ICT-educated employees in the sector if there had not been some substantial change in the skill composition within the sector. The absolute increase in 329 ICT-educated employees in the sector could have been even higher if the overall industry mix in the Norwegian economy had not changed.
Some variation in within-sector skill demand seems to also be an important driver for the increase of ICT-educated employment in human health services, where a minimal proportion of newly employed ICT-educated individuals would be ascribed to education-independent sectoral trends. An opposite picture appears for mining and quarrying, whose decrease in ICT-educated employees seems to result from the decline in sectoral activities without specific educational trends. Finally, public administration and defence constitutes a mixed case, where both an increased overall weight of the sector and an increased demand for ICT skills seem to have driven up the employment of ICT-educated workers.
The data also provide us with the possibility to see how the ICT-educated employees flow between economic sectors: Figure 2 shows all the flows involving more than 50 ICT-educated people between years 2013 and 2017. The green colour is used to highlight nodes, i.e., A38 economic sectors, where the number of ICT-educated employees has increased, while the red colour signals a decrease. The figure shows that IT and other information services have absorbed from many different sectors, but they have also experienced an outflow towards human health activities. Important exchanges are also registered with legal, accounting, management, architecture, engineering, technical testing and analysis activities and with financial and insurance activities (whose intakes are only from IT and other information services). The A38 sector “public administration and defence; compulsory social security” absorbs from many sectors including IT and other information services. In particular, it signals an increasingly important attractor for ICT-educated employees by getting inflows of ICT-educated workers from education activities, publishing, audiovisual and broadcasting activities, transportation and storage services and wholesale and retail trade. The sector wholesale and retail trade indeed represents a sectoral novelty in the ICT labour market, in that it experiences both an outward and an inward flow of ICT-educated employees in connection to IT and other information services and a central position in the depicted network. The presence of such trade activities as attractors of ICT-educated employees might seem surprising at a first glance, but we need to point out that both sectors contain sub-sectors which are closely related to ICT: NACE 46.5 covers “wholesale of information and communication equipment”, whereas NACE 47.4 covers “retail sale of information and communication equipment in specialised stores”. The picture also confirms that IT and other information services constitutes a labour flow hub for ICT-educated people.
Table 2 shows additional details about the labour flows depicted in Figure 2. The table lists, for the sectors contributing most in positive (left panel of Table 2) and negative (right panel) to ICT-educated employment in the Norwegian economy, the outflow and inflow of ICT-educated workers to other sectors, and specifically to the sectors corresponding to highest inflows (left panel) and outflows (right panel) of workers. Table 2 thus provides information about how the ICT-educated allocation across sectors, previously described in Figure 1 and Table 1, results also from between-sector flows of ICT-educated existing workers, as opposed to the recruitment of newly educated ICT experts. At the same time, the table may hint towards novel utilisations of existing ICT skills, pulled by different paces of digitisation across sectors.
The right panel of Table 2, in its first rows, suggests that low-skill administration tasks are progressively digitised, as the outflow of ICT-educated workers from administrative and support service activities to IT and other information services is more than double the corresponding inflow. While the private sector seems to outsource these administration activities, as suggested by the outflow not only to IT and other information services but also to legal, accounting, management, architecture, engineering, technical testing and analysis activities, the public sector seems to absorb them and let them be run in-house, as shown by the outflow to public administration and defence. Notably, the ICT-educated individuals previously working in transportation and storage (also in the right panel) seem to find occupations in trade and in public administration, suggesting that the progressive digitisation of logistics may allow new possibilities for in-sourcing in both private and public sectors.
The left panel of Table 2 also brings forward the strong exchange, in both ways, of ICT-educated workers between IT and other information services and publishing, audiovisual and broadcasting activities. Communication through mass media and internet constitutes a career focus for many ICT-educated, but a clear separation of roles between IT sectors and media sectors, in providing such communication activities, does not seem to exist yet. In contrast, the sector offering human health services has expanded its stock of ICT-educated workers also at the expense of the rest of the economy, by absorbing almost unilaterally workers from a wide range of industries.

4.3. Education Complementarity Evolution

We now turn to the results on education complementarity, specifically to check whether changes in the proportion of ICT-educated employees, between years 2013 and 2017, have typically been accompanied by changes in the proportion of employees having other particular types of education. We conduct the analysis separately for each “A38” sector, that is again one step higher (in the Eurostat data hierarchy) than the two-digit NACE classification: within each sector, the correlation is computed at establishment level between changes in the share of ICT-educated employees (ISCED “06”) and changes in the share of employees for all the other 11 ISCED categories. Table 3 shows directly the last step of the procedures outlines in Section 3.3 and lists, for each A38 sector, the ISCED category which correlates the most with the ISCED “06” (ICT education) category. Some A38 sectors do not appear in the list; this is due to the fact that, in some cases, an increase (decrease) in the share of ICT-educated employees is accompanied only by decreases (increases) in the share of employees educated in any other ISCED category. Notice that such negative correlation in changes “in shares” happens automatically whenever the “absolute” change in ICT-educated employees is not accompanied by any “absolute” change in the rest of the employees: an absolute increase in ICT-educated employees, within an otherwise unmutated establishment, would indeed translate in a lower share of employees in all other education categories. By the same token, we must point out that a positive correlation should be considered always as potentially meaningful, even when its absolute value is very low. We also report, in the final column on the right in Table 3, the number of establishments which, for each A38 sector, have experienced a change in the share of ICT-educated employees: this is particularly useful to explain some “extreme” cases of high correlation in sectors where the number of establishments, on which the correlation is computed, is low.
We can first observe that the ICT-sector (that is 58–63) does not appear in the table, since all ISCED categories correlate negatively with the ICT-education ISCED: the increasing share of ICT personnel in the ICT sector has not typically been accompanied by a relevant increase in other types of education. In other words, the ICT sector seems to have progressively specialised, confining the interaction with other disciplines to inter-firm, or even inter-sector, collaboration. The R&D sector (mainly comprising research institutes but not universities) is characterised by a positive correlation between ICT and humanities, showing an emerging synergy previously observed, for instance, in the media and communication industries. For NACE 86 (Human health activities), the emerging synergy seems instead to be a technological one: the positive correlation of ICT with education in “engineering, manufacturing and construction” appears in a sector that is running through a “digital revolution”. The suggested implication is: ICT skills are needed along with engineering skills to implement new technologies and technical solutions in the health sector. Sectors 69–71, mainly selling knowledge intensive services, exhibit a positive correlation with “education for education”. A possible interpretation might lie in business models combining technology with didactics, to provide value for clients in a learning/technology perspective. Finally, the result for the education sector (85) (mainly consisting of universities) seems to point at the progressive effort of Norway, as a country, towards a future where both digitisation and bioeconomy are essential economic themes.

5. Conclusions

By using data on intersectoral labour flows and establishment-level employment composition (years 2013–2017), we studied the recent evolution of ICT-educated people in the Norwegian economy. The public sectors appear to be an increasingly important attractor of ICT-educated people. Indeed, the public administration is undergoing a process of digitisation, which makes it provide attractive job positions also for ICT workers previously employed in other sectors, including ICT industries and universities. The universities themselves constitute an important source of employment, together with the health sector where the ongoing digitisation is promoting the complementarity between ICT experts and engineers. The ICT industries still represent the destination for many ICT-educated individuals, but they are not exempt from evolution: they are getting even more specialised in ICT, possibly as outsourcees of services to other industries. However, some employees from the ICT industries are flowing from and to the sales sector, in line with the increased knowledge intensity of sales already observed in other countries.
When relating our empirical results to the existing literature, we gain additional insights. On the one hand, a structural change seems to be occurring in the media and publishing industry, where our shift-share analysis shows an education mix which evolves in favour of the ICT-educated employment. New tasks in the economic activities of the industry might be the explanation, although the overall decrease of employment in the industry also confirms some substitution of labour brought by digitisation. The two directions of change detected here are consistent with the task-based framework by Acemoglu and Restrepo [15], where new, more complex forms of existing tasks can, at least partially, compensate for negative influences of technology on employment. Substitution of labour appears more prominently in both transportation and administrative industries, which suffer from a general employment decrease. This should not be surprising, since the existing literature (e.g., [9]) has shown that low- and medium-skill tasks, in both industries, can often be substituted through digitisation. However, our data also show that the transportation industry absorbs ICT-educated individuals from the ICT-specific sector, while a flow in the opposite direction characterises administrative and support services. This difference seems to suggest that routinised tasks in administrative services often call for novel outsourcing from standardised external ICT services. Instead, logistic intelligence in transportation, identified by Hirsch-Kreinsen [8] as a promising application area for smart systems, would make space for customised ICT work to be operated in-house. Notably, the increased employment for some knowledge-intensive business services, including specialised accountancy firms and concerning not only ICT-educated employees, signals that there may still be room for accountants in a data-rich world, as predicted by Richins et al. [14]. The increasing specialisation of the ICT sector, which is absorbing ICT-educated individuals from other sectors but does not relate to an increase in other specific forms of education, suggests that the progressive outsourcing of ICT services promotes education complementarities across firms and industries but not within single establishments. This is not the case for other sectors: complementarities appear between ICT and engineering educations, signalling the need for a joint expertise on software and hardware in health organisations. Taken together, these results suggest that changes in the job content, in times of digitisation, may occur also through novel education complementarities, adding to the existing literature which has instead focussed on adaptations within education programmes (see, e.g., [37]). Interestingly, the complementarities which might most characterise the future, shown by, respectively, the R&D and the university sectors, seem to associate ICT education with human disciplines and with sciences associated to sustainability and bioeconomy.
From a policy perspective, the results have several possible implications and open additional questions. One concerns the reallocation of skills. Is the rise and fall of different sectors a natural and wanted development? If not, there could be a need for policy intervention to remedy unwanted developments. Secondly, the observed labour flows between sectors can reveal new arenas for inter-industry collaborations, supporting the transition of the economy towards desired policy goals. This can add valuable information for developing the research and innovation policy mix. Western countries are facing wanted transitions of their economy but with their policy mix may sometimes support the industries of yesterday rather than of tomorrow. The flow of high-level skills across sectors can point out new work structures that redefine traditional industry divisions. Their observation can be highly relevant in designing new policies supporting innovation and transitions, since it provides information on target groups, potential networks and thus a foundation for what kind of measures that should be applied.
Our empirical analysis suffers from two main limitations. On the one hand, we did not use data about the specific occupations of the employees in each establishment. Especially because our research revolves around skills and tasks of ICT-educated individuals, having additional information about occupations would definitely help to extend our work. However, most of the previous literature on skill-relatedness has been developed without access to important variables and in particular to education data; therefore, our attempt to increase the empirical range, with respect to a large set of the previous literature, is already pioneering in some respects. Unfortunately, our work still struggles in assessing the potential misallocation of talents, when ICT-educated individuals enter some sectors of the economy.
A second important limitation derives from the fact that information and communication technologies have seen massive and rapid advances since at least the last 40 years. Therefore, an ICT education today is not the same as an ICT education yesterday. Using an age threshold would, in some countries, be a good way to deal with this issue; however, in Norway, there have been several attempts to incentivize a life-long education, and therefore to use an age limit and isolate a cohort of people would not necessarily isolate also a more updated type of education. A possible methodological solution could consist in defining employee cohorts in terms of education degree date, i.e., looking at the time where the highest education degree has been obtained by each person. For instance, a cohort could comprise all people who got their highest degree within the last 10 years. Doing this analysis, however, would entail a whole new series of research questions, which would dramatically enlarge the scope of our study.
We envision two possible paths for further research. A first one concerns investigating the labour outcomes for those types of education which are not explicitly designed for specific jobs. Especially for humanistic study plans, e.g., for philosophy or history education, the identification of cross-sectoral skills from education, to be employed in specific parts of the economy, would be an interesting research topic. A second path for future research deals with methodological advances, to solve a related research question, about which types of education best provide a specific cross-sectoral skill. Given the increasing interest in defining skills which would help solve specific social and environmental challenges (see, for instance, the ongoing research about “green” skills), a methodology could depart from an observation of the labour flows in the economy to suggest variations in the existing education supply.

Author Contributions

Conceptualisation, M.C. and M.S.M.; Methodology, M.C. and M.S.M.; Software, M.C.; Validation, M.C. and M.S.M.; Formal Analysis, M.C.; Investigation, M.C. and M.S.M.; Resources, M.C. and M.S.M.; Data Curation, M.C.; Writing—Original Draft Preparation, M.C. and M.S.M.; Writing—Review and Editing, M.C. and M.S.M.; Visualisation, M.C.; Supervision, M.S.M.; Project Administration, M.C. and M.S.M.; Funding Acquisition, M.S.M. Both authors have read and agreed to the published version of the manuscript.

Funding

This research was funded by the Research Council of Norway (projects 157184/F40 and 194717/D00).

Data Availability Statement

The study uses anonymized microdata from Statistics Norway (see References below). A complete list of the microdata available at Statistics Norway can be found at https://www.ssb.no/data-til-forskning/utlan-av-data-til-forskere/variabellister (accessed on 31 May 2021). The procedures to access microdata from Statistics Norway are described at https://www.ssb.no/en/data-til-forskning/utlan-av-data-til-forskere (accessed on 1 January 2021).

Acknowledgments

The authors would like to thank Sotirios Blanas, Ekaterina Denisova, Eric Iversen, Tore Sandven, Francesco Serti, Asgeir Skålholt and all the participants to the Workshop on Technology and the Labour Market held in Lucca (Italy) on 17–18 December 2020 for useful comments and suggestions. The responsibility for any error and the views expressed are solely of the authors.

Conflicts of Interest

The authors declare no conflict of interest. The views expressed are those solely of the authors and should not in any circumstances be regarded as stating an official position of the Research Council of Norway.

References

  1. Nambisan, S.; Wright, M.; Feldman, M. The digital transformation of innovation and entrepreneurship: Progress, challenges and key themes. Res. Policy 2019, 48, 103773. [Google Scholar] [CrossRef]
  2. Brynjolfsson, E.; McAfee, A. The Second Machine Age; W. W. Northon & Company Inc.: New York, NY, USA, 2016. [Google Scholar]
  3. Pieri, F.; Vecchi, M.; Venturini, F. Modelling the joint impact of R&D and ICT on productivity: A frontier analysis approach. Res. Policy 2018, 47, 1842–1852. [Google Scholar]
  4. Eggen, F.W.; Mark, M.S.; Røtnes, R. Bidraget fra IKT til produktivitetsveksten i Norge. In Samfunnsøkonomisk Analyse Rapport 30-2015; Samfunnsøkonomisk Analyse: Oslo, Norway, 2015. [Google Scholar]
  5. Hall, B.H.; Lotti, F.; Mairesse, J. Evidence on the impact of R&D and ICT investments on innovation and productivity in Italian firms. Econ. Innov. New Technol. 2012, 22, 300–328. [Google Scholar]
  6. Mark, M.S.; Tømte, C.E.; Næss, T.; Røsdal, T. Leaving the windows open – Økt mangel på IKT-sikkerhetskompetanse i Norge [Increased lack of ICT-security expertise in Norway]. Nor. Sosiol. Tidsskr. 2019, 3, 173–190. [Google Scholar] [CrossRef] [Green Version]
  7. Hirschi, A. The fourth industrial revolution: Issues and implications for career research and practice. Career Dev. Q. 2018, 66, 192–204. [Google Scholar] [CrossRef]
  8. Hirsch-Kreinsen, H. Digitization of industrial work: Development paths and prospects. J. Labour Mark. Res. 2016, 49, 1–14. [Google Scholar] [CrossRef] [Green Version]
  9. Dengler, K.; Matthes, B. The impacts of digital transformation on the labour market: Substitution potentials of occupations in Germany. Technol. Forecast. Soc. Chang. 2018, 137, 304–316. [Google Scholar] [CrossRef]
  10. Calvino, F.; Virgillito, M.E. The innovation-employment nexus: A critical survey of theory and empirics. J. Econ. Surv. 2018, 32, 83–117. [Google Scholar] [CrossRef] [Green Version]
  11. Piva, M.; Vivarelli, M. Technological change and employment: Is Europe ready for the challenge? Eurasian Bus. Rev. 2018, 8, 13–32. [Google Scholar] [CrossRef]
  12. Borland, J.; Coelli, M. Are robots taking our jobs? Aust. Econ. Rev. 2017, 50, 377–397. [Google Scholar] [CrossRef]
  13. Biagi, F.; Naticchioni, P.; Ragusa, G.; Vittori, C. Routinization and the Labour Market: Evidence from European Countries. In Digitized Labor; Palgrave Macmillan: London, UK, 2018; pp. 51–69. [Google Scholar]
  14. Richins, G.; Stapleton, A.; Stratopoulos, T.C.; Wong, C. Big data analytics: Opportunity or threat for the accounting profession? J. Inf. Syst. 2017, 31, 63–79. [Google Scholar] [CrossRef]
  15. Acemoglu, D.; Restrepo, P. The race between man and machine: Implications of technology for growth, factor shares, and employment. Am. Econ. Rev. 2018, 108, 1488–1542. [Google Scholar] [CrossRef] [Green Version]
  16. Frank, M.R.; Autor, D.; Bessen, J.E.; Brynjolfsson, E.; Cebrian, M.; Deming, D.J.; Feldman, M.; Groh, M.; Lobo, J.; Moro, E.; et al. Toward understanding the impact of artificial intelligence on labor. Proc. Natl. Acad. Sci. USA 2019, 116, 6531–6539. [Google Scholar] [CrossRef] [Green Version]
  17. Ernst, E.; Merola, R.; Samaan, D. Economics of artificial intelligence: Implications for the future of work. IZA J. Labor Policy 2019, 9, 1–35. [Google Scholar] [CrossRef] [Green Version]
  18. Lent, R.W. Future of work in the digital world: Preparing for instability and opportunity. Career Dev. Q. 2018, 66, 205–219. [Google Scholar] [CrossRef]
  19. Arntz, M.; Gregory, T.; Zierahn, U. The risk of automation for jobs in OECD countries: A comparative analysis. In OECD Social, Employment and Migration Working Papers 189; Organisation for Economic Co-operation and Development: Paris, France, 2016. [Google Scholar]
  20. Palan, N.; Schober, A. The Need for (Increased) ICT Skills in the Era of Digitalization. In IT and the Development of Digital Skills and Competences in Education; IGI Global: Hershey, PA, USA, 2021; pp. 34–55. [Google Scholar]
  21. Schweitzer, F.; Fagiolo, G.; Sornette, D.; Vega-Redondo, F.; Vespignani, A.; White, D.R. Economic networks: The new challenges. Science 2009, 325, 422–425. [Google Scholar] [CrossRef]
  22. Hidalgo, C.A.; Hausmann, R. The building blocks of economic complexity. Proc. Natl. Acad. Sci. USA 2009, 106, 10570–10575. [Google Scholar] [CrossRef] [Green Version]
  23. Hausmann, R.; Hidalgo, C.A. The network structure of economic output. J. Econ. Growth 2011, 16, 309–342. [Google Scholar] [CrossRef] [Green Version]
  24. Hidalgo, C.A.; Klinger, B.; Barabási, A.L.; Hausmann, R. The product space conditions the development of nations. Science 2007, 317, 482–487. [Google Scholar] [CrossRef] [PubMed] [Green Version]
  25. Neffke, F.; Henning, M. Skill relatedness and firm diversification. Strateg. Manag. J. 2013, 34, 297–316. [Google Scholar] [CrossRef] [Green Version]
  26. Castellacci, F. Technological paradigms, regimes and trajectories: Manufacturing and service industries in a new taxonomy of sectoral patterns of innovation. Res. Policy 2008, 37, 978–994. [Google Scholar] [CrossRef] [Green Version]
  27. Pavitt, K. Sectoral patterns of technical change: Towards a taxonomy and a theory. Res. Policy 1984, 13, 343–373. [Google Scholar] [CrossRef]
  28. Costa, L.d.F.; Oliveira, O.N., Jr.; Travieso, G.; Rodrigues, F.A.; Villas Boas, P.R.; Antiqueira, L.; Viana, M.P.; Correa Rocha, L.E. Analyzing and modeling real-world phenomena with complex networks: A survey of applications. Adv. Phys. 2011, 60, 329–412. [Google Scholar] [CrossRef] [Green Version]
  29. Xu, M.; Liang, S. Input–output networks offer new insights of economic structure. Phys. A Stat. Mech. Its Appl. 2019, 527, 121178. [Google Scholar] [CrossRef]
  30. Frenken, K.; Van Oort, F.; Verburg, T. Related variety, unrelated variety and regional economic growth. Reg. Stud. 2007, 41, 685–697. [Google Scholar] [CrossRef] [Green Version]
  31. Boschma, R.; Frenken, K. The emerging empirics of evolutionary economic geography. J. Econ. Geogr. 2011, 11, 295–307. [Google Scholar] [CrossRef] [Green Version]
  32. Neffke, F.; Otto, A.; Weyh, A. Inter-industry labor flows. J. Econ. Behav. Organ. 2017, 142, 275–292. [Google Scholar] [CrossRef] [Green Version]
  33. Fitjar, R.D.; Timmermans, B. Relatedness and the Resource Curse: Is There a Liability of Relatedness? Econ. Geogr. 2019, 95, 231–255. [Google Scholar] [CrossRef]
  34. Neffke, F. The value of complementary co-workers. Sci. Adv. 2019, 5, eaax3370. [Google Scholar] [CrossRef] [Green Version]
  35. Alabdulkareem, A.; Frank, M.R.; Sun, L.; AlShebli, B.; Hidalgo, C.; Rahwan, I. Unpacking the polarization of workplace skills. Sci. Adv. 2018, 4, eaao6030. [Google Scholar] [CrossRef] [Green Version]
  36. Burger, M.; Stavropoulos, S.; Ramkumar, S.; Dufourmont, J.; van Oort, F. The heterogeneous skill-base of circular economy employment. Res. Policy 2019, 48, 248–261. [Google Scholar] [CrossRef]
  37. Consoli, D.; Marin, G.; Rentocchini, F.; Vona, F. Routinization, Within-Occupation Task Changes and Long-Run Employment Dynamics. In LEM Working Paper 2019/15; Scuola Superiore Sant’Anna: Pisa, Italy, 2019. [Google Scholar]
  38. Vona, F.; Consoli, D. Innovation and skill dynamics: A life-cycle approach. Ind. Corp. Chang. 2015, 24, 1393–1415. [Google Scholar] [CrossRef]
  39. Barbieri, N.; Consoli, D. Regional diversification and green employment in US metropolitan areas. Res. Policy 2019, 48, 693–705. [Google Scholar] [CrossRef] [Green Version]
  40. Nania, J.; Bonella, H.; Restuccia, D.; Taska, B. No Longer Optional: Employer Demand for Digital Skills; Report; Burning Glass Technologies: Boston, MA, USA, 2019. [Google Scholar]
  41. Fitjar, R.D.; Timmermans, B. Knowledge bases and relatedness: A study of labour mobility in Norwegian regions. In New Avenues for Regional Innovation Systems-Theoretical Advances, Empirical Cases and Policy Lessons; Springer: Berlin/Heidelberg, Germany, 2018; pp. 149–171. [Google Scholar]
  42. UNESCO. International Standard Classification of Education Fields of Education and Training 2013 (ISCED-F 2013): Detailed Field Descriptions; UNESCO-UIS Publication, UNESCO Institute for Statistics: Montreal, QC, Canada, 2015. [Google Scholar] [CrossRef]
  43. European Commission. European System of Accounts-ESA 2010; Technical Report; Publications Office of the European Union: Luxembourg, 2013. [Google Scholar] [CrossRef]
  44. Dunn, E.S. A statistical and analytical technique for regional analysis. Pap. Reg. Sci. 1960, 6, 97–112. [Google Scholar] [CrossRef]
  45. Giannakis, E.; Bruggeman, A. Economic crisis and regional resilience: Evidence from Greece. Pap. Reg. Sci. 2017, 96, 451–476. [Google Scholar] [CrossRef]
  46. Fitjar, R.D.; Timmermans, B. Regional skill relatedness: Towards a new measure of regional related diversification. Eur. Plan. Stud. 2017, 25, 516–538. [Google Scholar] [CrossRef]
  47. Statistics Norway [dataset]. Firm-Linked AA-Data: Full Count Register Data of Employees at all Norwegian Firms (2008–2014); Statistics Norway: Oslo, Norway, 2017. [Google Scholar]
  48. Statistics Norway [dataset]. Firm-Linked “A-Ordningen” Data: Data on the Connection between People and Labour Market; Statistics Norway: Oslo, Norway, 2019. [Google Scholar]
  49. Statistics Norway [dataset]. Education (“utdanning”) Data: Data on Education Level and Field; Statistics Norway: Oslo, Norway, 2018. [Google Scholar]
Figure 1. Percentage increase of ICT-educated employees per A38 sector (years 2013–2017).
Sustainability 13 08476 g001
Figure 2. Flows of ICT-educated employees between years 2013 and 2017 (only flows of at least 50 employees are shown). The green and red colours indicate, respectively, an increase and a decrease in ICT-educated employees in the corresponding A38 economic sector. A larger node size corresponds to a higher total number of employees in the sector, independently of the employees’ education.
Sustainability 13 08476 g002
Table 1. Shift-share analysis. (Top) (Rows 2–6) A38 sectors giving the highest positive push to the employment of ICT-educated individuals (as defined in Section 4.2). (Bottom) (Rows 7–10) A38 sectors giving the highest negative push to the employment of ICT-educated individuals (as defined in Section 4.2).
A38 SectorG G i g i e i t e i t + n e i t + n e i t N S i I M i E S i
IT and other information services1.616.316.9960611,2341628151141958
Public administration and defence, compulsory social security1.69.128.237174767105059279712
Human health services1.65.290.858411145301021499
Publishing, audiovisual and broadcasting activities1.6−7.314.92204253332935−196490
Legal, accounting, management, architecture, engineering…1.64.816.0155318012482550173
Administrative and support service activities1.6−9.6−14.018661604−26229−208−83
Transportation and storage services1.6−3.0−5.228212673−14844−128−64
Mining and quarrying1.6−16.0−15.3848718−13013−1496
Manufacture of transport equipment1.6−-26.2−30.3379264−1156−105−16
Table 2. The left panel of the table (first three columns) shows, in bold, the A38 sectors giving the highest positive push to the employment of ICT-educated individuals (as defined in Section 4.2); the table shows (not in bold, first column) the five sectors having highest outflow towards each of them (third column). The right panel of the table (last three columns) shows, in bold, the A38 sectors giving the highest negative push to the employment of ICT-educated individuals (as defined in Section 4.2); the table shows (not in bold, fourth column) the five sectors having highest inflow from each of them (fifth column).
Top Positive Push Top Negative Push
IT and other information servicesGiving:Receiving: administrative and support serviceGiving:Receiving:
publishing, audiovisual and…387344 IT and other information services26699
wholesale and retail trade165333 wholesale and retail trade10858
administrative and support service…99266 public administration and defence…10624
education78184 legal, accounting, management…5025
finance and insurance205177 finance and insurance4422
public administration and defence…Giving:Receiving: transportation and storage servicesGiving:Receiving:
IT and other information services100403 wholesale and retail trade6155
administrative and support service…24106 public administration and defence…5818
education36101 IT and other information services5271
wholesale and retail trade30100 administrative and support service…3337
transportation and storage services1858 construction3213
human health servicesGiving:Receiving: mining and quarryingGiving:Receiving:
IT and other information services11330 IT and other information services4320
administrative and support service…736 legal, accounting, management…1519
wholesale and retail trade731 wholesale and retail trade134
residential care and social work…1929 public administration and defence…111
public administration and defence…2224 administrative and support service…811
publishing, audiovisual and…Giving:Receiving: manufacture of transport equipmentGiving:Receiving:
IT and other information services344387 IT and other information services247
wholesale and retail trade4058 metallurgy161
administrative and support service…2743 mining and quarrying112
education1740 legal, accounting, management…106
legal, accounting, management…5636 public administration and defence…91
legal, accounting, management…Giving:Receiving:
IT and other information services141191
wholesale and retail trade3965
publishing, audiovisual and…3656
administrative and support service…2550
education1532
Table 3. Highest correlation (Column 5) between changes in the share of ICT-educated employees and changes in the share of employees educated in another ISCED education category, at establishment level for each A38 sector (Column 1). Column 2 reports the A88 2-digit sectoral components of the A38 sector. Columns 3–4 report the ISCED category associated to the highest correlation. Column 6 reports the number of establishments, in the given A38 sector, which have experienced a change in the share of ICT-educated employees (i.e., the number of establishments on which the correlation in Column 5 is computed).
A38 SectorNACE ISCEDISCED Name CorrelationNo. Establ.
Agriculture, forestry and fishing01–03 9Health and welfare 0.03102
Mining and quarrying05–09 3Social sciences, journalism and information 0.02153
Manufacture of food products, beverages…10–12 1Education 0.01255
Manufacture of textiles, wearing apparel…13–15 3Social sciences, journalism and information 0.0528
Manufacture of wood and paper products…16–18 3Social sciences, journalism and information 0.03154
Manufacture of coke and refined petroleum…19 10Services 1.002
Manufacture of chemicals and chemical…20 8Agriculture, forestry, fisheries and veterinary 0.2952
Manufacture of basic pharmaceutical…21 1Education 0.6910
Manufacture of rubber and plastics products…22–23 8Agriculture, forestry, fisheries and veterinary 0.02113
Manufacture of basic metals and fabricated…24–25 1Education 0.05145
Manufacture of computer, electronic and…26 4Business, administration and law 0.2285
Manufacture of electrical equipment27 0Generic programmes and qualifications 0.0264
Manufacture of machinery and equipment…28 1Education 0.03105
Manufacture of transport equipment29–30 8Agriculture, forestry, fisheries and veterinary 0.0375
Other manufacturing; repair and installation…31–33 3Social sciences, journalism and information 0.02132
Electricity, gas, steam and air-conditioning…35 2Arts and humanities 0.11146
Water supply; sewerage, waste…36–39 9Health and welfare 0.04117
Accommodation and food service…55–56 3Social sciences, journalism and information 0.01339
Financial and insurance activities64–66 10Services 0.01379
Legal, accounting, management…69–71 1Education 0.00795
Scientific research and development72 2Arts and humanities 0.06100
Public administration and defence…84 5Natural sciences, mathematics and statistics 0.011124
Education85 8Agriculture, forestry, fisheries and veterinary 0.00892
Human health activities86 7Engineering, manufacturing and construction 0.01364
Residential care and social work activities87–88 8Agriculture, forestry, fisheries and veterinary 0.001117
Arts, entertainment and recreation90–93 8Agriculture, forestry, fisheries and veterinary 0.01261
Other service activities94–96 8Agriculture, forestry, fisheries and veterinary 0.02279
Publisher’s Note: MDPI stays neutral with regard to jurisdictional claims in published maps and institutional affiliations.

