Review

The Influence of COVID-19 on Global CO2 Emissions and Climate Change: A Perspective from Malaysia

1
Institute of Sustainable Energy (ISE), Universiti Tenaga Nasional (UNITEN), Jalan IKRAM-UNITEN, Kajang 43000, Malaysia
2
Department of Chemical and Environmental Engineering, Faculty of Science and Engineering, University of Nottingham Malaysia, Semenyih 43500, Malaysia
*
Author to whom correspondence should be addressed.
Sustainability 2021, 13(15), 8461; https://doi.org/10.3390/su13158461
Submission received: 10 June 2021 / Revised: 23 July 2021 / Accepted: 23 July 2021 / Published: 29 July 2021
(This article belongs to the Special Issue Energy Development for Sustainability)

Abstract

:
The rapid spread of coronavirus disease 2019 (COVID-19) in early 2020 prompted a global lockdown from March to July 2020. Due to strict lockdown measures, many countries experienced economic downturns, negatively affecting many industries including energy, manufacturing, agriculture, finance, healthcare, food, education, tourism, and sports. Despite this, the COVID-19 pandemic provided a rare opportunity to observe the impacts of worldwide lockdown on global carbon dioxide (CO2) emissions and climate change. Being the main greenhouse gas responsible for rising global surface temperature, CO2 is released to the atmosphere primarily by burning fossil fuels. Compared to 2019, CO2 emissions for the world and Malaysia decreased significantly by 4.02% (−1365.83 MtCO2) and 9.7% (−225.97 MtCO2) in 2020. However, this is insufficient to cause long-term impacts on global CO2 levels and climate change. Therefore, in this review, we explored the effects of worldwide lockdown on global CO2 levels, the impacts of national lockdown on Malaysia’s CO2 emissions, and the influence of climate change in Malaysia.

1. Introduction

Coronavirus disease 2019 (COVID-19) is the first worldwide pandemic caused by a coronavirus. Since the first confirmed case was found in China, the novel coronavirus has evolved and spread rapidly to many countries around the world [1]. This onset of COVID-19 health pandemic in early 2020 has seen a new global recession bringing about adverse impacts on economies and labour markets. The global gross domestic product (GDP) in 2020 is expected to decline by 3.9%, whereas China’s GDP loss may hit 4.3% [2]. The COVID-19 pandemic has negatively affected many industries such as energy, manufacturing, agriculture, finance, healthcare, food, education, tourism, and sports [3]. The drastic lockdown measures implemented to curb the rapid spread of COVID-19, which included social distancing, minimum travelling, banning of gatherings, and border closures, have decreased the oil demand in many countries. These measures, coupled with the Saudi–Russia oil price war, have lowered the global greenhouse gas (GHG) emissions, but this phenomenon is only temporary [3]. In March to July 2020, strict lockdown measures were enforced by many countries around the world, but after the lockdown was lifted, the global CO2 emissions increased quickly due to the partial startup of the economy, especially in China and some European countries [4].
The primary cause of rising global temperatures is the release of carbon dioxide (CO2) from burning coal, oil, and natural gas [5]. There are two primary factors affecting CO2 concentration in the atmosphere: (i) the natural carbon cycle whereby carbon is exchanged between the atmosphere and the Earth, and (ii) anthropogenic CO2 emissions to the atmosphere via the combustion of fossil fuels [6,7]. In 2020, natural gas and coal remain the top two energy sources used for electricity generation in the Organisation for Economic Co-operation and Development (OECD) countries, having shares of 29.5% and 19.2%, respectively [8]. Given that fossil fuels are currently still the main energy source for many countries and fossil fuel power plants will continue operation until net zero in the global energy sector is achieved by 2050 [9], it is important to fund research in raising the efficiencies and dropping CO2 emissions of existing modern gas- and coal-fired power plants [10,11,12]. At the same time, it is also crucial to fund research in renewable energy as electricity production from renewables in the OECD increased by 7.5% (228.8 TWh) in 2020 compared to 2019. Solar, wind, and hydropower recorded significant increments of 20.2% (73.0 TWh), 11.5% (95.0 TWh), and 3.5% (52.3 TWh), generating 4.2%, 8.9%, and 15.0% of total electricity in 2020, respectively [8]. Following the COVID-19 pandemic, the global natural gas consumption and the global demand for coal to generate electricity declined by 4% and 3.3% in 2020 compared to 2019 [13,14]. A mild winter in the northern hemisphere in early 2020 and the global lockdown during the first half of 2020 negatively affected all major gas markets, except for China where growth was sluggish at best [13]. The greatest reduction in coal-fired electricity production was in the European Union (−19%, −111 TWh) and the United States of America (U.S.A.) (−14%, −196 TWh) [14]. The reduction in demand for fossil fuels due to the global lockdown, together with the increase in utilization of renewables, 2020 saw an overall decrease in CO2 emissions of 4.02% (−1365.83 MtCO2) [15]. According to a June 2020 report by the United Nations Environment Program (UNEP), the slowdown caused by COVID-19 pandemic in the fossil fuel industry has made investments in renewable energy more cost-effective than before. The reduction in cost for renewable energy is mainly attributed to better technologies, improved production at scale, and more experienced renewable developers [16].
In the search for alternatives to fossil fuels, the concept of bioeconomy was proposed. A bioeconomy, or biobased economy, can be described as an economy where the raw materials for manufacturing, chemicals, and energy are obtained from renewable biological sources [17]. Not only is the transition from fossil-based to biobased economy essential for stopping climate change, but also important for resolving current issues surrounding health, food security, industrial restructuring, and energy security [18,19]. So far, the driving force for the development of bioeconomy worldwide has been the societal transition towards circular and low-carbon economies, which are based on the potential of providing green biofuels. The continuous backing of low-carbon technologies should be coupled with policies to gradually phase out fossil fuels. The COVID-19 pandemic, however, revealed a much wider role that bioeconomy can have to diversify supplies for food, feed, and raw materials. Views and new knowledge on a fresh perspective for future sustainable development and operation of biobased value chains are needed. The integration of renewable energy (solar, wind, hydro, geothermal, and biomass) with CO2 utilization and carbon recycling (C-recycling) is the way forward for the circular carbon economy. C-recycling is the construction of an artificial carbon cycle, which can be combined with the natural cycle, to enhance the rate of CO2 sequestration and increase the selectivity of end-products that are currently produced by fossil sources [20]. Liu et al. (2020) and Sikarwar et al. (2021) published comprehensive articles detailing the impacts of global lockdown due to the COVID-19 pandemic on global CO2 emissions and the different sectors (such as power, transportation, industry, aviation, commercial, and residential) in major countries [4,21]. Naderipour et al. compiled the impacts of COVID-19 on solar energy generation and the relation between energy consumption (1973–2019) and GHG emissions (2008–2019) in Malaysia [22]. Yusup et al. analysed and compared the monthly differences in atmospheric CO2 concentration for the world and Malaysia from 2018–2020 (from November to May of each year) [23]. To the best of our knowledge, no journal article has described the effects of COVID-19-related lockdown on daily CO2 emissions in Malaysia.
Therefore, in this review, we discuss how worldwide lockdown due to the COVID-19 pandemic significantly reduced global CO2 emissions. We also discuss the impacts of national lockdown in Malaysia on its daily CO2 emissions in 2020 together with the influence of climate change on various sectors in Malaysia.

2. Overview of Greenhouse Gases

In 1896, Svante Arrhenius (1859–1927), a Swedish scientist, was the first to relate the effect of atmospheric CO2 levels on Earth’s temperature. He observed that the infrared absorption ability of water vapour and CO2 had kept Earth’s mean surface temperature at a comfortable 15 °C. This phenomenon is known as the natural greenhouse effect. Arrhenius calculated that a two-fold increase in CO2 level would increase temperature by 5 °C [24]. Around the same time, Thomas Chamberlin (1843–1928), an American geologist, suggested that large alterations on Earth’s climate could be caused by variations in CO2 levels. Both Arrhenius and Chamberlin concluded that the combustion of fossil fuels released CO2 to the atmosphere, thereby warming the Earth [24].
Now, scientists have concluded with high confidence that human activities in the last five decades have warmed the Earth. The industrial activities that support our technologically advanced world have elevated atmospheric CO2 concentrations from 280 ppm to 414 ppm in the past 150 years, and concentrations continue to rise [25]. This marks a 47% rise in CO2 level compared to the start of the Industrial Revolution (about 280 ppm) and an 11% rise compared to the year 2000 (about 370 ppm) [26]. CO2 and water vapour, together with methane (CH4) and nitrous oxide (N2O), are the primary GHGs that heat the Earth’s atmosphere. GHGs function by absorbing energy from sunlight, which heats the atmosphere and Earth’s surface. Water vapour and clouds contribute the most to the greenhouse effect (about 75%). Noncondensing GHGs make up the remainder, with CO2 and CH4 accounting for about 24%, whereas N2O and ozone (O3) cover the remaining 1%. At temperatures and pressures similar to Earth’s surface, water vapour and clouds behave as feedbacks of the greenhouse effect, whereas noncondensing GHGs are the drivers that influence the intensity of the greenhouse effect [27,28]. The noncondensable nature of the smaller group of GHGs (CO2, CH4, N2O, and O3) means that larger amounts of these gases can be accumulated in the atmosphere, thereby increasing the strength of the greenhouse effect [29]. Although there are other greenhouse gases, CO2 receives the most attention because of two main reasons: (1) All other noncondensing GHGs together contribute only around one third of the total global warming potential, as their concentration in the atmosphere is very low compared to CO2, and (2) CO2 remains in the atmosphere longer than other GHGs. The time needed for CH4 to leave the atmosphere is one decade, while N2O is around one century. In contrast, 70% of emitted CO2 will stay in the atmosphere for 100 years, 20% will stay for 1000 years, and the remaining 10% will stay for 10,000 years [30]. This long lifespan of CO2 in the atmosphere makes it the most critical gas when tackling the issues of climate change.
Naturally, CO2 is also generated in the atmosphere in the natural carbon cycle, but the carbon cycle maintains the balance of carbon in the atmosphere, on land, and in the ocean. In other words, the concentration of carbon in the atmosphere, land, plants, and oceans are kept relatively constant. Despite this, the carbon cycle has been altered following changes in climate. Shifts in Earth’s orbit occur continuously and in predictable cycles, varying the amount of energy Earth acquires from the Sun. This results in a cycle of warm periods and ice ages on Earth. When summers in the Northern Hemisphere become colder, ice accumulates on land and the carbon cycle slows. At the same time, several factors such as lower temperature and higher phytoplankton growth rate likely enhance the absorption of atmospheric carbon into the ocean. The reduction in atmospheric carbon further cools the Earth. Likewise, when the last Ice Age ended about 10,000 years ago, CO2 concentrations in the atmosphere climbed rapidly as Earth’s temperatures rose [31,32,33].
Detailed analyses have been performed on air trapped in ice cores taken from Antarctica, and results have shown that for the past 800,000 years, CO2 levels in the atmosphere had only fluctuated between 170 and 210 ppm [34]. Presently, the CO2 level in the atmosphere is approaching 414 ppm, double that of the past 800,000 years. This rise in atmospheric CO2 levels is due to the combustion of fossil fuels. The carbon released from combusting fossil fuels contains a different ratio of heavy-to-light carbon atoms. This produces a distinct “fingerprint” that can be quantified as (i) burning fossil fuel causes a relative decrease in the concentration of heavy carbon-13 atoms (13C) in the atmosphere, and (ii) burning fossil fuels reduces the ratio of oxygen to nitrogen in the atmosphere [26]. There are three different isotopes for carbon, which are carbon-12 (12C), carbon-13 (13C), and carbon-14 (14C). The most common is 12C, while 13C makes up around 1% of the total and 14C only accounts for around one in one trillion carbon atoms. Plants and fossil fuels (ultimately derived from ancient plants) all contain a similar 13C/12C ratio. The 13C/12C ratio in the atmosphere is 2% higher than in plants (and hence fossil fuels). When the carbon from fossil fuels is liberated into the atmosphere, the average atmospheric 13C/12C ratio decreases [26].
One way to reduce CO2 emissions is the substitution of fossil fuels with biomass-derived biofuels. Although utilizing biomass-derived biofuels also emit CO2, the benefit of biomass-derived biofuels is that the combustion of biofuels discharges carbon which is part of the natural carbon cycle. In contrast, the combustion of fossil fuels discharges carbon which was previously kept in the ground for millions of years, adding more carbon into Earth’s biosphere [35]. The additional carbon from burning fossil fuels is primarily responsible for global warming. To mitigate this, it is imperative that the global energy industry switches to biofuels and renewable energies, and reduces the dependence on fossil fuels. To this end, the implementation of renewable energy has been growing globally. For instance, the global electricity production from renewables was 27% in 2019 and 29% in 2020. In the midst of the COVID-19 pandemic in 2020, renewable energy usage increased by 3% while demand for fossil fuels dropped [36].

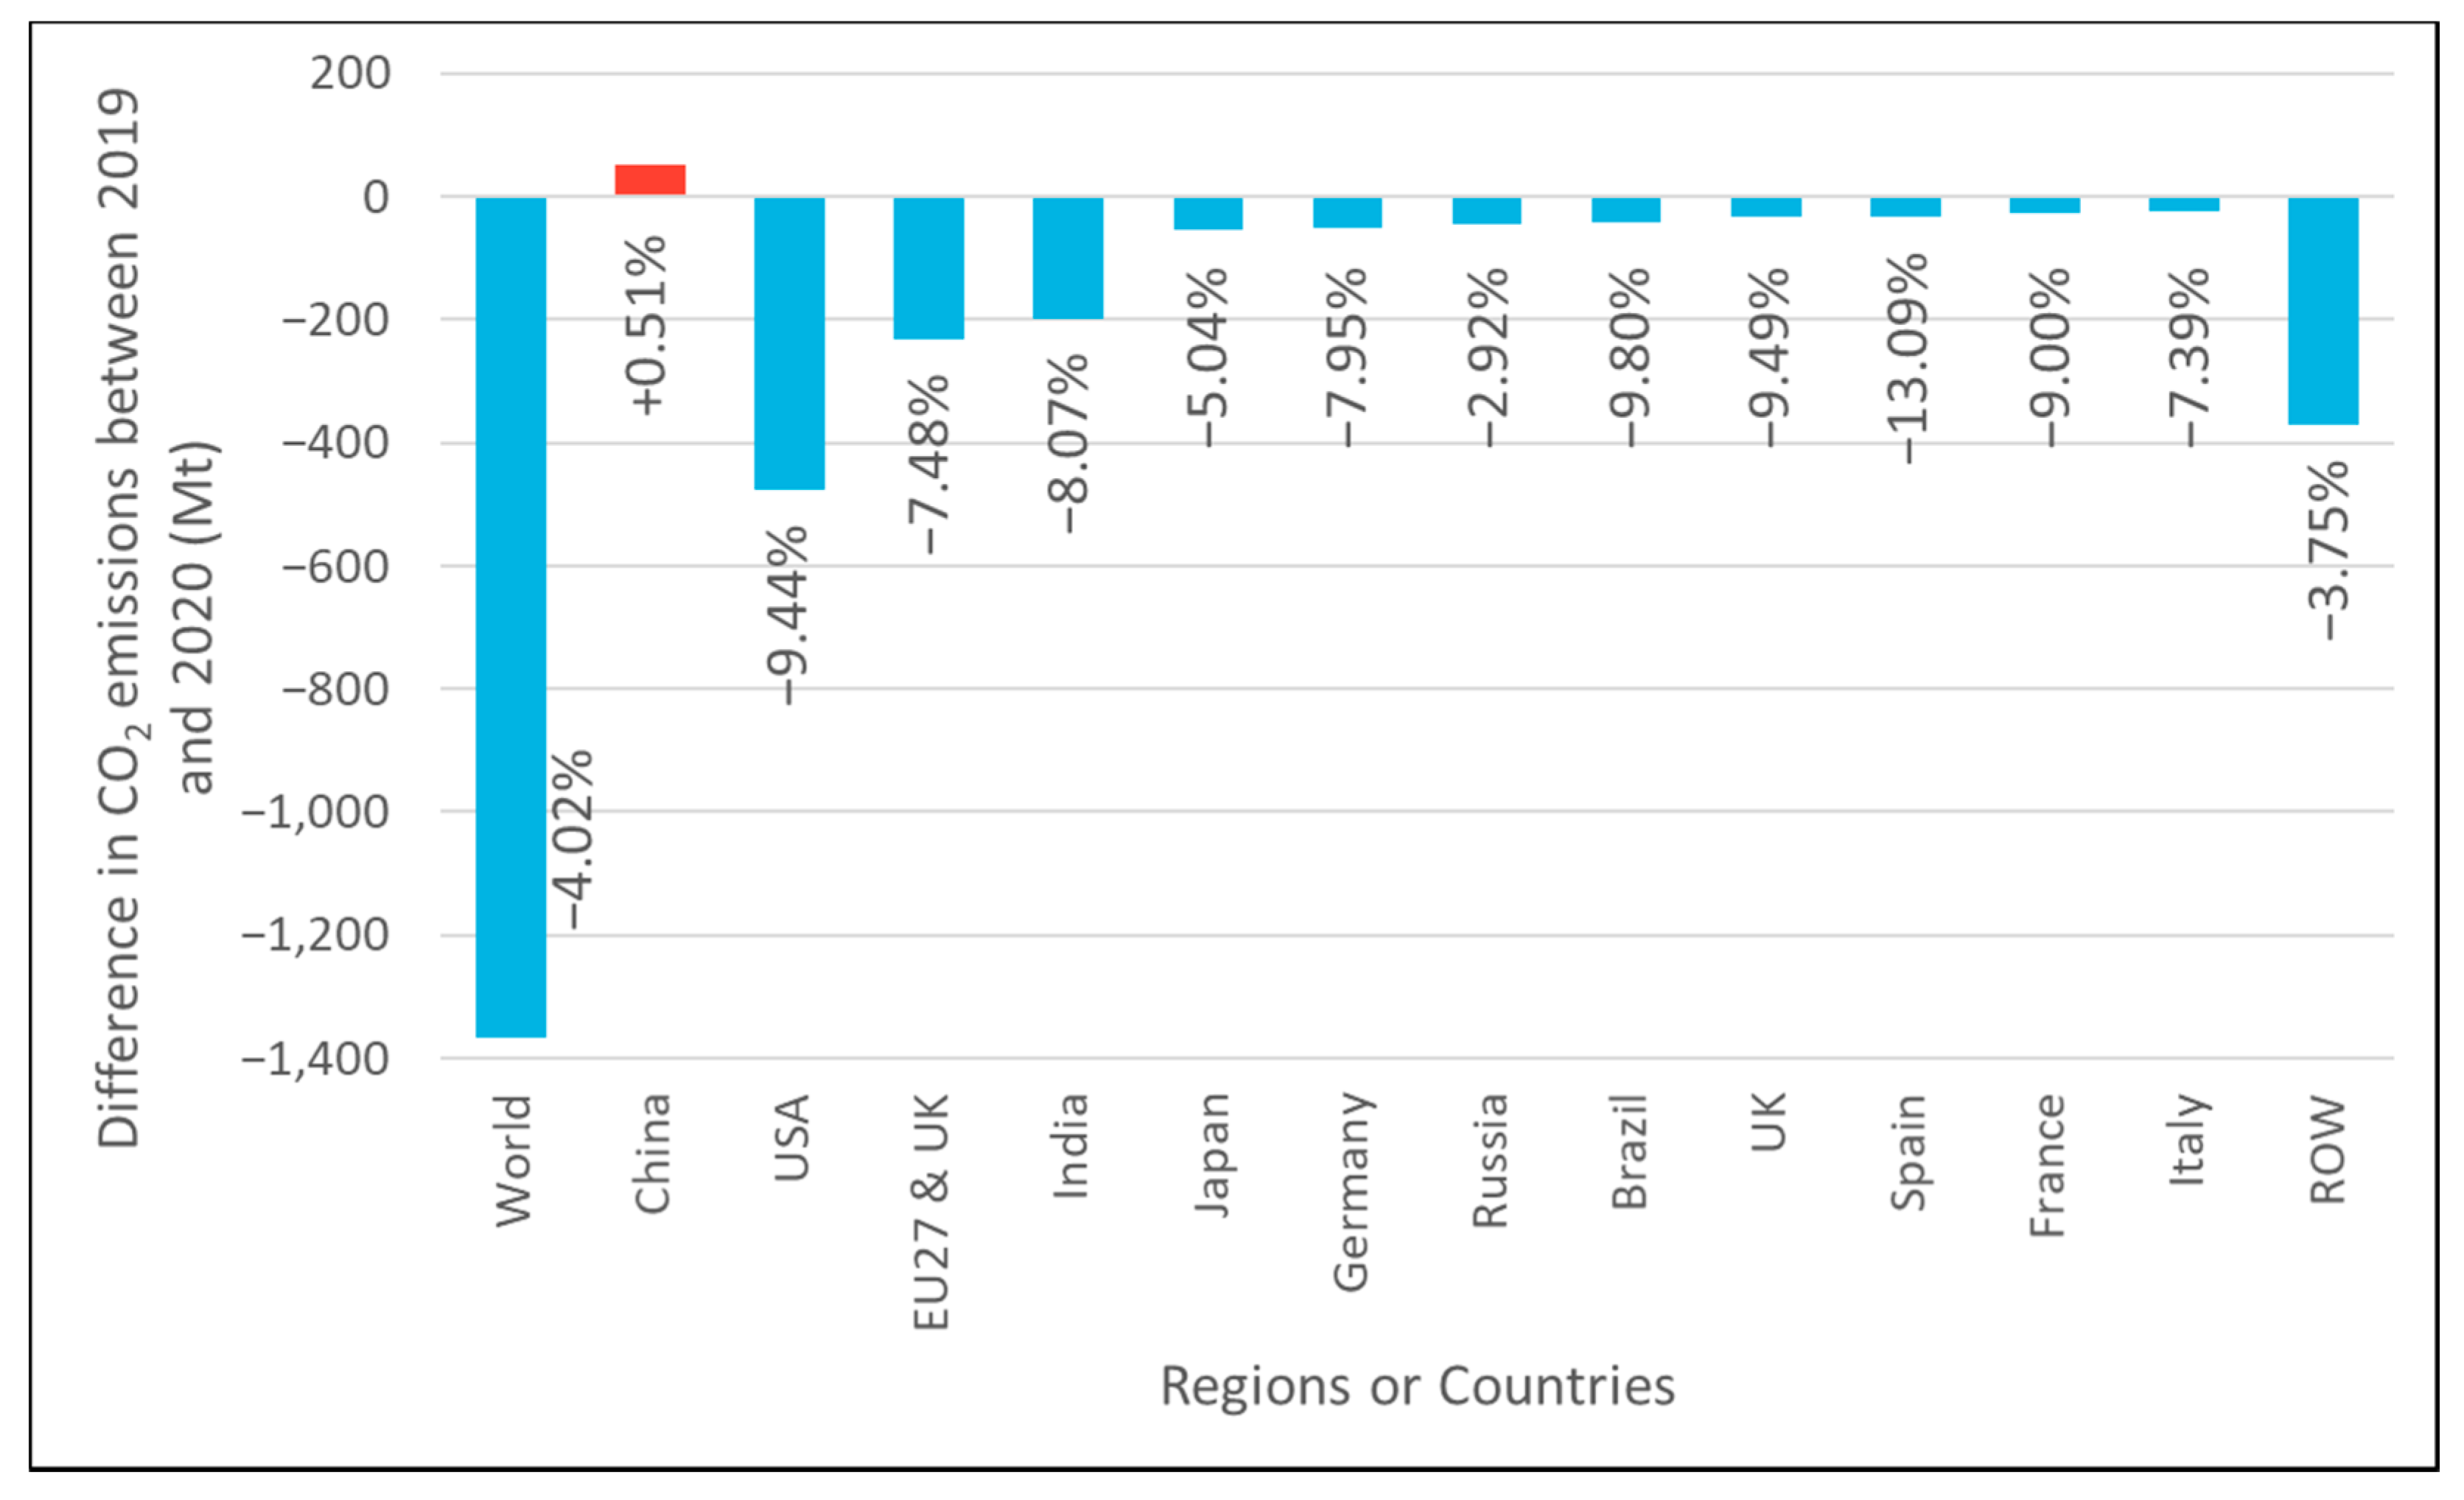
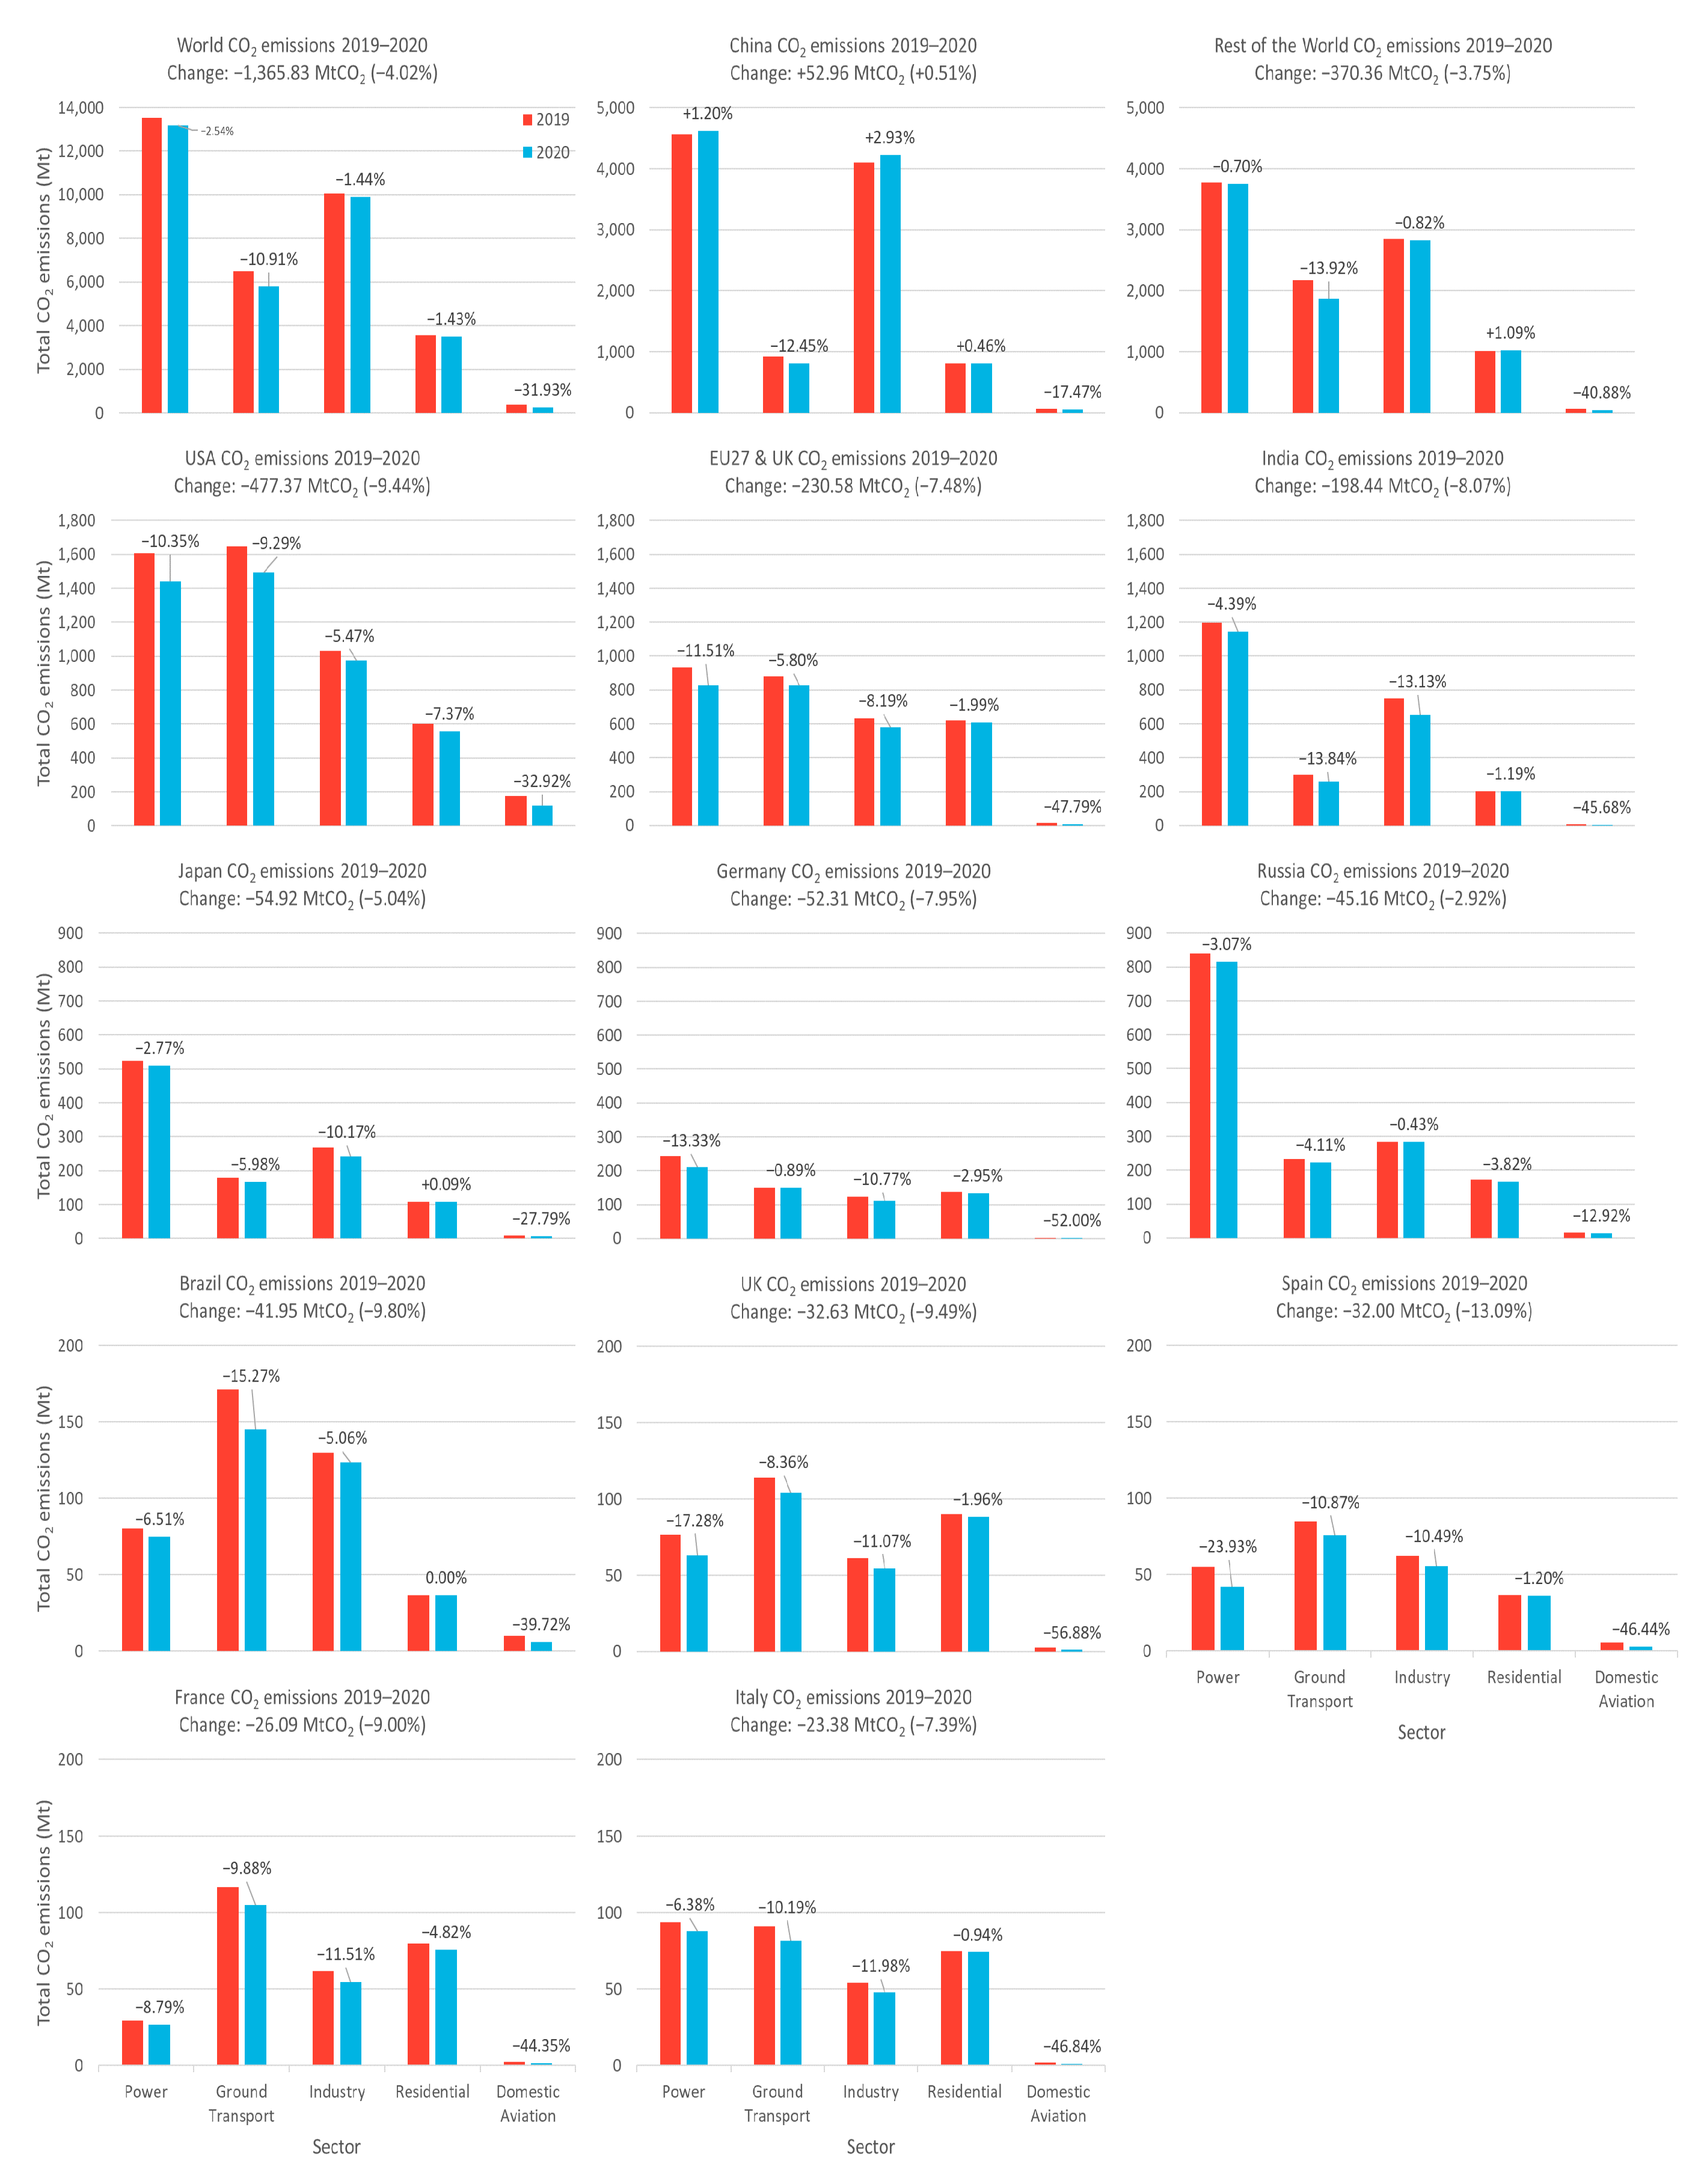
3. Global CO2 Emissions during COVID-19 Pandemic

When compared to 2019, there was a significant reduction in global CO2 emissions in 2020 due to the COVID-19 pandemic. From Figure 1 [15], the total global CO2 emissions in 2020 showed a decline of 4.02% (−1365.83 MtCO2), with the greatest decrease in emissions occurring in the U.S.A. (−477.37 MtCO2, −9.44%), followed by EU27–UK (−230.58 MtCO2, −7.48%), and India (−198.44 MtCO2, −8.07%). Lesser decrease in emissions were observed in Japan (−54.92 MtCO2, −5.04%), Russia (−45.16 MtCO2, −2.92%), and Brazil (−41.95 MtCO2, −9.80%). When compared to the first half of 2019 (January to June 2019), the first half of 2020 observed a decline in global CO2 emissions by roughly 8.8% (−1551 MtCO2). The period when emissions declined coincided with the global spread of COVID-19 and implementation of lockdown measures in many countries worldwide between March and July 2020, with the greatest decline recorded in April 2020. The absolute reduction in CO2 emissions over the first half of 2020 was the greatest reduction in history, surpassing the drop in emissions during the Great Recession in 2008–2009 and the end of World War II (annual decrease of 790 Mt CO2). However, since July 2020, the global CO2 emissions started to increase due to the relaxation of lockdown measures and partial restart of the economy, particularly in China and some European countries [4].
As shown in Figure 1, China recorded overall a slight increase in total emissions in 2020 compared to 2019 (+52.96 MtCO2, +0.51%). At the start of 2020, there was a sharp decline in China’s emissions due to the outbreak of COVID-19 and stringent lockdown measures, but these restrictions were gradually lifted starting in March. After this, CO2 emissions in China quickly recovered in April and May. When compared to 2019, China in 2020 experienced a reduction in emissions of −18.4% in February and −9.2% in March, followed by an increase of 0.6% in April and 5.4% in May [4].

3.1. Power Sector

From Figure 2 [15], global CO2 emissions from the power sector in 2020 decreased by 2.54% (−343.40 MtCO2). The largest reduction was found in U.S.A. (−166.06 MtCO2, −10.35%) and EU27–UK (−107.46 MtCO2, −11.51%). During the lockdown period, global electricity consumption was reduced to weekend levels. Electricity demand was substantially reduced in services and industries, and this reduction was partially offset by increased residential usage [37]. Typically, weekends record lower electricity consumption than weekdays. This is because most commercial offices are closed, reducing the need to power lighting, air-conditioning, and computers [38]. When the lockdowns in Italy and Germany were lifted in April, electricity consumption gradually increased and rebounded to near 2019 levels in August. This trend was also observed in other countries (France, Spain, Great Britain, and India), which lifted their lockdowns in May and saw electricity demand rebound to near 2019 levels in August [37].
In India, electricity consumption increased 3.4% in September 2020 compared to 2019 levels due to greater demand from commercial and industrial sectors, as well as increased need for irrigation compared to 2019. In October 2020, India’s recovering economy and relaxed restrictions drove up the consumption of electricity by more than 10% compared to 2019, which was similar to pre-COVID-19 levels. In the last two weeks of November, electricity consumption dropped to 2019 levels due to the Diwali festival and strikes in the agriculture industry. In December, electricity demand again rose more than 8% compared to 2019 [37].
After China enforced lockdown in January 2020, electricity consumption began to drop and a significant reduction of 11% was recorded in February 2020 compared to 2019 levels. One of the reasons for lower electricity usage is the warmer temperatures recorded in February 2020 compared to February 2019. After China eased lockdown measures, electricity consumption quickly rebounded to pre-COVID-19 levels in April, and increased to a consistent 6% higher from August to November compared to 2019 levels [4,37]. Overall, electricity usage in China showed a slight growth of 1.20% (+54.83 MtCO2).

3.2. Ground Transportation

The global CO2 emissions from ground transportation in 2020 were reduced by 10.91% (−710.06 MtCO2) (Figure 2). The largest contributors to this reduction were U.S.A. (−153.02 MtCO2, −9.29%) and China (−115.05 MtCO2, −12.45%). Moderate reductions were observed in EU27–UK (−51.03 MtCO2, −5.80%) and India (−41.47 MtCO2, −13.84%). In China, the mean emissions from transportation in January 2020 rose by 7.4% compared to January 2019. This occurred because the Spring Festival travel rush began earlier in 2020 (10 January) before the onset of lockdown (last week of January). However, after lockdown was initiated, transport emissions declined sharply showing −75.1% in February and −34.2% in March [39]. In contrast, although transportation in U.S.A., Brazil, and Japan were not restricted, emissions from ground transportation in these three countries still declined, with Brazil registering −15.27% (−26.14 MtCO2) and Japan −5.98% (−10.66 MtCO2) [4].

3.3. Industry and Cement Production

On average, 29% of the worldwide annual CO2 emissions are released from industries such as steel, chemicals, fossil-fuel-derived goods, and cement production. Developing countries, such as China and India, typically have a greater share in these emissions [40]. However, due to the COVID-19 pandemic, the worldwide industrial emissions in 2020 declined by 1.44% (−145.05 MtCO2) (Figure 2). This included significant reductions in India (−98.63 MtCO2, −13.13%), U.S.A. (−56.40 MtCO2, −5.47%), and EU27–UK (−51.82 MtCO2, −8.19%). In China’s case, its industrial emissions recorded a small increase of 2.93% (+120.36 MtCO2) in 2020 compared to 2019. This increase can be attributed to two of China’s major industries, steel and cement, which accounted for roughly 42% and 22% of China’s industrial emissions from fuel consumption in the past several years. Despite the lockdown measures, China’s steel industry recorded a 2.2% increase in emissions in the first half of 2020 compared to 2019. For China’s cement industry, a significant decline in emissions was observed in the first three months of 2020 (−29.5% in January and February combined, and −18.3% in March). After the lockdown was relaxed in March, however, cement emissions surged to +3.8%, +8.6%, and +8.4% in April, May, and June compared to 2019 [4,41].

3.4. Residential and Commercial Premises

The rapid spread of COVID-19 disease caused more people to work from home and minimize travelling. The winter months in the northern hemisphere were unusually warm in 2020, reducing energy consumption for heating. As a result, CO2 emissions from global heating demand fell 1.43% (−50.83 MtCO2) in 2020 compared to 2019 (Figure 2). The estimation of global heating demand assumes that most of the energy usage in residential and commercial premises was for temperature control, with no considerable change in their intrinsic energy consumption throughout the lockdown phase [4].

3.5. Aviation Industry

CO2 emissions from global domestic aviation were reduced by 31.93% (−116.49 MtCO2) in 2020 compared to 2019 (Figure 2). There were two occurrences where global aviation emissions were considerably reduced in 2020, one in Asia close to the end of January and another during the implementation of lockdown measures worldwide in mid-March. Global international aviation was greatly affected by the worldwide lockdowns, which showed a reduction in emissions of 72% in July 2020 compared to July 2019 [4]. According to the International Air Transport Association (IATA), the aviation industry’s revenue passenger kilometres (RPKs) declined by 94.3% year-on-year in April 2020, following a huge drop of 55% year-on-year in March [42]. The industry-wide RPKs still showed reductions in July (−79.5%) and August 2020 (−75.3%) compared to 2019 levels. However, the easing of lockdowns globally has increased domestic market demands, allowing the aviation industry to gradually rebound [43]. Apart from RPKs, industry-wide cargo tonne kilometres (CTKs) also saw year-on-year reductions from −14.7% in March to −27.7% in April. This resulted from a reduced demand for cargo shipping and decreased manufacturing activities due to lockdowns [44]. In August, although industry-wide CTKs still displayed a reduction of 12.6%, international cargo traffic increased in many countries [45].

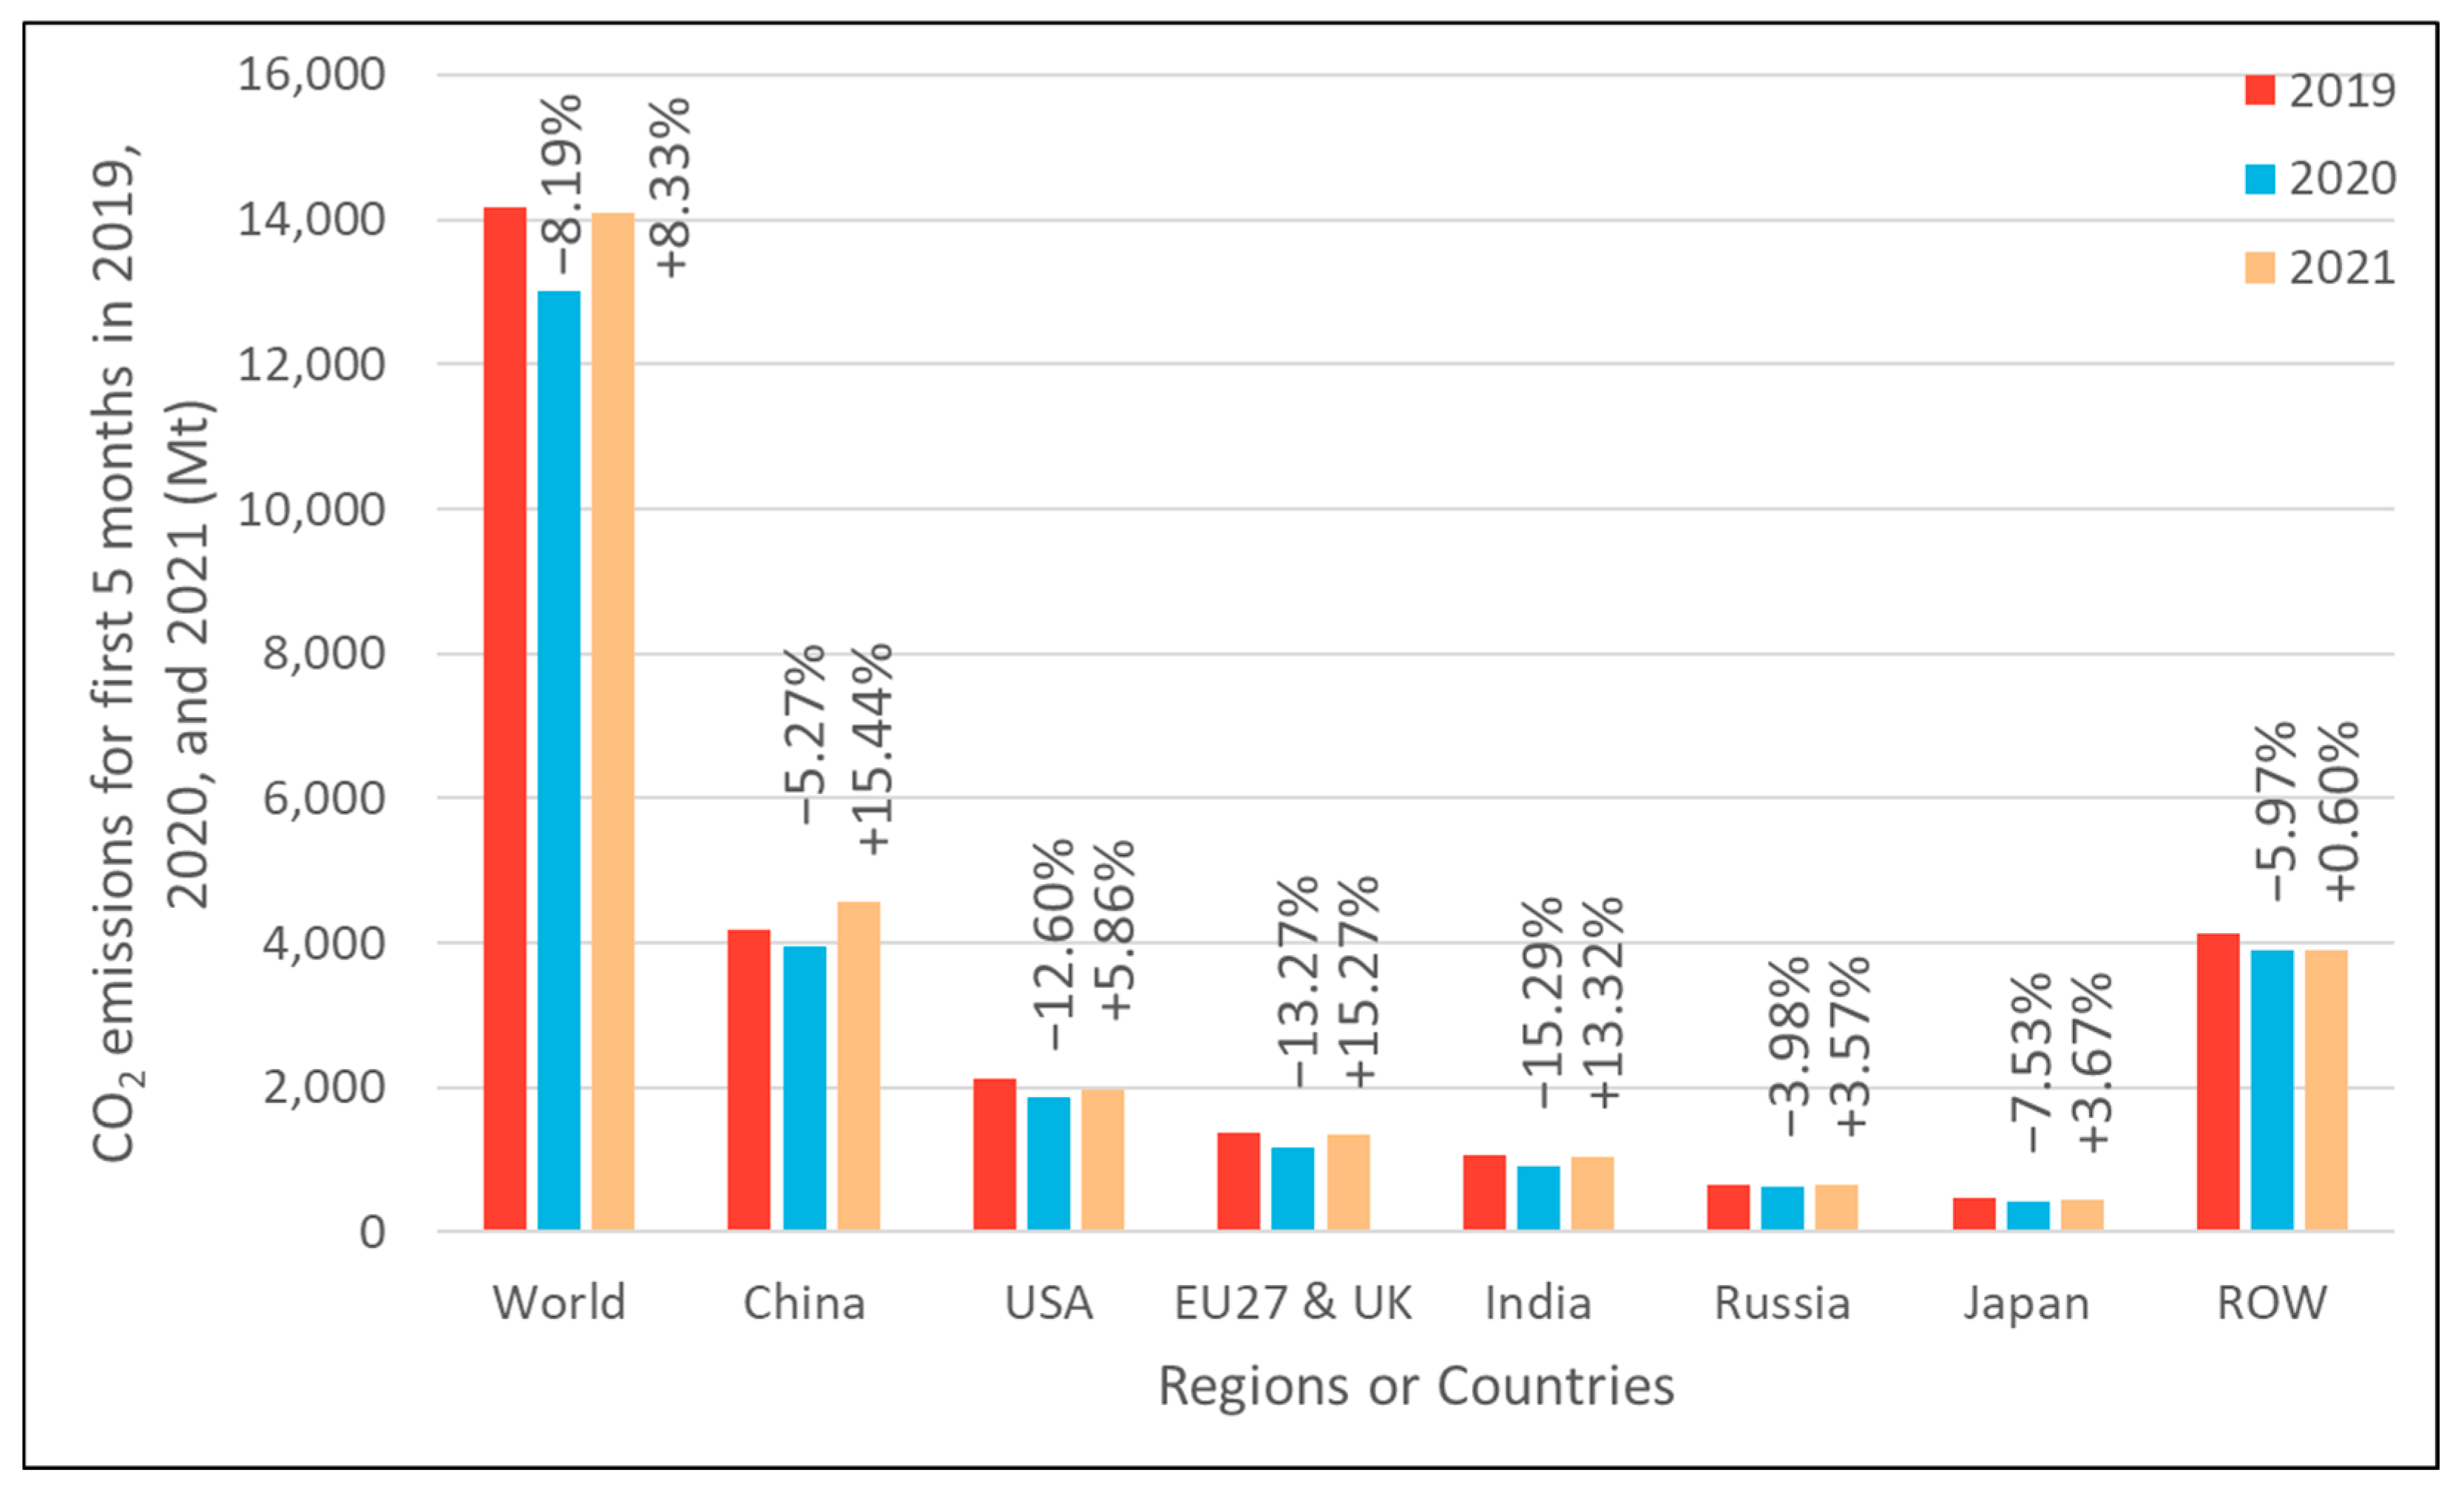
3.6. Comparison of CO2 Emissions in 2019, 2020, and 2021

Figure 3 shows the comparison of CO2 emissions for the world and major contributing countries or regions in the first five months of 2019, 2020, and 2021 [15,46]. Data from the first five months sufficiently covers the lockdown periods for the major countries and regions [4]. From Figure 3, global CO2 emissions recovered back to 2019 levels in 2021 despite a sharp decrease of 8.19% (−1160.03 MtCO2) in 2020. After experiencing CO2 reductions in 2020, emissions in 2021 quickly rose back to 2019 levels for EU27–UK, India, and Russia. In the case of China, its CO2 emissions rose 9.4% above 2019 levels, observed the highest recovery of 15.44% (+610.06 MtCO2) in 2021 compared to 2020. In contrast, emissions from U.S.A., Japan, and rest of the world (ROW) in 2021 were 7.5%, 4.1%, and 5.4% lower than their 2019 levels, despite all three registering positive emissions growth in 2021 compared to 2020. Even though there is a net reduction in emissions in 2020, the mean atmospheric CO2 level still increased by 0.6% in 2020 (412 ppm) compared to 2019 (410 ppm). This annual rate of increase is similar to 2019, which also showed a 0.6% increase compared to 2018 (408 ppm) [47]. After global emissions in 2021 returned to 2019 levels, the mean atmospheric CO2 level for May 2021 reached 419 ppm as measured by National Oceanic and Atmospheric Administration’s (NOAA) Mauna Loa Observatory [48]. These data showed that the CO2 emissions savings from drastic lockdown measures on a global scale was only temporary and showed no significant effect on the annual growth of CO2 levels [3]. This agrees with historical observations where brief decline in carbon emissions did not lead to significant climate change. To achieve long-term impacts, a systemic shift is required. Even if the lower GHG emissions due to COVID-19 were to become normal, we must still cut emissions by 50% by 2030 to prevent global mean temperature from rising more than 1.5 °C compared to pre-industrial level. This will allow us to mitigate some of the worst effects of climate change [49]. This has been the goal of the international Paris Agreement on climate change, which aims to control the rise of the global surface mean air temperature well below 2 °C compared to pre-industrial levels [50].

4. CO2 Emissions in Malaysia during COVID-19 Pandemic

Figure 4 [51] shows a decline in Malaysia’s CO2 emissions during 2020 in six different areas, namely the power sector, industrial sector, ground transportation, public and residential sectors, and domestic aviation. The values in Figure 4 represent the estimated difference between daily CO2 emissions in 2020 compared to the mean 2019 levels. From Figure 4, total CO2 emissions showed the highest reduction (−0.202 MtCO2/d) in the middle of March 2020, which coincided with the implementation of lockdown measures by the government, known as Movement Control Order (MCO), to curb the rapid spread of COVID-19. The spike in positive cases from 29 cases on 1 March to 553 cases on 16 March, due to mass gathering at a religious event, prompted the government to enforce first phase MCO from 18 March to 31 March [52,53]. The MCO enforced rules such as banning of movement and assembly, banning of overseas and interstate travel, closure of all educational institutions, closure of all nonessential public and private premises, social distancing, and allowing only one person per household to leave home for purchasing essential items [54,55]. The government then implemented three more phases of MCO, extending the lockdown period from April to early May. These restrictions were reflected by significant reductions in CO2 emissions in power generation (−0.052 MtCO2/d, 26% share of total reductions during MCO), industrial sector (−0.047 MtCO2/d, 23% share), and ground transportation (−0.093 MtCO2/d, 46% share) from March to May as all nonessential sectors were closed (Figure 4). The public sector and aviation industry saw a lesser decrease in emissions of −0.006 MtCO2/d (28% share) and −0.005 MtCO2/d (23% share), respectively. In the same period, CO2 emissions from the residential sector saw a slight increase of 0.0005 MtCO2/d as all residents stayed at home. Outside of MCO, residential emissions stayed the same as their mean 2019 levels.
The government gradually relaxed the lockdown measures by establishing Conditional Movement Control Order (CMCO) in two phases from 4 May to 9 June. Under the CMCO, several sectors of the economy were permitted to resume provided that all employers and employees complied to the Standard Operating Procedures (SOPs) specified by the government [56,57]. The partial restart of the economy increased the daily CO2 emissions during CMCO to −0.133 MtCO2/d (34% recovery) compared to the MCO period (Figure 4). Emissions from power generation recorded the highest recovery of 67% (−0.017 MtCO2/d) compared to the MCO period. This was followed by industrial and ground transportation emissions, registering recoveries of 29% (−0.033 MtCO2/d) and 20% (−0.075 MtCO2/d).
As the rate of infection was largely under control due to the MCO and CMCO measures, the government introduced Recovery Movement Control Order (RMCO) after CMCO ended. The first two phases of RMCO lasted from 10 June to 31 December 2020 [58,59], while the third phase continued from 1 January to 31 March 2021 [60]. Under RMCO, restrictions were further relaxed while still adhering to the SOPs. RMCO allowed interstate travel (but not international travel), normal business operations, small-scale gatherings for recreation and sports (except sporting events and contact sports), gradual reopening of schools, and small congregations of worshippers at mosques and suraus [58]. The RMCO initiated another increase in daily CO2 emissions to −0.043 MtCO2/d (79% recovery compared to the MCO period), which stabilized until the end of 2020 (Figure 4). Upon the start of RMCO, CO2 emissions from power generation completely recovered to 2019 levels. Compared to the MCO period, emissions from ground transportation and public sector showed high recoveries of 80% (−0.019 MtCO2/d) and 78% (−0.0009 MtCO2/d), respectively. Meanwhile, industrial and aviation emissions showed lower recoveries of 57% (−0.020 MtCO2/d) and 34% (−0.003 MtCO2/d). By the end of 2020, Malaysia’s total CO2 emissions were 225.97 MtCO2, a notable decline of 9.7% from 250.09 MtCO2 in 2019 (Figure 5) [51].

5. Climate Change in Malaysia

Despite the considerable drop in global and Malaysia’s CO2 emissions in 2020 due to the COVID-19 pandemic, it was not enough to cause a long-term impact on global CO2 levels [3]. Given the direct link between rising CO2 levels and increased global warming, it is prudent to look into the effects of climate change [30]. This is because climate change not only poses a grave threat to the planet and health of the human race, but it is also endangering the world economy. To solve this problem, we need to change our technologies of commodity production to modern technologies that guarantee and drive the growth of sustainable economies. Climate change, increasing energy consumption, and sustainable development have become the most critical challenges in the 21st century. The climbing atmospheric CO2 concentrations (currently >400 ppm) coupled with the rising average global temperatures (increase >2 °C by 2100) will severely affect the human population worldwide, resulting in extreme weather events (higher frequency of intense heat waves and cyclones) and melting of glaciers (causing rapid sea-level rise) [61]. If measures to halt global warming are not implemented swiftly, coastal cities may become flooded and unsuitable for living in the near future. Apart from this, the growing world population, projected to reach 9.7 billion in 2050 [62], together with the expected rise in global energy consumption of 30–50% higher in 2050 [63,64], are great challenges that must be solved by the entire human society.
Being a global phenomenon, the impacts of climate change on a global and regional scale, including in Malaysia, must be studied. Malaysia, located in Southeast Asia, is a country that comprises two regions, namely Peninsular Malaysia (West Malaysia) and Malaysian Borneo (East Malaysia). The whole country has a land area of 330,803 km2 and an estimated population of 32.7 million in 2020 [65,66]. Malaysia is located near the equator and has hot and humid climate throughout the year. The variabilities of Malaysia’s climate are closely linked to the Northeast and Southwest Monsoons. The Northeast Monsoon happens from October to March and brings higher precipitation, whereas the Southwest Monsoon occurs from April to September and displays drier climate with decreased rainfall [67].

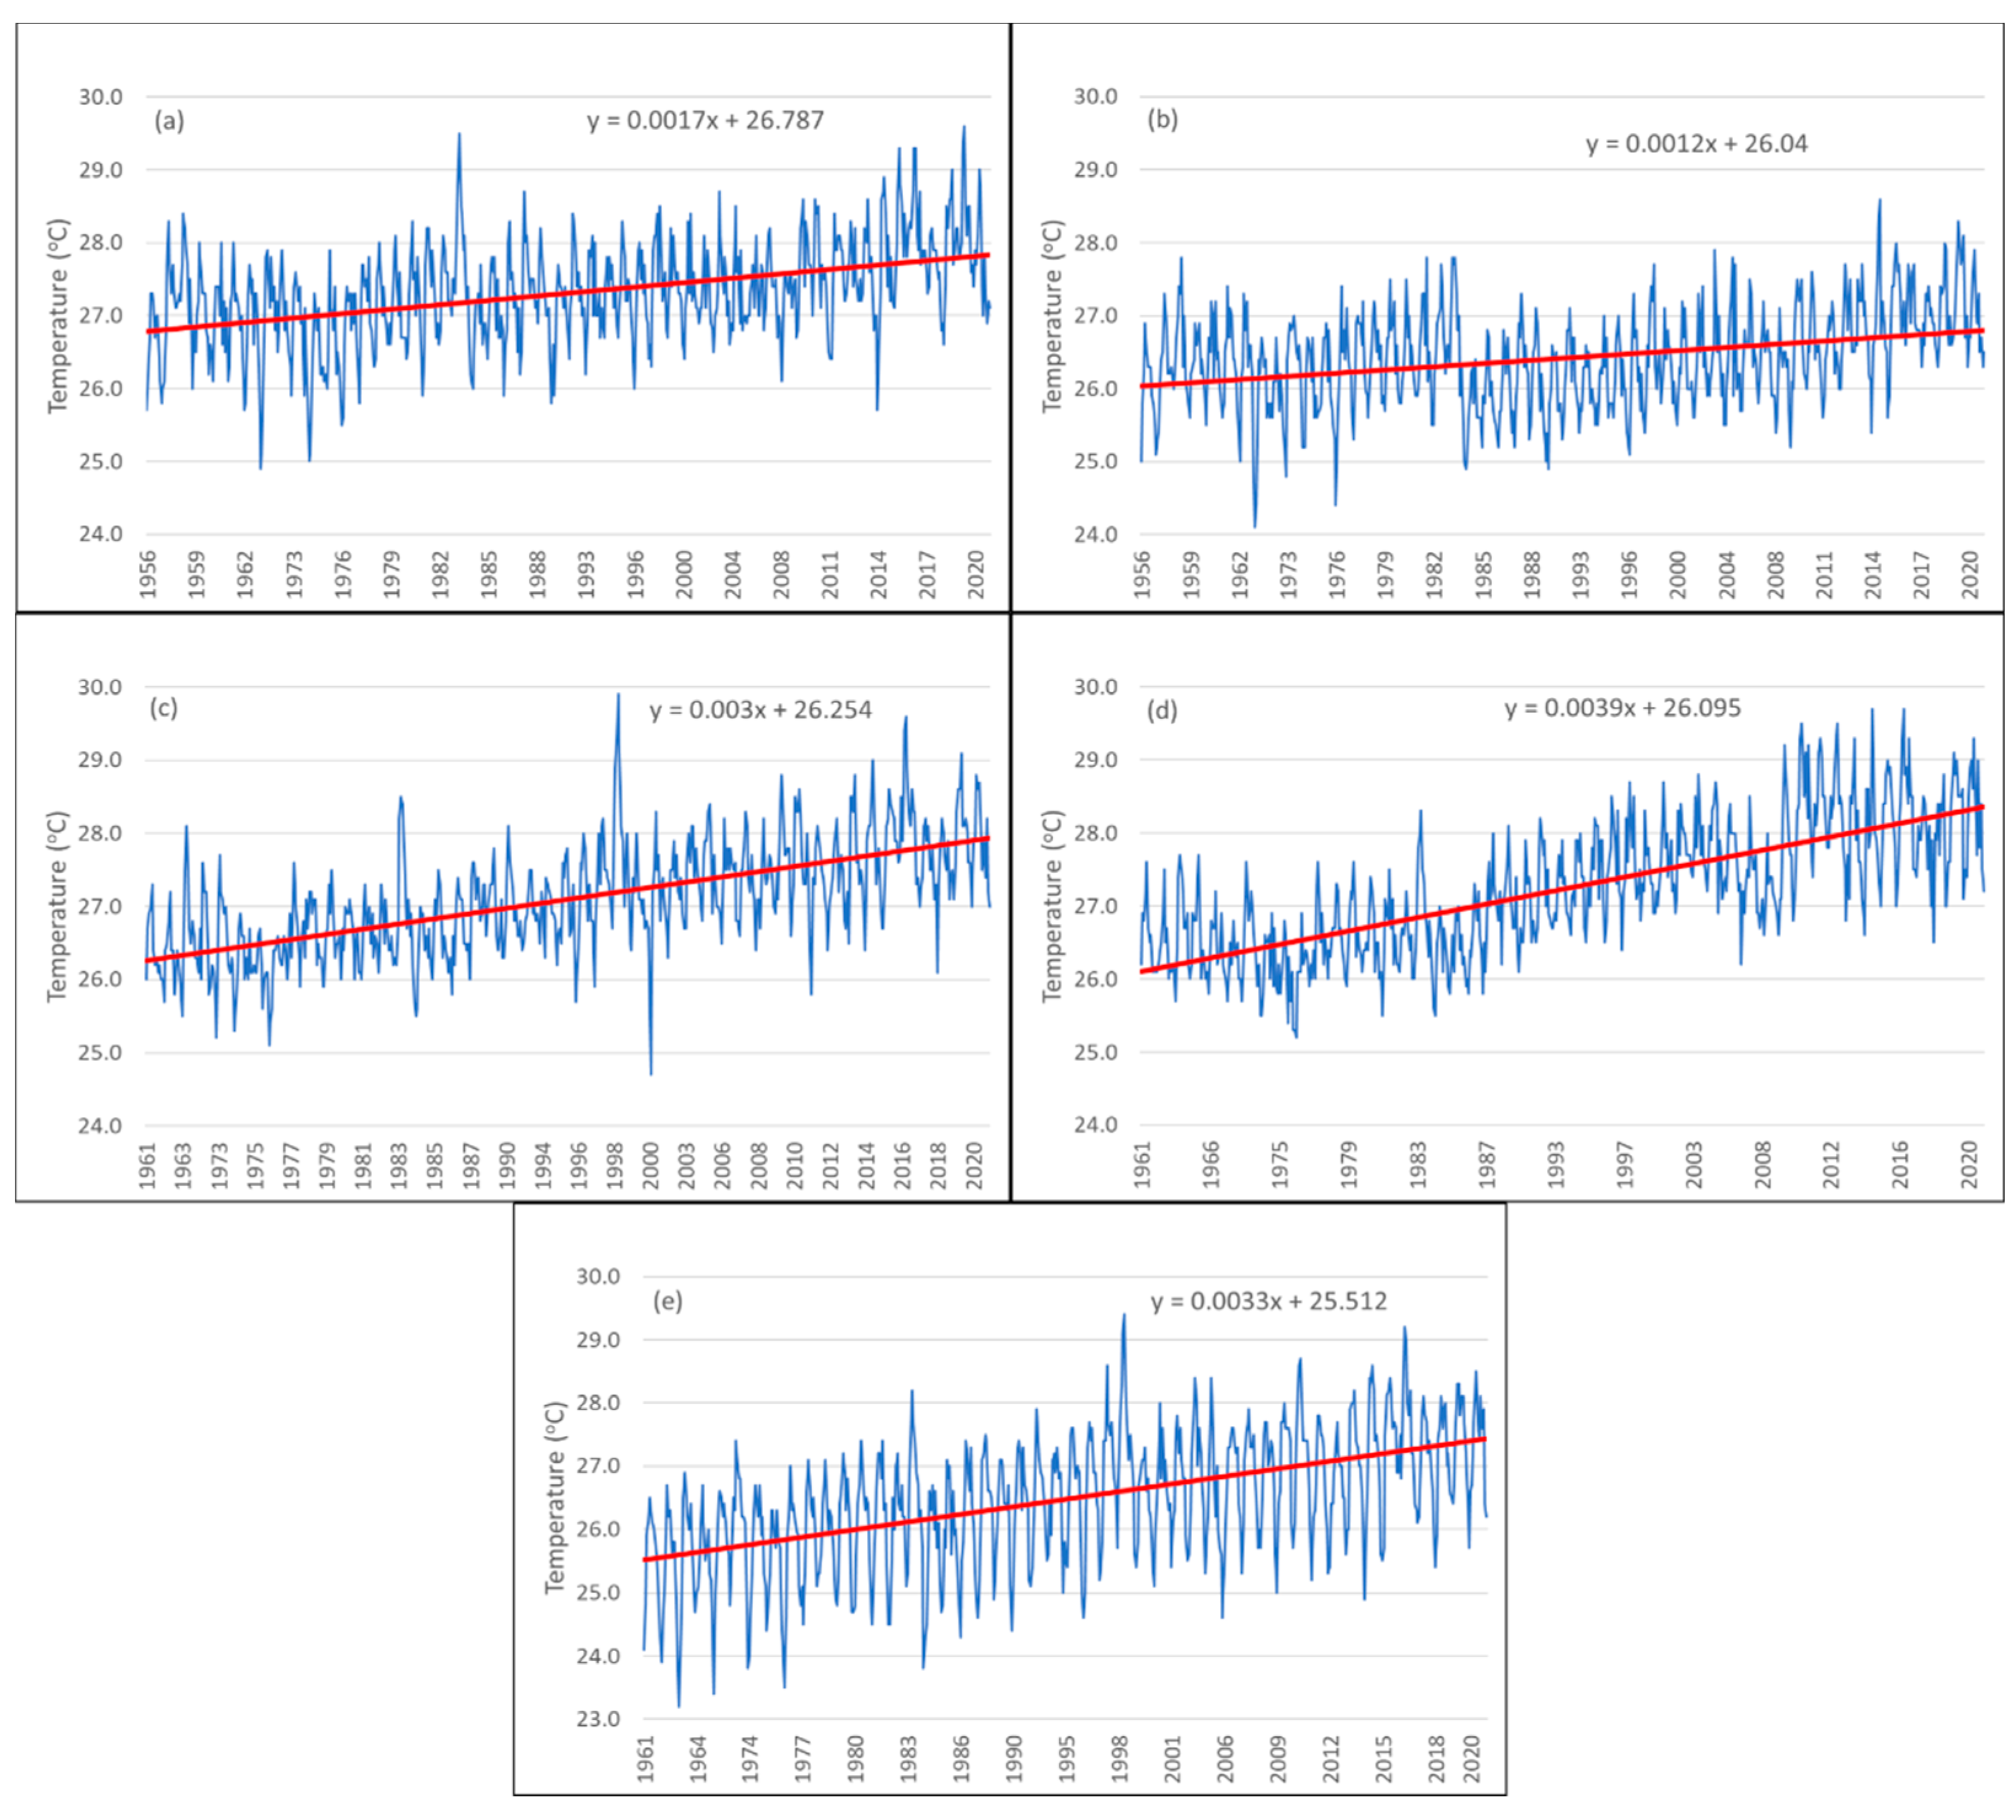
5.1. Mean Monthly Temperature in Malaysia

Figure 6 [68,69] shows the mean monthly temperature in five different towns/cities in Malaysia, two from East Malaysia (Kota Kinabalu and Kuching) and three from West Malaysia (Malacca, Subang, and Kuantan). These five towns/cities were selected because they are suitably located in different regions of Malaysia, thereby providing a good overview of climate conditions throughout the country. In Figure 6, there is a clear upward trend in temperatures at all five locations. The rate of increase in mean monthly temperature, as shown by the slope of the linear trendline (the red dotted straight lines in Figure 6), was smallest for Kuching, followed by Kota Kinabalu, Malacca, Kuantan, and Subang, in increasing order. These data coincide with observations from the Malaysian Meteorological Department, wherein Kuching recorded the lowest temperature rise due to its slower growth in development [70]. However, the slope of the trendlines does not give the actual rate of mean temperature rise. Based on a 2015 report by the Ministry of Natural Resources and Environment Malaysia, the estimated rate of mean temperature rise was 0.25 °C every decade for Peninsular Malaysia, 0.20 °C for Sabah, and 0.14 °C for Sarawak [71].

5.2. Extreme Weather
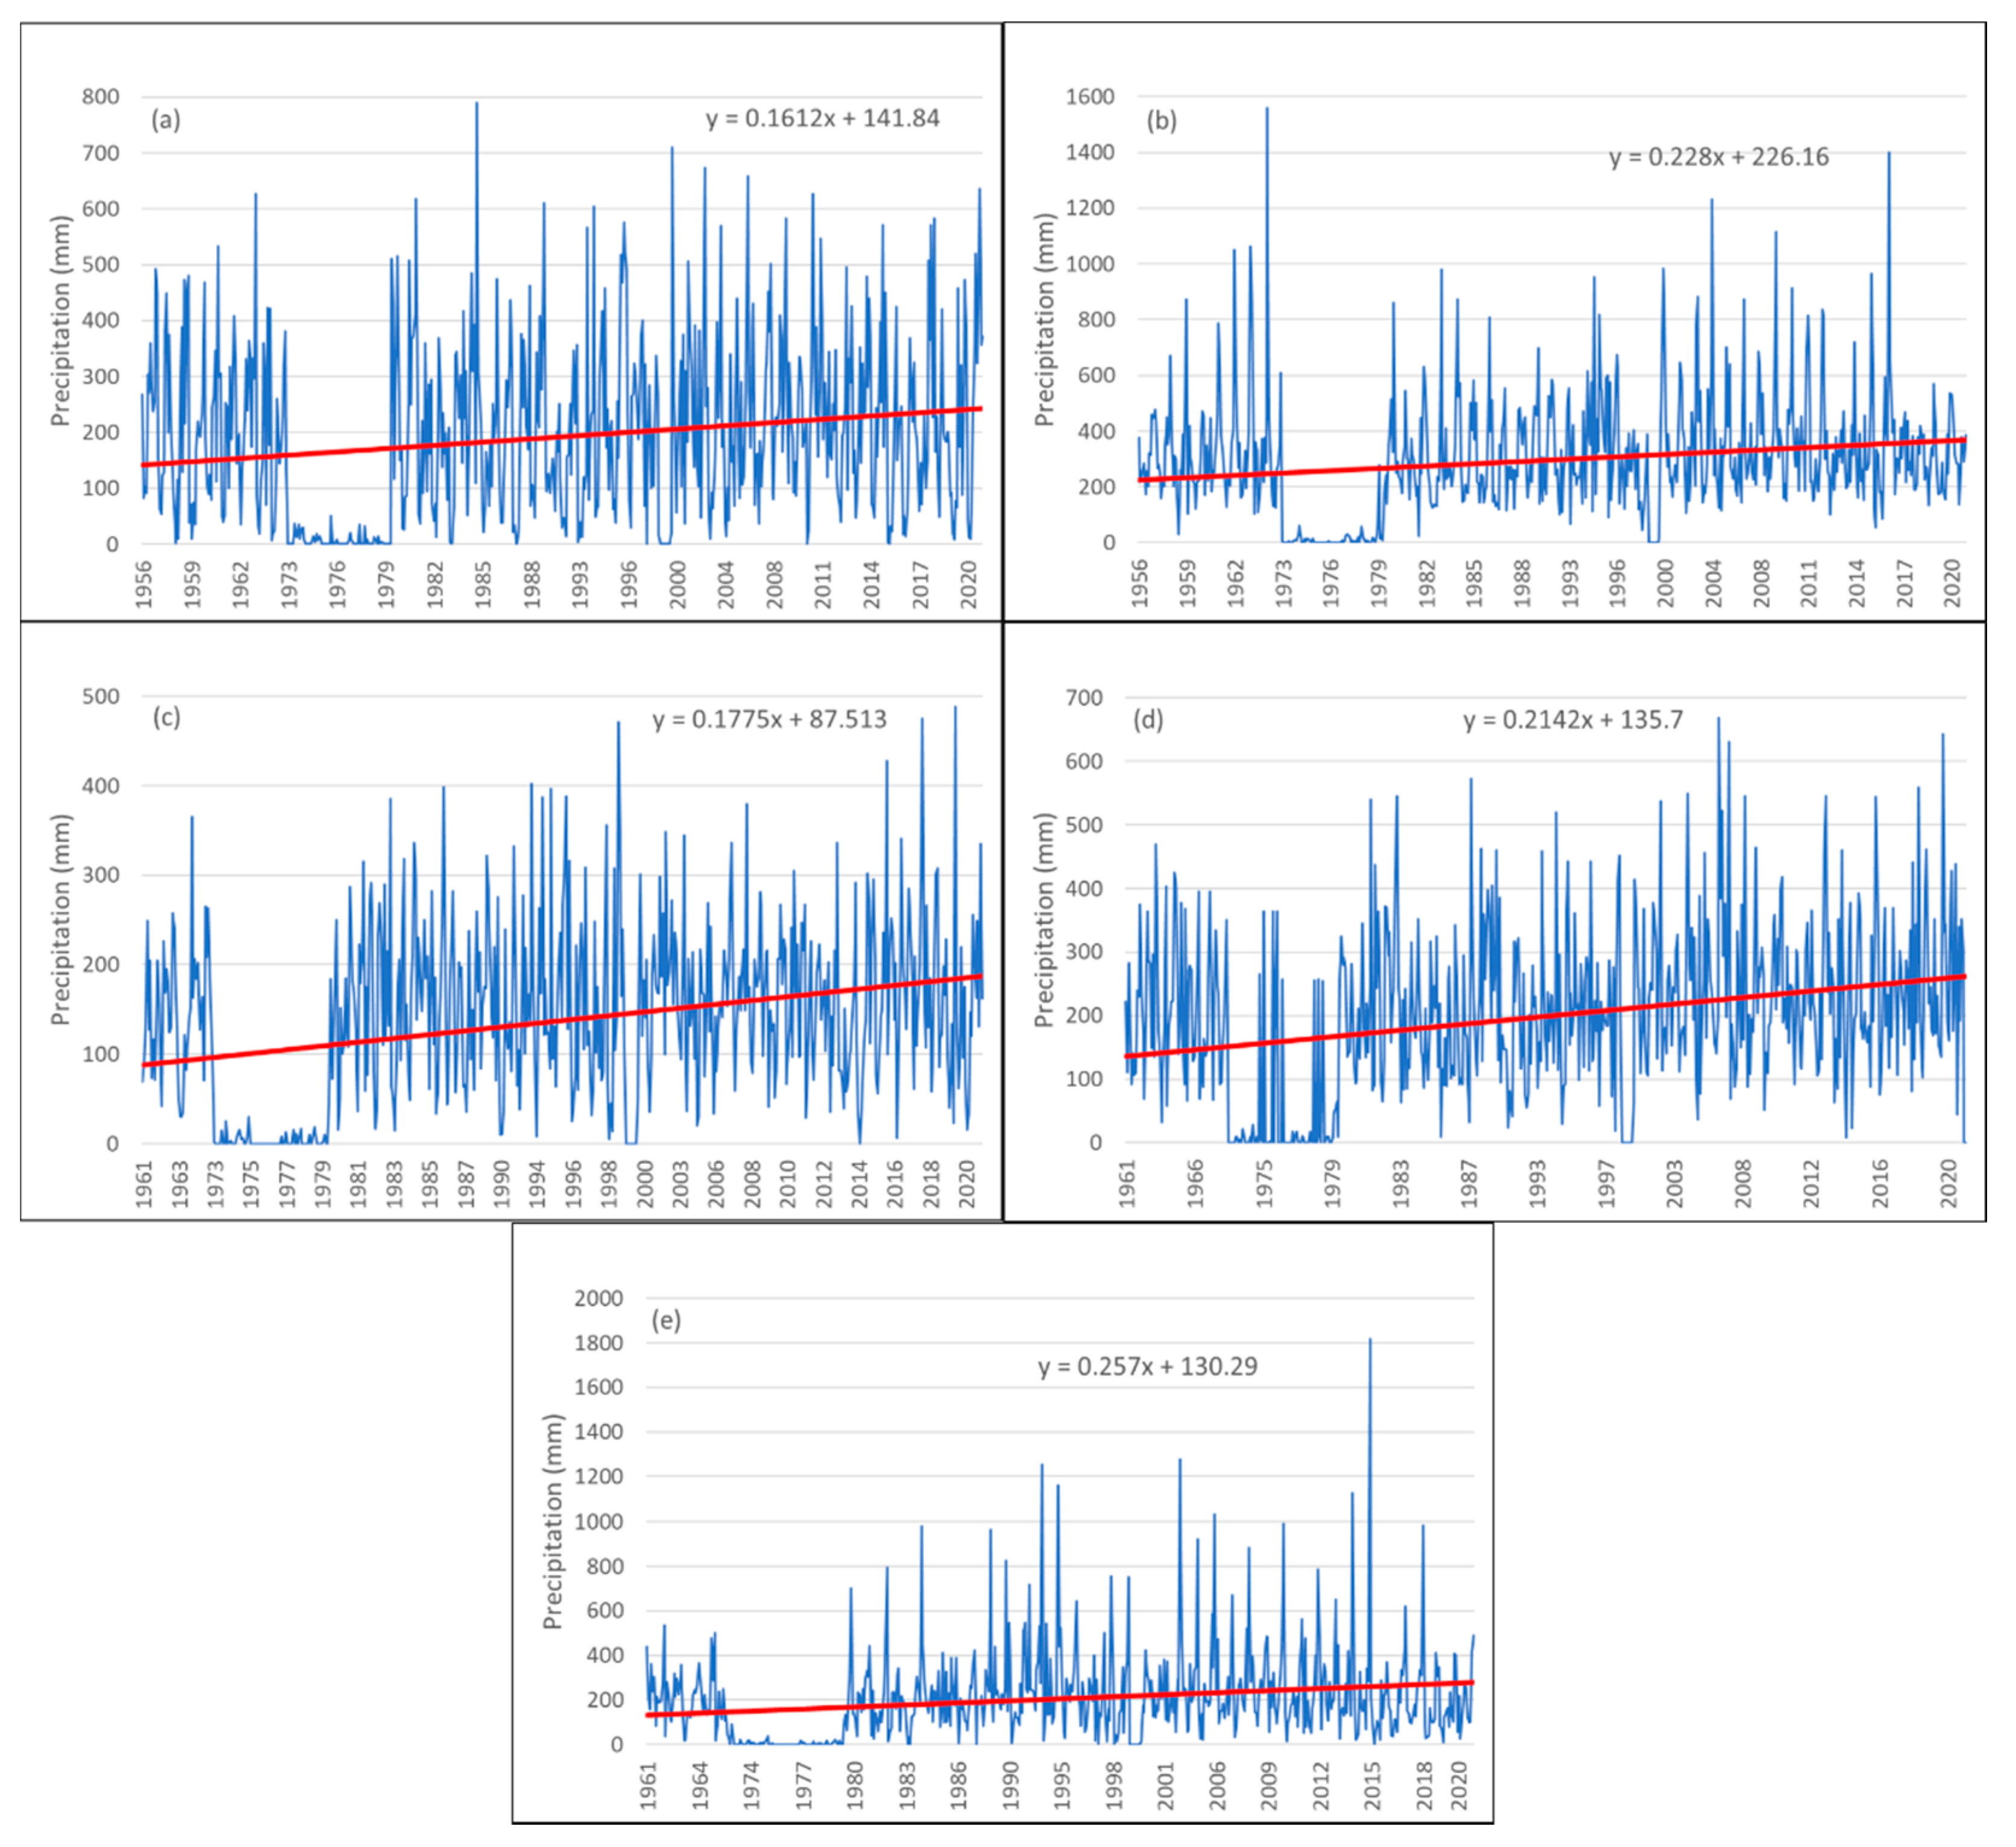
Malaysia has increasingly experienced extreme climate events in the last several decades, where days or weeks of high temperature, high precipitation, dry weather, thunderstorms, and strong winds are becoming more frequent. Since the 1980s, days with very high precipitation levels have been rising. In addition, the number of days with extreme thunderstorm and wind conditions has also increased. These factors have promoted more frequent flooding in many regions of Malaysia. The most extreme flooding event was documented in the southern region of Peninsular Malaysia during the Northeast Monsoon in 2006–2007 [72]. The rising temperature trends shown in Figure 6a–e depict progressively hotter weather in Malaysia. This change is influenced by El Nino events [70]. The co-occurrence of high precipitations and dry spells within the same year is becoming an apparent weather pattern in Malaysia [73]. Table 1 shows a list of major flooding events in Malaysia for the past 50 years.

5.3. Rainfall

The large variability found in Malaysia’s historical precipitation data coincides with observations from other reports [70,72,76]. From Figure 7 [68,69], there is a lack of precipitation data between 1973–1978 in all five locations. Despite this, a rising trend can be seen in Figure 7a–e, with the greatest increase in precipitation occurring in Kuantan. This is followed by Kuching and Subang, indicating moderate increase in precipitation. Kota Kinabalu and Malacca share the lowest increase in precipitation in this selected group. The yearly precipitation increment in Malaysia is attributed to the Northeast Monsoon, which usually takes place between October to March. The strong northeasterly and easterly winds carry moisture from the western Pacific to the South China Sea, increasing the amount of rain in the Southeast Asian region [67,77]. The rising mean precipitation in Malaysia is linked to a greater number of rainy days, and rainfalls during the Northeast Monsoon season are heavier than at other times of the year. Although the mean precipitation varies throughout the year, one study reported that the yearly precipitation and Northeast Monsoon rainfall have increased significantly between 1971 and 2010, with 95% and 90% confidence levels, respectively. During the same period, the number of days with greater than 20 mm precipitation also increased by 1.5 every decade [78].

5.4. Impacts of Climate Change in Malaysia

There are seven sectors in Malaysia that are susceptible to changes in climate, namely agriculture, biodiversity, coastal and marine resources, forestry, water resources, energy, and public health. Despite this, most of the research in Malaysia centres around investigating the effects of climate change on agriculture, especially the effects on rice cultivation [75]. It was reported that agricultural yields and growth rates were adversely but weakly affected by climate change. However, there was a notable positive correlation between crop production index and per capita CO2 emissions, indicating that the agriculture sector is a CO2 source [79]. Although the considerable CO2 emissions from Malaysia’s agricultural practices were not highlighted, this phenomenon still raised concerns regarding the sustainability of the agriculture sector. While higher atmospheric CO2 concentration can promote the rate of photosynthesis in C3 plants (where the first product of photosynthesis is 3-phosphoglycerate which comprises three carbon atoms, for instance paddy), the increasing temperature instead inhibits photosynthesis and promotes respiration when temperature rises above the tolerance limit of 26 °C. The final result is a lower rate of grain filling in paddy [80]. The future weather conditions in Malaysia were projected to have higher temperatures and unanticipated rainfall patterns, and these conditions do not favour the production of grains [75].
It is predicted that between 2025 and 2050, climate change will significantly increase flow in the watersheds of Terengganu, Kelantan, Perak, and Pahang during the Northeast Monsoon, while considerably reduce flowing in the watersheds of Klang and Selangor during the Southwest Monsoon [81]. This change in flow has the potential to cause heavy precipitation, floods, and rainfall-induced landslides, which can damage private properties and public infrastructure [82]. In the fishing industry, a study revealed that unstable weather decreases the days for fishing and amplifies the risks to fishing activities [83]. Even though statistical data are insufficient, another study showed that unstable weather resulted in an overall reduction in earnings of 9–32% for fishermen living along the east coast of Peninsular Malaysia [84].
In terms of energy consumption, higher temperatures resulting from climate change promotes the usage of air-conditioning in commercial and residential buildings. Compared to the year 2000, the cooling load in Malaysia is projected to rise by 2.96%, 8.08%, and 11.7% in 2020, 2050, and 2080, respectively. Since the maximum cooling load in 2000 was 297,000 KJ/h, this projection translates into maximum energy consumptions of 305,000 KJ/h in 2020, 321,000 KJ/h in 2050, and 330,000 KJ/h in 2080. The greater outdoor temperatures causes heat to enter buildings through walls, thereby increasing the indoor space cooling demand [85]. Apart from varying temperatures and rainfall patterns, climate change also raises the frequency of fire and haze in the tropical peatlands. This will disrupt the capacity of the peatlands to store carbon, instead turning them from carbon sinks into carbon sources, which in turn aggravates climate change [86].
In the public health sector, climate change is recognized for enhancing the spread of water-borne (such as cholera, typhoid fever, hepatitis A, and dysentery) and vector-borne diseases (or mosquito-related diseases such as malaria, dengue, and chikungunya) [87,88]. Global warming causes an increase in rainfall, which enhances the risk of flooding and the formation of ground pools where drinking water can be contaminated by untreated river or sewage water. Increase in precipitation also enhances the formation of stagnant waters that encourage breeding of mosquitoes, thereby raising the occurrence of mosquito-related diseases and expanding the affected areas [87]. Although the occurrences of water-borne diseases have been largely reduced in the last century, there were still incidences of typhoid and cholera outbreaks due to low coverage of clean water supply and lack of water supply during droughts, respectively. The best practices to minimize the incidences of typhoid and cholera are to extend clean water supply infrastructure to cover remote rural areas and to prepare and ration water supply for dry spells. On the other hand, the higher ambient temperature and increased rainfall in Malaysia provide the optimum conditions for mosquitoes to multiply and spread diseases. Warmer temperature reduces the time mosquito larvae reach maturity, and given favourable conditions, mosquito eggs can hatch within a day and mature as adults within a week. Even under dry conditions, the eggs can last about nine months. The policies and programmes to control the spread of malaria, dengue, and chikungunya include public health awareness, active detection of outbreaks, regular fogging, and reduction of breeding grounds [88]. In spite of this, little research has been carried out in Malaysia to examine the impacts of climate change on the occurrences of these diseases and conditions of the areas affected. From a review article, in the year 2050, the number of malarial cases could potentially increase by 15% when temperatures rise by 1.5 °C. This projection considered factors such as increased rainfall and intrusion of saline water. The review also described a positive correlation between precipitation and dengue, showing that greater frequency of rainy days and higher temperatures were favourable conditions for the propagation of dengue viruses [88].

6. Conclusions

There is no doubt that the COVID-19 pandemic is a serious global matter and has claimed the lives of many people worldwide. Many countries also faced economic downturns due to stringent lockdown measures implemented to curb the rapid global spread of COVID-19. However, there is a silver lining in this scenario, and this pandemic provided a once-in-a-lifetime opportunity to study the global atmospheric CO2 levels during the global lockdown. Although the concentration of CO2 in the atmosphere is relatively low, the high heat absorbing ability and long atmospheric lifespan of CO2 makes it the most important GHG to study and mitigate. If CO2 levels are not lowered quickly, we will be faced with global warming and more frequent and severe weather events. Thus, it has become a global mission to reduce CO2 emissions to prevent the global mean temperature from rising above 1.5 °C. There is strong evidence that the additional CO2 in the atmosphere comes from human activities, primarily the burning of fossil fuels. In order to reduce our reliance on fossil fuels, it is imperative that more research, funding, and political considerations are put into developing renewable sources of energy.

Author Contributions

C.H.T.: data curation, visualization, writing—original draft, and writing—review and editing; M.Y.O.: writing—review and editing; S.M.N.: conceptualization, supervision, writing—original draft, and writing—review and editing; A.H.S.: funding acquisition; P.L.S.: writing—review and editing. All authors have read and agreed to the published version of the manuscript.

Funding

This research was funded by AAIBE Chair of Renewable Energy (ChRE) (C.H. Tan under postdoctoral fellowship programme, and M.Y. Ong under project code 202006KETTHA). In addition, M.Y. Ong would also like to thank UNITEN for the UNITEN Postgraduate Excellence Scholarship 2019 (YCU-COGS). The APC was funded by BOLD Refresh Publication Fund 2021 under iRMC, UNITEN (grant: J5100D4103-BOLDREFRESH2025-CENTER OF EXCELLENCE).

Institutional Review Board Statement

Not applicable.

Informed Consent Statement

Not applicable.

Data Availability Statement

The CO2 emissions data for the world and major countries from 2019–2021 are publicly available online from https://carbonmonitor.org/ (accessed on 12 April 2021 and 8 July 2021). Malaysia’s daily CO2 emissions data in 2020 and annual CO2 emissions from 1959–2020 are publicly available online from https://www.icos-cp.eu/gcp-COVID19 (accessed on 10 July 2021) and https://www.icos-cp.eu/gcp-COVID19-v12 (accessed on 10 July 2021). The mean monthly temperature and rainfall data for Malaysia are publicly available online from https://www.ncdc.noaa.gov/cdo-web/datasets/GHCNDMS/locations/FIPS:MY/detail#stationlist (accessed on 30 April 2021) and https://www.worldweatheronline.com/malaysia-weather.aspx (accessed on 30 April 2021).

Acknowledgments

The authors would like to acknowledge UNITEN for the research facilities and funding.

Conflicts of Interest

The authors declare no conflict of interest.

Abbreviations

The following abbreviations are used in the manuscript:
12CCarbon-12 atom
13CCarbon-13 atom
14CCarbon-14 atom
CH4Methane
CMCOConditional Movement Control Order
CO2Carbon dioxide
COVID-19Coronavirus disease 2019
C-recyclingCarbon recycling
CTKCargo tonne kilometre
EJExajoules
EU27The 27 European Union countries after the UK left the EU
GDPGross domestic product
GHGGreenhouse gas
GtGiga tonnes
IATAInternational Air Transport Association
KJ/hKilojoules per hour
MCOMovement Control Order
mmMillimetre
MtMillion tonnes
N2ONitrous oxide
O3Ozone
ppmParts per million
RMCORecovery Movement Control Order
ROWRest of the world
RPKRevenue passenger kilometre
SOPStandard Operating Procedures
TWhTerawatt-hour
U.S.A.United States of America
UKUnited Kingdom
UNEPUnited Nations Environment Program

References

  1. Liu, Y.-C.; Kuo, R.-L.; Shih, S.-R. COVID-19: The first documented coronavirus pandemic in history. Biomed. J. 2020, 43, 328–333. [Google Scholar] [CrossRef]
  2. Maliszewska, M.; Mattoo, A.; Van der Mensbrugghe, D. The Potential Impact of COVID-19 on GDP and Trade: A Preliminary Assessment; The World Bank: Washington, DC, USA, 2020. [Google Scholar]
  3. Nicola, M.; Alsafi, Z.; Sohrabi, C.; Kerwan, A.; Al-Jabir, A.; Iosifidis, C.; Agha, M.; Agha, R. The socio-economic implications of the coronavirus and COVID-19 pandemic: A review. Int. J. Surg. 2020, 78, 185–193. [Google Scholar] [CrossRef]
  4. Liu, Z.; Ciais, P.; Deng, Z.; Lei, R.; Davis, S.J.; Feng, S.; Zheng, B.; Cui, D.; Dou, X.; Zhu, B. Near-real-time monitoring of global CO2 emissions reveals the effects of the COVID-19 pandemic. Nat. Commun. 2020, 11, 5172. [Google Scholar] [CrossRef]
  5. Dehghani-Sanij, A.; Bahadori, M.N. Energy consumption and environmental consequences. In Ice-Houses: Energy, Architecture, and Sustainability; Dehghani-Sanij, A., Bahadori, M.N., Eds.; Academic Press: Cambridge, MA, USA, 2021; pp. 1–55. [Google Scholar]
  6. Jackson, R.B.; Le Quéré, C.; Andrew, R.; Canadell, J.G.; Korsbakken, J.I.; Liu, Z.; Peters, G.P.; Zheng, B. Global energy growth is outpacing decarbonization. Environ. Res. Lett. 2018, 13, 120401. [Google Scholar] [CrossRef]
  7. Peters, G.P.; Andrew, R.M.; Canadell, J.G.; Friedlingstein, P.; Jackson, R.B.; Korsbakken, J.I.; Le Quéré, C.; Peregon, A. Carbon dioxide emissions continue to grow amidst slowly emerging climate policies. Nat. Clim. Chang. 2020, 10, 3–6. [Google Scholar] [CrossRef]
  8. International Energy Agency (IEA). Key Electricity Trends 2020: Annnual Trends from OECD Countries. Available online: https://www.iea.org/articles/key-electricity-trends-2020 (accessed on 21 July 2021).
  9. International Energy Agency (IEA). Net Zero by 2050: A Roadmap for the Global Energy Sector; IEA: Paris, France, 2021. [Google Scholar]
  10. Khallaghi, N.; Hanak, D.P.; Manovic, V. Techno-economic evaluation of near-zero CO2 emission gas-fired power generation technologies: A review. J. Nat. Gas. Sci. Eng. 2020, 74, 103095. [Google Scholar] [CrossRef]
  11. Tumanovskii, A.G.; Shvarts, A.L.; Somova, E.V.; Verbovetskii, E.K.; Avrutskii, G.D.; Ermakova, S.V.; Kalugin, R.N.; Lazarev, M.V. Review of the coal-fired, over-supercritical and ultra-supercritical steam power plants. Therm. Eng. 2017, 64, 83–96. [Google Scholar] [CrossRef]
  12. Hoseinzadeh, S.; Stephan Heyns, P. Advanced energy, exergy, and environmental (3E) analyses and optimization of a coal-fired 400 MW thermal power plant. J. Energy Resour Technol. 2021, 143, 082106. [Google Scholar] [CrossRef]
  13. International Energy Agency (IEA). Gas 2020: Analysing the Impact of the COVID-19 Pandemic on Global Natural Gas Markets; IEA: Paris, France, 2020. [Google Scholar]
  14. International Energy Agency (IEA). Coal 2020: Analysis and Forecast to 2025; IEA: Paris, France, 2020. [Google Scholar]
  15. Carbon Monitor. CO2 Emissions Variation (%): January 1st to December 31st, 2020 vs. January 1st to December 31st, 2019. Available online: https://carbonmonitor.org/ (accessed on 12 April 2021).
  16. Frankfurt School-UNEP Centre/BNEF. Global Trends in Renewable Energy Investment 2020; FS-UNEP Centre: Frankfurt, Germany, 2020. [Google Scholar]
  17. McCormick, K.; Kautto, N. The Bioeconomy in Europe: An Overview. Sustainability 2013, 5, 2589–2608. [Google Scholar] [CrossRef] [Green Version]
  18. Ollikainen, M. Forestry in bioeconomy—Smart green growth for the humankind. Scand. J. For. Res. 2014, 29, 360–366. [Google Scholar] [CrossRef]
  19. Pülzl, H.; Kleinschmit, D.; Arts, B. Bioeconomy—An emerging meta-discourse affecting forest discourses? Scand. J. For. Res. 2014, 29, 386–393. [Google Scholar] [CrossRef]
  20. Aresta, M.; Dibenedetto, A. Carbon Recycling Through CO2-Conversion for Stepping Toward a Cyclic-C Economy. A Perspective. Front. Energy Res. 2020, 8, 159. [Google Scholar] [CrossRef]
  21. Sikarwar, V.S.; Reichert, A.; Jeremias, M.; Manovic, V. COVID-19 pandemic and global carbon dioxide emissions: A first assessment. Sci. Total Environ. 2021, 794, 148770. [Google Scholar] [CrossRef] [PubMed]
  22. Naderipour, A.; Abdul-Malek, Z.; Ahmad, N.A.; Kamyab, H.; Ashokkumar, V.; Ngamcharussrivichai, C.; Chelliapan, S. Effect of COVID-19 virus on reducing GHG emission and increasing energy generated by renewable energy sources: A brief study in Malaysian context. Environ. Technol. Innov. 2020, 20, 101151. [Google Scholar] [CrossRef]
  23. Yusup, Y.; Kayode, J.S.; Ahmad, M.I.; Yin, C.S.; Hisham, M.S.M.N.; Isa, H.M. Atmospheric CO2 and total electricity production before and during the nation-wide restriction of activities as a consequence of the COVID-19 pandemic. arXiv 2020, arXiv:2006.04407. [Google Scholar]
  24. Maslin, M. Global Warming: A Very Short Introduction, 2nd ed.; Oxford University Press: Oxford, UK, 2008. [Google Scholar] [CrossRef]
  25. NASA—Global Climate Change. The Causes of Climate Change. Available online: https://climate.nasa.gov/causes/ (accessed on 9 May 2021).
  26. NASA—Global Climate Change. The Atmosphere: Getting a Handle on Carbon Dioxide. Available online: https://climate.nasa.gov/news/2915/the-atmosphere-getting-a-handle-on-carbon-dioxide/ (accessed on 15 October 2020).
  27. Lacis, A.A.; Schmidt, G.A.; Rind, D.; Ruedy, R.A. Atmospheric CO2: Principal control knob governing Earth’s temperature. Science 2010, 330, 356–359. [Google Scholar] [CrossRef] [Green Version]
  28. Hansen, J.; Sato, M.; Hearty, P.; Ruedy, R.; Kelley, M.; Masson-Delmotte, V.; Russell, G.; Tselioudis, G.; Cao, J.; Rignot, E. Ice melt, sea level rise and superstorms: Evidence from paleoclimate data, climate modeling, and modern observations that 2 C global warming could be dangerous. Atmos. Chem. Phys. 2016, 16, 3761–3812. [Google Scholar] [CrossRef] [Green Version]
  29. Lacis, A.A.; Hansen, J.E.; Russell, G.L.; Oinas, V.; Jonas, J. The role of long-lived greenhouse gases as principal LW control knob that governs the global surface temperature for past and future climate change. Tellus B Chem. Phys. Meteorol. 2013, 65, 19734. [Google Scholar] [CrossRef]
  30. Archer, D.; Eby, M.; Brovkin, V.; Ridgwell, A.; Cao, L.; Mikolajewicz, U.; Caldeira, K.; Matsumoto, K.; Munhoven, G.; Montenegro, A. Atmospheric lifetime of fossil fuel carbon dioxide. Annu. Rev. Earth Planet. Sci 2009, 37, 117–134. [Google Scholar] [CrossRef] [Green Version]
  31. Lüthi, D.; Le Floch, M.; Bereiter, B.; Blunier, T.; Barnola, J.-M.; Siegenthaler, U.; Raynaud, D.; Jouzel, J.; Fischer, H.; Kawamura, K. High-resolution carbon dioxide concentration record 650,000–800,000 years before present. Nature 2008, 453, 379–382. [Google Scholar] [CrossRef]
  32. Jouzel, J.; Masson-Delmotte, V.; Cattani, O.; Dreyfus, G.; Falourd, S.; Hoffmann, G.; Minster, B.; Nouet, J.; Barnola, J.-M.; Chappellaz, J. Orbital and millennial Antarctic climate variability over the past 800,000 years. Science 2007, 317, 793–796. [Google Scholar] [CrossRef] [Green Version]
  33. NASA—Earth Observatory. Changes in the Carbon Cycle. Available online: https://earthobservatory.nasa.gov/features/CarbonCycle/page4.php (accessed on 9 May 2021).
  34. Joos, F.; Spahni, R. Rates of change in natural and anthropogenic radiative forcing over the past 20,000 years. Proc. Natl. Acad. Sci. USA 2008, 105, 1425–1430. [Google Scholar] [CrossRef] [PubMed] [Green Version]
  35. IEA Bioenergy. Is Energy from Woody Biomass Positive for the Climate? IEA Bioenergy: Paris, France, 2018. [Google Scholar]
  36. International Energy Agency (IEA). Global Energy Reviews 2021: Renewables; IEA: Paris, France, 2021. [Google Scholar]
  37. International Energy Agency (IEA). COVID-19 Impact on Electricity; IEA: Paris, France, 2021. [Google Scholar]
  38. U.S. Energy Information Administration (EIA). Hourly Electricity Consumption Varies throughout the Day and Across Seasons. Available online: https://www.eia.gov/todayinenergy/detail.php?id=42915 (accessed on 10 May 2021).
  39. Liu, Z.; Deng, Z.; Ciais, P.; Lei, R.; Davis, S.J.; Feng, S.; Zheng, B.; Cui, D.; Dou, X.; He, P. COVID-19 Causes Record Decline in Global CO2 Emissions. Available online: https://escholarship.org/uc/item/2fv7n055 (accessed on 26 May 2021).
  40. Oliver, J.; Peters, J. Trends in Global CO2 and Total Greenhouse Gas Emissions: 2019 Report; PBL Netherlands Environmental Assessment Agency: The Hague, The Netherlands, 2019. [Google Scholar]
  41. Liu, Z.; Ciais, P.; Deng, Z.; Davis, S.J.; Zheng, B.; Wang, Y.; Cui, D.; Zhu, B.; Dou, X.; Ke, P. Carbon Monitor, a near-real-time daily dataset of global CO2 emission from fossil fuel and cement production. Sci. Data 2020, 7, 392. [Google Scholar] [CrossRef] [PubMed]
  42. IATA. Air Passenger Market Analysis: April 2020; IATA: Montreal, QC, Canada, 2020. [Google Scholar]
  43. IATA. Air Passenger Market Analysis: August 2020; IATA: Montreal, QC, Canada, 2020. [Google Scholar]
  44. IATA. Air Cargo Market Analysis: April 2020; IATA: Montreal, QC, Canada, 2020. [Google Scholar]
  45. IATA. Air Cargo Market Analysis: August 2020; IATA: Montreal, QC, Canada, 2020. [Google Scholar]
  46. Carbon Monitor. CO2 Emissions Variation (%): January 1st to May 31st, 2021 vs. January 1st to May 31st, 2020. Available online: https://carbonmonitor.org/ (accessed on 8 July 2021).
  47. Dlugokencky, E.; Tans, P. Trends in Atmospheric Carbon Dioxide. Available online: https://www.esrl.noaa.gov/gmd/ccgg/trends/global.html (accessed on 9 May 2021).
  48. NOAA. Carbon Dioxide Peaks Near 420 Parts per Million at Mauna Loa Observatory. Available online: https://research.noaa.gov/article/ArtMID/587/ArticleID/2764/Coronavirus-response-barely-slows-rising-carbon-dioxide (accessed on 8 July 2021).
  49. Forster, P.M.; Forster, H.I.; Evans, M.J.; Gidden, M.J.; Jones, C.D.; Keller, C.A.; Lamboll, R.D.; Le Quéré, C.; Rogelj, J.; Rosen, D. Current and future global climate impacts resulting from COVID-19. Nat. Clim. Chang. 2020, 10, 913–919. [Google Scholar] [CrossRef]
  50. Jackson, R.; Friedlingstein, P.; Andrew, R.; Canadell, J.; Le Quéré, C.; Peters, G. Persistent fossil fuel growth threatens the Paris Agreement and planetary health. Environ. Res. Lett. 2019, 14, 121001. [Google Scholar] [CrossRef] [Green Version]
  51. Le Quéré, C.; Jackson, R.B.; Jones, M.W.; Smith, A.J.; Abernethy, S.; Andrew, R.M.; De-Gol, A.J.; Shan, Y.; Canadell, J.G.; Friedlingstein, P.; et al. Temporary reduction in daily global CO2 emissions during the COVID-19 forced confinement (Version 1.3). Glob. Carbon Project 2020. [Google Scholar] [CrossRef]
  52. DG of Health Malaysia. Press Statement 1 Mar 2020—Updates on the Coronavirus Disease 2019 (COVID-19): Situation in Malaysia. Available online: https://kpkesihatan.com/2020/03/01/kenyataan-akhbar-kpk-1-mac-2020-situasi-semasa-jangkitan-penyakit-coronavirus-2019-COVID-19-di-malaysia/ (accessed on 8 July 2021).
  53. DG of Health Malaysia. Press Statement 16 Mar 2020—Updates on the Coronavirus Disease 2019 (COVID-19): Situation in Malaysia. Available online: https://kpkesihatan.com/2020/03/16/kenyataan-akhbar-ybmk-16-mac-2020-situasi-semasa-jangkitan-penyakit-coronavirus-2019-COVID-19-di-malaysia/ (accessed on 8 July 2021).
  54. Prime Minister’s Office of Malaysia. The Prime Minister’s Special Message on COVID-19—16 March 2020. Available online: https://www.pmo.gov.my/2020/03/perutusan-khas-yab-perdana-menteri-mengenai-COVID-19-16-mac-2020/ (accessed on 8 July 2021).
  55. Tang, K.H.D. Movement control as an effective measure against COVID-19 spread in Malaysia: An overview. J. Public Health 2020, 1–4. [Google Scholar] [CrossRef]
  56. DG of Health Malaysia. Press Statement 4 May 2020—Updates on the Coronavirus Disease 2019 (COVID-19): Situation in Malaysia. Available online: https://kpkesihatan.com/2020/05/04/kenyataan-akhbar-kpk-4-mei-2020-situasi-semasa-jangkitan-penyakit-coronavirus-2019-COVID-19-di-malaysia/ (accessed on 8 July 2021).
  57. The Star. PM: CMCO Extended Till June 9. Available online: https://www.thestar.com.my/news/nation/2020/05/11/pm-cmco-extended-till-june-9 (accessed on 8 July 2021).
  58. New Straits Times. CMCO to End, Replaced with RMCO Until Aug 31. Available online: https://www.nst.com.my/news/nation/2020/06/598700/cmco-end%C2%A0replaced-rmco-until-aug-31 (accessed on 8 July 2021).
  59. New Straits Times. RMCO Extended Until Dec 31, Says PM Muhyiddin. Available online: https://www.nst.com.my/news/nation/2020/08/620307/rmco-extended-until-dec-31-says-pm-muhyiddin (accessed on 8 July 2021).
  60. The Sun Daily. RMCO Extended Till March 31 (Updated). Available online: https://www.thesundaily.my/home/rmco-extended-till-march-31-updated-DJ5902252 (accessed on 8 July 2021).
  61. NASA—Global Climate Change. A Degree of Concern: Why Global Temperatures Matter. Available online: https://climate.nasa.gov/news/2878/a-degree-of-concern-why-global-temperatures-matter/ (accessed on 19 April 2021).
  62. United Nations. Growing at a Slower Pace, World Population Is Expected to Reach 9.7 Billion in 2050 and Could Peak at Nearly 11 Billion around 2100. Available online: https://www.un.org/development/desa/en/news/population/world-population-prospects-2019.html (accessed on 19 April 2021).
  63. International Atomic Energy Agency (IAEA). Energy, Electricity and Nuclear Power Estimates for the Period up to 2050; IAEA: Vienna, Austria, 2020. [Google Scholar]
  64. U.S. Energy Information Administration (IEA). EIA Projects Nearly 50% Increase in World Energy Usage by 2050, Led by Growth in Asia. Available online: https://www.eia.gov/todayinenergy/detail.php?id=41433 (accessed on 19 April 2021).
  65. Ab Rahman, A.K.; Abdullah, R.; Balu, N.; Shariff, F.M. The impact of La Niña and El Niño events on crude palm oil prices: An econometric analysis. Oil Palm Ind. Econ. J. 2013, 13, 38–51. [Google Scholar]
  66. Department of Statistics Malaysia. Current Population Estimates, Malaysia. 2020. Available online: https://www.dosm.gov.my/v1/index.php?r=column/cthemeByCat&cat=155&bul_id=OVByWjg5YkQ3MWFZRTN5bDJiaEVhZz09&menu_id=L0pheU43NWJwRWVSZklWdzQ4TlhUUT09 (accessed on 10 May 2021).
  67. Kwan, M.S.; Tangang, F.T.; Juneng, L. Projected changes of future climate extremes in Malaysia. Sains Malays. 2013, 42, 1051–1059. [Google Scholar]
  68. NOAA. Monthly Summaries Location Details: Malaysia. Available online: https://www.ncdc.noaa.gov/cdo-web/datasets/GHCNDMS/locations/FIPS:MY/detail#stationlist (accessed on 30 April 2021).
  69. World Weather Online. World Weather: Malaysia. Available online: https://www.worldweatheronline.com/malaysia-weather.aspx (accessed on 30 April 2021).
  70. Malaysia Meteorological Department. Climate Change Scenarios for Malaysia 2001–2099; Malaysia Meteorological Department: Petaling Jaya, Malaysia, 2009. [Google Scholar]
  71. Ministry of Natural Resources and Environment Malaysia. Malaysia: Biennial Update Report to the UNFCCC; Ministry of Natural Resources and Environment Malaysia: Petaling Jaya, Malaysia, 2015. [Google Scholar]
  72. Sammathuria, M.; Ling, L. Regional climate observation and simulation of extreme temperature and precipitation trends. In Proceedings of the 14th International Rainwater Catchment Systems Conference, Kuala Lumpur, Malaysia, 3–6 August 2009; pp. 3–6. [Google Scholar]
  73. Khor, M. Lessons from the Great Floods. Available online: https://www.thestar.com.my/opinion/columnists/global-trends/2015/01/19/lessons-from-the-great-floods/ (accessed on 30 April 2021).
  74. CFE-DMHA. Malaysia: Disaster Management Reference Handbook (June 2019). Available online: https://reliefweb.int/report/malaysia/malaysia-disaster-management-reference-handbook-june-2019 (accessed on 9 May 2021).
  75. Tang, K.H.D. Climate change in Malaysia: Trends, contributors, impacts, mitigation and adaptations. Sci. Total Environ. 2019, 650, 1858–1871. [Google Scholar] [CrossRef] [PubMed]
  76. Loh, J.L.; Tangang, F.; Juneng, L.; Hein, D.; Lee, D.-I. Projected rainfall and temperature changes over Malaysia at the end of the 21st century based on PRECIS modelling system. Asia Pac. J. Atmos. Sci. 2016, 52, 191–208. [Google Scholar] [CrossRef]
  77. Chang, C.; Harr, P.A.; Chen, H.-J. Synoptic disturbances over the equatorial South China Sea and western Maritime Continent during boreal winter. Mon. Weather Rev. 2005, 133, 489–503. [Google Scholar] [CrossRef]
  78. Mayowa, O.O.; Pour, S.H.; Shahid, S.; Mohsenipour, M.; Harun, S.B.; Heryansyah, A.; Ismail, T. Trends in rainfall and rainfall-related extremes in the east coast of peninsular Malaysia. J. Earth Syst. Sci. 2015, 124, 1609–1622. [Google Scholar] [CrossRef] [Green Version]
  79. Murad, W.; Molla, R.I.; Mokhtar, M.B.; Raquib, A. Climate change and agricultural growth: An examination of the link in Malaysia. Int. J. Clim. Chang. Strateg. Manag. 2010, 2, 403–417. [Google Scholar] [CrossRef]
  80. Matthews, R.B.; Kropff, M.J.; Bachelet, D.; van Laar, H. Modeling the Impact of Climate Change on Rice Production in Asia; CAB International and International Rice Research Institute: Wallingford, UK, 1995. [Google Scholar]
  81. Shaaban, A.J.; Amin, M.; Chen, Z.; Ohara, N. Regional modeling of climate change impact on Peninsular Malaysia water resources. J. Hydrol. Eng. 2011, 16, 1040–1049. [Google Scholar] [CrossRef]
  82. Shahid, S.; Pour, S.H.; Wang, X.; Shourav, S.A.; Minhans, A.; bin Ismail, T. Impacts and adaptation to climate change in Malaysian real estate. Int. J. Clim. Chang. Strateg. Manag. 2017, 9, 87–103. [Google Scholar] [CrossRef]
  83. Shaffril, H.A.M.; Samah, B.A.; D’Silva, J.L. The process of social adaptation towards climate change among Malaysian fishermen. Int. J. Clim. Chang. Strateg. Manag. 2013, 5, 38–53. [Google Scholar] [CrossRef] [Green Version]
  84. Yaakob, O.; Quah, P.C. Weather downtime and its effect on fishing operation in Peninsular Malaysia. J. Teknol. 2005, 42, 13–26. [Google Scholar] [CrossRef]
  85. Yau, Y.H.; Hasbi, S. A Comprehensive Case Study of Climate Change Impacts on the Cooling Load in an Air-Conditioned Office Building in Malaysia. Energy Procedia 2017, 143, 295–300. [Google Scholar] [CrossRef]
  86. Leng, L.Y.; Ahmed, O.H.; Jalloh, M.B. Brief review on climate change and tropical peatlands. Geosci. Front. 2019, 10, 373–380. [Google Scholar] [CrossRef]
  87. Naish, S.; Dale, P.; Mackenzie, J.S.; McBride, J.; Mengersen, K.; Tong, S. Climate change and dengue: A critical and systematic review of quantitative modelling approaches. BMC Infect. Dis. 2014, 14, 167. [Google Scholar] [CrossRef] [PubMed] [Green Version]
  88. Alhoot, M.A.; Tong, W.T.; Low, W.Y.; Sekaran, S.D. Climate Change and Health: The Malaysia Scenario. In Climate Change and Human Health Scenario in South and Southeast Asia; Akhtar, R., Ed.; Springer International Publishing: Cham, Switzerland, 2016; pp. 243–268. [Google Scholar]
Figure 1. Changes in CO2 emissions (million tonnes (Mt)) during 2019–2020 (ROW = rest of the world).
Sustainability 13 08461 g001
Figure 2. Changes in CO2 emissions (million tonnes (Mt)) in different sectors for various regions and countries.
Sustainability 13 08461 g002
Figure 3. Comparison of CO2 emissions from the first five months in 2019, 2020, and 2021 for major contributing countries/regions (ROW = rest of the world). The percentage differences in emissions are based on the previous year.
Sustainability 13 08461 g003
Figure 4. Malaysia’s daily CO2 emissions in 2020, represented as the difference in daily emissions compared to the mean 2019 levels. Values are in million tonnes of CO2 per day (MtCO2/d).
Sustainability 13 08461 g004
Figure 5. Malaysia’s CO2 emissions from 1959–2020 in million tonnes of CO2 per year (MtCO2/year).
Sustainability 13 08461 g005
Figure 6. Mean monthly temperature in (a) Kota Kinabalu (1956–2020), (b) Kuching (1956–2020), (c) Malacca (1961–2020), (d) Subang (1961–2020), and (e) Kuantan (1961–2020).
Sustainability 13 08461 g006
Figure 7. Mean monthly precipitation levels in (a) Kota Kinabalu (1956–2020), (b) Kuching (1956–2020), (c) Malacca (1961–2020), (d) Subang (1961–2020), and (e) Kuantan (1961–2020).
Sustainability 13 08461 g007
Table 1. Major floods in Malaysia [74,75].
DateLocationEvent
Jan 1971Kuala Lumpur, MalaysiaMost extreme flood in Malaysia since 1926. Caused by heavy monsoon rains. 32 deaths and 180,000 people affected.
Dec 2006–Jan 2007West MalaysiaJohor was severely affected. Malacca, Pahang, and Negeri Sembilan were affected to a lesser extent. Caused by heavy rain following Typhoon Utor.
Oct–Nov 2010Thailand and Northern Peninsular MalaysiaFlooding caused by abnormally late monsoon rains from the La Nina event and the Bay of Bengal. Killed 232 people in Thailand and 4 in Malaysia.
Jan–Feb 2014Sabah, MalaysiaHeavy rainfall and flash flooding in various regions of Sabah.
Dec 2014–Jan 2015Southeast Asia and South AsiaNortheast monsoon caused flooding in South Thailand, West Malaysia, Indonesia, and Sri Lanka. More than 417,000 people were affected.
Jan–Feb 2015East MalaysiaStronger northeast monsoon causing floods in many regions of Sarawak and Sabah, affecting roughly 13,878 people.
Feb–Mar 2016MalaysiaHeavy rainfall causing floods in Sarawak, Johor, Malacca, and part of Negeri Sembilan.
Dec 2016–early 2017Southern Thailand and Northern Peninsular Malaysia Northeast monsoon caused floods in southern Thailand and in Kelantan and Terengganu, northern Peninsular Malaysia. Resulted in a loss of roughly USD 4 billion due to the infrastructure damage and disruption of agriculture and tourism.
Nov 2017Penang and Kedah, Malaysia Flash floods due to hours of torrential rain in Penang killed a minimum of 7 people. The Malaysian military personnel assisted in evacuating more than 3500 people. In Kedah, floods displaced more than 2000 people.
2017Kundang, MalaysiaMore than 6000 people were affected by flash floods and landslides. A few stretches of roads, infrastructure, and properties were severely damaged.
Jan 2018Malaysia Downpour due to annual monsoon created severe flooding in six states. About 5000 people were displaced in Pahang. The hardest hit state, Kuantan, saw 3931 people displaced by floods and stayed in 22 evacuation centers.
Feb 2018Sarawak, MalaysiaFlooding due to heavy rainfall displaced 4859 people. 25 evacuation centers were set up for the flood victims.
Publisher’s Note: MDPI stays neutral with regard to jurisdictional claims in published maps and institutional affiliations.

