
Do Attention and Memory Tasks Require the Same Lighting? A Study in University Classrooms


Abstract
:1. Introduction
2. Materials and Methods
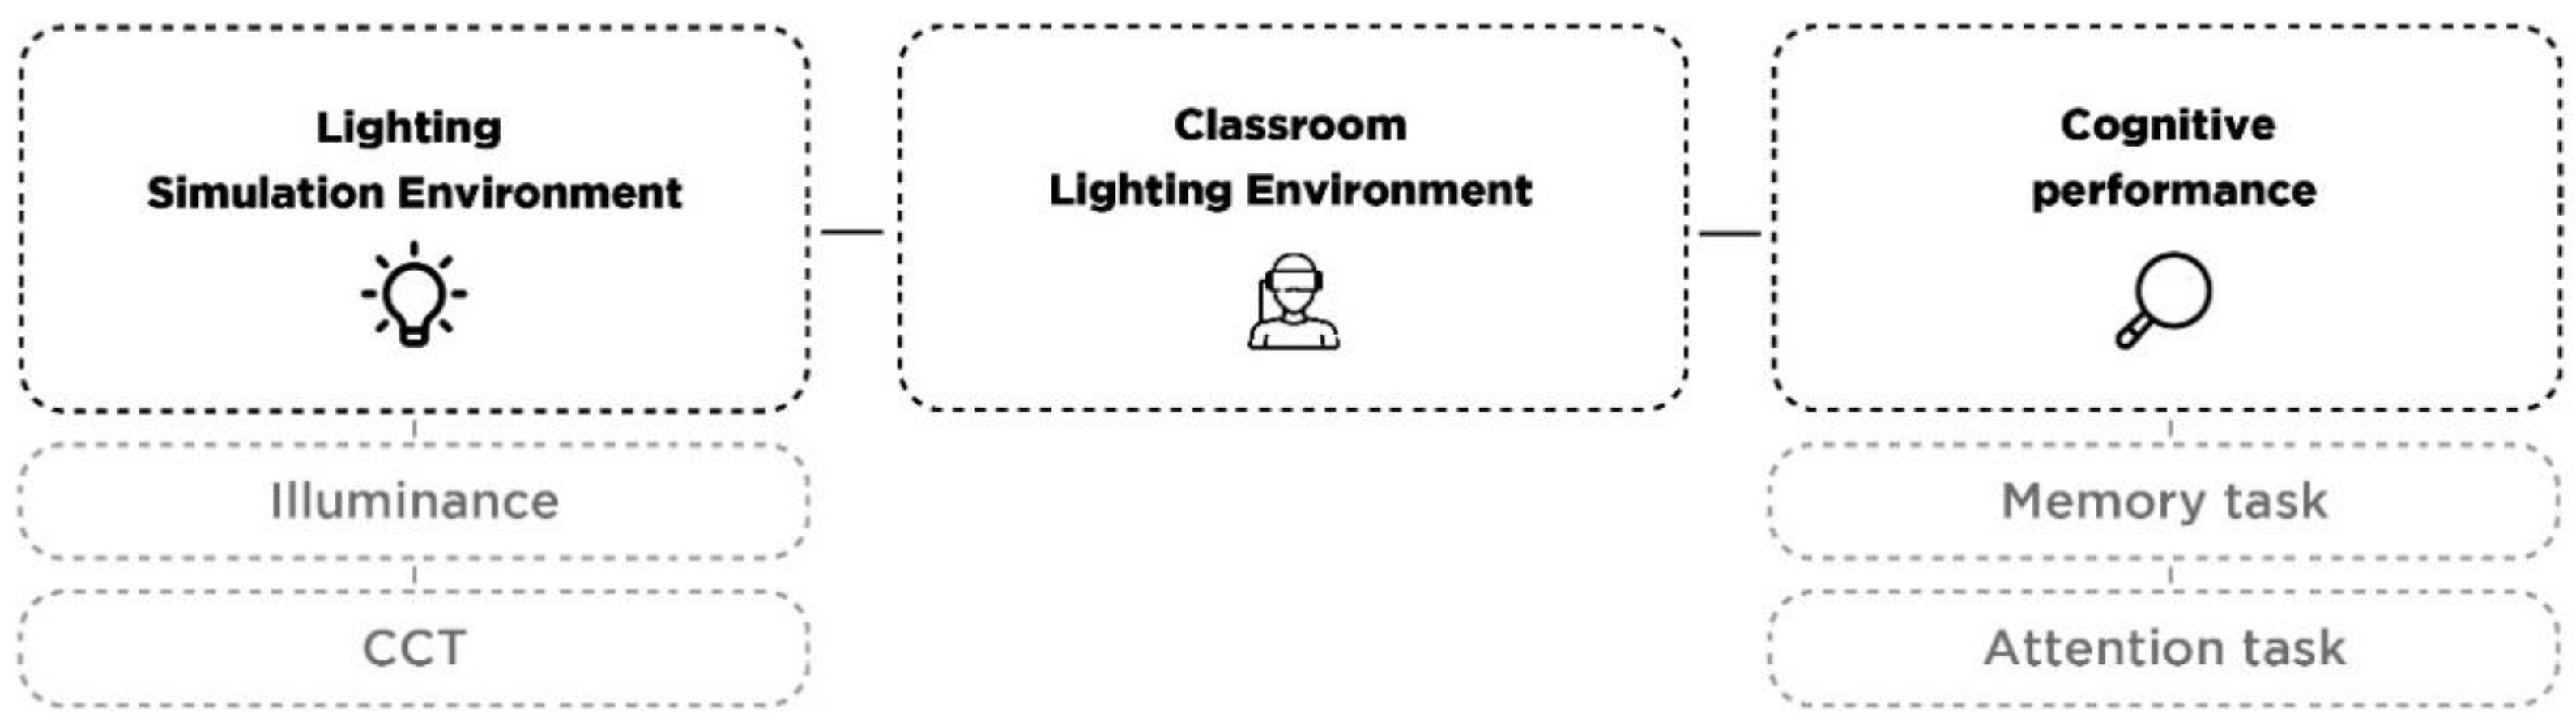
2.1. Stimuli
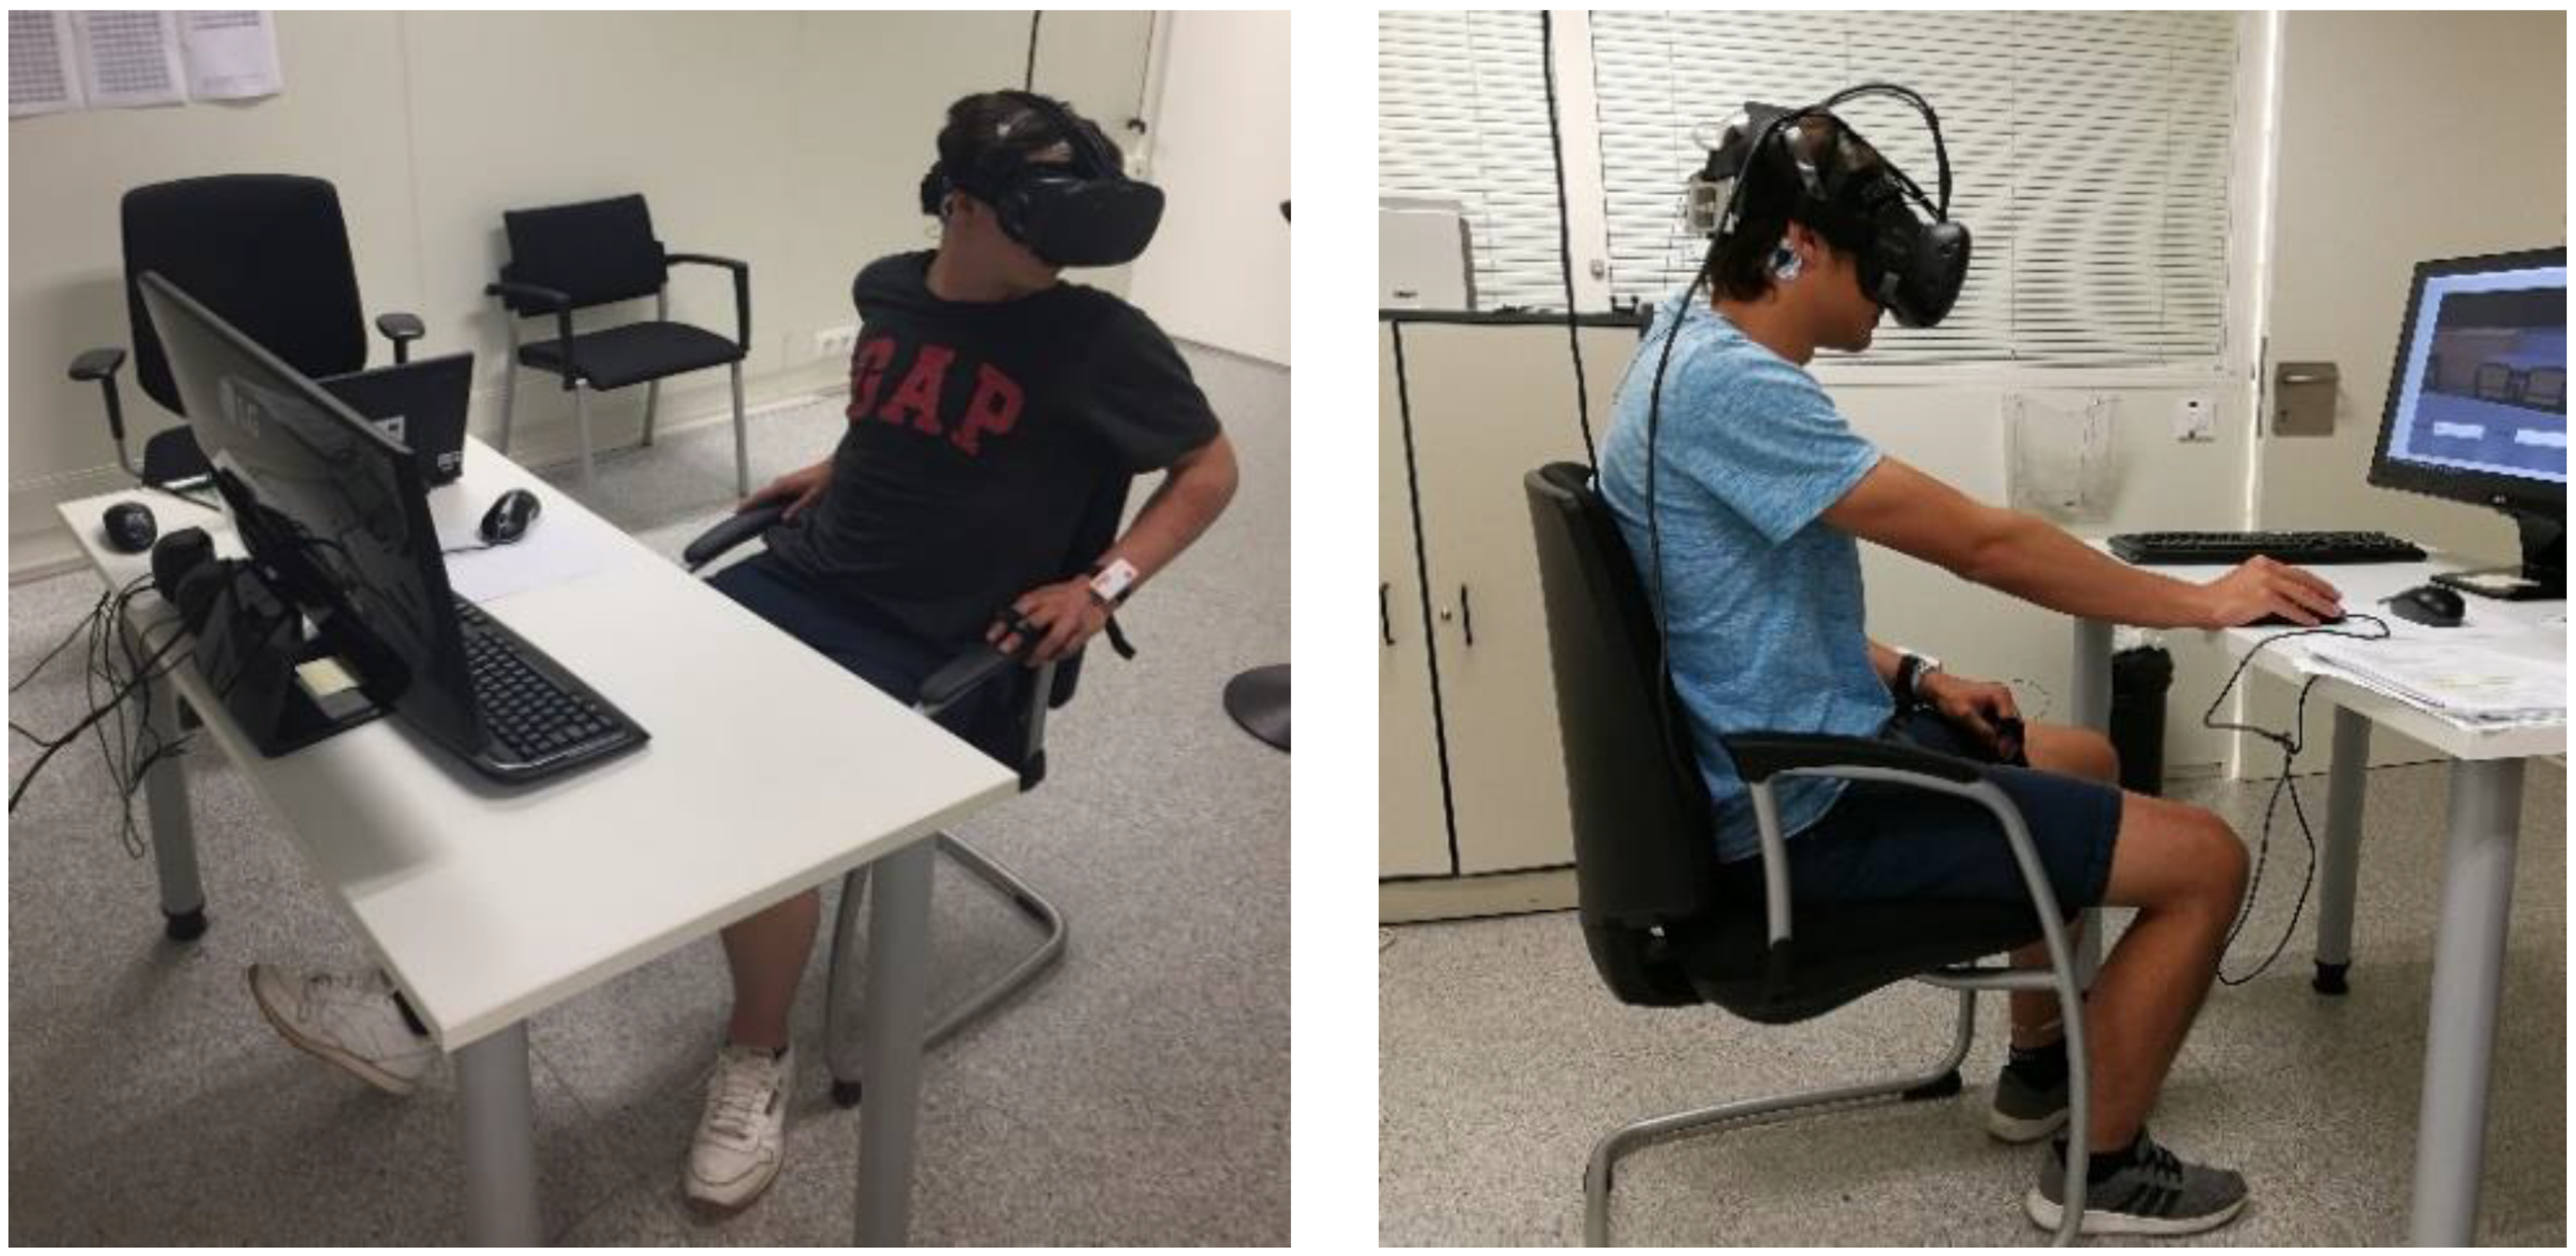
2.2. Environmental Simulation Set-Ups
2.3. Participants
2.4. Data Analysis
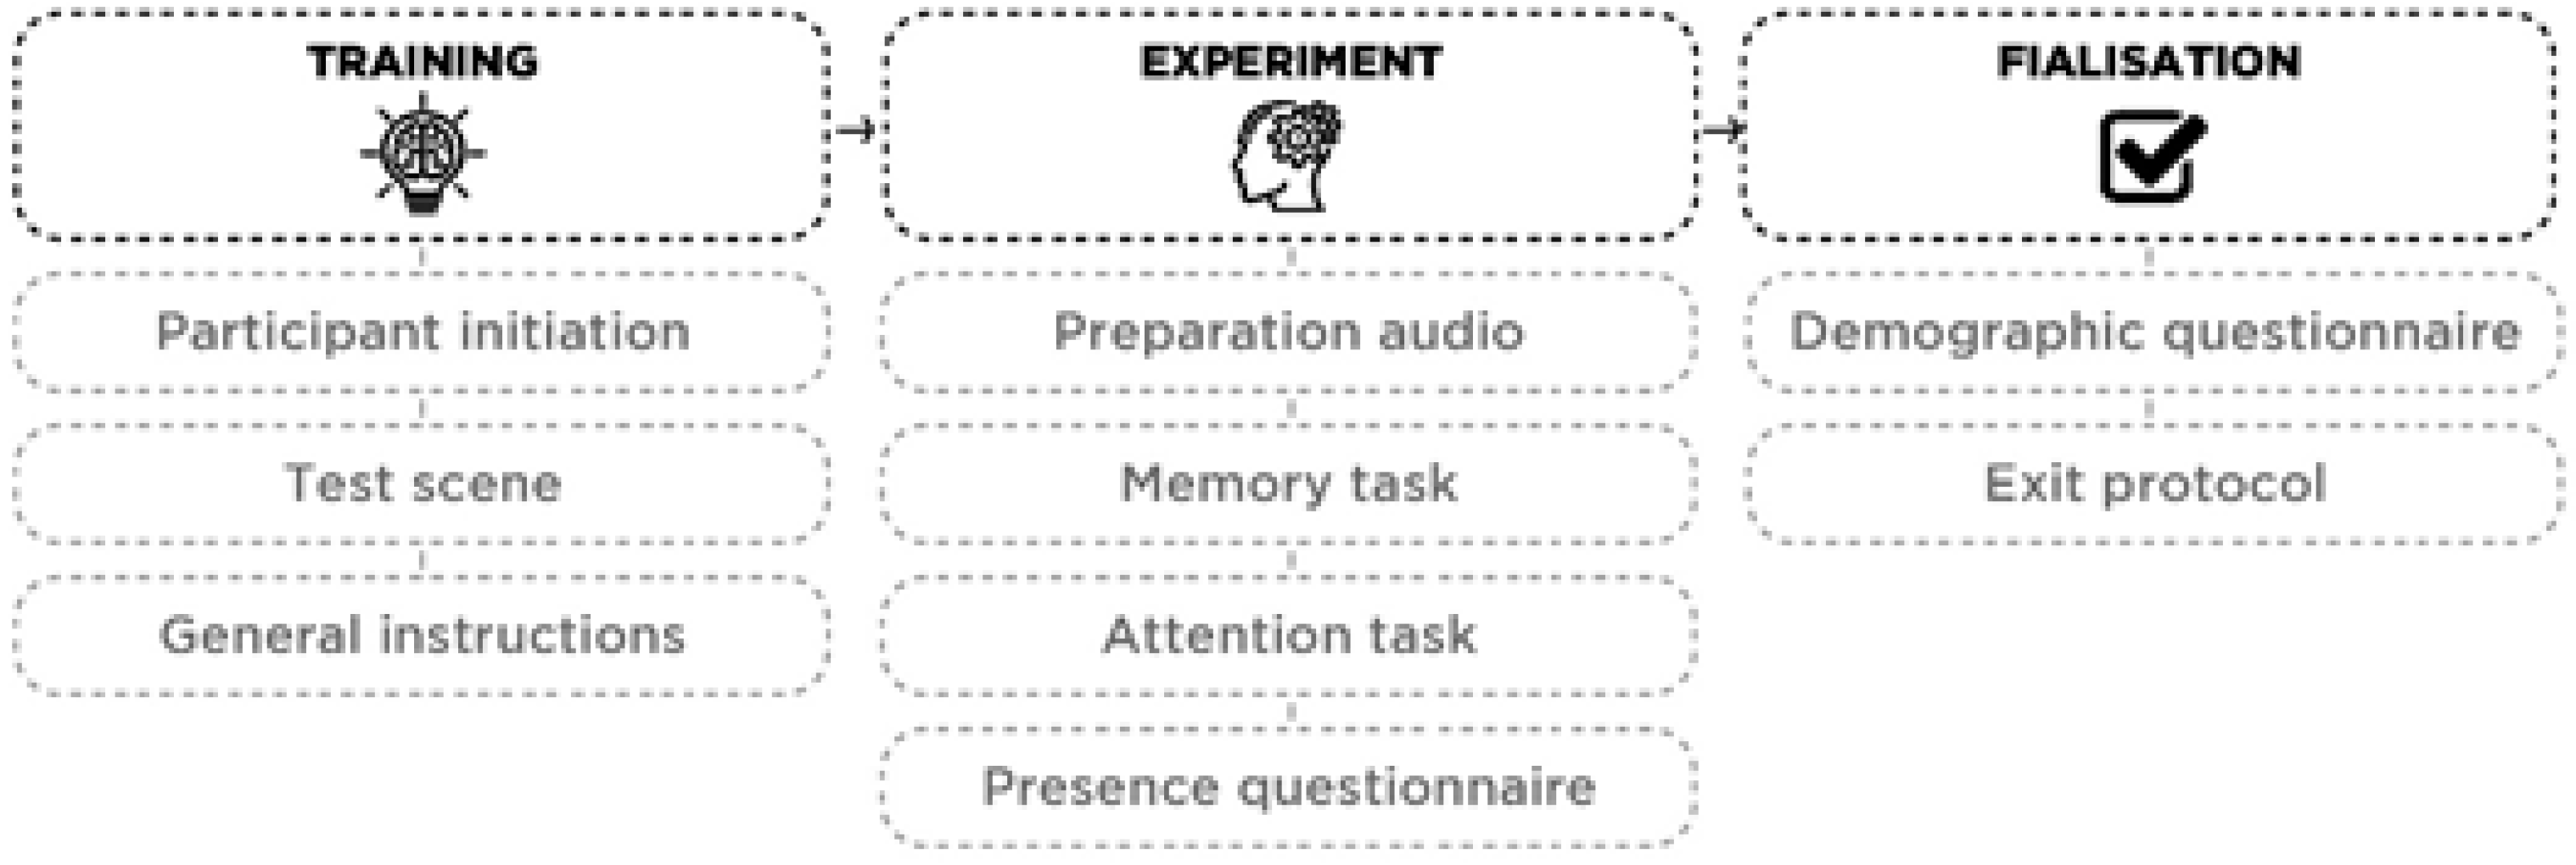
2.5. Procedure
2.6. Statistical Analysis
3. Results
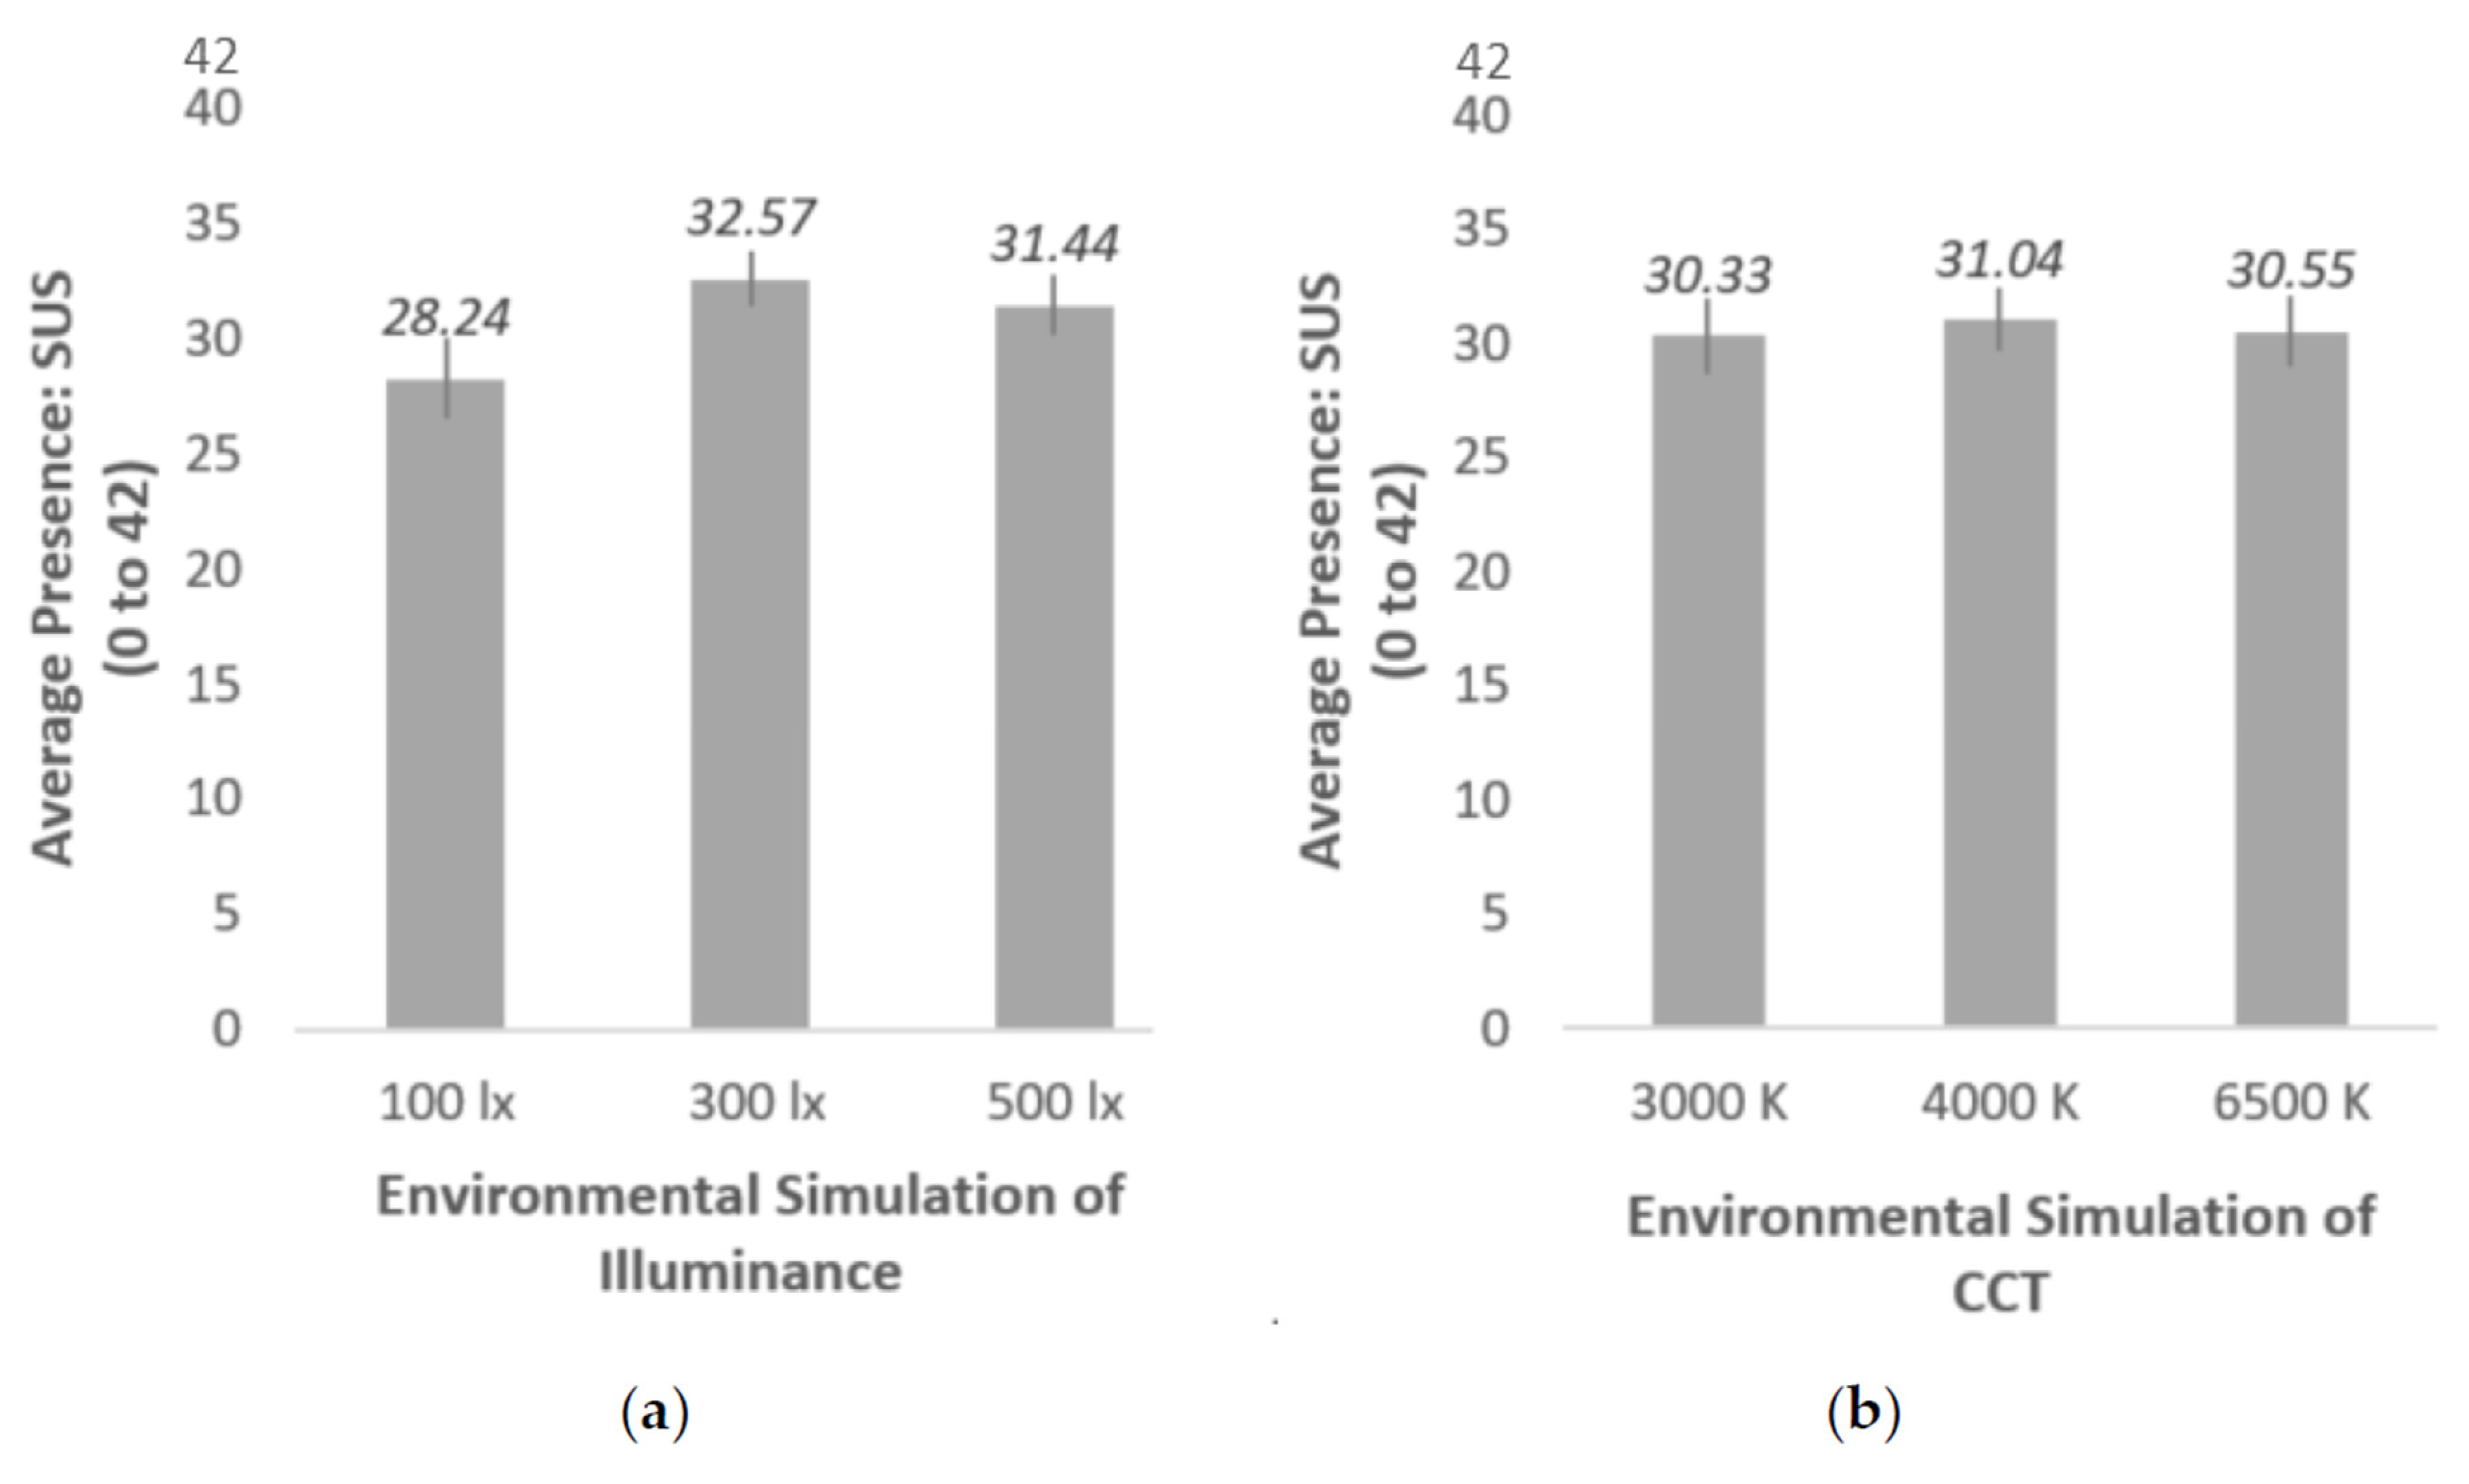
3.1. Validation of the VR Environment
3.2. Memory Analysis as a Function of the Classroom Lighting Environment
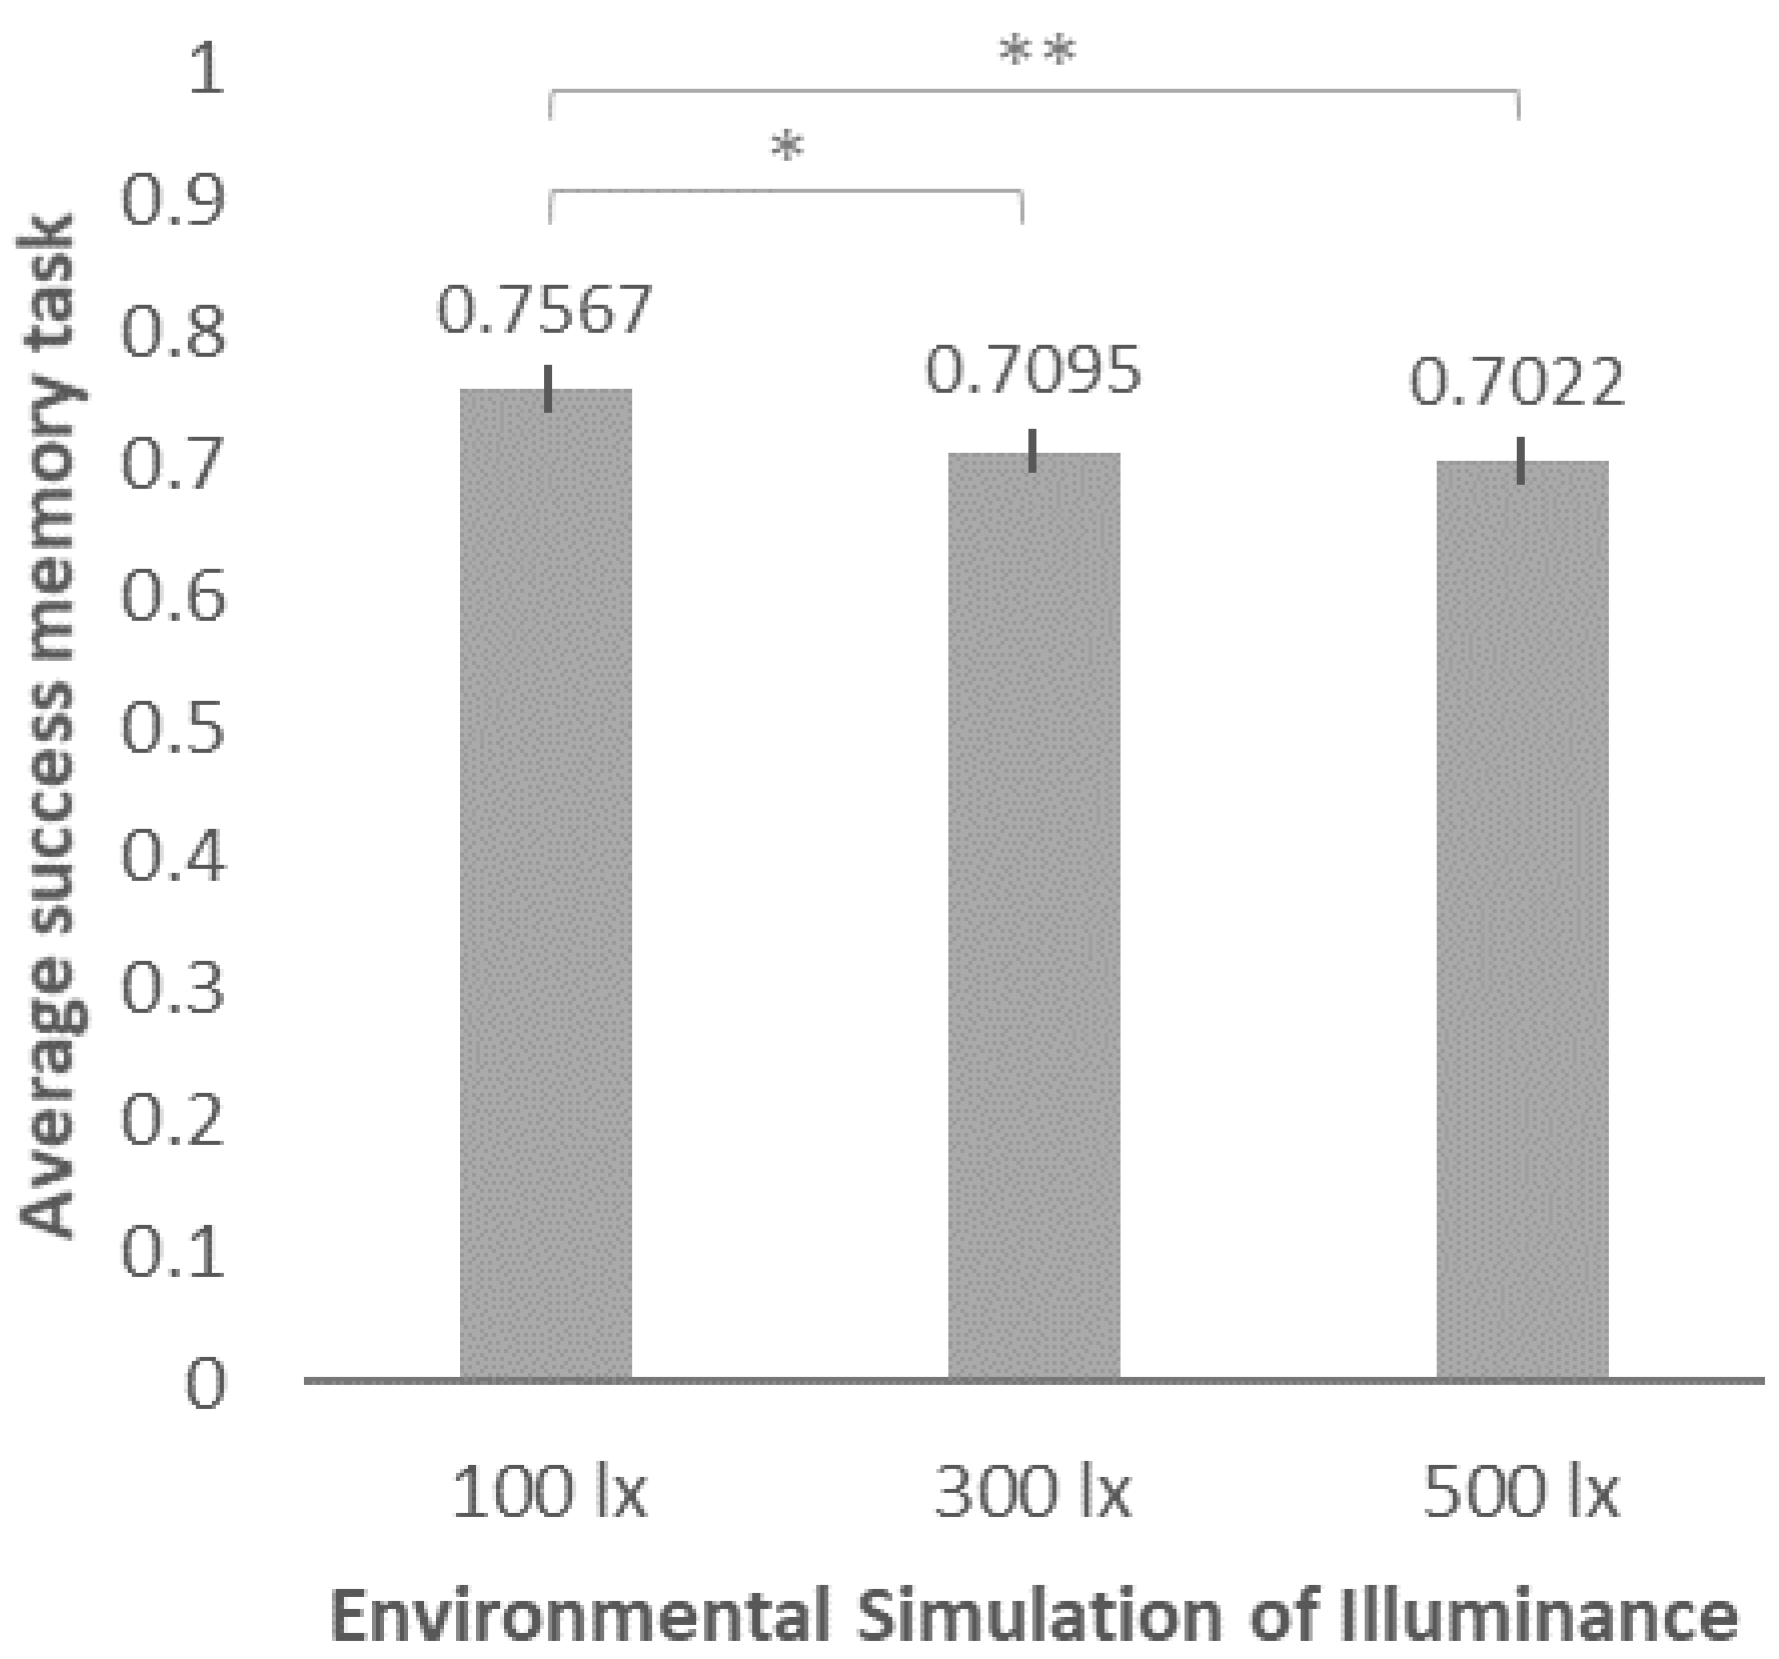
3.2.1. Illuminance
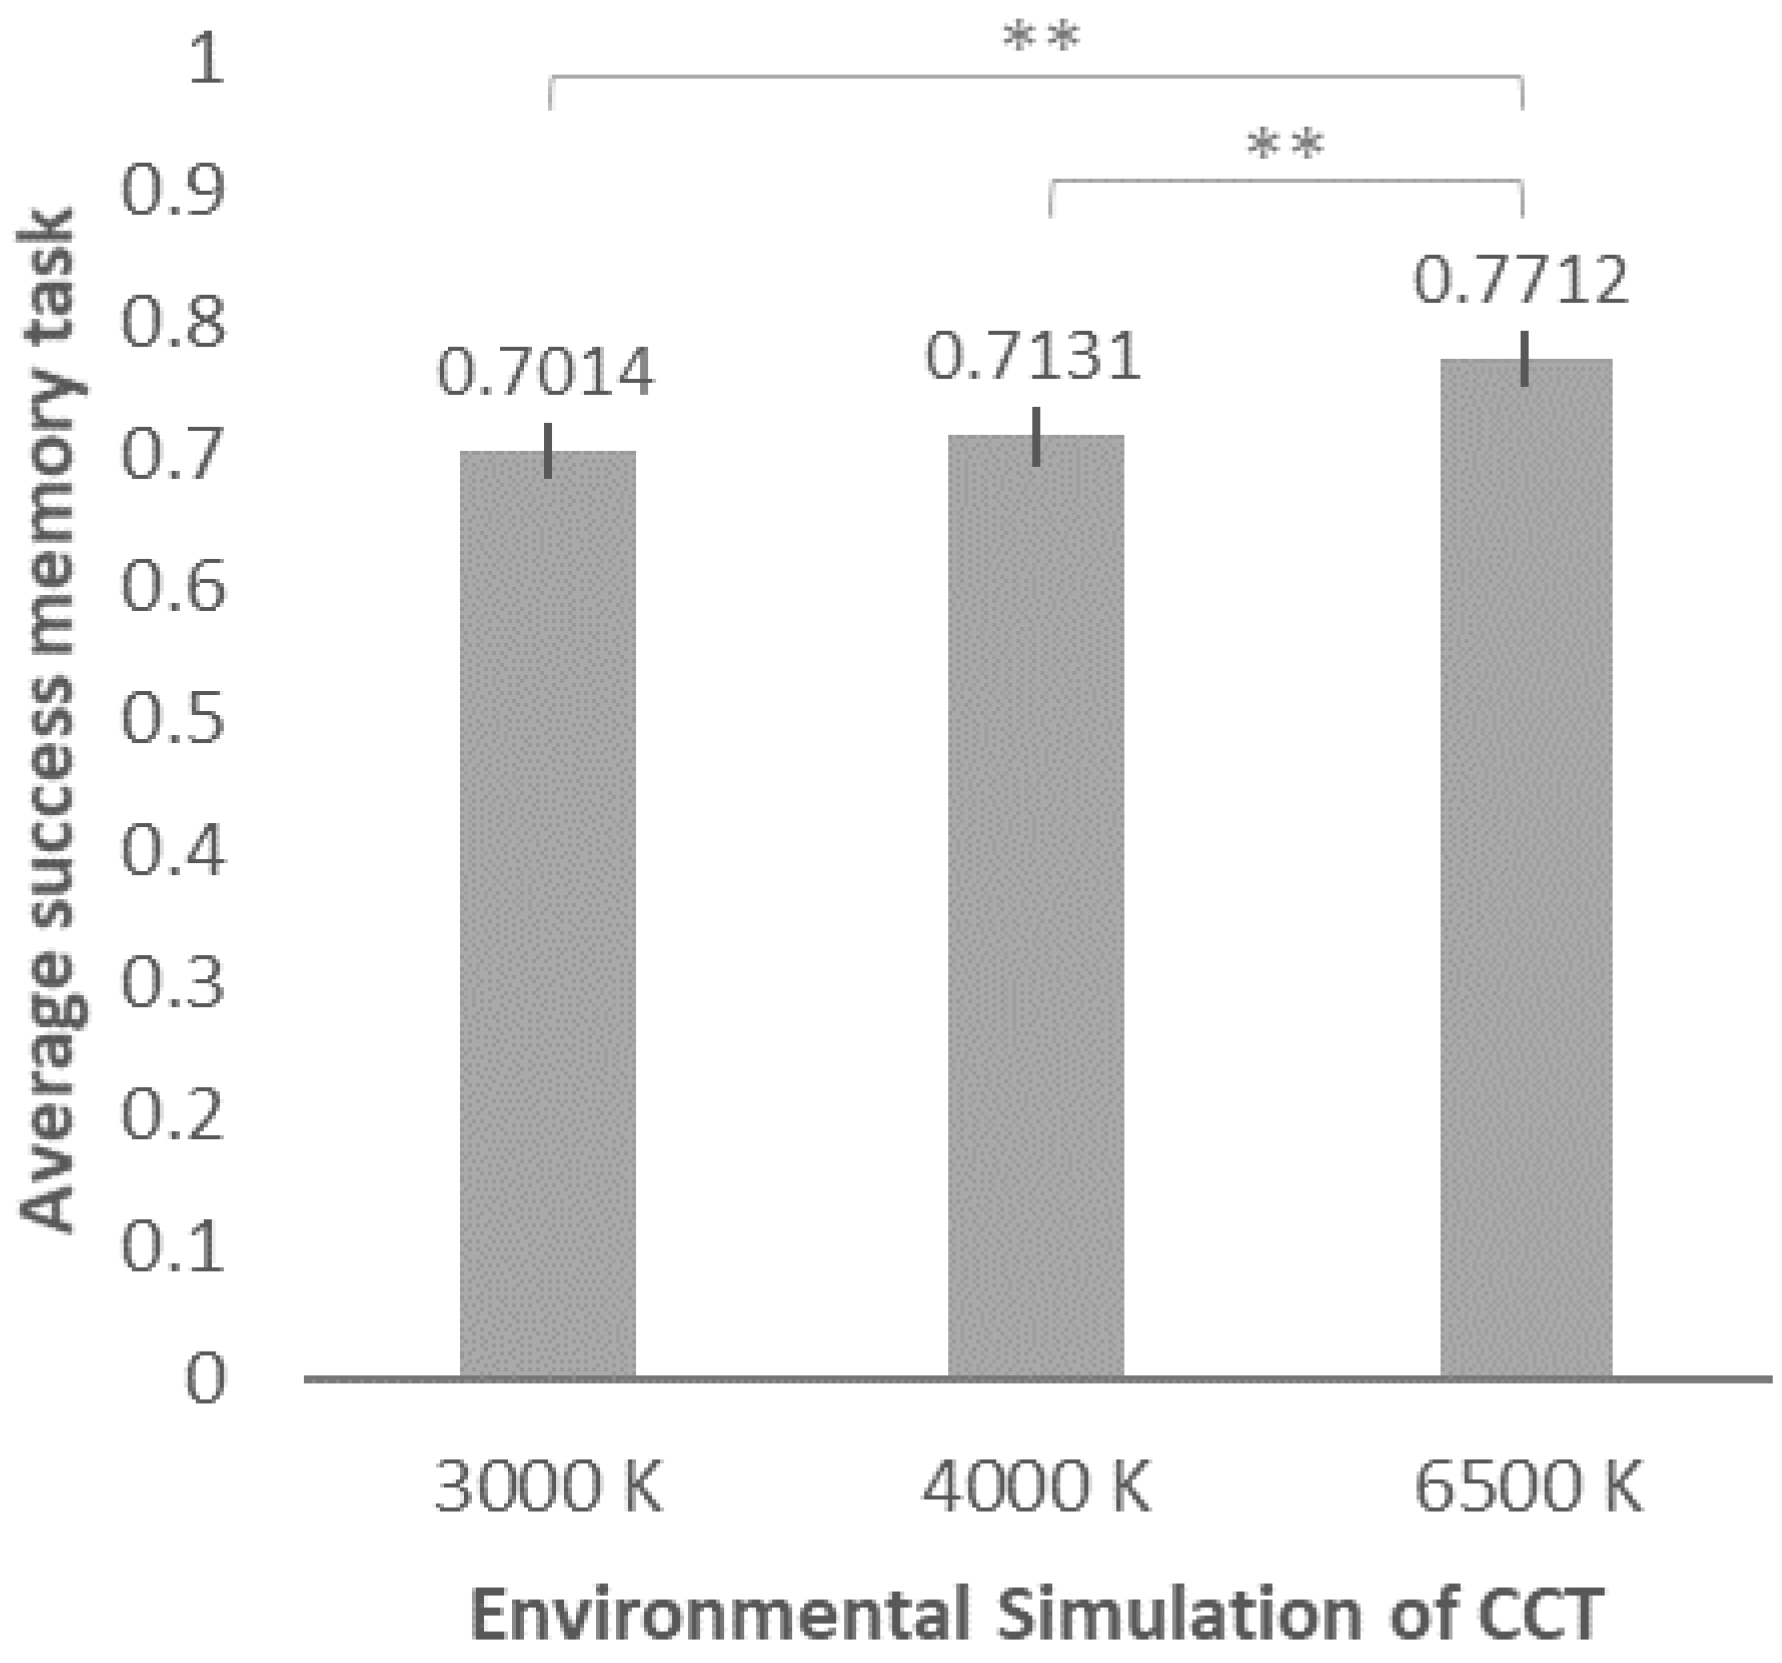
3.2.2. CCT (Correlated Colour Temperature)
3.3. Attention Analysis as a Function of the Classroom Lighting Environment
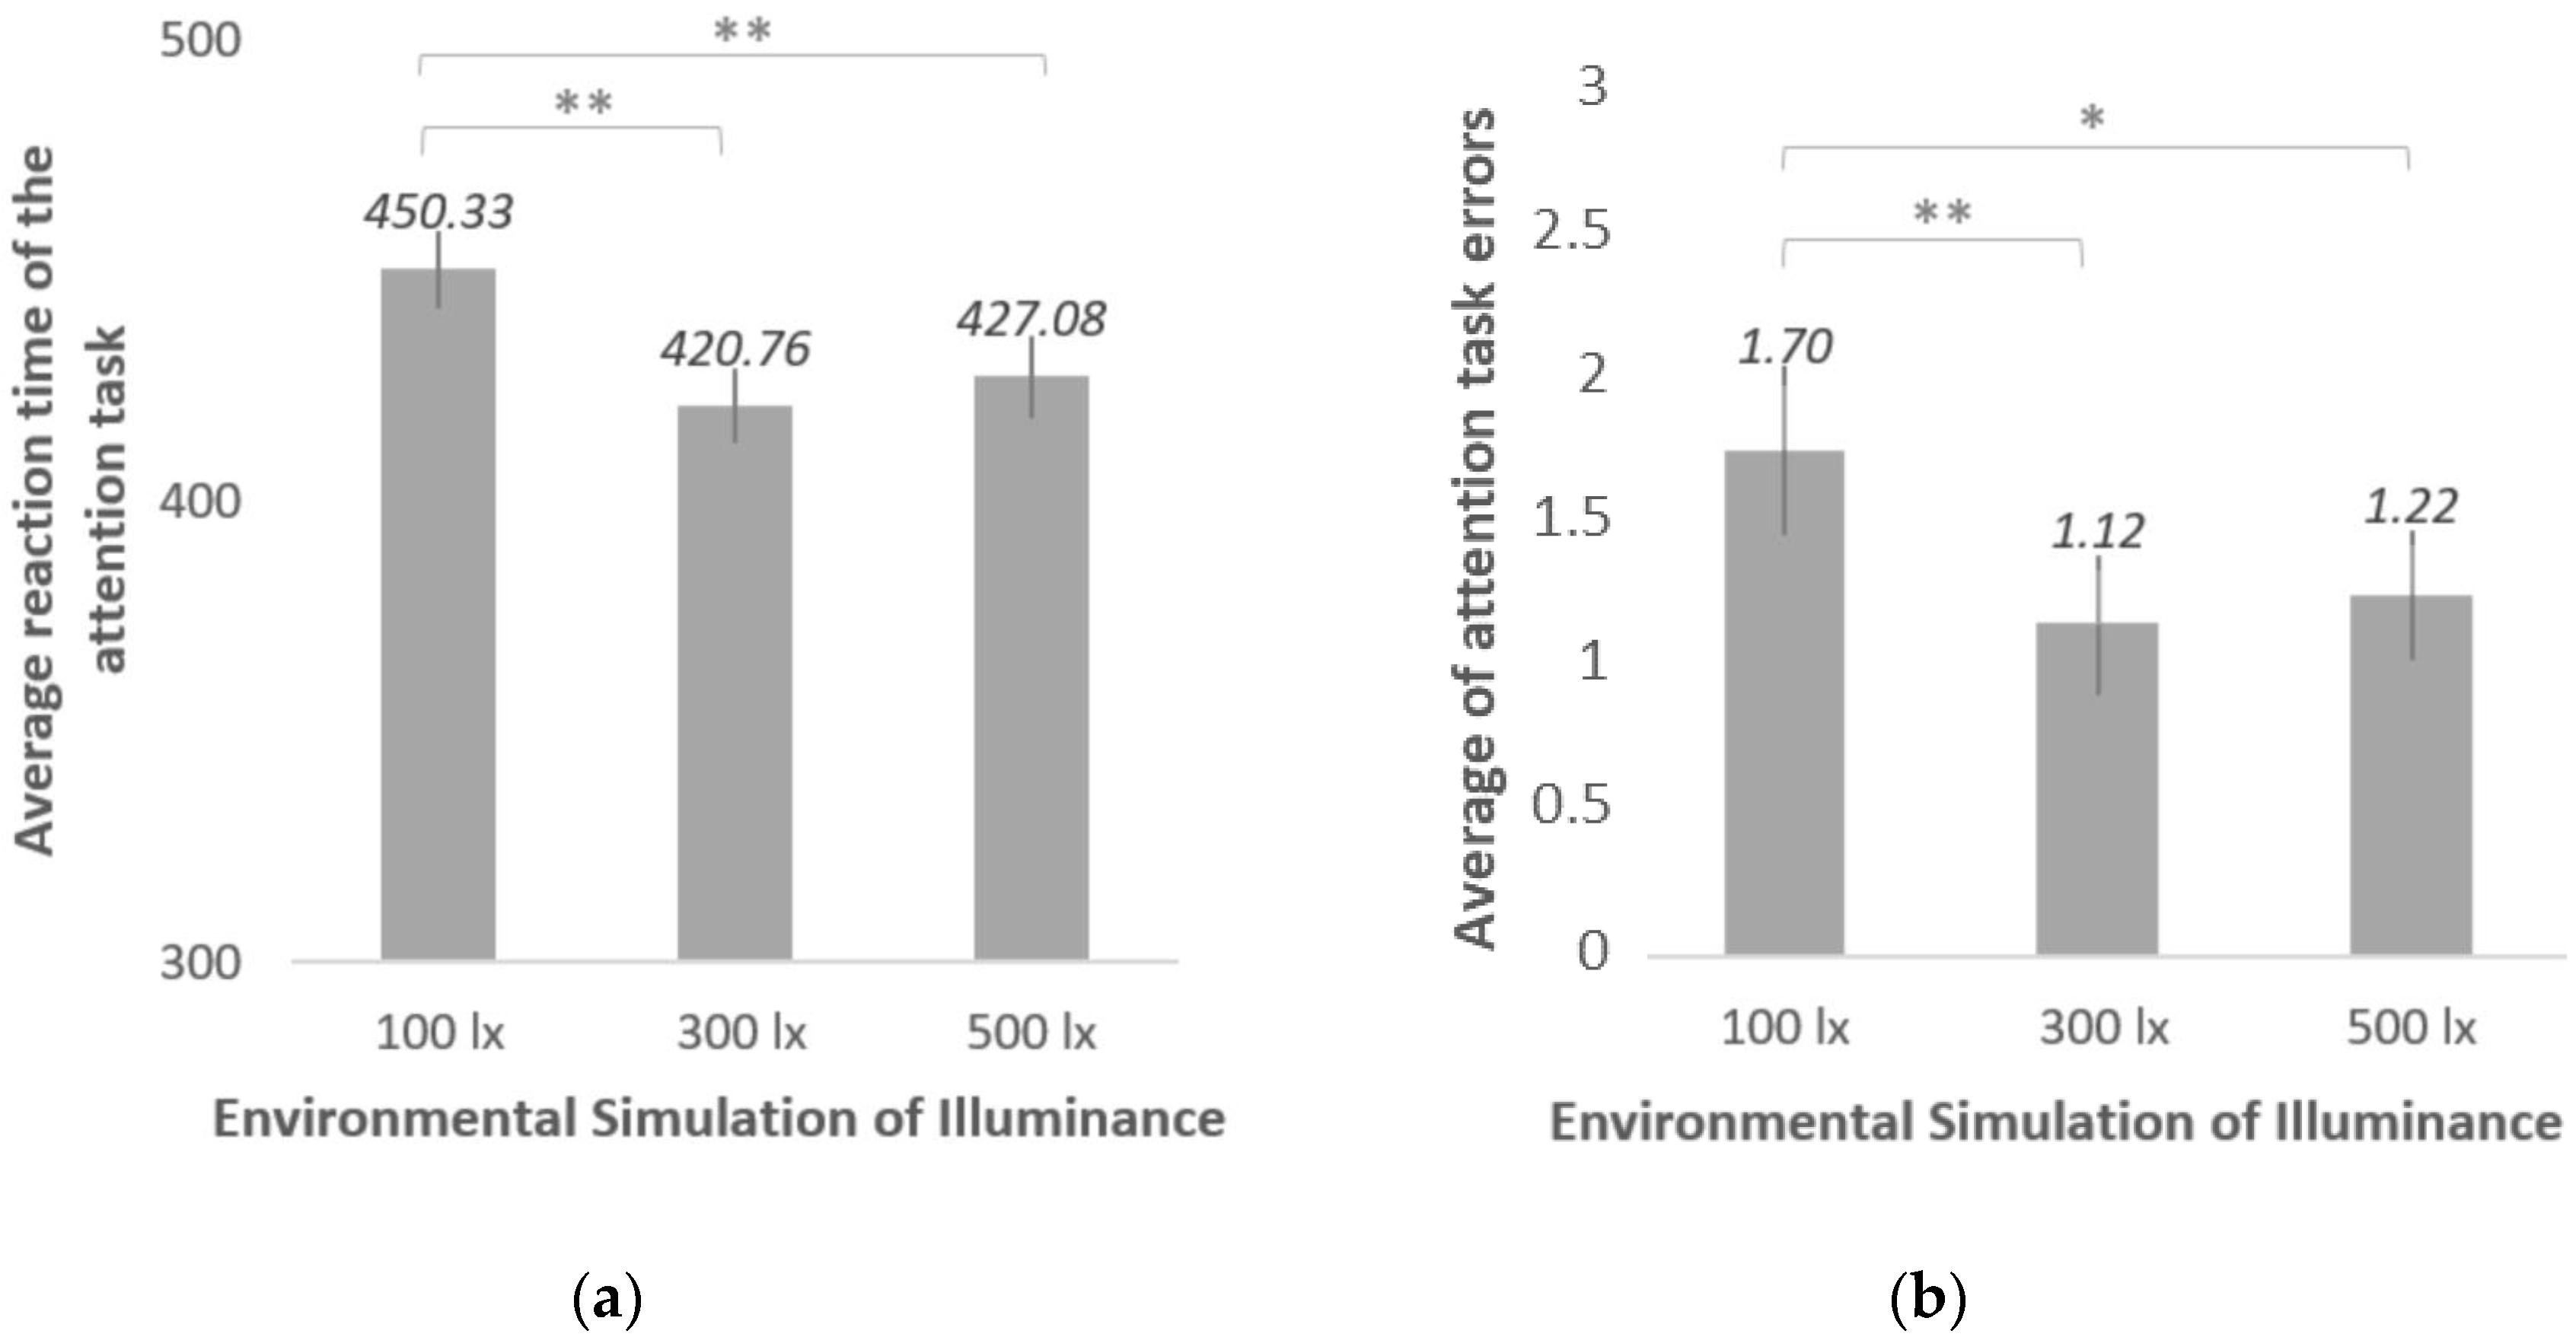
3.3.1. Illuminance
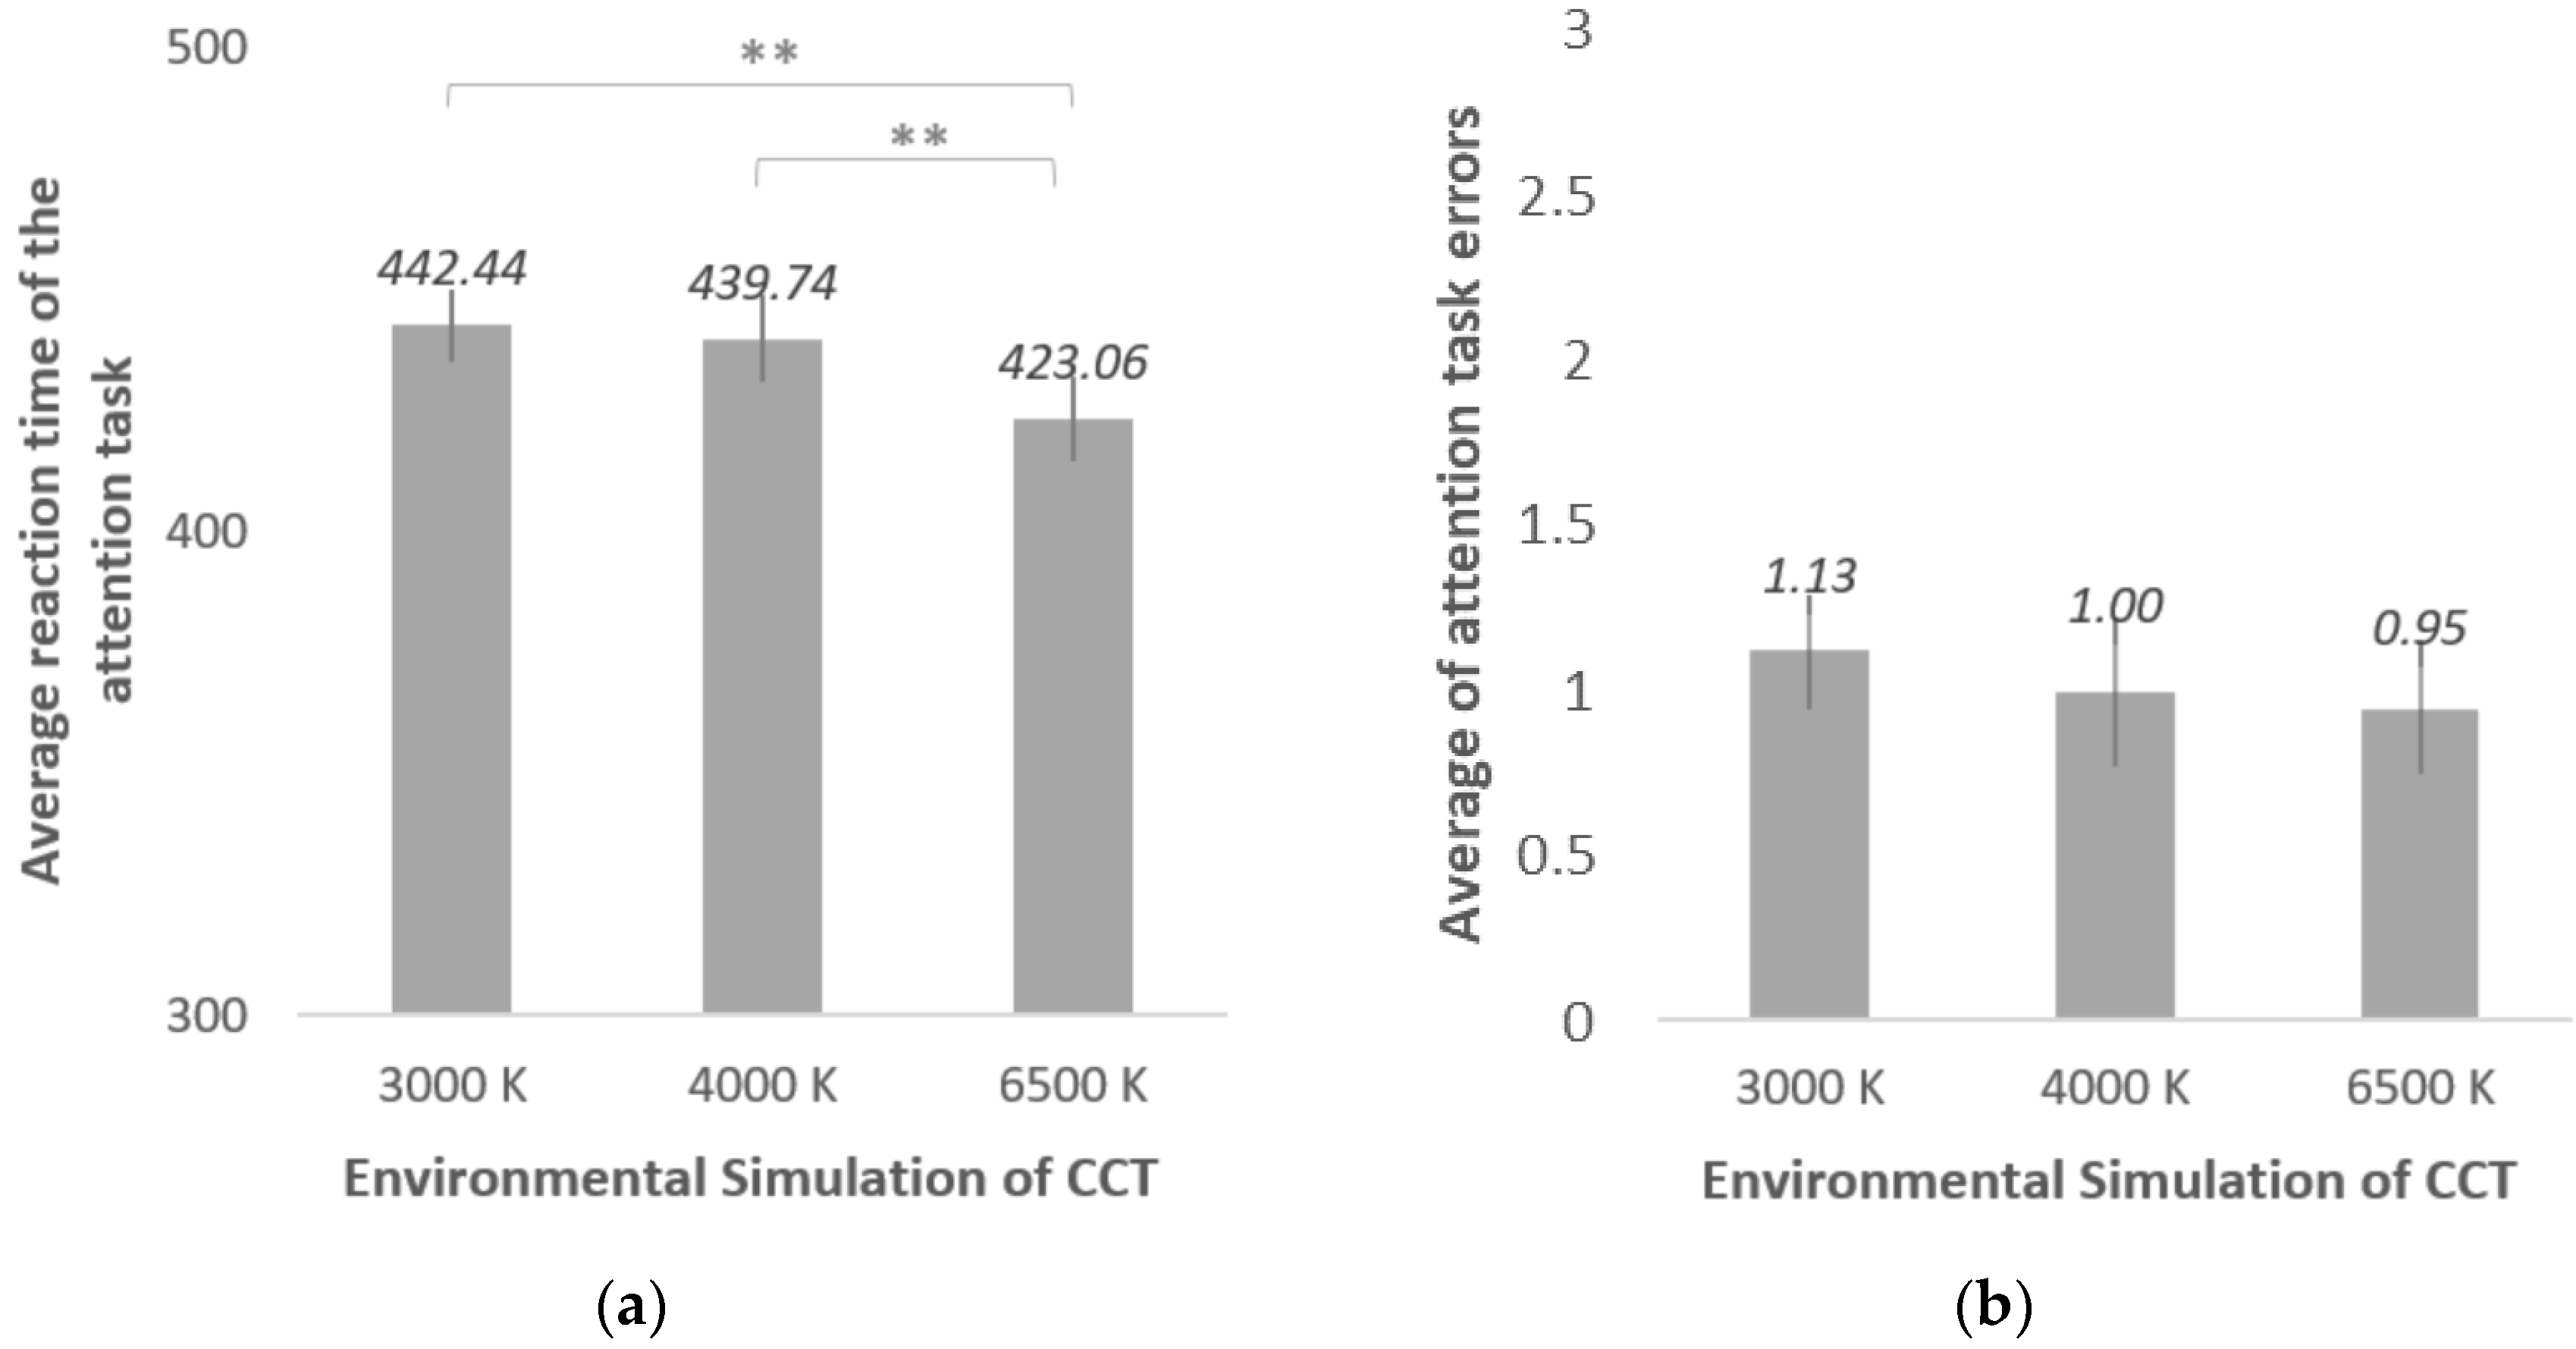
3.3.2. CCT (Correlated Colour Temperature)
4. Discussion and Conclusions
Author Contributions
Funding
Institutional Review Board Statement
Informed Consent Statement
Conflicts of Interest
References
- Wu, W.; Ng, E. A review of the development of daylighting in schools. Light. Res. Technol. 2003, 35, 111–125. [Google Scholar] [CrossRef] [Green Version]
- Barrett, P.; Davies, F.; Zhang, Y.; Barrett, L. The impact of classroom design on pupils’ learning: Final results of a holistic, multi-level analysis. Build. Environ. 2015, 89, 118–133. [Google Scholar] [CrossRef] [Green Version]
- Samani, S.A.; Samani, S.A. The Impact of Indoor Lighting on Students’ Learning Performance in Learning Environments: A knowledge internalization perspective University of Applied Sciences. Int. J. Bus. Soc. Sci. 2012, 3, 127–136. [Google Scholar]
- Park, Y. Color temperature’s impact on task performance and brainwaves of school-age children. J. Phys. Ther. Sci. 2015, 27, 3147–3149. [Google Scholar] [CrossRef] [PubMed] [Green Version]
- Barkmann, C.; Wessolowski, N.; Schulte-Markwort, M. Applicability and efficacy of variable light in schools. Physiol. Behav. 2012, 105, 621–627. [Google Scholar] [CrossRef] [PubMed]
- Boyce, P.R. Human Factors in Lighting, 3rd ed.; CRC Press: Boca Raton, FL, USA, 2014; ISBN 9781138411494. [Google Scholar]
- De Kort, Y.A.W. Tutorial: Theoretical Considerations When Planning Research on Human Factors in Lighting. Leukos J. Illum. Eng. Soc. N. Am. 2019, 15, 85–96. [Google Scholar] [CrossRef] [Green Version]
- Lam, E.W.M.; Chan, D.W.M.; Wong, I. The architecture of built pedagogy for active learning-a case study of a university campus in Hong Kong. Buildings 2019, 9, 230. [Google Scholar] [CrossRef] [Green Version]
- Castilla, N.; Llinares, C.; Bisegna, F.; Blanca-Giménez, V.; Bravo, J.M.; Blanca, V.; Bisegna, F.; Blanca-Giménez, V.; Higuera-Trujillo, J.L.; Montañana, A.; et al. Affective evaluation of the luminous environment in university classrooms. J. Environ. Psychol. 2017, 58, 52–62. [Google Scholar] [CrossRef]
- Nakamura, H.; Karasawa, Y. Relationship between Illuminance/Color Temperature and Preference of Atmosphere. J. Light Vis. Environ. 1999, 23, 1_29–1_38. [Google Scholar] [CrossRef] [Green Version]
- Dunn, R.; Krimsky, J.S.; Murray, J.B.; Quinn, P.J. Light up Their Lives: A Review of Research on the Effects of Lighting on Children’s Achievement and Behavior. Read. Teach. 1985, 38, 863–869. [Google Scholar]
- Hathaway, W.E. Effects of School Lighting on Physical Development and School Performance. J. Educ. Res. 1995, 88, 228–242. [Google Scholar] [CrossRef]
- Hygge, S.; Knez, I. Effects of noise, heat, and indoor lighting on cognitive performance and self reported affect. J. Environ. Psychol. 2001, 21, 291–299. [Google Scholar] [CrossRef]
- Tonetti, L.; Fabbri, M.; Erbacci, A.; Filardi, M.; Martoni, M.; Natale, V. Effects of dawn simulation on attentional performance in adolescents. Eur. J. Appl. Physiol. 2015, 115, 579–587. [Google Scholar] [CrossRef]
- Smolders, K.C.H.J.; de Kort, Y.A.W.; Cluitmans, P.J.M. A higher illuminance induces alertness even during office hours: Findings on subjective measures, task performance and heart rate measures. Physiol. Behav. 2012, 107, 7–16. [Google Scholar] [CrossRef]
- Smolders, K.C.H.J.; de Kort, Y.A.W. Bright light and mental fatigue: Effects on alertness, vitality, performance and physiological arousal. J. Environ. Psychol. 2014, 39, 77–91. [Google Scholar] [CrossRef]
- Huiberts, L.M.; Smolders, K.C.H.J.; de Kort, Y.A.W. Non-image forming effects of illuminance level: Exploring parallel effects on physiological arousal and task performance. Physiol. Behav. 2016, 164, 129–139. [Google Scholar] [CrossRef] [Green Version]
- Smolders, K.C.H.J.; Peeters, S.T.; Vogels, I.M.L.C.; de Kort, Y.A.W. Investigation of Dose-Response Relationships for Effects of White Light Exposure on Correlates of Alertness and Executive Control during Regular Daytime Working Hours. J. Biol. Rhythms 2018, 33, 649–661. [Google Scholar] [CrossRef] [PubMed]
- Sun, C.; Lian, Z.; Lan, L. Work performance in relation to lighting environment in office buildings. Indoor Built Environ. 2019, 28, 1064–1082. [Google Scholar] [CrossRef]
- Leichtfried, V.; Mair-Raggautz, M.; Schaeffer, V.; Hammerer-Lercher, A.; Mair, G.; Bartenbach, C.; Canazei, M.; Schobersberger, W. Intense illumination in the morning hours improved mood and alertness but not mental performance. Appl. Ergon. 2015, 46, 54–59. [Google Scholar] [CrossRef] [PubMed]
- Öner, M.; Kazanasmaz, T.; Leccese, F.; Salvadori, G. Analysis of the relationship between daylight illuminance and cognitive, affective and physiological changes in visual display terminal workers. Build. Serv. Eng. Res. Technol. 2020, 41, 167–182. [Google Scholar] [CrossRef]
- Leccese, F.; Salvadori, G.; Öner, M.; Kazanasmaz, T. Exploring the impact of external shading system on cognitive task performance, alertness and visual comfort in a daylit workplace environment. Indoor Built Environ. 2020, 29, 942–955. [Google Scholar] [CrossRef]
- Huiberts, L.M.; Smolders, K.C.H.J.; de Kort, Y.A.W. Shining light on memory: Effects of bright light on working memory performance. Behav. Brain Res. 2015, 294, 234–245. [Google Scholar] [CrossRef] [PubMed]
- Park, J.Y.; Min, B.K.; Jung, Y.C.; Pak, H.; Jeong, Y.H.; Kim, E. Illumination influences working memory: An EEG study. Neuroscience 2013, 247, 386–394. [Google Scholar] [CrossRef] [PubMed]
- Ferlazzo, F.; Piccardi, L.; Burattini, C.; Barbalace, M.; Giannini, A.M.; Bisegna, F. Effects of new light sources on task switching and mental rotation performance. J. Environ. Psychol. 2014, 39, 92–100. [Google Scholar] [CrossRef]
- Mills, P.R.; Tomkins, S.C.; Schlangen, L.J.M. The effect of high correlated colour temperature office lighting on employee wellbeing and work performance. J. Circadian Rhythm. 2007, 5. [Google Scholar] [CrossRef] [Green Version]
- Viola, A.U.; James, L.M.; Schlangen, L.J.M.; Dijk, D.J. Blue-enriched white light in the workplace improves self-reported alertness, performance and sleep quality. Scand. J. Work. Environ. Health 2008, 34, 297–306. [Google Scholar] [CrossRef] [Green Version]
- Keis, O.; Helbig, H.; Streb, J.; Hille, K. Influence of blue-enriched classroom lighting on students’ cognitive performance. Trends Neurosci. Educ. 2014, 3, 86–92. [Google Scholar] [CrossRef]
- Smolders, K.C.H.J.; de Kort, Y.A.W. Investigating daytime effects of correlated colour temperature on experiences, performance, and arousal. J. Environ. Psychol. 2017, 50, 80–93. [Google Scholar] [CrossRef]
- Vandewalle, G.; Schmidt, C.; Albouy, G.; Sterpenich, V.; Darsaud, A.; Rauchs, G.; Berken, P.Y.; Balteau, E.; Dagueldre, C.; Luxen, A.; et al. Brain responses to violet, blue, and green monochromatic light exposures in humans: Prominent role of blue light and the brainstem. PLoS ONE 2007, 2, e1247. [Google Scholar] [CrossRef] [PubMed]
- Ru, T.; de Kort, Y.A.W.; Smolders, K.C.H.J.; Chen, Q.; Zhou, G. Non-image forming effects of illuminance and correlated color temperature of office light on alertness, mood, and performance across cognitive domains. Build. Environ. 2019, 149, 253–263. [Google Scholar] [CrossRef]
- Steuer, J. Defining Virtual Reality: Dimensions determining telepresence. J. Commun. 1992, 42, 73–93. [Google Scholar] [CrossRef]
- Higuera-Trujillo, J.L.; Llinares, C.; Castilla, N. Urban Design Tools: 360 Panorama for studying pedestrians’ perception of safety. In Proceedings of the 22nd International Congress on Project Management and Engineering, AEIPRO, Madrid, Spain, 11–13 July 2018; pp. 591–600. [Google Scholar]
- Higuera-Trujillo, J.L.; Castellanos, C.; Llinares, C. Educational centres design tools. Virtual reality for the study of attention and memory performance. In Proceedings of the 14th International Technology, Education and Development Conference, Valencia, Spain, 11–13 July 2020; pp. 4362–4366. [Google Scholar]
- Iriarte, Y.; Diaz-Orueta, U.; Cueto, E.; Irazustabarrena, P.; Banterla, F.; Climent, G. AULA-Advanced virtual reality tool for the assessment of attention: Normative study in Spain. J. Atten. Disord. 2012, 20, 542–568. [Google Scholar] [CrossRef]
- Díaz-Orueta, U.; Garcia-López, C.; Crespo-Eguílaz, N.; Sánchez-Carpintero, R.; Climent, G.; Narbona, J. AULA virtual reality test as an attention measure: Convergent validity with Conners’ Continuous Performance Test. Child Neuropsychol. 2014, 20, 328–342. [Google Scholar] [CrossRef] [PubMed]
- Matheis, R.J.; Schultheis, M.T.; Tiersky, L.A.; DeLuca, J.; Millis, S.R.; Rizzo, A. Is learning and memory different in a virtual environment? Clin. Neuropsychol. 2007, 21, 143–161. [Google Scholar] [CrossRef]
- Rizzo, A.A.; Schultheis, M.; Kerns, K.A.; Mateer, C. Analysis of assets for virtual reality applications in neuropsychology. Neuropsychol. Rehabil. 2004, 14, 207–239. [Google Scholar] [CrossRef]
- Rhinoceros (v.5.0). Available online: www.rhino3d.com (accessed on 7 July 2021).
- 3ds Max Platform (v.2014). Available online: www.autodesk.es/products/3ds-max (accessed on 1 July 2021).
- V-Ray (v.320.03). Available online: www.chaosgroup.com (accessed on 1 July 2021).
- Unity3D (v5.6). Available online: www.unity3d.com (accessed on 2 July 2021).
- HTC Vive Device. Available online: https://www.vive.com (accessed on 22 July 2021).
- Kish, L. Survey Sampling; John Wiley and Sons: New York, NY, USA, 1995; ISBN 9780471109495. [Google Scholar]
- Slater, M.; Usoh, M.; Steed, A. Depth of Presence in Virtual Environments. Presence Teleoperators Virtual Environ. 1994, 3, 130–144. [Google Scholar] [CrossRef]
- Slater, M.; Steed, A. A Virtual Presence Counter. Presence Teleoperators Virtual Environ. 2000, 9, 413–434. [Google Scholar] [CrossRef] [Green Version]
- Nolin, P.; Stipanicic, A.; Henry, M.; Lachapelle, Y.; Lussier-Desrochers, D.; Rizzo, A. “Skip”; Allain, P. ClinicaVR: Classroom-CPT: A virtual reality tool for assessing attention and inhibition in children and adolescents. Comput. Hum. Behav. 2016, 59, 327–333. [Google Scholar] [CrossRef]
- Phipps-Nelson, J.; Redman, J.R.; Dijk, D.J.; Rajaratnam, S.M.W. Daytime exposure to bright light, as compared to dim light, decreases sleepiness and improves psychomotor vigilance perforSmance. Sleep 2003, 26, 695–700. [Google Scholar] [CrossRef]


| Presence | |||
|---|---|---|---|
| Objective | Measurement | Process | Metrics |
| Validate the degree to which a simulation can generate in the participant a response similar to that produced by the physical world | SUS questionnaire [30], which consists of six items evaluated on a Likert-type scale, from 1 to 7 | The participant assesses the sense of presence of each simulated environment analysed |
|
| Attention task | |||
| Objective | Measurement | Process | Metrics |
| Quantify the degree of attention of the participants for each of the simulated environments | Attention task (similar to [32]), which consists of reacting as soon as possible to a specific auditory stimulus with a mouse click (objective) and avoiding doing so with other auditory stimuli (distractors) | The participant is subjected to a task with 8 objects and 32 distractors; the time between stimuli was 800 ms to 1600 ms. The participants had 750 ms to react to the stimuli, after which the episode was considered an error |
|
| Memory task | |||
| Objective | Measurement | Process | Metrics |
| Quantify the memory level of the participants for each of the simulated environments | Memory task [31], which consists of remembering a set of related words | The participant listens to 3 audio clips of 15 words each and repeats them in a maximum time of 30 s |
|
| Phase | Analysis and Data Used | Statistical Treatment | Expected Result |
|---|---|---|---|
| Phase 1 Validation of the VR environment. | Analysis of level of sense of presence. SUS-Total | Descriptive analysis of means. | Sufficient level of sense of presence. |
| Phase 2 Memory analysis as a function of the classroom lighting environment. | Analysis of memory performance. Memory-Matches | ANOVA and Bonferroni’s post hoc analysis (normally distributed data) for Memory-Successes, as a function of illuminance and CCT. | Significant differences in memory performance depending on classroom lighting (illuminance and CCT). Identification of the environmental simulations which gave the best and worst memory performances. |
| Phase 3 Attention analysis as a function of the classroom lighting environment. | Analysis of attention performance. Attention-Time Attention-Errors | ANOVA and Bonferroni’s post hoc analysis (normally distributed data) for Attention-Time, as a function of illuminance and CCT. Kruskal-Wallis test and Mann Whitney’s post hoc analysis (non-normally distributed data) for Attention-Errors, as a function of illuminance and CCT. | Significant differences in attention performance depending on classroom lighting (illuminance and CCT). Identification of the environmental simulations which gave the best and worst attention performances. |
| Item | Illuminance | CCT | ||||
|---|---|---|---|---|---|---|
| 100 lx | 300 lx | 500 lx | 3000 K | 4000 K | 6500 K | |
| 1. I had a sense of ‘‘being there’’ in the classroom space | 4.96 (1.380) | 5.62 (0.792) | 5.68 (1.129) | 5.25 (1.172) | 5.60 (1.103) | 5.36 (1.273) |
| 2. There were times during the experience when the classroom space was the reality for me | 4.68 (1.499) | 5.29 (1.084) | 5.20 (1.533) | 5.04 (1.467) | 5.12 (1.375) | 4.95 (1.440) |
| 3. The classroom space seems to me to be like somewhere that I visited before | 4.84 (1.677) | 6.00 (1.032) | 5.20 (1.778) | 5.13 (1.846) | 5.60 (1.366) | 5.18 (1.597) |
| 4. During the experience you felt you were in the classroom space | 4.60 (1.305) | 5.76 (0.928) | 4.96 (1.289) | 5.00 (1.364) | 5.32 (1.129) | 4.86 (1.335) |
| 5. I think of the classroom space as a place similar to other places that I’ve been today | 4.32 (1.839) | 5.29 (1.529) | 4.84 (1.816) | 5.00 (1.993) | 4.52 (1.663) | 4.86 (1.644) |
| 6. During the experience I often thought that I was really in the classroom space | 4.84 (2.047) | 4.62 (1.955) | 5.56 (1.368) | 4.92 (1.904) | 4.88 (1.874) | 5.32 (1.729) |
Publisher’s Note: MDPI stays neutral with regard to jurisdictional claims in published maps and institutional affiliations. |
© 2021 by the authors. Licensee MDPI, Basel, Switzerland. This article is an open access article distributed under the terms and conditions of the Creative Commons Attribution (CC BY) license (https://creativecommons.org/licenses/by/4.0/).
Share and Cite
Llinares, C.; Castilla, N.; Higuera-Trujillo, J.L. Do Attention and Memory Tasks Require the Same Lighting? A Study in University Classrooms. Sustainability 2021, 13, 8374. https://doi.org/10.3390/su13158374
Llinares C, Castilla N, Higuera-Trujillo JL. Do Attention and Memory Tasks Require the Same Lighting? A Study in University Classrooms. Sustainability. 2021; 13(15):8374. https://doi.org/10.3390/su13158374
Chicago/Turabian StyleLlinares, Carmen, Nuria Castilla, and Juan Luis Higuera-Trujillo. 2021. "Do Attention and Memory Tasks Require the Same Lighting? A Study in University Classrooms" Sustainability 13, no. 15: 8374. https://doi.org/10.3390/su13158374
APA StyleLlinares, C., Castilla, N., & Higuera-Trujillo, J. L. (2021). Do Attention and Memory Tasks Require the Same Lighting? A Study in University Classrooms. Sustainability, 13(15), 8374. https://doi.org/10.3390/su13158374