1. Introduction
Rail transport plays key role in the transition to sustainable development, contributing particularly to UN goal 11: Sustainable cities and communities—see the list [
1], as stated in the UN General Assembly Resolution 70/1 [
2]. In the case of electric traction, which the majority of the busiest European mainlines are equipped with, there are zero local emissions. In 2018, the share of railway on direct (local) greenhouse gas emissions were only 0.4% from total emissions of the transport sector [
3]. This way, railways help meet ambitious goals of emission reduction, as declared in the European Green Deal [
4] and the related regulation proposal [
5]. Besides passenger transport, freight railway is important for sustainable development as well. It offers high economies of scale, and with adequate timetabling (as few a number of stops as possible), the energy consumption per net tonne-kilometre can be comparably low. However, a typical European mainline is mixed-traffic, and three segments of rail transport have to be scheduled there in a coordinated way: long-distance, regional passenger trains and freight trains. Such coordination represents a challenge, because different timetabling requirements of all segments have to be taken into consideration. In Western and Central Europe, railway public transport is commonly offered in the form of periodic timetables (sometimes referred to as clockface timetables). In some countries [
6,
7,
8,
9,
10], periodic service is enhanced to Integrated Periodic Timetable (IPT), which offers travel chains all-day and during whole network, using periodic offer of transfers between public transport lines. The best variant of such transfers is an IPT-node, where (ideally) services of all adjoining public transport lines arrive few minutes before symmetry time (usually the minute zero or few minutes before). Symmetry time is the periodic time when services of a particular public transport line, while running in opposite directions, meet each other (either stopping or not). Around the symmetry time, the node station is full of trains. The passengers can transfer between any two public transport lines [
11]. Hence, competitiveness with cars—to a certain extent—is assured. IPT-nodes and other periodic transfer connections create spatial availability of the offer. The period creates temporal availability.
The problem that this article deals with is gradual, hierarchical construction of differentiated periodic freight train paths (PFTPs) with unified symmetry, for the sake of meeting the differentiated demand from the freight rail operators. Priority rules for the construction of these PFTPs, in the context of busy passenger timetable in the form of IPT, are formulated here as well. The more PFTPs per hour (with a certain level of quality) can be constructed, the greater demand can be met. So, it is necessary to design PFTPs in such a way that railway capacity is utilized as efficiently as possible.
Lindner and von Redern [
12] proposed to leave periodic time windows free for freight trains within IPT of passenger trains. In such windows, PFTPs can be scheduled in a flexible way (in terms of maximum speed or alternative routing to more adjacent lines). Čapek [
13] and Klabes [
14] used “bending” (i.e., intentional lengthening of runtime) of train paths to harmonize speed profiles with other trains for the sake of more efficient utilization of rail capacity. Janoš and Kříž [
15] proposed to utilize otherwise useless capacity of a railway line by active overtaking of a slow regional passenger train by a fast freight train, given the speed ratio of both trains is high enough. Drábek [
16,
17,
18] introduced, to the authors’ knowledge, first concept of network-bound PFTPs, scheduled alternatively into two directions from the node station. However, he considered only one or two different segments of PFTPs.
Based on the research cited above, a gap can be observed—to the authors’ knowledge, no research work has so far dealt neither with detailed segmentation of PFTPs for more than two types of freight trains, nor with relative prioritization of construction of differentiated PFTPs on the same railway line.
The proposed framework process considers two dimensions of segmentation. The first one is division of the solved mainline into bottlenecks and sections with dense traffic on the one hand, and remaining sections on the other hand, because of different conditions and requirements for freight timetabling. The second dimension is segmentation of PFTPs, which is reflected in their priority of scheduling. The higher priority, the lower number of scheduled stops for overtaking by passenger trains. The authors are aware of no similar approach. Contrary to mostly strictly mathematical approaches cited in the literature review below, the presented approach strives for strengthening of the bridge between advanced quantitative research and often empirical managerial practice in the field of timetabling, with emphasis on offer of pre-arranged, attractive PFTPs.
The article is divided into six sections: Introduction, Literature Review, Materials and Methods, Results, Discussion and Conclusions. Here we summarize the content of the sections that follow. The Literature Review section proceeds in a broad-to-narrow logical order towards the addressed research gaps (as far as possible due to large variedness of the related research). For better clarity, the review is defined into four topics divided according to their proximity to the topic of the article. In the Materials and Methods section, the problem solved in the article is defined in a more detailed way. The scope of both the proposed framework process and the following timetable experiment is clearly stated. The new framework process is defined and supported with arguments. Then, necessary materials are introduced and described. Parameters of sample freight trains for the proposed differentiated (segmented) PFTPs are derived. The Results section describes PFTPs used for the timetable experiment in terms of timetable and recovery margins by section and direction. Besides, the benefit of the designed PFTPs is quantified in terms of number of really running freight trains from available historical data that would fit into the PFTPs. Sensitivity analysis with variable power-to-mass ratio (PMR) is added and its results are briefly discussed. In the Discussion section, first of all, the proposed framework process and timetabling experiment are interpreted in the context of previous research. Then, the proposed framework approach is discussed, mainly in terms of its potential contributions to sustainable development. The last section, Conclusions, summarizes a brief background of the introduced research, its contribution and major findings, followed by recommendations for further research.
2. Literature Review
Railway transport, including freight, is a key factor for sustainable development. However, to fully utilize the potential of freight railway to reduce the emissions per net transported tonne, efficient timetabling of freight trains is necessary—in the context of already prevailing IPT of passenger trains. The problem of construction (design) of coordinated timetable of trains with various parameters is considerably complex. If the timetable is periodic, the complexity is reduced to a certain period (30 min to 2 h as a rule). Periodic Event Scheduling Problem, which can be applied also in the field of freight rail, was formulated by Serafini and Ukovich [
19]. The following literature review focuses on problem of timetabling in a broad-to narrow logical order towards higher proximity to the research gaps identified in this article. The review is divided into five subsections. The first one focuses on timetabling of mixed rail traffic. The second one proceeds to timetabling approaches specific for freight trains and to induced need to define sample freight trains for the timetabling process. The third subsection deals with more integrated timetabling approach (in the context of periodic timetable of passenger trains)—periodic capacity for freight trains and PFTPs. The fourth subsection is the closest to the topic of this article. It focuses on network-bound PFTPs and timetabling approaches for more efficient capacity utilization. The fifth subsection summarizes the literature review and subsequently identifies research gaps that delimit the problem solved in this article.
2.1. Operation, Capacity and Timetabling of Mixed Rail Traffic
Efficiency of railway operation and capacity planning, especially scheduling of IPT and other forms of periodic timetable (predominantly for passenger trains) are favoured research topics in the field of mathematics and operation research, since many sub-problems that enable algorithm development or simulation of the problem, can be found there. Thus, only the works that are most related with the topic of this article, are briefly cited here.
Serafini and Ukovich [
19] proposed a mathematical model for scheduling activities of periodic type—Periodic Event Scheduling Problem (PESP). Most of (but not all) quantitative scientific works in the field of IPT were based on this model, for instance Liebchen [
20] and Opitz [
21].
Caimi et al. [
22] proposed mathematical formulation of partially periodic service—some train paths can be scheduled in peak times only, and can, if need be, alternate with another (such as freight) train paths—supposed that both train path types fit within fully periodic (all-day) timetable pattern.
First edition of UIC Code 406 Capacity [
23] considered train path heterogeneity (i.e., difference in scheduled section runtimes) one of four key parameters that influence railway capacity (however, the capacity is determined in much more complex way, depending on many factors—see Stoilova et al. [
24]). This influence is negative—the higher heterogeneity, the lower the line capacity, i.e., the fewer train paths can be scheduled per defined time unit. It is obvious that slower trains have to be overtaken by faster ones, unless the capacity requirements for the line are very low. The thing is, the longer is the section between two stations where a slow train is overtaken, the more potential faster train paths are consumed by a slow train path. Thus, the capacity estimation based on compression of subsequent train paths closely together (with time supplements added to secure quality of operation) gives various results, depending on length of the chosen line section—see the 2nd edition of UIC Code 406 Capacity [
25]. Positive influence of overtaking tracks on railway capacity was demonstrated, for instance, by Gašparík et al. [
26]. However, utilization of such tracks in operation should be verified—ideally by microsimulation, as shown by Čamaj et al. [
27], so that investment in an additional track can be justified. Ljunggren et al. [
28] introduced an algorithm that maximized the timetable (operational) robustness for bottlenecks of railway network by maximizing the temporal distance to neighbouring train paths in the timetable.
2.2. Freight Timetabling and Sample Freight Trains
Contrary to extensive research in passenger, especially periodic, timetabling, freight timetabling was solved mostly merely as an additional problem. However, some works dedicated to freight railway timetabling problems emerged as well. Both types of works are cited here.
Haldeman [
29] described rules for recovery margins (time reserves) in Switzerland. A relative margin was 11% of the runtime of freight trains. In addition, one-minute margin was added for each 30 min of runtime. Further, Special Operational Supplements were added, for instance, in busy node areas.
Vromans [
30] compared approaches for determination of recovery margins in chosen countries—for passenger, as well as for freight trains. In Netherlands, the supplements were proportionally allocated with respect to the minimum runtime. He stated that in practice the freight trains were often faster and lighter than planned (and scheduled). Vromans [
30] explained that the choice whether to stop at a station or not provided much flexibility to his model, and that this option could be used also for determining the optimal location of stations for possible overtaking of freight trains.
Müller [
31] verified IPT for wagonload transport in Germany. Marshalling yards were supposed to correspond to IPT-nodes. Various automation levels of wagons (automatic coupling, autonomous drive etc.). were considered as well. The result was a calculation that has shown no significant time- or cost-saving potential for such concept with use of conventional freight wagons.
Some authors focused on improvement of process of inserting additional freight train paths into previously determined passenger timetable. Cacchiani et al. [
32] proposed to introduce as many new freight trains as possible by assigning them timetables that were as close as possible to the ideal ones (from the operators’ viewpoint).
Bablinski [
33] carried out a set of simulation games based on a real-world scenario where preferential treatment of freight operators was included. However, the author admitted that benefits for freight operators were achieved at the cost of loss of rail system efficiency due to increased level of runtime heterogeneity.
Kuckelberg et al. [
34] introduced clustering algorithm for gaining of sample trains, that was implemented in analytical LUKS
® system for railway operation research. They clustered all trains, even with different routes, at the same time, and therefore they had to compare several key train parameters, which they enumerated in descending order of importance considering train similarity—firstly, the kind of traction (electric or diesel), secondly, the general kind of train (passenger, commuter or freight). Thus, more groups of fundamentally different trains were processed together.
The third parameter was the route of the train, including the stopping regime. The fourth was mass and tractive forces of the train. The fifth one was the train length. The last one was the maximum speed.
The clustering algorithm included calculation of similarity (“distance”) between two trains, which was the product of parameter-specific distances which comprised parameter-specific weights.
From each cluster, a sample train was formulated as follows: the most frequent route with the most common stopping regime along it, and the most frequent braking regime and percentage. Further, besides other things, maximum recovery margin, speed of trainset and minimum number of wagons were chosen. In addition, 0.8 quantiles of maximum speed, mass and length were chosen. The selected stopping regime (i.e., used overtaking tracks) and the train length should match together.
Opitz [
21] modelled PFTPs with chosen sample freight trains, using “sample train atoms”, later referred to as “snippets” by Pöhle [
35]. With the help of such building blocks, Opitz was able to distinguish different capacity consumption of otherwise identical freight trains that did or did not stop in a particular station.
Woodburn [
36] investigated variability in number of wagons in a freight train of particular category or origin-destination pair. His survey was based on a sample of almost 3000 individual freight trains, with analysis at four levels of disaggregation, from the commodity groupings used in official statistics down to individual services. He identified considerable variability even at fairly high levels of disaggregation.
Another research question is whether there can be scheduled any “typical” freight train path, which can be used as a pre-arranged PFTP.
Drábek [
16] worked out origin-destination matrix of freight train paths, according to official timetable at that time. He gathered scheduled section runtimes and compared them with desired runtimes for the proposed PFTPs. Determination of desired runtimes was iterative, influenced by scheduled freight train runtimes. If any section runtime was too short for about half of freight trains, the desired runtime was lengthened (i.e., relaxed) to the detriment of runtime of neighbouring, non-critical section. The aim of this iteration was prevention of scheduling of too many stops for overtaking for the PFTPs. However, some longer sections uphill became critical, and resulted in 70% of scheduled freight trains that were able to fit in PFTPs (scheduled runtimes for sections between neighbouring stations were assessed, if there was scheduled at most 1 stop). So, remaining 30% of freight trains were supposed to be scheduled at night or within the remaining capacity.
2.3. Periodic Capacity for Freight Trains, Periodic Freight Train Paths
Lindner and von Redern [
12] summed up problems with construction of freight train paths in IPT. They found that it was necessary to let periodic time windows (“canals”) free for freight trains, giving them sufficient capacity. The result of their proposal was not a periodic freight timetable, but PFTPs—or merely periodic time windows—e.g., 1 or 2 freight train paths for the speed of 90 km/h instead of two or three freight train paths for the speed of 100 km/h. These time windows should be preferably connected together in nodes (if needed, among more than two lines to enable use by freight trains with various origin/destination stations). A freight train can also use some PFTP only partially.
Opitz [
21], within his model of IPT, modelled PFTPs as well. Růžička designed partially periodic freight train paths for public additional locomotive service for freight operators in his bachelor thesis [
37]. Because of different operation of additional locomotives in both directions, unified symmetry axis was not maintained.
Chýle [
38] designed two types of PFTPs on the mainline between Prague and Summerau (for lighter and faster vs. for heavier and slower trains), both in 4-h periods. However, due to partially periodic passenger services (some services fell out in off-peak times) and long single-track sections, he had to do many adjustments, so the resulting catalogue freight train paths have turned into practically aperiodic—especially in single-track sections.
Růžička designed PFTPs for busy mainline between Přerov and Petrovice u Karviné in his diploma thesis [
39]. Along the whole line, two groups of PFTPs, both with 2-h period, were designed. Due to imperfect symmetry and many additional peak services in long-distance passenger railway, only one group out of two was constructed with unified (zero) symmetry.
2.4. Network-Bound Periodic Freight Train Paths and Timetabling Approaches for More Efficient Capacity Utilization
Drábek [
16] introduced, to the authors’ knowledge, the first concept of network-bound PFTPs, scheduled alternatively into two directions from the node station. Given node station with level crossing (without flyovers), timetabling conflict was avoided by different runtime margins, depending on a direction that the freight train should proceed to, so blocking of the whole switch region at one time did not exclude blocking of the whole switch region by the train path between another directions, which was scheduled at another time. The approach proposed by Drábek, which preserves train path symmetry at the end of sections adjoining to the node station, is an analogy to passenger IPT-node, but tailor-made for freight railway. The unified period and (at least outer) unified symmetry remained common for both concepts. But transfers in passenger transport were replaced by possibility of direct passing through a node (without stopping) by a freight train. Both concepts enable free combination of adjoining directions, but there is another key difference. Passenger IPT offers periodic services, which can be used by passengers (in the part of the service route as a rule, or not at all). A network-bound system of PFTPs offers capacity to train operators. A freight train can use only a needed part of a particular PFTP.
Based on this pilot study, Drábek developed in his doctoral thesis [
18] (and published previously in 2011 [
17]) a framework process, which was intended as a building set of measures (i.e., only the appropriate ones should be applied in any particular case). This framework process (
Figure 1 without the red frame) came out from the above-mentioned freight analogy to IPT.
As a conclusion, two measures for efficient capacity utilization were proposed: homogenization of freight trains with the most frequent speed segment of passenger trains (already in the timetabling/allocation phase, unless faster running of freight trains was technically impossible) and avoidance of stopping freight trains in bottlenecks and uphill sections if possible.
Michl et al. [
40], following up on Drábek‘s framework process, proposed systematic homogenization of heterogeneous train paths—already in the phases of capacity allocation and timetabling. Moreover, they proposed speed bundling of homogeneous train paths with the use of bending of freight and (if necessary) long-distance train paths towards longer section runtime. Thus, more efficient speed bundling with the most frequent train segment (suburban trains as a rule) could be enabled.
Čapek [
13] and Klabes [
14] used “bending” of train paths to harmonize speed profiles (i.e., section runtimes) as a part of their approaches, so that efficiency of railway capacity utilization can be improved.
Michl et al. [
40] segmented train paths based on two criteria—periodicity and degree of advance. Periodic train paths can be either previously allocated ones (based on the operators’ requests) or catalogue (pre-arranged) ones—mostly for typical freight trains, whose departure days and times cannot be determined in the timetabling phase, but such trains are reasonably expected to run, based on ad hoc capacity requests.
Individual train paths—both previously allocated and ad hoc ones—must not disrupt all-day (or rush hour) periodic timetable pattern.
Besides bundling, an appropriate sequence of heterogeneous train paths can save capacity as well. Thus, the fastest train should run as first, then a middle-fast train and the slowest train in the end. IPT-based symmetry causes that in each direction this sequence is exactly opposite [
40].
Janoš and Kříž [
15] proposed to utilize lost capacity by active overtaking of a slow regional passenger train by a fast freight train, given the speed ratio of both trains was high enough. They analysed possibilities of such overtaking on Prague—Děčín mainline. If such overtaking becomes a routinely repeated process, then adequate real-time dispatching will be necessary. One of most serious obstacles to it on most of European rail networks is deficiency in standardized data exchange that would enable accurate prediction of train running, as highlighted by Kamenický [
41].
By construction of PFTPs one cannot avoid some inherent asymmetry (items 1 to 3 come from Drábek [
42]):
Local overtaking-based asymmetry in case of steep gradient;
Local asymmetry based on adding and releasing of assistance locomotive in the uphill direction only (for steep gradient);
Asymmetric scheduled stop (only in one direction) of a freight train for crossing on a single-track section;
In case of sequence of heterogeneous trains, mentioned above, freight train can depart after fast train almost immediately. Contrary, in the opposite direction, some appropriate buffer time between arrivals of freight train and fast train is necessary.
The asymmetry should be maintained as local only—between two nearest node stations where PFTPs branch to more directions. In these stations, PFTPs should be symmetric again, so the asymmetry propagation further through the network is avoided. Only few minutes deviation in symmetry in nodes is permissible, provided that:
Drábek [
18] examined modification of passenger timetable on a section between two node stations, for the sake of capacity for catalogue PFTPs on a double-track line with mixed traffic. As a timetable pattern, prospective timetable from Czech research project on configuration of IPT-nodes [
43] was used, with seven long-distance and two regional passenger train paths per hour (30 min period) and direction. Intercity train paths were kept untouched. Regional train paths were provisionally removed. Fast (regional express) train paths (30 min period) were shifted closer to (i.e., bundled with) intercity train paths. Then, PFTPs (with at most one stop per PFTP) and a regional train path were iteratively constructed. The main result, besides three PFTPs with one overtaking only, was a significant deterioration of regional railway offer—one train per hour only and service cancellation for three stops. Such a solution would be very likely politically unacceptable if applied in practice.
Šimral [
44], as co-founder of freight railway undertaking METRANS Rail Ltd. and a locomotive driver himself, pointed out that some railway undertakings did not equip their trains with appropriate locomotives, so the PMR (power to hauled gross mass ratio [kW/t]) of such trains was very low. Or the drivers were not motivated to keep allowed (and scheduled) speed. Thus, real runtimes were considerable higher than scheduled, and such trains could have caused delay of another trains. He proposed that keeping of scheduled speed should be legally enforced and that timetabling process in the Czech Republic should consider PMR as a priority factor by train path allocation.
Chýle [
38] proposed sample freight trains with comparable high PMR (3.76 and 5.74)—combination of powerful modern locomotive and restricted gross mass. Such sample trains enabled construction of PFTPs with relatively low capacity consumption.
2.5. Summary of Literature Review
The literature review shows that the majority of related research in the field of mixed and freight railway timetabling and operation can be characterized by quantitative approach (mathematical modelling, network timetable optimization, various optimization of partial problems, etc.).
There are few exceptions with qualitative (in the sense “not quantitative”) approach: Lindner and von Redern [
12], doctoral thesis and related research by Drábek [
16,
17,
18,
42], and empirical statement by Šimral [
44]. The related research is, in accordance with its relative proximity to the research presented in this article, sorted in
Table 1—from left to right towards closer research.
Although Drábek introduced integrated concept of freight timetabling, as, to a certain degree, an analogue to operational concept (timetable layout) of passenger railway transport ordered by public sector, he considered only two, rather similar, sample freight trains in his study of network-bound PFTPs for Prague node and adjoining lines [
18].
Another problem that, to the authors’ knowledge, no research has focused on so far, is internal priority of timetable construction (scheduling) of PFTPs, according to their significance on particular mainline, as well as parameters of sample freight trains for such PFTPs.
Based on the research cited above, two research gaps can be observed—detailed differentiation (segmentation) of PFTPs for more than two types of freight trains and internal (relative) prioritization of construction of differentiated PFTPs on the same railway line. The research gaps are, for the sake of better comprehensibility, displayed in
Figure 1 in red colour, on the background of framework process for systematic construction of network-bound PFTPs proposed by Drábek in his doctoral thesis [
18].
3. Materials and Methods
3.1. Definition of the Problem
Railway capacity is limited, and on busy mainlines scarce, resource. It is difficult to quantify, since it depends from its utilization—number and heterogeneity (difference in average speeds) of the trains [
23]. In the case of heterogeneous, mixed traffic (intercity, regional or suburban, and freight trains together), lower service period of the fastest or the slowest train segment (e.g., 30 min) even deteriorates the efficiency of capacity utilization—the frequent alternation of faster and slower trains decreases potential of speed bundling, i.e., scheduling homogeneous trains (with same or similar average speed) immediately after each other. The ideal speed bundling occurs in underground or dedicated suburban rail traffic—the result is the highest possible capacity utilization, and highest capacity in terms of number of trains per hour and direction. In some cases, line capacity can be additionally restricted by signaling system with long departure headway, but for majority of Czech double-track mainlines, including the mainline researched below, it is not the case.
In this article, “freight-unfriendly” passenger timetable has been intentionally chosen—heterogeneous trains with comparably low service periods (30 min or 1 h). Further, to fill the above defined research gaps, one or two optimal sample freight trains are not enough, since the data on really running freight trains show (as displayed in
Section 3.5) high diversity of freight train parameters—length, speed and power-to-mass ratio (PMR). The last parameter is defined by total power of the locomotive(s) divided by gross hauled mass of the train (i.e., mass of the wagons plus mass of the freight). PMR determines relative ability of acceleration of particular freight train, compared with other freight trains.
Thus, segmentation of periodic freight train paths (PFTPs) for more types of trains (in terms of maximum allowed speed, length and PMR) is necessary, to meet at least prevailing demand for capacity from freight rail operators. Of course, at night there is almost no passenger traffic, and almost all the capacity is available for freight trains. However, rail freight is often a part of multimodal supply chain, with increasing pressure on speed and reliability of delivery time. So, many freight trains cannot wait for the end of daily passenger traffic.
Hence, the problem solved in this article can be defined as follows: Within given mainline and passenger timetable, first of all, divide the mainline into bottlenecks and other sections with busy traffic on the one hand and other sections on the other hand. Then, define and construct differentiated PFTPs (each one should maintain unified symmetry in both directions), based on available demand data, and formulate framework process for priority of their scheduling (construction). Try to avoid scheduling of any unnecessary stopping. Try not to essentially reduce maximum length of a freight train, derived from the shortest station track that is scheduled for overtaking. Finally, assess the solution by comparison of number of really running freight trains that are suitable for the PFTPs with number of trains that are not suitable for them.
3.2. A New Framework Process for Scheduling of Differentiated (Segmented) PFTPs
The introduced framework process for construction of symmetric PFTPs can advantageously complement the framework process proposed by Drábek [
17,
18] (
Figure 1), fills the above defined research gaps and observes following generic principles:
- (1)
Hierarchy of the offer of PFTPs and related hierarchy of the construction process;
- (2)
Segmentation of the solved mainline (or network) into:
Bottlenecks;
Other busy sections (with dense, or strongly heterogeneous, traffic);
Rest of the line/network.
- (3)
Speed bundling whenever it saves capacity and does not lead to unnecessary extra overtaking or waiting;
- (4)
Active overtaking of or by a passenger train for the express PFTPs;
- (5)
Scheduling of overtaking for subsequent PFTPs in various stations, so the capacity is utilized efficiently (the acceleration of a freight train is the most capacity-consuming phase of its running) [
40].
As the 2nd edition of UIC Codex 406 [
25] implies, increase of capacity utilization leads to decrease of train path quality, and vice versa. The authors assume high daily fluctuations in utilization of PFTPs by freight trains (see
Section 3.5). Thus, they propose to offer enough PFTPs per hour as a reserve in hourly capacity and segmentation of global (international) PFTPs in terms of quality—express, fast and “common” with more scheduled stops for overtaking. In many cases, only the best global PFTP would be used. Then, the second one can be (if need be) used for a domestic freight train, given sufficient PMR and speed. The third one would be used only if the first two ones cannot satisfy the freight operators’ demand for capacity in particular day, hour and direction.
The priority criteria for generic framework process for hierarchical construction of PFTPs are arranged in descending order as displayed in
Figure 2.
The framework process begins with delimitation of the solved area. This can be a mainline or some chosen railway (sub)network. Here, the right segmentation of the area into bottlenecks, other sections with dense (or strongly heterogeneous in terms of runtimes) traffic and the remaining sections is crucial.
The second step is crucial for the efficiency of the following steps. On the one hand, looser parameters of sample freight trains can increase the number of real freight trains that would fit into the designed PFTPs. On the other hand, such looser parameters are likely to deteriorate quality of particular PFTP in the form of increase in number of scheduled stops for overtaking. The most important parameter to be wisely chosen is minimum required PMR of the freight train. Further, maintaining of unified symmetry should be considered (which can result in different train parameters for each direction), otherwise the proceeding of the PFTPs to neighbouring lines would become extremely complicated due to scheduling of PFTPs within passenger IPT, which maintains the unified symmetry. Statistical evaluation of historical data on freight trains or other relevant data is helpful for this step. However, some timetabling “common sense” is relevant as well—at least verification of really achievable section runtimes in relation to the timetable of passenger trains and a resulting breaking point, where any lower allowed PMR means necessity of additional stop for overtaking.
The third step is formally equal to the same step in the original Drábek’s framework process [
18], but in the proposed new process it is more complex due to possible different section runtimes of the differentiated PFTPs. As a rule, the below mentioned prioritization of scheduling of the PFTPs should be maintained. At the same time, PFTPs with longer runtimes through bottleneck sections (where any stop should be avoided if possible) should be scheduled so that they do not waste railway capacity. This step is an indirect assessment of available capacity, i.e., maximum number of PFTPs per hour and direction.
Further, the actual (hierarchized) construction of PFTPs starts. First of all, the global PFTPs are scheduled (during the whole mainline or with the longest distance within the mainline or network)—with one exception. As the first one from them, the express PFTP is scheduled. Its time position is determined by possibilities of active overtaking (of or by the particular passenger train—see the explanation below) and by non-stop passing through bottlenecks.
The PFTP with second priority is the global fast one. Active overtaking is not supposed there. So, the quality is ensured by trade-off between as low number of scheduled stops as possible and as high length limit as possible.
The third priority is reserved for the local PFTP with low PMR, so that number of scheduled stops can be kept at a reasonable level. Each stop of a train with low PMR leads to high secondary consumption of railway capacity, due to higher section runtime after the stop caused by low acceleration.
The fourth priority is reserved for the global PFTP with high PMR, because more frequent stopping of such trains leads to comparably low secondary consumption of railway capacity.
The last two priorities are reserved for scheduling of local PFTPs in the remaining sections, beginning with those with low PMR. Scheduling of global PFTPs with low PMR is, from the authors’ point of view, not desired, because of disproportionate capacity consumption. So, any “global” freight train, that can run during daytime, must have parameters corresponding to at least one local PFTP in each section.
Then, the extension of PFTPs up to nodes in terms of solving of timetabling conflicts there follows. This step lies already outside the proposed framework process.
In some special cases, lost capacity in the sense of the 1st edition of UIC 406 Codex [
23] can be utilized by active overtaking, i.e., without stopping of the overtaken train. This train is scheduled to an opposite track, given that it is not occupied by traffic in the opposite direction. Because of comparably high train frequency on a typical mainline, only a section between neighbouring stations can be used for this purpose. While constructing PFTPs this way, one has to pay attention whether another potential good PFTP is not avoided (see
Figure 3). Given PFTPs in both directions are constructed with a unified symmetry, the mentioned active overtaking has to be scheduled symmetrically in both directions as well. Thus, occupation of the opposite track is fundamentally impossible in the minutes 00 and 30, or 15 and 45 in addition (for 30 min period), and few minutes before and after these times. The exact width of “forbidden timespan” depends on particular section and occupation time of the opposite track by the overtaken train.
Freight trains with extremely low PMR, speed, or extremely long ones are supposed to be scheduled either in freight off-peak hours, provided that one such train can run without disturbing neither passenger nor “standard” freight trains, or at night, after scheduling of “standard” freight trains.
The construction of all relevant PFTPs ends either when the expected peak demand can be reasonably satisfied or when usable capacity is exhausted. As a rule of thumb, if there is necessary to schedule overtaking in more than 33% of the stations on the railway line, the quality of a PFTP is very low, so it should not be scheduled unless justified by sufficient expected demand. The standard recovery margin for PFTPs should be 10% of the calculated theoretical runtime (as usually used in timetabling studies by the authors, see also Haldeman [
29]).
The output of implementation of this framework process is a coordinated periodic timetable pattern of passenger and freight train paths with unified symmetry that can be extended into all-day exact timetable (with some minor adjustments—passenger off-/peak times etc.). PFTPs should be offered to the railway undertakings in following descending priority order:
- (1)
Pre-arranged paths (PaPs) for European Rail Freight Corridors (as defined by Regulation No. 913/2010 [
45]) if relevant;
- (2)
Annual timetable (e.g., combined transport);
- (3)
Ad hoc regime (few days before actual running of the train);
- (4)
Dispatching (delay or another irregularity).
The research question can be formulated as follows: Is it possible, with the help of the framework process introduced above, to schedule such system of differentiated PFTPs within dense and heterogeneous passenger symmetrical periodic timetable (or IPT), that at least 50% of really running freight trains (in each direction) can fit into?
3.3. Materials Required for the Timetabling Experiment
For construction of PFTPs with the help of the framework process introduced above, following inputs are necessary:
Track profile—number of tracks, stations with lengths of relevant tracks, speed and gradient profiles, block signals, etc.;
Model timetable of passenger transport—its periodic pattern including peak only services;
Data indicating demand for PFTPs (at least past demand not older than 7 years).
For each pair of PFTPs (or group of more pairs of PFTPs), following sample train parameters are necessary as an input:
Maximum allowed speed of the trainset (i.e., minimum of maximum allowed speeds of vehicles);
Minimum PMR—relevant for the acceleration phase and section runtimes;
Specific speed profile of the train (if relevant).
3.4. Chosen Prospective Passenger Timetable and Railway Mainline
For the timetabling experiment—railway capacity model with PFTPs, where the method introduced above was applied, such passenger timetable was chosen that was considered unsuitable for freight train paths for the following reasons:
Low period (30 min) of fastest (almost non-stop) trains;
Suburban and regional trains with frequent stopping;
Low arrival and departure headways between following fast and regional trains (and vice versa) that mostly did not enable to schedule a freight train path between them.
The authors used the timetable concept designed in diploma thesis of Rudolf Vávra [
46,
47]—variant “Interposition”. This timetable in the thesis, as well as the following timetabling experiment, were elaborated in FBS-iPLAN software [
48] that the authors’ faculty was licensed to use for academic purposes. The timetabling experiment was then elaborated on the basis of FPL graphic timetable files from Vávra’s thesis [
46], with kind permission of the author and in accordance with the license of the thesis.
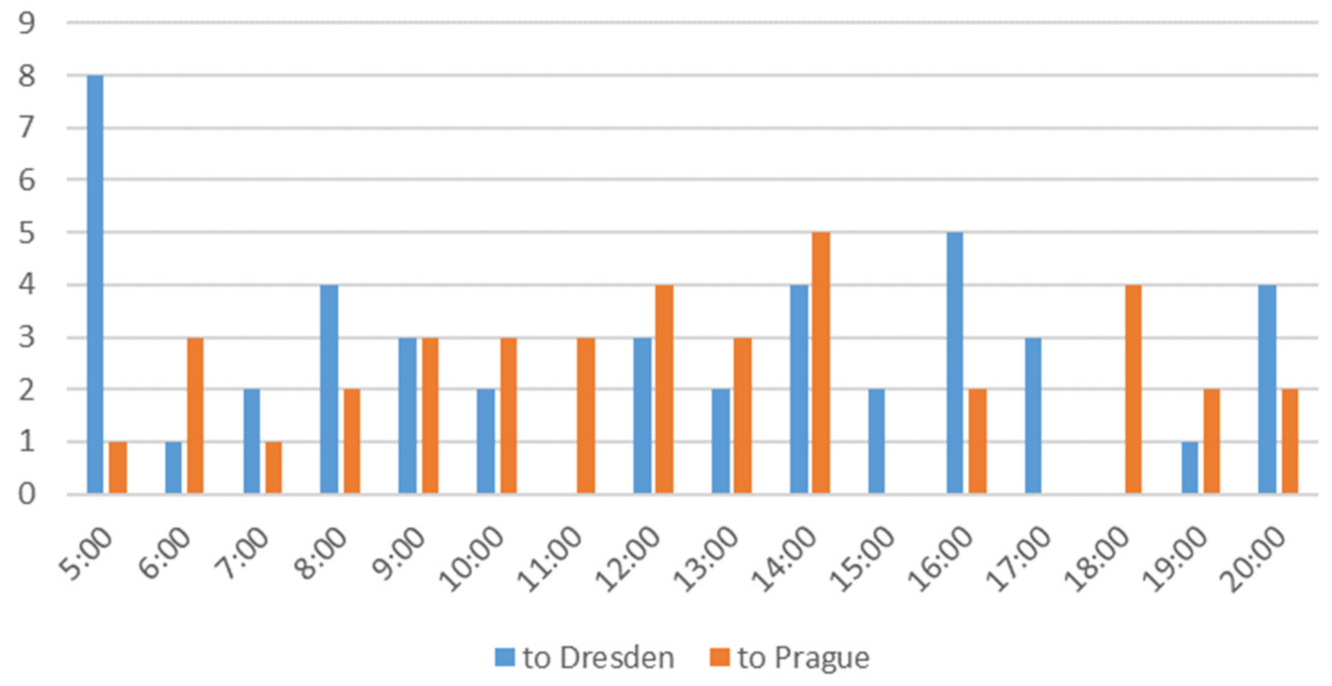
Table 2 shows frequencies of fast and regional segments of passenger transport (per section) in Vávra’s thesis [
46,
47], compared to frequencies in real actual timetable during daytime (5:00 to 21:00) [
49]. The authors added for the purpose of the experiment a pair of hourly regional express trains between Prague and Kralupy, scheduled in interposition with fast trains.
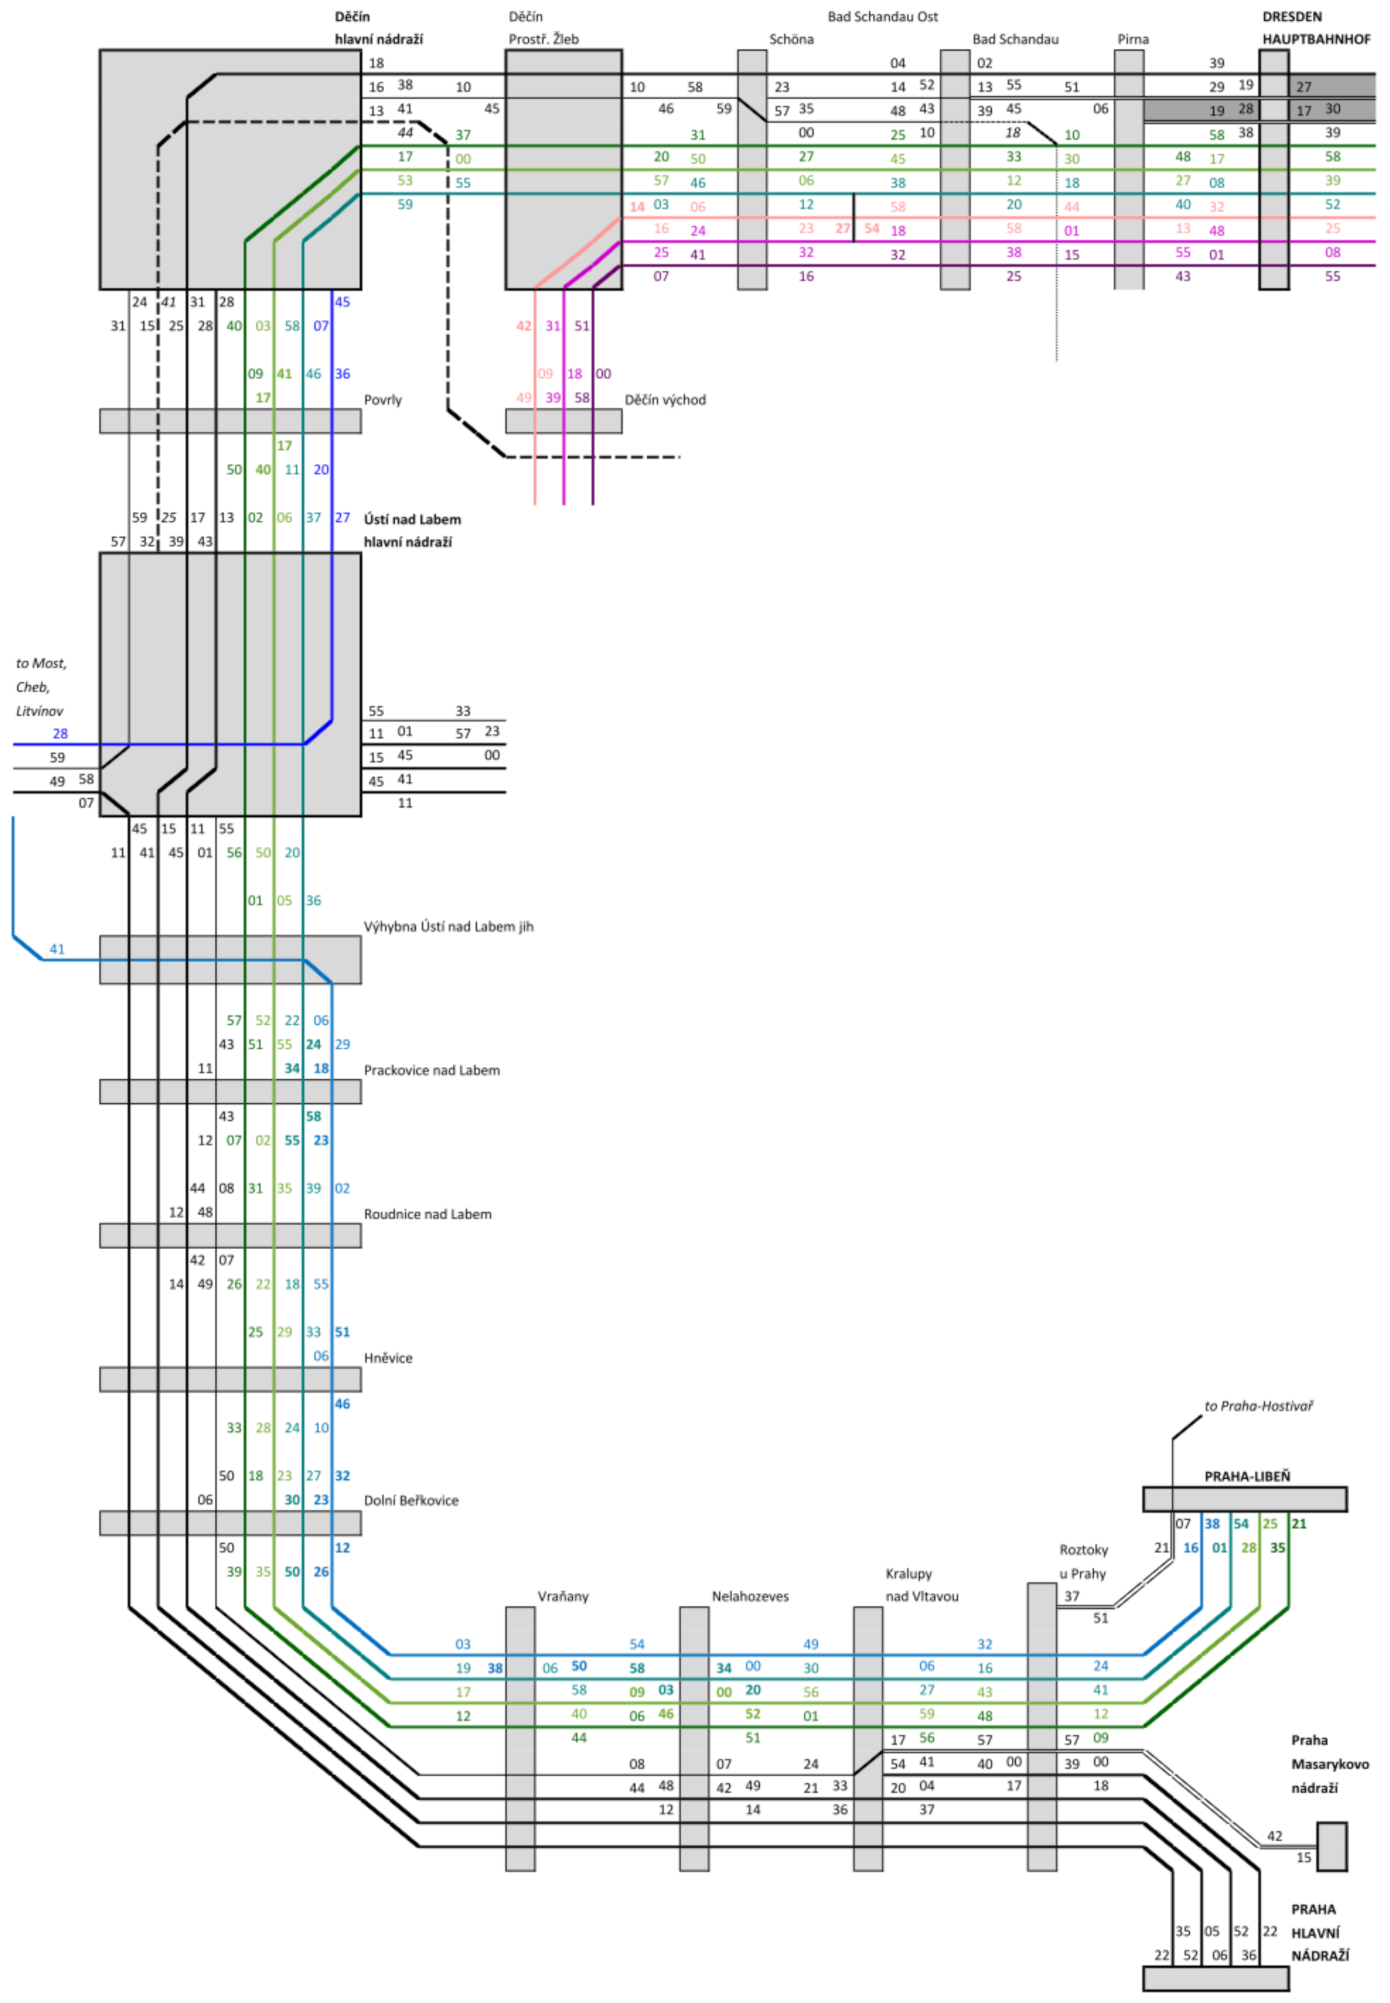
Periodic arrival and departure times (minutes) are displayed in
Figure 4, in the form of a netgraph. It is the scheme of public transport lines, where the line style corresponds to service period. Here, a single full line stands for hourly service, and double full line stands for the 30 min service period. 2-h period is displayed by dashed line. The time descriptors are on the side of travel direction from the edge—on the right. The descriptor closer to a node shows the arrival time, the one further from the node shows the departure time. Minutes at odd hours are written in italics. Intermediate stoppings are displayed on particular lines either as a single point, or as a number of stoppings in a circle—for more detailed explanations see Michl et al. [
50].
Based on the suitable passenger timetable, the railway line 090/091 Praha-Libeň—Praha-Holešovice—Ústí nad Labem—Děčín—Bad Schandau—Dresden Hauptbahnhof (Hbf, main station) was chosen. This mainline is important for passenger transport—long-distance connection of Prague with eastern and middle Germany, and with northern and western Bohemia. In addition, Bohemian-Saxon Switzerland is an important tourist attraction for both neighbouring countries. The mainline runs through Prague and Dresden agglomerations, and closely together located cities of Ústí nad Labem and Děčín. Thus, suburban and regional transport are significant as well—majority of the mainline runs through catchment area of some city stated above [
51].
There is considerable freight traffic on this mainline as well. International traffic is strong, and consists of various goods, for instance, but not only, of intermodal containers from German maritime ports and other terminals to terminals in the Czech Republic or Slovakia. Another significant freight is coal. It is mostly transported from North Bohemian Basin (westwards from Ústí nad Labem). The destinations are coal power plants—e.g., Mělník Power Plant, linked to Dolní Beřkovice and Hněvice stations on this mainline, or power plants eastwards from Prague. In northwestern Bohemia, there is located chemical industry as well, and the chemicals are transported by railway. Last group of goods are wagonload trains with mixed goods. Marshalling yards are situated in stations Praha-Libeň, Kralupy nad Vltavou, Hněvice, Lovosice, Ústí nad Labem západ (slightly aside the mainline, but within Ústí nad Labem node) and Děčín. The stations listed above mostly enable overtaking of 740 m long trains, as required by Article 39, Paragraph 2a of the Regulation (EU) No 1315/2013 [
52]. However, maximum train length is restricted by the Czech infrastructure manager Správa železnic to 658 m [
53,
54,
55].
It is apparent that during early morning and late evening, the passenger demand is considerably lower, and so not all periodic passenger services are scheduled. The results of analysis of current passenger timetable [
49] displayed in
Table 3 and
Table 4 show that there are two main breaking points in frequency of passenger services: 5:00 and 21:00. Consequently, daytime with considerable passenger traffic that creates a significant constraint for freight timetabling, can be considered between 5:00 and 20:59.
3.5. Freight Railway Transport Data
Parameters of freight trains on the mainline Praha—Ústí n. L. were derived from analytical part of research project Optimization of Development of the Railway System of the Czech Republic in Terms of Transport Needs [
57]. Within this project, data on trains that really ran during March 2015 and March 2016, gathered and provided to researchers by Správa železnic, were analysed with the help of hierarchical cluster analysis by Kříž. For each researched mainline, a representative section between neighbouring stations was chosen. For the mainline Praha—Ústí n. L., a section with the highest frequency of trains—between Praha-Bubeneč and Roztoky u Prahy—was chosen.
Cluster analysis was elaborated on the basis on hauled gross mass and total power of locomotives (both data sets were transformed to standard score). Ward’s method clustering with Euclidean distance was chosen. Data of representative trains for each cluster, shown in
Table 5, were determined as 0.8 quantile of values of particular parameter from particular cluster. The clusters are displayed in
Figure 5.
Table 6 shows numbers of scheduled freight train paths (FTPs) in the Czech 2020/2021 railway timetable [
58]. The authors counted all regularly scheduled FTPs, except local (manipulation) freight trains and locomotive trains. For each section displayed in the table, maximum number of FTPs per one section between neighbouring stations within the displayed section (chosen for each direction separately) was considered.
For more accurate estimation of average freight demand for capacity during daytime, when passenger and freight trains have to share the capacity, following assumptions were made:
- (1)
Daytime with considerable passenger traffic lasts 16 h (between 5:00 to 21:00—see numbers of scheduled passenger trains in
Table 3 and
Table 4);
- (2)
Outside daytime, twice as many FTPs can be scheduled, compared to daytime (see average numbers of passenger train paths per hour and direction during the chosen daytime, shown in
Table 3 and
Table 4).
Thus, average numbers of FTPs per section were divided by (16 + 8 × 2), i.e., by 32. This way, average hourly numbers of FTPs during daytime, per section and direction, were estimated.
For further verification of the proposed framework process and timetabling experiment, slightly different data from the same data set [
57] were chosen. The section Lovosice mesto—Malé Žernoseky was chosen, which also lays within the section Praha—Ústí, where the construction of PFTPs is the most complex and challenging. The reason for the choice was that in this section there ran most freight trains (all trains from the south to Ústí and from Lovosice terminal of combined transport northwards). The total number of all really running freight trains through this section during March 2015 and March 2016, except for 53 trains removed from the data set, was 4173 [
57]. There were three reasons for removal (extreme PMR in all cases): trains composed from locomotive(s) only with PMR above 20, other trains with extreme PMR (above 30) and incorrect data (PMR equal to zero).
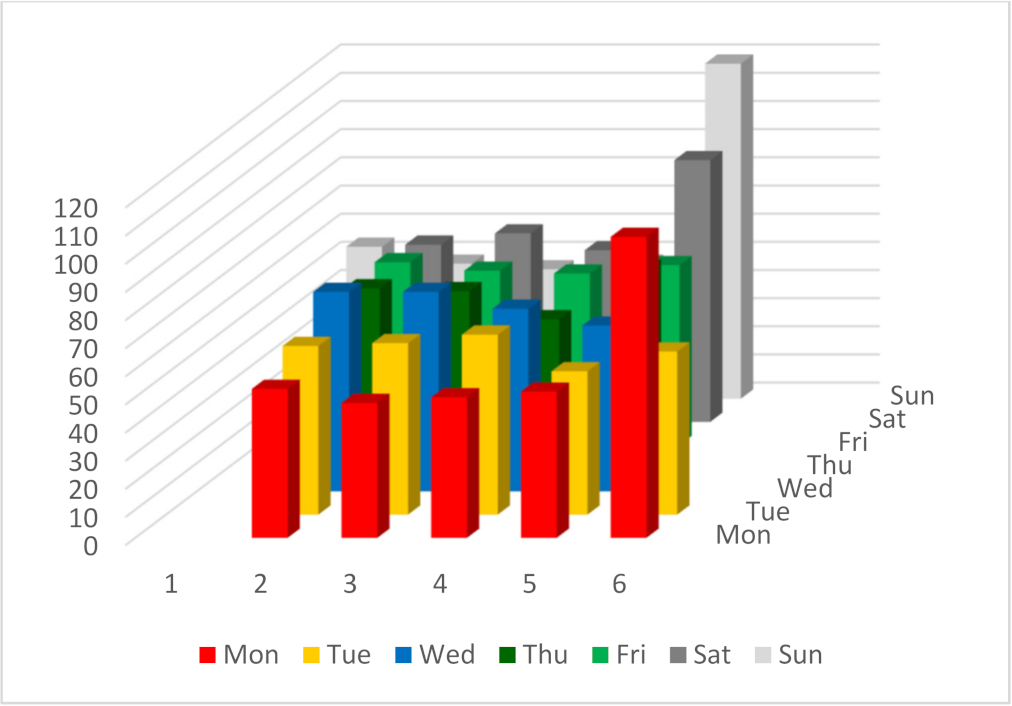
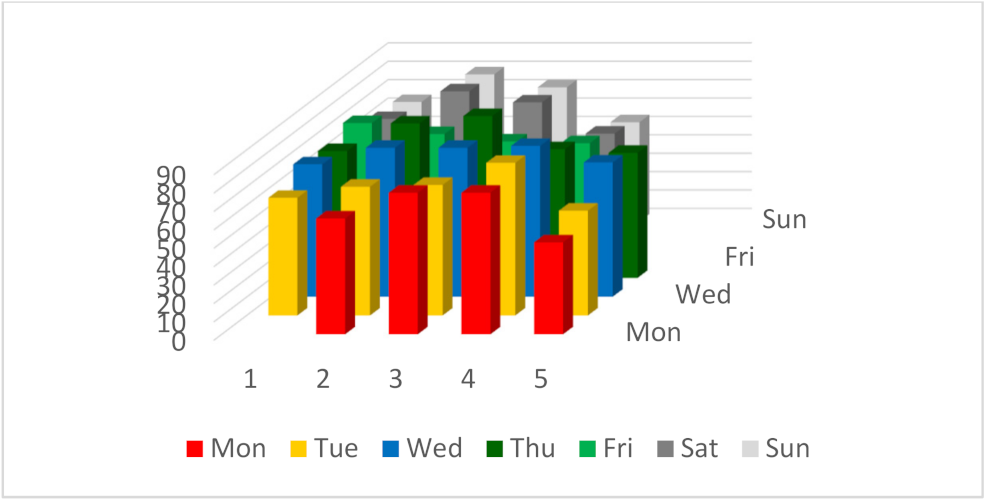
Figure 6 shows an example of considerable fluctuations in number of really running freight trains per hour and direction. The day with the largest number of really running freight trains (119)—29 March 2015—was chosen.
Figure 7 and
Figure 8 show considerable fluctuations in number of really running freight trains per day (years 2015 and 2016 are displayed separately).
3.6. Chosen Sample Freight Trains and PFTPs to Be Scheduled in the Experiment
Parameters of sample freight trains, displayed in
Table 7, were, however, determined by the authors as looser (especially in terms of PMR) to enable more freight trains to use designed PFTPs.
For sample trains of the PFTPs, defined in
Table 7, locomotive classes, which are common on the researched mainline, were used: Class DB (German Railways) 185 for international express freight trains, Class ČDC (Czech Railways Cargo) 372 for freight trains from/to “right-shore” mainline 072/073 to Dresden and DC only locomotives for local PFTPs between Prague and Děčín—a rather obsolete, but still common Class ČD (Czech Railways) 121 and more powerful Class ČD 163. The power values displayed in
Table 7 are cited from FBS-iPLAN locomotive database [
48].
For the timetabling experiment, only electric locomotives were considered. However, freight trains with diesel locomotive(s) can use such PFTPs as well, given sufficient PMR.
For the global PFTPs between Prague and Dresden, comparably higher PMRs (between 2.2 and 2.5) were chosen, so that better quality of a PFTP—or, at least, higher acceleration after stop for an overtaking—can be ensured.
The local PFTPs between Prague and Ústí were, on the other hand, designed for trains with lower PMR (between circa 1 and 1.5)—coal or mixed (freight) trains.
Between Děčín-Prostřední Žleb, where the “right-shore” mainline 072/073 from Kolín with busy freight traffic connects to the researched mainline, and Dresden, PFTPs for various freight trains have to be considered. So, the chosen PMRs vary from circa 1.2 to 3.1.
Quantiles (semi-deciles) of PMR from the data set [
57] are displayed in
Table 8. If PMR was the only limiting parameter of a freight train, circa 80% of real freight trains from the data set [
57] would fit into the local PFTPs and 55% into the global PFTPs. However, there remains maximum speed of a train—lower values than 90 km/h would prevent a train from any PFTP. Another limiting parameter—train length—will be defined after the timetabling experiment. The length limit will depend on the shortest station track used for overtaking for particular PFTP and direction (see
Section 4.2).
Compared with estimated numbers of freight train paths per daytime hour, section and direction (see
Table 3 and
Table 4), the authors have decided to schedule approximately double hourly numbers of PFTPs to meet the demand fluctuations (see
Figure 6,
Figure 7 and
Figure 8).
Maximum speeds of the sample trains for PFTPs were distributed in accordance with their relative frequencies in the data set in particular directions [
57]. For the direction from Prague to Dresden, relative frequencies of speeds 90/95 and 100 km/h (or higher) are 35.36% and 58.36% For the direction from Dresden to Prague, relative frequencies of speeds 90/95 and 100 km/h (or higher) are 52.40% and 40.03%.
4. Results
4.1. Construction of PFTPs
The timetabling experiment was elaborated in FBS-iPLAN software [
48], on the basis of FPL graphic timetable files from Vávra’s thesis [
46], with kind permission of the author and in accordance with license of the thesis. Further, academic licenses of Microsoft Excel
® [
59] and MATLAB [
60] software tools were used for processing of the freight train data [
57,
58].
The timetabling experiment has resulted in scheduling of eight pairs of hourly PFTPs with unified symmetry (for parameters, see
Table 7). Three pairs of global PFTPs proceeded during the whole solved mainline, three pairs between Děčín-Prostřední Žleb and Dresden (to connect Dresden node with the “right-shore” mainline 072/073),one between Prague and Ústí, and one between Ústí and Děčín (both for trains with low PMR). The netgraph with periodic passenger and freight train paths is displayed in
Figure 9. Recovery margins (surcharges) per section and direction are displayed in
Table 9. Active overtaking (PFTP 41xxx) took place between Nelahozeves and Vraňany, and between Ústí and Povrly (in both directions). Resulting graphical timetable (train diagram) is attached as
Supplementary Material Figure S1.
It is evident that more passenger (and freight) train paths per hour cannot enable lower average number of scheduled stops for overtaking per one freight train path. However, all PFTPs are supposed to be utilized only in absolute peaks of freight operators’ demand, which is few days in a month, and only for some hours during such a day (see
Figure 6,
Figure 7 and
Figure 8). Average numbers of stops per freight train path in 2020/2021 timetable [
58] and in the presented experiment are compared in
Table 10.
The above stated numbers of scheduled stops would have been higher, if extensive “bending” (artificial runtime lengthening) of PFTPs had not been implemented. Such “bending” is evident from
Table 9—see the recovery margins over 10%. The first section, where all PFTPs (except 65xxx with comparably low PMR) had to be bent, was from Prague node to Kralupy. The reason was homogenization of train paths with frequently stopping suburban passenger trains (otherwise there would have been lack of railway capacity for PFTPs).
Between Kralupy and Ústí, the bundled PFTPs 41xxx and 45xxx were slightly bent for enabling necessary synchronization runtime of 41xxx—between two cases of active overtaking. During the first one (between Nelahozeves and Vraňany), 41xxx was even more bent to have enough long sectional runtime to be overtaken by nonstop fast train to Cheb. On the other hand, standard recovery margin of 41xxx was reduced between Ústí and Povrly to enable overtaking of a frequently stopping regional passenger train. The above described solution is functionally symmetrical for both directions (and difference between recovery margins in direction there and back is comparably low).
For the pair of PFTPs 65xxx, no bending in any direction was implemented. On the contrary—the standard recovery margin had to be reduced from Hněvice to Ústí and from Ústí to Nelahozeves, otherwise there would have been necessary more scheduled stops for overtaking. The pair of short PFTPs 67xxx had standard recovery margin 10% in both directions.
The timetabling experiment has demonstrated that high level of external unified symmetry of PFTP could be maintained. The only exception was the pair of PFTPs 65xxx with low PMR, scheduled between Prague and Ústí. From Prague, most probably thanks to ride down the stream of Vltava and Labe rivers, only two stops for overtaking were scheduled. In the opposite direction, there were scheduled four stops for overtaking between Ústí and Prague. This discrepancy has influenced asymmetric arrival and departure time from/to direction Ústí nad Labem západ node station (in the junction Ústí nad Labem jih next to Ústí main station).
For all other PFTPs, external unified symmetry was maintained. For almost all of them, internal unified symmetry was maintained as well. The only exception was the pair of PFTPs 42xxx between Děčín-Prostřední Žleb and Dresden. As a pair of PFTPs (for given distance) with the lowest PMR, it was chosen to be stopped in Děčín-Prostřední Žleb in the direction Děčín východ (and in Bad Schandau Ost in the opposite direction) for the purpose of synchronization with free symmetric time slots on the single-track section between the stations Děčín-Prostřední Žleb and Děčín východ (which lays on the “right-shore” mainline 072/073).
For practical reasons (actual passenger timetable—see
Figure 4), the timetable symmetry axis of PFTPs was not the minute zero, but the minutes circa 56 to 58.
The proposed catalogue PFTPs can be used by freight operators in different ways, depending on actual capacity utilization on particular day and at particular hour. The default case is that each PFTP is used by a train with corresponding parameters.
When at least one PFTP at particular hour and direction is not used, some changes in ad-hoc (daily) timetabling or train dispatching are possible. For example, a suitable train with shorter route can be scheduled in a part of the corresponding PFTP. Or, if the parameters of the particular train are suitable for two different PFTPs, an additional stop can be scheduled, and the train can use both PFTPs partially.
If more PFTPs remain free, the best one (in terms of number of scheduled stops) can be allocated for the train—given the train fulfils sufficient parameters to fit into it.
4.2. Limitations of Train Length
Table 11 shows maximum length of a freight train, including locomotive(s). It was calculated from the usable length of the shortest station track scheduled for overtaking for particular PFTP. From this length (between departure signals in opposite directions as a rule [
58]), 20 m was subtracted to ensure visibility of the signal from the driver’s cab and to ensure smooth arrival and stopping of a freight train on the track.
For some PFTPs that are not scheduled to stop (41xxx, 46xxx and 48xxx), the only limit for length of a train was defined by the infrastructure manager—Správa železnic [
53,
54,
55].
4.3. Numbers of Really Running Freight Train That Would Fit into Designed PFTPs
The benefit of the above proposed offer of differentiated (segmented) PFTPs is measurable by share of real freight trains (for given timespan) whose parameters would be suitable for at least one PFTP in particular direction. It gives us information, which share of trains can run during daytime (given that demand in particular hour and direction is not exceeded) and which share of trains has to be scheduled at night.
Estimation of share of real freight trains that would fit into proposed PFTPs was elaborated, based on the data from March 2015 and March 2016, provided by Správa železnic for the analytical part of research project Optimization of Development of the Railway System of the Czech Republic in Terms of Transport Needs [
57], since there are legal obstacles for obtaining more recent data so far (commercial sensitivity). The proposed framework process is generic, and thus independent of particular annual timetable. So, a prospective “freight-unfriendly” passenger timetable can be for the sake of the verification of the framework process combined with few years old historical data on freight trains. The section Lovosice mesto—Malé Žernoseky was chosen, which lays within section Praha—Ústí, where the construction of PFTPs was the most complex and challenging. In this section, there should run the most freight trains (all trains from the south to Ústí and from Lovosice terminal of combined transport northwards).
Due to differentiated parameters for each PFTP and even direction, determination of all suitable trains is comparably complex. Freight trains that either are not suitable at all because of low maximum speed, low PMR or both, and freight trains that fit only into one PFTP, are the easiest to determine and calculate.
For all other freight trains, their maximum speed and PMR correspond to two or more PFTPs in particular direction, So, if they fit into at least one of the corresponding length limits, they are suitable for the proposed PFTPs.
Table 12 shows numbers of suitable trains per (sub)category and direction.
Table 13 shows numbers of unsuitable trains in the same way.
The data displayed in
Table 12 and
Table 13 show that the most limiting parameter of freight trains that prevents them from fitting into any PFTP is low PMR. It predominantly affects trains in the direction to Prague. Further limiting parameter is maximum speed lower than 90 km/h. For some trains with sufficient speed and PMR higher or equal to 0.98, but lower than 2.26, their high length prevents them from fitting into any PFTP. In total, much higher share of unsuitable trains in the direction to Prague is caused mostly by trains with PMR lower than 0.98.
The research question from the end of
Section 3.2 can be responded positively—even the worse result for the direction to Prague is higher than 50% (55.4% of really running freight trains in this direction are suitable for the PFTPs designed according to the proposed framework process).
4.4. Sensitivity Analysis—Variable Lowest Allowed PMR for the PFTP 65xxx
The results presented above should be verified with the help of sensitivity analysis. The purpose of conducting a sensitivity analysis is changing an input value to see the extent of changes in the output (results). Thus, it is necessary to choose variable(s), whose input values will be changed.
Only 289 trains from the data set [
57], which is 6.93% of all researched trains, would not fit into proposed PFTPs because of allowed speed, which is lower than 90 km/h. Allowed maximum length of a train is determined by the shortest station track, where stopping (for overtaking by a faster train) is scheduled, so neither speed nor length are suitable variables for sensitivity analysis. That leaves only PMR.
755 trains would not fit into proposed PFTPs because of PMR lower than 0.98. After subtraction of 41 trains with speed lower than 90 km/h, there remain 714 trains that, however, may as well not fit into the PFTPs because of length. The PFTP 65xxx with the lowest minimum PMR is restricted by maximum train length 615 m, if scheduled to Dresden, and 593 m, if scheduled to Prague. From 714 trains, there remain 35 trains to Dresden (no train exceeds the allowed length) and 676 trains to Prague (only three additional trains exceed the allowed length). As a result, there are 711 trains which are restricted only by little PMR.
The authors propose following sensitivity analysis. The only variable which is suitable for changing its values (as an input) is PMR, which leads to changing one-factor-at-a-time. Since PMR values occur in the data set in a discrete way, the steps were chosen to be discrete as well. Let the minimum allowed PMR for the PFTP gradually change from 0.5 to 1.5, with the step 0.1. The reference values (one for each direction) are numbers of trains that would fit (only) into the PFTP 65xxx, given the minimum allowed PMR is equal to 0.98 (as defined in the timetabling experiment above). For the direction from Prague to Dresden, reference value is 354 trains. For the direction from Dresden to Prague, reference value is 306 trains (see first three rows of
Table 12). Absolute differences are calculated as subtraction between number of trains that would fit (only) into the PFTP 65xxx in particular direction and reference value for this direction. Maximum allowed PMR is always lower than 2.26, so no trains considered in the sensitivity analysis can fit into any another PFTP.
Then, for each step, new share of suitable trains for particular direction is calculated with following formulas (one for each direction) as percentual share of all suitable trains in particular direction with the lowest PMR
i to all researched trains in particular direction (sums of suitable trains for the lowest PMR 0.98 and sums of all researched trains per each direction can be derived from the sums per direction in
Table 12 and
Table 13):
for the direction from Prague to Dresden, where
Di,PD is absolute difference in number of suitable trains for the direction from Prague to Dresden and lowest PMR i;
Si,PD is share of suitable trains for the same direction and lowest PMR i in percent.
and:
for the direction from Dresden to Prague, where
Di,DP is absolute difference in number of suitable trains for the direction from Dresden to Prague and lowest PMR i;
Si,DP is share of suitable trains for the same direction and lowest PMR i in percent.
Results of sensitivity analysis for each direction are displayed in
Table 14 and
Table 15. Default PMRs with zero difference and corresponding reference shares of suitable trains are displayed in the sixth rows of both tables.
Sensitivity analysis for this direction shows little differences in number of suitable trains, whose absolute values slightly increase when the lowest allowed PMR increases.
Sensitivity analysis for the direction from Dresden to Prague shows a strong leap in number of suitable trains when the lowest allowed PMR reaches the value 0.8—see the fourth row in
Table 15. This finding corresponds with large difference in numbers of suitable trains in comparison to another direction. Considering known origins and destinations of freight rail transport on and around the researched mainline, the authors believe that most of the trains with PMR around 0.8 are loaded coal trains, running from coal mines in Northwestern Bohemia southwards. Not only their gross hauled mass mostly exceeds 2400 t, but the tractive power of their locomotives is comparably low—approximately 2000 kW. Such trains are hauled mostly by obsolete electric locomotives, so their replacement by newer and more powerful ones is only a matter of time.
6. Conclusions
Railway plays a key role in the transition towards sustainable transportation system. However, coexistence of busy passenger and freight traffic on the same infrastructure represents a challenge to the timetabling process. In Central Europe, periodic timetable or IPT prevail in passenger transport, so planning of freight capacity in a periodic pattern with unified symmetry can simplify the timetabling process and make it more transparent.
The data used for verification of the timetabling experiment [
57] has clearly shown that parameters of freight trains, even on the same mainline, were very diverse. Thus, one sample freight train for construction of PFTPs was definitely not enough to meet at least majority of demand from the freight rail operators. Further, the same data have shown considerable fluctuations of numbers of really running freight trains per direction, during both week and day.
To the authors’ knowledge, no proposal for such detailed differentiation (segmentation) of PFTPs has been published so far. Due to prevalence of quantitative timetabling research with few criteria to be optimised and considerable simplifications (especially in the field of freight train paths), there still remains a gap between sophisticated theory and practice in the freight train path allocation. The authors developed the proposed framework process, which included design of differentiated PFTPs with various construction priority with the aim of helping to fill this gap. The proposed process can, for instance, advantageously complement the framework process proposed in Drábek’s doctoral thesis [
18].
The resulting symmetrical timetable of hourly PFTPs evinces strong variedness, depending on section of the solved mainline. From Prague to Kralupy, a bottleneck full of mixed passenger traffic forces PFTPs to be strictly parallel and bundled by two subsequent ones. So, the PFTP 65xxx with the lowest PMR determines the “gradient angle” of all PFTPs in both directions. Other PFTPs in the bottleneck have to be slowed accordingly, otherwise the train path heterogeneity would increase, and, as a result, capacity would decrease.
The timetabling experiment (case study) has demonstrated correctness of the presented framework process, as well as its limits given by density and heterogeneity of passenger railway (the latter caused mainly by speed of long-distance trains and frequency of stops of regional trains). The research question, whether at least 50% of really run freight trains from the available data set (in each direction) can fit into PFTPs designed in accordance with the proposed framework process, was responded positively. In the direction to Dresden, 88.26% of the researched trains were suitable. In the direction to Prague, only 55.42% of researched freight trains were suitable, due to significant share of loaded coal trains from Ústí nad Labem southwards, characterized with low power-to-mass ratio (PMR) due to obsolete electric locomotives. However, their replacement by more powerful ones is only a matter of time.
The resulting line periodic timetable has clearly shown that freight railway suffers not directly from frequency of passenger trains, but from their high heterogeneity in terms of average speed. Regional train paths are obviously considerably more heterogeneous to PFTPs than the long-distance ones. Keeping present frequency of long-distance offer is not advisable, as long-distance train ridership has been growing [
62]. Thus, the only sustainable solution is restriction of regional train stopping in the stops with low passenger demand. Since this measure is extremely politically sensitive, following measure is recommended—regional trains should serve such stops only in 2-h period all-day (as in some sections and times nowadays). The saved time windows should be scheduled so that at least some PFTPs can be scheduled with one less stopping. The peak times, in reasonable timespans, should make an exception, which would lower PFTP quality to the above proposed timetable.
For the sake of not exceeding reasonable level of complexity, the authors did not include in the proposed framework process any modifications of passenger timetable. This limitation makes creation of new time windows for passage of a freight train between two passenger trains impossible.
All PFTPs were scheduled to stop in Praha-Libeň marshalling yard. There is a busy triple-track mainline, which proceeds eastwards. There is also a single-track freight by- pass line which leads further southwards or westwards. However, this line crosses the busy triple-track mainline without a flyover. Thus, before there will be built a double-track flyover, the capacity is very low. This is the main limitation of the proposed concept of PFTPs.
During the timetabling experiment, another significant limitation has emerged—loaded coal trains running from Ústí southwards (direction to Prague)—see
Section 4.4. Since they were hauled by obsolete locomotives, their PMR was mostly 0.8 or slightly higher. Thus, hundreds of such trains did not fit even into the PFTP 65xxx with the lowest allowed PMR—which cannot be set lower because of passenger timetable constraints (and likely additional overtaking(s) as a result). However, train data were from the years 2015 and 2016. On the other hand, the passenger operational concept with 30 min period of the fastest train segment has been not implemented in 2020/2021 timetable [
49]. So, practical impact of this limitation is likely to be lower, thanks to gradual replacements of the obsolete locomotives by new, more powerful, ones. This problem occurs practically only in one direction, since the same trains run back unloaded, and consequently with enough high PMR.
Another significant limitation of the timetable experiment is that the freight train data are related to the section Prague—Ústí. However, PFTPs for other sections have mostly looser length limits and numbers of scheduled stops are considerably lower. Their PMR limits are higher, but for German electrification system 15 kW 16.7 Hz, which begins at the Czech-German border, only the more powerful locomotives (at least circa 3 MW) are available.
The presented timetabling experiment, as well as similar experiments in Drábek’s doctoral thesis [
18] have shown that some particular sections (or, more broadly, some sections between two stops for overtaking) are limiting parameters of a freight train—PMR, given some minimum recovery margin (surcharge, buffer time) to technical (theoretical) runtime, and maximum length of the train, depending on the shortest utilized overtaking track. A similar symmetric periodic timetable, coordinated for both passenger and freight trains, with more balanced distribution of such limitations would enable an increase in freight railway transport capacity, without costly construction. However, it is necessary to formulate a suitable mathematical approach, whose application would not deteriorate other criteria, relevant for the timetable.
Another persisting problem, with overlap to jurisprudence, that does not have impact only on freight, but also on passenger railway, is excessive frequency of stopping of suburban and regional trains, which is in many cases not justified by sufficient passenger demand. So, the settlements that generate the least demand, can be in most cases served by bus instead. The problem consists in penalization of small group of inhabitants (in terms of longer travel time and/or extra transfer) for the sake of increase of mainline capacity (by decrease of train path heterogeneity in the sense of 1st edition of UIC 406 Codex [
23]).
Gradual realization of parallel high-speed railway lines will on the one hand relieve the conventional mainlines from majority of long-distance passenger trains. On the other hand, there will occur new dimension of complexity of the network timetabling process. Due to anticipated increase in total passenger traffic, new bottlenecks are likely to occur, especially in agglomeration node areas, such as Prague or Ústí nad Labem. For the freight railway, higher capacity outside bottlenecks will be counterweighted by necessity of more accurate scheduling (and real-time dispatching) through major bottlenecks. These problems will likely further emphasize the network-oriented and multicriterial aspects of the railway operation research.
The presented approach which enables the composition of passenger train paths in IPT and differentiated, hierarchically constructed symmetric PTFPs could serve as a basic input methodology for capacity analyses, which are necessary for increasing the share of rail freight transport on the transport market and for the whole concept of sustainable freight transport.


