Article

Microbiological Attributes and Performance of the Bacterial Community in Brazilian Cerrado Soil with Different Cover Crops

by
Sebastião Ferreira de Lima
1,*,
Vinicius Andrade Secco
1,
Cátia Aparecida Simon
2,
Antônio Marcos Miranda Silva
2,
Eduardo Pradi Vendruscolo
3,
Maria Gabriela de Oliveira Andrade
4,
Lucymara Merquides Contardi
5,
Ana Paula Leite de Lima
1,
Meire Aparecida Silvestrini Cordeiro
1 and
Mariele Silva Abreu
1
1
Campus Chapadão do Sul, Federal University of Mato Grosso do Sul, Chapadão do Sul 79560-000, Brazil
2
Soil Science Department, “Luiz de Queiroz” College of Agriculture, University of São Paulo, Piracicaba 13418-000, Brazil
3
Campus Cassilândia, State University of Mato Grosso do Sul, Cassilândia 79540-000, Brazil
4
Plant Breeding and Production Department, State University of São Paulo, Botucatu 18610-034, Brazil
5
Phytotechnics, Food Technology and Socio-Economics Department, State University of São Paulo, Ilha Solteira 15385-000, Brazil
*
Author to whom correspondence should be addressed.
Sustainability 2021, 13(15), 8318; https://doi.org/10.3390/su13158318
Submission received: 19 May 2021 / Revised: 23 June 2021 / Accepted: 1 July 2021 / Published: 26 July 2021

Abstract

:
Soil microbiological indicators are essential tools to understand how the management with cover crops interferes in the activity and the soil microbial community. Thus, the objective of the study was to evaluate microbiological attributes and performance of the bacterial community in the soil of the Brazilian Cerrado with different cover crops. The experiment was performed in a randomized block design, evaluating seven cover crops, Sorghum bicolor, Crotalaria ochroleuca, Pennisetum americanum, Panicum miliaceum, Raphanus sativus, Urochloa brizantha, Urochloa ruziziensis, and a fallow area. Cover aerial biomass dry weight (CB), microbial biomass carbon (MBC), basal soil respiration (BR), metabolic quotient (qCO2), and abundance and structure of bacterial community based on the rrs 16S rRNA gene were evaluated. In the soil cultivated with S. bicolor there was the highest CB and MBC at the same time as there was less microbial activity (lower BR and qCO2). The structure of the bacterial community was more differentiated in soils cultivated with S. bicolor, P. americanum, and C. ochroleuca. The MBC was more associated with cover crops of the Urochloa genus, while BR was positively correlated with S. bicolor. Bacterial abundance was positively correlated with P. miliaceum.

1. Introduction

One of the main modulators of the microbial community in the soil is pH, which can influence the availability of nutrients. Other attributes, such as soil carbon and organic nitrogen, are also essential to the permanence, adaptability, and modulation of the soil microbiome [1]. In this way, the physical, biological, and chemical parameters are strictly related to sustaining soil life and health [2].
Among important biochemical processes that occur in the soil and are driven by microbial biomass for nutrient availability, there are mineralization (nutrient release) and immobilization (temporary nutrient entrapment) [2]. Thus, when organic material is deposited in the soil, fragmentation by the soil fauna occurs (macro and mesofauna), then, by the action of enzymatic oxidation catalyzed by the soil microorganisms, there is the availability or unavailability of the nutrients, depending on the quality of the material that was brought into the soil. Soil enzymes have several origins, from those temporarily complexed in the enzyme–soil complex (enzyme–humus or enzyme–clay) to those excreted by plants and microorganisms, the latter being the main source of enzymes in the soil [3].
Soil microbial attributes are sensitive indicators that can be used to monitor environmental changes resulting from agricultural use. These indicators can also guide the planning and management of the soil and crops to be used [4,5,6]. In addition to soil enzyme activity, other indicators are widely used, such as carbon from soil microbial biomass (MBC) and basal soil respiration (BR). The structure of the soil microbial community has also been investigated using the terminal restriction fragment length polymorphism (T-RFLP) technique, in which the microbial community (bacterial, fungal, or specific groups of these) can be accessed from the region conserved in the genome of these groups [7]. Thus, associating these indicators with soil management in field studies is essential to understand the actions of the soil microbial community, and consequently, assist in the management decision-making process that can bring greater economic profitability to the producer and ecological quality for the soil [8].
In the Brazilian agricultural scenario, some studies have shown how the diversity of plant residues in areas under no-tillage affects the soil’s chemical and microbiological attributes [9,10]. This is because plant residues from different cover crops have distinctions regarding chemical composition and release of organic compounds in the rhizosphere, which can result in different associated microbial communities [11,12]. With that, it was noticed that the quality and quantity of vegetal residue deposited in the soil are essential factors for the increase in the stocks of organic carbon [13,14]. In soybean (Glycine Max L.) cultivation, the use of cover crops of the genus Urochloa sp. has been promising for increasing the carbon of microbial biomass, probably due to the increase in dry matter in the soil [9]. In contrast, in corn (Zea Mays L.) cultivation, the second most-produced grain crop in Brazil, the use of plants of the genus Urochloa sp. in succession does not provide increases in dry matter of residues in the soil [10]. Many of the studies that evaluate the dynamics of microbiological attributes in the cultivation of corn in succession to cover crops do not address the responses of the soil bacterial community through access to the soil’s genetic material.
This work hypothesizes that the different cover crops modulate the abundance and structure of the soil bacterial community, translated into different responses of the microbiological attributes. Thus, the objective of the work was to evaluate microbiological attributes sensitive to management practices to understand the response of the bacterial community in Brazilian Cerrado soil with different cover crops.

2. Materials and Methods

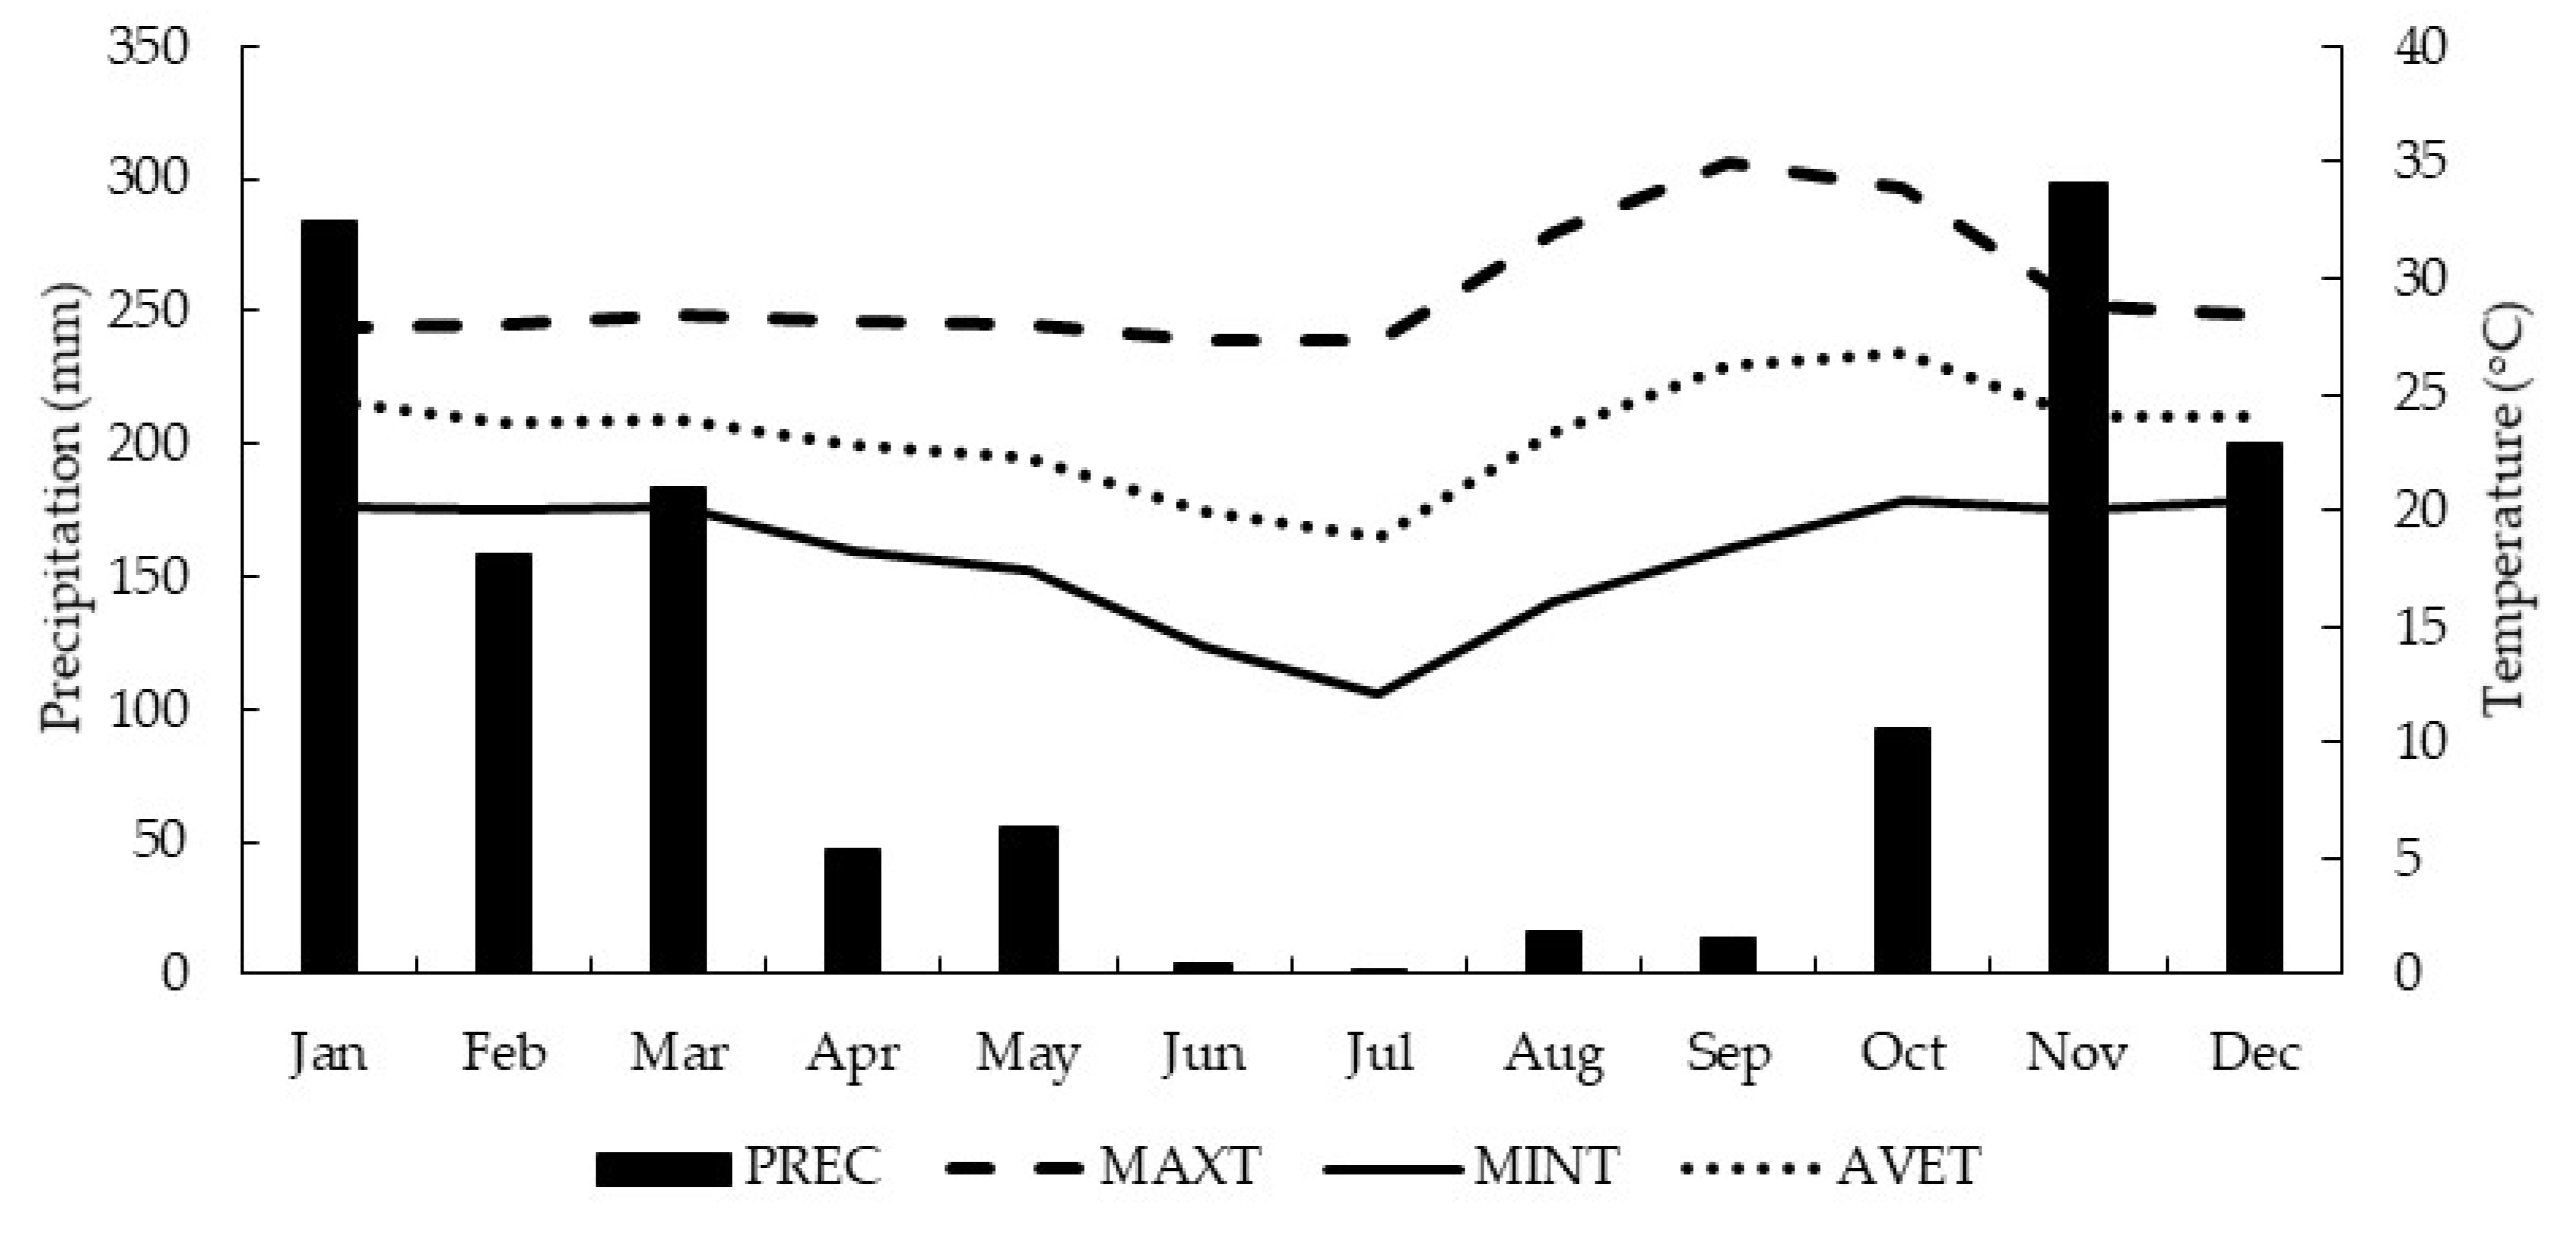
2.1. Experimental Characterization

The experiment was conducted in an area of the Federal University of Mato Grosso do Sul, Chapadão do Sul Campus, Brazil (latitude 18°48′459′′ south; longitude 52°36′003′′ west; altitude of 820 m). The climate of the region, according to the Köppen–Geiger classification, is of the Cwa type (humid tropical) with a rainy season in summer (December–March) and drought in winter (June–September). The climatic records for the period of the experiment were obtained in the database POWER Data Access Viewer (2019) (Figure 1).
The soil of the experimental area was classified as Latossolo Vermelho distrófico [15], used in a no-till system. The experimental area had been under a no-tillage system for five years, during which the rotation of crops with soybeans/corn was done during the harvest (October to March) and sowing of cover crops in the offseason (March). For this experiment, cover crops were sown in March 2018.

2.2. Experimental Design

The experimental design used was a randomized block with eight treatments and four replications, totaling 32 plots. For molecular analyzes, only three repetitions were used for each treatment. The treatments were composed of different cover crops: Sorghum bicolor (L.) Moench, Crotalaria ochroleuca G. Dom, Pennisetum americanum (L.) leek, Panicum miliaceum L., Raphanus sativus L., Urochloa brizantha (Hochst. ex. A. Rich) Stapf cv. Xaraés, U. ruziziensis Germain and Evrard, and a fallow area. The plots were of 2.25 m wide and 5 m long. Before sowing the cover crops, the total area was desiccated using glyphosate (1.0 kg i.a ha−1) + 2.4D (1.0 kg i.a ha−1).
Cover crops were sown manually in furrows spaced 0.45 m apart and which were opened by a mechanized seeder, then they were covered with a thin layer of soil, also manually. At sowing, no fertilization, weed control or any other management on the cover crops cultivation was carried out. Chemical characteristics [16] and texture of the soil [17] were determined by laboratory analysis (Table 1).

2.3. Soil Sampling for Microbiological Determination and Plant Biomass

Soil samples for microbiological analysis and cover crop aerial biomass were collected 60 days after cover crops sowing. Soil sampling to determine microbiological attributes was carried out at a depth of 0–10 cm, collecting five subsamples in each plot at four different points, on rows and between rows. To increase the representativeness of the study area, five simple equidistant samples were taken at each point, 12 cm apart, creating a composite sample [9]. The soil was sieved through a 4.0 mm mesh and stored in a cold chamber at 4 °C. For molecular analysis, soil fractions were stored at −80 °C.
To determine the cover aerial biomass dry weight, the aerial part of three rows of one meter from each plot was collected. Each portion was weighed, and aliquots were removed from the original sample. The aliquots were weighed on an analytical balance and the plants were taken to dry in an oven with forced air ventilation, at a temperature of 65 °C, until reaching constant mass, and then weighed again.

2.4. Determination of Microbial Biomass Carbon (MBC), Basal Soil Respiration (BR), and Metabolic Quotient (qCO2)

The MBC was estimated through the fumigation-extraction method [18]. Each sample was divided into two groups of four subsamples. Four subsamples were submitted to fumigation followed by extraction and four for immediate extraction after weighing, without fumigation. Twenty grams of soil were stored in a 100 mL flask, which was transferred to a desiccator, together with a flask with water and another containing 10 mL of chloroform ethanol-free CHCl3, remaining under fumigation in an incubation room kept in the dark, with controlled temperature (37 °C), for 24 h. Then, the CHCl3 was removed by successive aspirations. K2SO4 (50 mL of 0.5 mol L−1) with the pH adjusted in the range of 6.5 to 6.8 was followed by the extraction in a shaker with horizontal circular motion at 220 rpm for 30 min. The determination of C in the fumigated and non-fumigated extracts was performed by dichromatometric titration. From removing an 8 mL aliquot of the extract, 2 mL of K2Cr2O7 0.066 mol L−1, 10 mL of concentrated H2SO4 and 5 mL of concentrated H3PO4 were added. 80 mL of distilled water and three drops of diphenylamine (indicator) were added. With the addition of the indicator, the solution turned from yellow to violet. The excess dichromate was titrated with (NH4)2Fe(SO4)2·6H2O 0.033 mol·L−1 (turning point: violet to green). Bottles without soil, blank test containing all reagents received the same treatment given the samples being used as a control.
To quantify basal respiration (BR), a 40 mL wide-mouth reservoir containing 25 mL of NaOH (2 N) was used. The determination of BR was based on the technique of respirometry [19] consisting of measurement through the difference between the volume of acid necessary to neutralize sodium hydroxide. At predetermined intervals of 7 days, the containers were opened, and the solution was titrated with 2N HCl in the presence of an acid/phenolphthalein base indicator. After reading, the same amount of NaOH was replaced, and the containers closed again. The difference between the volume of acid needed to neutralize sodium hydroxide for control and that in treatments is equivalent to the amount of carbon dioxide produced by soil microorganisms.
To determine the metabolic quotient (qCO2), the procedure described by Anderson and Domsch [20] was used, according to the equation qCO2 = C-CO2/MBC, where C-CO2 is the soil basal respiration rate (mg of C-CO2 kg−1), and MBC is the microbial biomass carbon (mg of CO2 kg−1).

2.5. Soil Total DNA Extraction

The soil total DNA was extracted with the commercial kit Power Soil DNA extraction (MoBio, USA), following the manufacturer’s instructions, from 0.4 g of the soil. After extraction, the integrity and quality of the obtained DNAs were verified by electrophoresis on 1% agarose gel (w/v), followed by visualization in ultraviolet light.

2.6. Abundance of the Bacterial Community by Quantitative PCR (qPCR)

The abundance of bacteria was estimated by amplifying the V3 region of the 16S rRNA gene. The quantification of the target gene was performed using the StepOne™ Real-Time PCR System (Applied Biosystems, Foster City, CA, USA), with the SYBR® GreenER™ dye. Primers Eub338 (5’- CCT ACG GGA GGC AGC AG-3′) and Eub518 (5’- ATT ACC GCG GCT GCT GG - 3’) [21] were used, generating a fragment of 193 base pairs (bp). The conditions of the reaction cycles were as follows: 95 °C for 10 min, 40 cycles of 95 °C for 27 s, 62 °C for 60 s, and 72 °C for 30 s. The melting curve (denaturation) was performed at the end of each quantification with a gradual increase in temperature, from 72 °C to 96 °C, to verify the specificity of the amplification. The final volume of the reactions was 20 µL, containing 10 µL of SYBR® Select Master Mix (Applied Biosystems, Foster City, CA, USA), 0.5 µL of each primer diluted 1:9 (0.2 µM), 1 µL (approximately 50 ng) of template DNA, and 8 µL of autoclaved ultrapure water to complete the reaction volume.

2.7. Determination of the Structure of the Bacterial Community by the Terminal Restriction Fragment Length Polymorphism (T-RFLP)

The structure of the bacterial community was assessed through the terminal restriction fragment length polymorphism (T-RFLP) polymorphism of the bacterial rrs gene (16S rRNA). The reaction cycles started with denaturation at 95 °C for 4 min, followed by 30 denaturation cycles at 95 °C for 30 s, annealing at 57 °C for 30 s, extension at 72 °C for 45 s, and a final extension of 72 °C for 10 min. The final volume of the reactions was 50 µL, containing 6 µL of MgCl2 (final concentration of Mg2 + of 3 mM), 0.2 µL (equivalent to 1U) of taq polymerase, 5 µL of Mg2 + free buffer for taq polymerase (100 mM Tris-Cl (pH 8.8), 500 mM KCl, 1% Triton-X-100) (Sinapse Inc, São Paulo, Brazil), 4 µL deoxynucleoside triphosphate (dNTP) (0.2 mM of each nitrogenous base), 0.1 µL of each primer (0.01 mM) and 1 µL of template DNA, completing with 33.6 µL of autoclaved ultrapure water.
The amplification reactions were performed in a thermocycler model Veriti 96-well Thermal Cycler (Applied Biosystems, Foster City, CA, USA). The quality of the reactions was verified by electrophoresis in 1.5% agarose gel run at 90 V for 60 min in tris-acetate-EDTA buffer (1x TAE) using 5 µL of the PCR product stained with GelRed™ (0.5 µg mL−1), visualized and photo-documented in a transilluminator under ultraviolet light. The PCR products were purified and evaluated by electrophoresis on 2% agarose gel after an 8 h hydration period and analyzed in an ABI Prism 3500 automatic sequencer (Applied Biosystems, Foster City, CA, USA) after staining with GeneScan™ 1200 LIZ®.

2.8. Statistical Analysis

The evaluation of the normal distribution of data was performed using the Shapiro–Wilk test, while the homogeneity of variances was verified using the Bartlett test. After confirming the normal distribution of the data and the homogeneous variance, the analysis of variance (ANOVA) was performed and when the significant F was obtained, the comparison of means was performed by the Scott-Knott Test at 5% significance (p < 0.05) in the SISVAR software [22]. The results of the T-RFLP were obtained from a peak area table, in which it was exported, and the patterns grouped using non-metric multidimensional scaling analysis (NMDS) for the bacterial rrs 16S rRNA gene using the Bray–Curtis distance. Similarity analysis (ANOSIM) was coupled in the NMDS to search for differences among the treatments. In addition, the Wealth index and the Shannon index were calculated considering the peak area matrix of the T-RFLP.
To integrate the microbiological data (MBC, BR, qCO2, and abundance of bacteria) and data on the production of dry matter from cover crops with the structure of the bacterial community, a Spearman correlation was performed. For this, the first NMDS score was considered as the bacterial community index for each cover [23,24]. For this analysis, the program R [25] and the statistical package “vegan” [26] were used.

3. Results and Discussion

3.1. Cover Crops Biomass

The assessment of the cover crop biomass indicates an intense variation of plant material on the soil, thus providing different conditions for microbial activities (Figure 2).
The largest aerial biomass obtained was with S. bicolor (9.0 t ha−1), followed by P. americanum (6.2 t ha−1) and R. sativus (5.8 t ha−1). These three cover crops presented biomass with greater potential for covering the soil. However, the quality of the plant material, as measured by the C/N ratio, is different for the R. sativus, which has a C/N ratio of 17/1 [27], while P. americanum and S. bicolor have a C/N ratio of 54/1 and 49/1, respectively [28], consequently present different rates of decomposition in the soil. Silva et al. [29], when evaluating the phytomass and the C/N ratio in a combination of sorghum and corn with different cover crops, found that sorghum cultivated alone has high values for the C/N ratio when compared to the treatments in combination (sorghum + crotalaria, sorghum + pigeon pea, sorghum + turnip, sorghum + sunflower, sorghum + lupine). It is important to consider that the decomposition process of organic matter and the soil microbial community are influenced by the C/N ratio.
The cover crop with the lowest biomass production was P. miliaceum (1.6 t ha−1) and should therefore be considered with great care in its use since it does not provide a good production of dry biomass for covering the soil. A phytomass production of 6 t ha−1 deposited on the soil surface provides a good soil cover rate [13]. The two species of the genus Urochloa did not differ in terms of the aerial biomass provided in the soil (Figure 2).

3.2. Microbial Biomass Carbon, Basal Soil Respiration, Metabolic Quotient, and Abundance of the Rrs Gene (16S rRNA)

Cover crops, with their characteristics and biomass production, influenced the microbiological attributes of the soil differently (Table 2), where the highest values for the attributes MBC, C-CO2, qCO2, and abundance of the 16S rRNA gene were obtained with cover crops S. bicolor, U. ruziziensis, U. ruziziensis, and P. americanum, respectively.
Cover crops contributed differently to the carbon of the soil’s microbial biomass (Table 2). The highest MBC values were found in the soil with S. bicolor, followed by C. ochroleuca and fallow, respectively. However, only S. bicolor had the highest plant biomass. For Roscoe et al. [30], high MBC values indicate the process of temporary immobilization of nutrients by microbial cells, thus reducing nutrient losses directly to the soil. In the soil with R. sativus and P. miliaceum, there was no difference regarding MBC. The lowest MBC values were observed for soils with U. ruziziensis (Table 2).
The specificity of organic material and the diversity of compounds from invasive plants, which usually happens in fallow, can contribute to the highest MBC values. In our study, the following invasive plants were found in fallow: Eleusine indica (L.) Gaertn, Chamaesyce hirta (L.) Millsp., Digitaria horizontalis Willd, Leonotis nepetifolia (L.) R.Br., Cenchrus echinatus L., Richardia Brasiliensis Gomes and D. insularis (L.) Fedde. Hungria et al. [31] found that the presence of different invasive plants (Conyza bonariensis (L.) Cronquist, Tridax procumbens (L.) L., Chromolaena maximilianii (Schrad. ex DC.) R.M. King & H. Rob, Ageratum conyzoides L., Commelina benghalensis L., Ipomoea grandifolia (Dammer) O’Donell, and Cyperus rotundus L.) in fallow soil under no-tillage system influenced soil microbial biomass, as it presents different depositions of plant fractions in the soil, causing an increase in the population of microorganisms.
Crotalaria, due to its low C/N ratio (14/1), favors the mineralization process and is quickly decomposed in the soil, ensuring nutrient cycling [32]. The greater plant diversification in agricultural systems positively stimulates microbial biomass [33], providing a habitat for several groups of microorganisms that colonize the soil.
The highest values for basal soil respiration were observed in the coverages of U. ruziziensis and R. sativus. C-CO2, or basal respiration of the soil, is defined as the total of all metabolic functions in which CO2 is produced and released, thus, a high rate of microbial respiration of the soil, depending on the environment, may indicate short-term release of nutrients, by soil microbial cells [34,35].
The highest values for the metabolic quotient were obtained with U. ruziziensis and turnip. The higher qCO2 value can show that the microbial community is oxidizing carbon from its cells for its maintenance and permanence in the soil, representing the occurrence of stress caused by some environmental factor [36].
The areas of P. americanum, S. bicolor, C. ochroleuca, and fallow had the lowest values for the metabolic quotient, indicating that they are the most stable areas concerning qCO2, due to the lower loss of CO2 per unit of biomass. This factor may be related to the deposition of organic material in the soil layers, providing a greater source of nutrients for the development of the microbial community, thus avoiding competition for nutrients with vegetables [37,38].

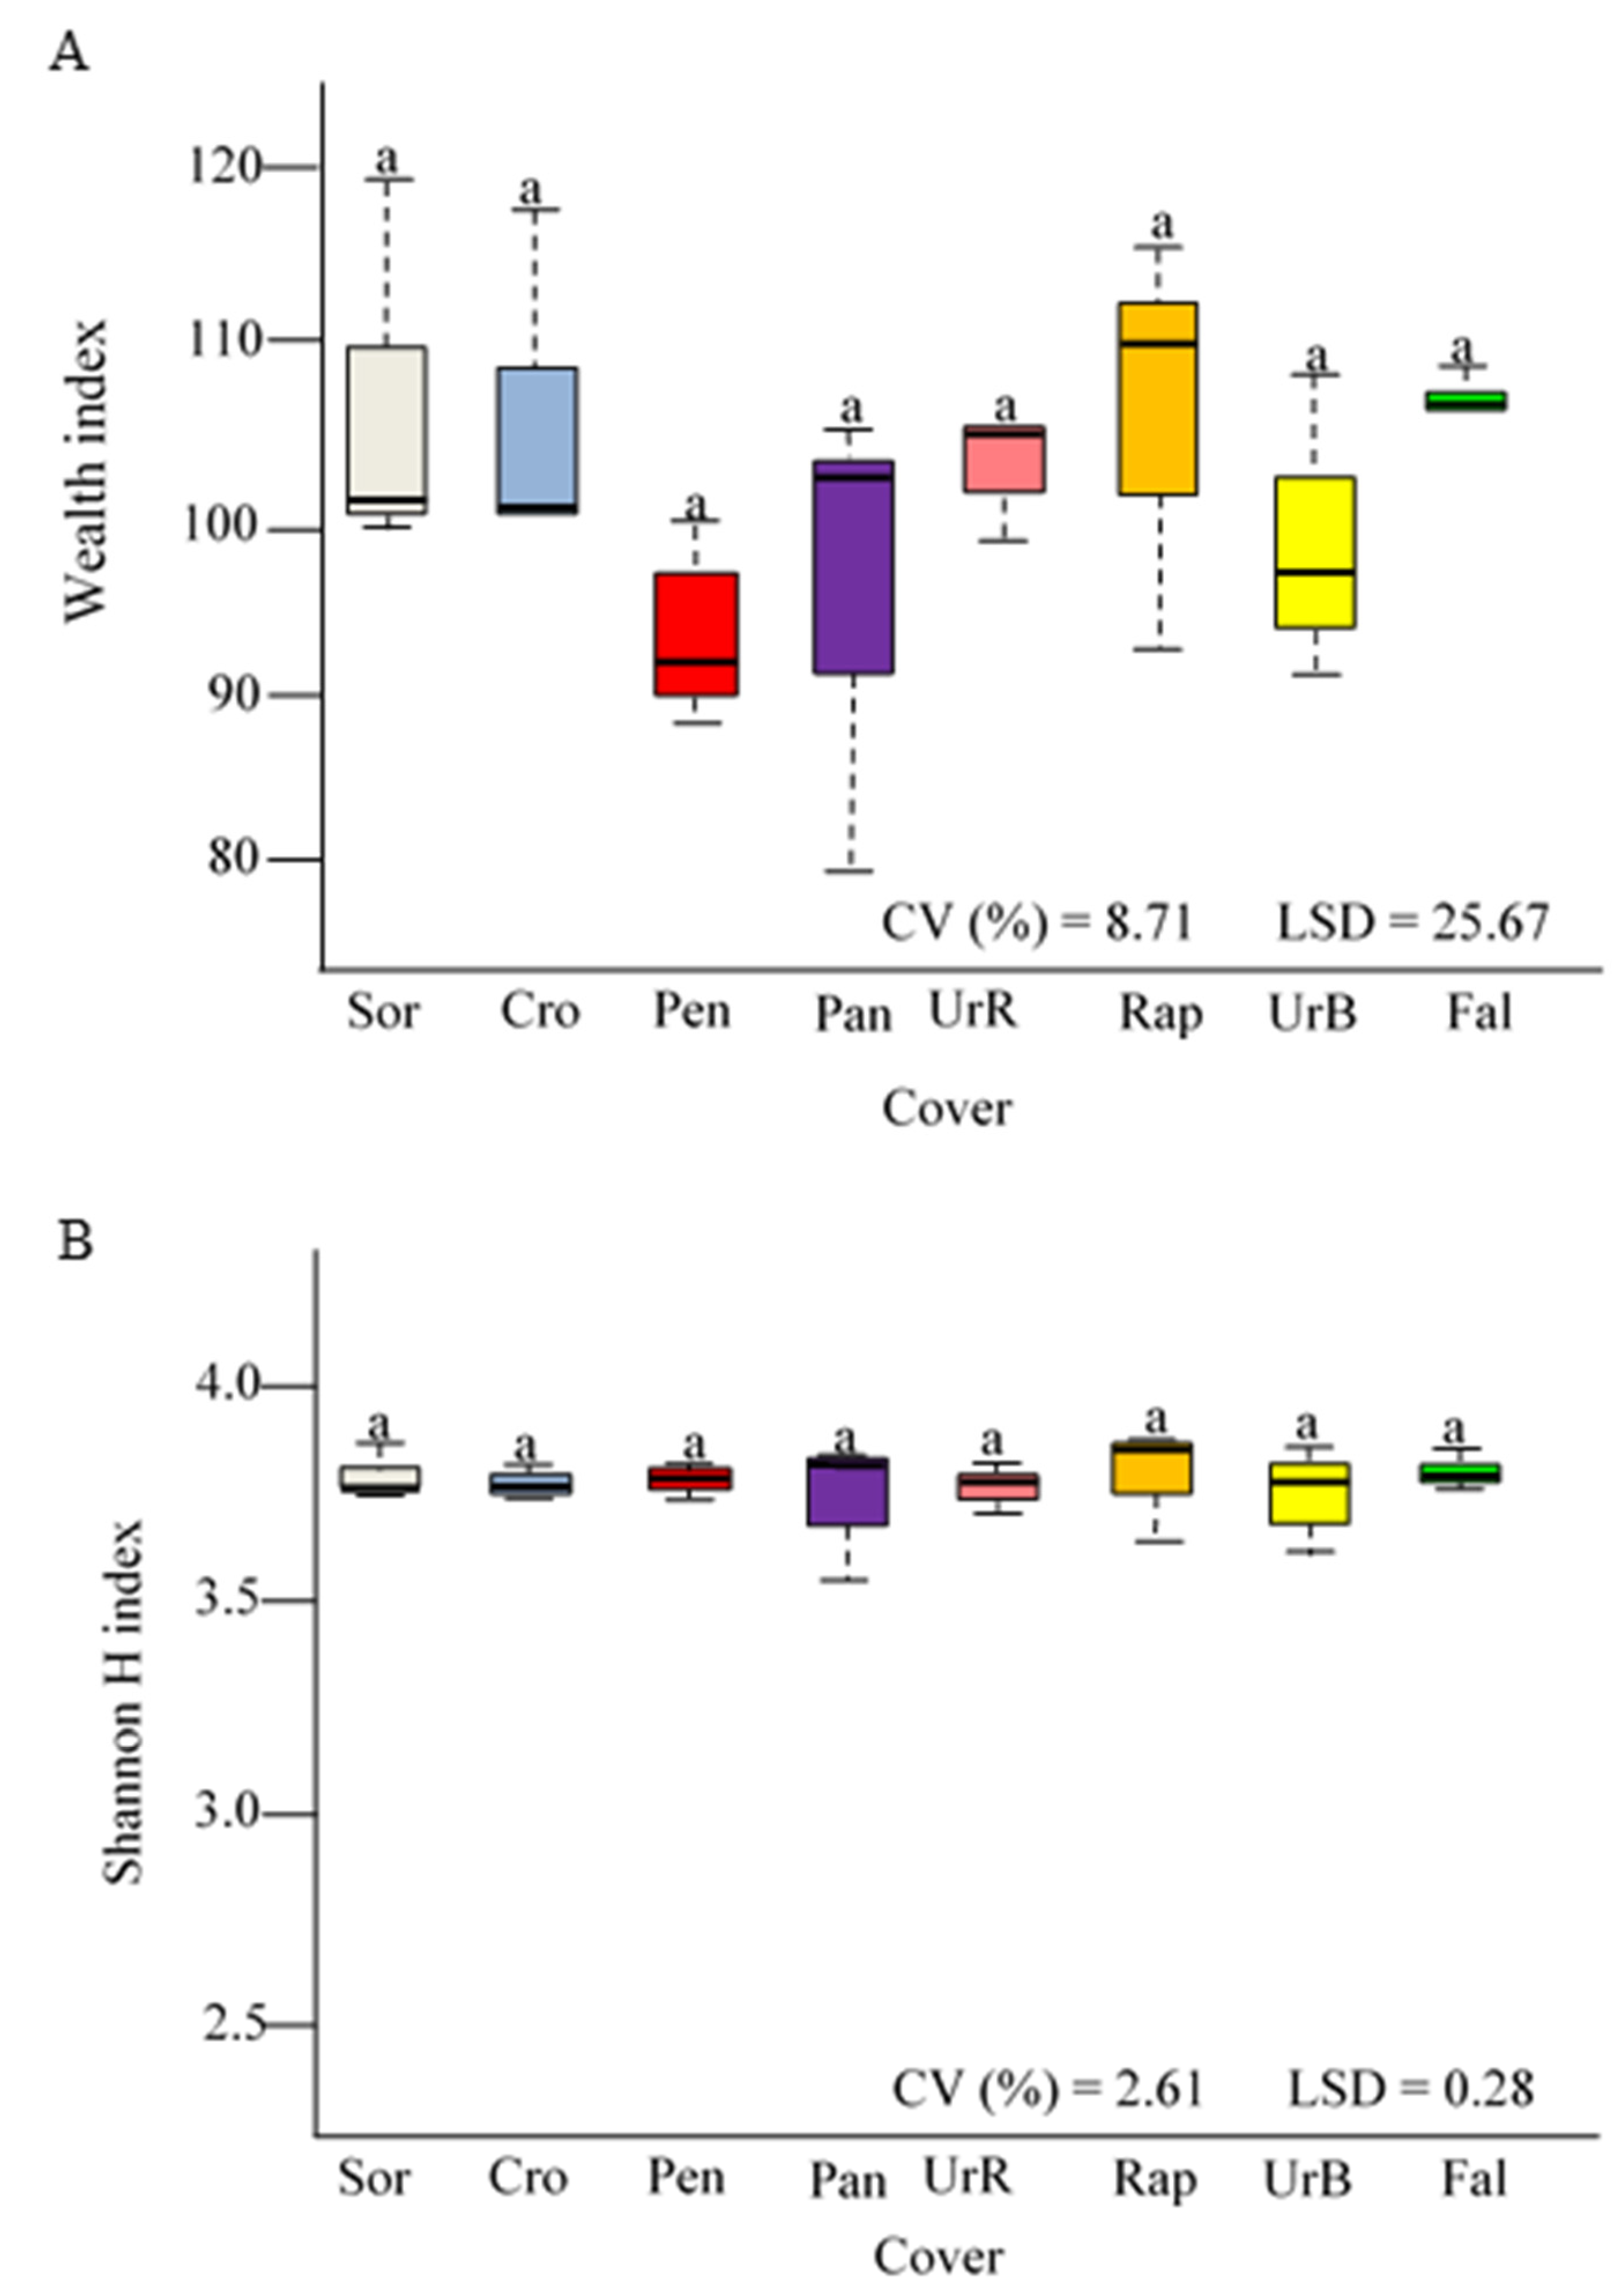
3.3. Abundance of the Bacterial Community by Quantitative PCR (qPCR)

The highest bacterial abundance of the rrs 16S rRNA gene was found in the soil cultivated with P. americanum (Table 2), while the lowest bacterial abundance was found in fallow. Schmidt et al. [39], when evaluating the effect of different cover crops, management, and depths on the soil profile, also found a significant increase in the number of bacteria, assessed by qPCR in the soil layer, with cultivated cover crops when compared to the fallow system, but found no differences in Shannon’s diversity indices. These authors indicated that cover crops favor moderately fast growing microorganisms of reduced genome size, such as bacteria and archaea. Among cover crops, except for P. miliaceum, which showed an abundance scale of 107, the other cover crops showed high abundance in the order of 108, corroborating the data by Schmidt et al. [39].
There was no difference in abundance between the soil cultivated with S. bicolor and the soil with U. ruziziensis. However, in these two treatments there was greater abundance when compared to soils cultivated with C. ochroleuca, P. miliaceum, R. sativus, and U. brizantha cv. Xaraés, although C. ochroleuca and R. sativus belong to different botanical families, Fabaceae and Brassicaceae, respectively. It was evidenced that among these groups there was no difference in the abundance of the rrs 16S RNA gene in the soil, showing that even with differences in their exudates and allelochemicals excreted, this does not affect bacterial abundance in the soil [40].

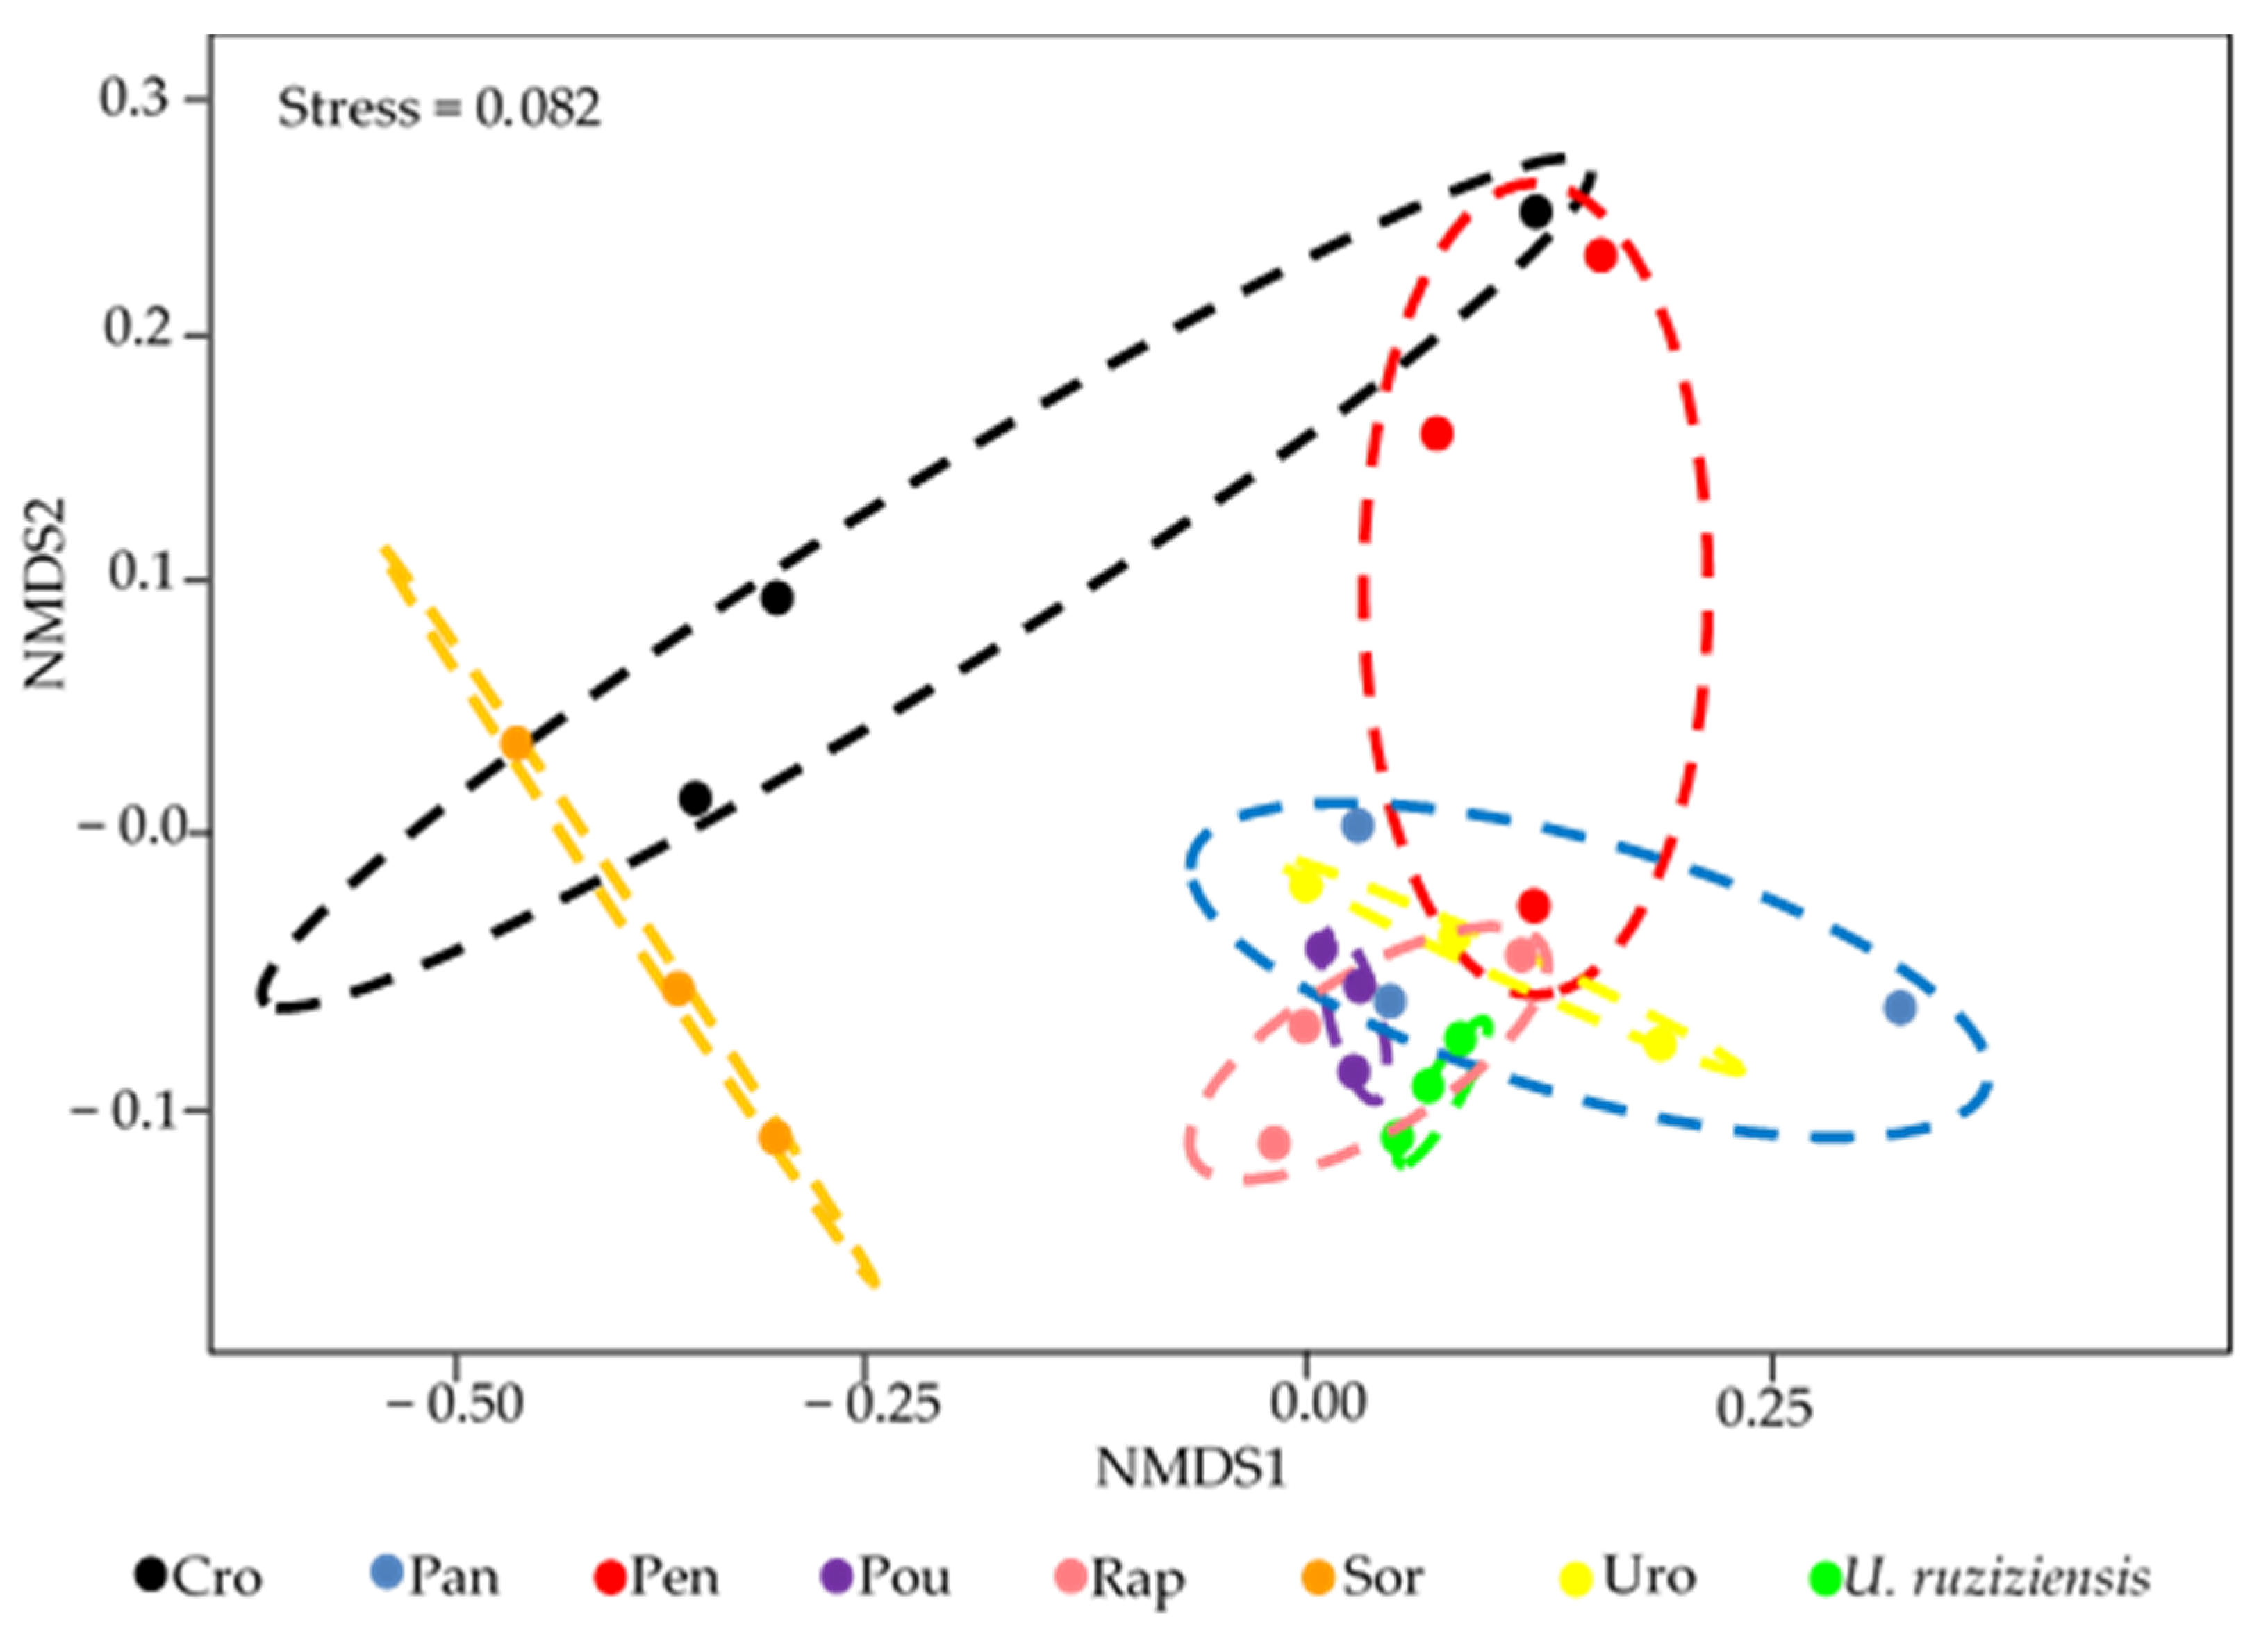
3.4. Changes in the Structure of the Bacterial Community

The results for the structure of the microbial community show that there is a separation of the bacterial community from the rrs 16S rRNA gene as a function of the cover crops. The seven cover crops plus the fallow area showed that each environment provides different conditions according to the type of plant material present in the soil (Figure 3).
In the NMDS analysis, in addition to the ANOSIM test posteriori, confidence ellipses were incorporated (Figure 3) and this enabled the visualization in the diagram of the possible differences between cover crops and fallow, in which when there is an overlap between the ellipses, there is an indication of similarity. The NMDS provides a stress value that informs the adjustment of the data order, in which, according to Clarke [41], acceptable stress values are below 0.1 and the best stress values are less than 0.05. It was observed that in this study the stress value was considered acceptable (stress = 0.088, Figure 3) and, therefore, inferences from diagramming were open to interpretation.
In assessing the similarity of the structure of the microbial community of the rrs 16S rRNA gene, present in soils grown with cover crops, the ANOSIM test did not show significant results, probably due to the variability of the data (Table 3). However, the value of R allowed some inferences related to the structure, as this is an indicator of community distinction, where the value of 1 indicates the total dissimilarity between groups and 0 indicates total similarity between groups. Negative R values indicate greater dissimilarity within the group than between groups [42,43].
The structure of the bacterial community in the soil cultivated with S. bicolor, except for the soil with C. ochroleuca, differed completely from the other cover crops and fallow and presented R values close to 1 (Table 3). In the study by Schlemper et al. [44], when studying different sorghum genotypes, it was concluded that the changes in the bacterial community caused in the rhizosphere of the evaluated cultivars were influenced by the composition of the different strigolactones exuded by the sorghum roots. This may be one of the reasons that led to the total differentiation of the sorghum community with the other cover crops and fallow in this study. Furthermore, this difference in the structure of the bacterial community of the rrs 16S rRNA gene may be related to the greater contribution of plant biomass and soil microbial biomass carbon favored by S. bicolor (8996.99 kg ha−1 and 199.25 µg C microbial g−1 soil, respectively) and the lower qCO2 value (6.04) indicating less efficiency in the use of the substrate by soil microorganisms. The lower efficiency of the use of plant material may be related to its C/N ratio, in which sorghum corresponds to 49/1 [28], being of slow decomposition, due to the higher lignin content, being difficult to decompose by soil microorganisms.
As observed in NMDS (Figure 3) and ANOSIM (Table 3), the bacterial community in the soil with P. americanum is distinct from the bacterial community in the soil with U. ruziziensis (R = 0.70) and fallow (R = 0.77). In addition, in the P. americanum soil, the community was partially similar to the bacterial communities of P. miliaceum, R. sativus, and U. brizantha. It was observed that among the soil bacterial communities with cover crops concerning fallow, U. ruziziensis and P. americanum were the ones that most differed (R = 1.0 and R = 0.77, respectively), while U. ruziziensis and R. sativus were the ones most similar (R = −0.07 and R = 0.11, respectively). In U. ruziziensis there was a high variation within the system (represented by its negative R-ANOSIM value). In general, C. ochroleuca, P. americanum and S. bicolor are more similar to each other and show greater dissimilarity between the other cultivated areas with the different cover crops and the fallow area (Figure 3).
Romdhane et al. [45], when studying the effect of 12 cover crops, observed that the composition of the bacterial community was highly affected by the type of cover crop grown, showing some patterns regarding the botanical level of the family of studied species. Although the species studied by these authors are different from the present study, they used two grass, four leguminous, two brassica, and another four different species. The values found in this work corroborate the study by Romdhane et al. [45] because when considering the level of botanical families among cover crops, a greater similarity was observed among Urochloa, P. miliaceum, and P. americanum. However, Peixoto et al. [46], under conditions of Brazilian Cerrado, when evaluating the effects of different management systems (conventional and no-tillage), soil depths, and cover crops, observed that only cover crops did not affect the structure of the bacterial community assessed by using the PCR/DGGE technique.
Although changes in the structure of the bacterial community were observed in the different cover crops, there were no differences in the diversity indices (Figure 4A,B). Similar results were also found by Schmidt et al. [39], who verified no differences in the bacterial community’s diversity indices in soils cultivated with cover crops.

3.5. Correlation of the Structure of the Bacterial Community with the Microbiological Attributes Evaluated

To integrate the response of the bacterial community structure evaluated using T-RFLP with microbiological data and plant biomass, Spearman’s correlation was performed (due to the residues of the data not meeting normality) (Table 4).
A maximum positive correlation was observed between the bacterial community of the cultivated soils with plants of the genus Urochloa and the microbial biomass carbon (Table 4). This fact may be related to the expressive soil exploration by the root system of plants of the genus Urochloa [47]. It was observed that fallow system presented one of the highest MBC values (Table 2), but it was also the only one that showed a maximum negative correlation of MBC with the bacterial community structure (Table 4). In addition, fallow was the only system with a maximum positive correlation with the qCO2, while the other cover crops had negative correlations with the qCO2. This reinforces the importance of maintaining ground cover to optimize ecosystem services.
The positive correlation of the bacterial community with the basal respiration of the soil was maximum for soils cultivated with S. bicolor and P. miliaceum, while for P. americanum and U. ruziziensis the correlation was negative. For bacterial abundance, it was observed that there was a maximum correlation with the bacterial community only for the soil cultivated with P. miliaceum, which showed the maximum negative correlation with the aerial dry biomass (Table 4).
Given these results, there was a dynamic response of the bacterial community and the microbiological attributes evaluated for the different cover crops. Further studies are needed to access the bacterial groups that can contribute to this differentiation, in addition to studies that evaluate the responses of the plant and soil microbiome in long-term experiments at different stages of cover crop development.

4. Conclusions

S. bicolor, P. Americanum, and C. ochroleuca were the cover crops that showed greater differentiation in the structure of the soil bacterial community, with S. bicolor and P. americanum being the plants with the highest production of plant biomass.
The microbiological attributes, as well as the community structure, were shown to be sensitive to the different cover crops.
Urochloa genus had a maximum positive correlation with the structure of the bacterial community, and this attribute may be a predictor of the structure of the bacterial community in the soil. In addition, in soils with U. ruziziensis, high bacterial abundance was observed, as well as high basal soil respiration and metabolic quotient, and the latter may indicate an imbalance in the environment.

Author Contributions

Conceptualization, S.F.d.L. and V.A.S.; methodology, S.F.d.L., E.P.V. and L.M.C.; software, S.F.d.L. and A.M.M.S.; validation, C.A.S., E.P.V. and A.P.L.d.L.; formal analysis, S.F.d.L., C.A.S. and A.M.M.S.; investigation, V.A.S. and M.G.d.O.A.; resources, E.P.V. and M.A.S.C.; data curation, C.A.S. and M.S.A.; writing—original draft preparation, V.A.S., M.G.d.O.A. and M.S.A.; writing—review and editing, S.F.d.L., C.A.S. and M.A.S.C.; visualization, E.P.V., M.G.d.O.A. and A.P.L.d.L.; supervision, L.M.C. and M.A.S.C.; project administration, L.M.C. and M.A.S.C.; funding acquisition, S.F.d.L. All authors have read and agreed to the published version of the manuscript.

Funding

This study was financed in part by the Coordenação de Aperfeiçoamento de Pessoal de Nível Superior—Brasil (Capes)—Finance Code 001.

Data Availability Statement

The data presented in this study are available on request from the corresponding authors.

Acknowledgments

This research was supported by Coordenação de Aperfeiçoamento de Pessoal de Nível Superior—Brasil (Capes)—Finance Code 001. Authors also gratefully acknowledge to Universidade Federal de Mato Grosso do Sul for technical and financial support.

Conflicts of Interest

The authors declare no conflict of interest.

References

  1. Luo, X.; Fu, X.; Yang, Y.; Cai, P.; Peng, S.; Chen, W.; Huang, Q. Microbial communities play important roles in modulating paddy soil fertility. Sci. Rep. 2016, 6, 1–12. [Google Scholar] [CrossRef]
  2. Cardoso, E.J.B.N.; Vasconcellos, R.L.F.; Bini, D.; Miyauchi, M.Y.H.; Santos, C.A.D.; Alves, P.R.L.; De Paula, A.M.; Nakatani, A.S.; Pereira, J.M.I.; Nogueira, M.A. Soil health: Looking for suitable indicators. What should be considered to assess the effects of use and management on soil health? Sci. Agric. 2013, 70, 274–289. [Google Scholar] [CrossRef] [Green Version]
  3. Quiquampoix, H.; Servagent-Noiville, S.; Baron, M. Enzyme adsorption on soil mineral surfaces and consequences for the catalytic activity. In Enzymes in the Environment; Burns, R.G., Dick, R.P., Eds.; Marcel Dekker: New York, NY, USA, 2002; pp. 285–306. [Google Scholar]
  4. Epelde, L.; Burges, A.; Mijangos, I.; Garbisu, C. Microbial properties and attributes of ecological relevance for soil quality monitoring during a chemical stabilization field study. Appl. Soil Ecol. 2014, 75, 1–12. [Google Scholar] [CrossRef]
  5. Ferreira, E.P.B.; Santos, H.P.; Costa, J.R.; De-Polli, H.; Rumjanek, N.G. Microbial soil quality indicators under different crop rotations and tillage management. Cienc. Agron. 2010, 41, 177–183. [Google Scholar] [CrossRef]
  6. Ferreira, E.P.B.; Wendland, A.; Didonet, A.D. Microbial biomass and enzyme activity of a Cerrado Oxisol under agroecological production system. Bragantia 2011, 70, 1–9. [Google Scholar] [CrossRef]
  7. Blaud, A.; Herrmann, A.M.; Diouf, F.; Lerch, T. Analysing the effect of soil organic matter on bacterial communities using T-RFLP fingerprinting: Different methods, different stories? Biol. Fertil. Soils 2015, 51, 959–971. [Google Scholar] [CrossRef] [Green Version]
  8. Bunemann, E.K.; Bongiorno, G.; Baic, Z.; Creamer, R.E.; De Deyn, G.; Goede, R.; Fleskens, L.; Geissen, V.; Kuyper, T.W.; Mader, P.; et al. Soil quality–A critical review. Soil Biol. Biochem. 2018, 120, 105–125. [Google Scholar] [CrossRef]
  9. Simon, C.A.; Lima, S.F.; Cordeiro, M.S.; Secco, V.A.; Nacata, G.; Silva, A.M.M.; Simon, C.C.; Brasil, M.S. Cover crops as modifying agents of microbiological soil attribute. Aust. J. Crop. Sci. 2019, 13, 1578–1585. [Google Scholar] [CrossRef]
  10. Soares, D.S.; Gerosa, M.L.; Marchão, R.L.; Maciel, G.A.; Oliveira, A.D.; Malaquias, J.V.; Carvalho, A.M.S. How diversity of crop residues in long-term no-tillage systems affect chemical and microbiological soil properties. Soil Tillage Res. 2019, 194, 1–12. [Google Scholar]
  11. Carvalho, A.M.; Coelho, M.C.; Dantas, R.A.; Fonseca, O.P.; Guimarães Júnior, R.; Figueiredo, C.C. Chemical composition of cover plants and its effect on maize yield in no-tillage systems in the Brazilian savanna. Crop. Pasture Sci. 2012, 63, 1075–1081. [Google Scholar] [CrossRef]
  12. Andreote, F.D.; Silva, M.C.P. Microbial communities associated with plants: Learning from nature to apply it in agriculture. Curr. Opin. Microbiol. 2017, 37, 29–34. [Google Scholar] [CrossRef] [PubMed]
  13. Alvarenga, R.C.; Waldo, A.L.C.; Cruz, J.C.; Santana, D.P. Plantas de cobertura de solo para sistema plantio direto. Inf. Agropecu. 2001, 22, 25–36. [Google Scholar]
  14. Chenu, C.; Angers, D.A.; Barré, P.; Derrien, D.; Arrouays, D.; Balesdent, J. Increasing organic stocks in agricultural soils: Knowledge gaps and potential innovations. Soil Tillage Res. 2018, 167, 1–12. [Google Scholar] [CrossRef]
  15. Santos, H.G.; Jacomine, P.K.T.; Anjos, L.H.C.; Oliveira, V.A.; Lumbreras, J.F.; Coelho, M.R.; Almeida, J.A.; Araujo Filho, J.C.; Oliveira, J.B.; Cunha, T.J.F. Sistema Brasileiro de Classificação de Solos, 5th ed.; Embrapa: Brasilia, Brazil, 2018; pp. 195–212. [Google Scholar]
  16. Silva, F.C.D.S. (Ed.) Manual de Análises Químicas de Solos, Plantas e Fertilizantes; Embrapa: Rio de Janeiro, Brazil, 2009; pp. 107–190. [Google Scholar]
  17. Donagemma, G.K.; Campos, D.V.B.; Calderano, S.B.; Teixeira, W.G.; Viana, J.H.M. Manual de Métodos de Análise de Solo, 2nd ed.; Embrapa: Rio de Janeiro, Brazil, 2011; pp. 13–94. [Google Scholar]
  18. Vance, E.D.; Bookes, P.C.; Jenkinson, D.S. An extraction method for measuring soil microbial biomass C. Soil Biol. Biochem. 1987, 9, 703–707. [Google Scholar] [CrossRef]
  19. Ohlinger, R. Bestimmung der bodenatmung im laborversuch. In Bodenbiologische Arbeitsmethoden; Schinner, F., Ohlinger, R., Kandeler, E., Margesin, R., Eds.; Springer: Berlin, Germany, 1993; pp. 86–90. [Google Scholar]
  20. Anderson, T.H.; Domsch, K.H. The metabolic quotient for CO2 (qCO2) as a specific activit parameter to assess the effects of environmental conditions. such as pH. on the microbial biomass of forest soils. Soil Biol. Biochem. 1993, 25, 393–395. [Google Scholar] [CrossRef]
  21. Muyzer, G. Profiling of complex microbial populations by denaturing gradient gel electrophoresis analysis of polymerase chain reaction-amplified genes coding for 16S rRNA. Appl. Environ. Microbiol. 1993, 59, 695–700. [Google Scholar] [CrossRef] [Green Version]
  22. Ferreira, D.F. Sisvar: A computer statistical analysis system. Cinc. Agrotecnol. 2011, 35, 1039–1042. [Google Scholar] [CrossRef] [Green Version]
  23. Ling, N.; Chen, D.; Guo, H.; Wei, J.; Bai, Y.; Shen, Q.; Hu, S. Differential responses of soil bacterial communities to long-term N and P inputs in a semi-arid steppe. Geoderma 2017, 292, 25–33. [Google Scholar] [CrossRef]
  24. Yang, L.; Wang, N.; Chen, Y.; Yang, W.; Tian, D.; Zhang, C.; Niu, S. Carbon management practices regulate soil bacterial communities in response to nitrogen addition in a pine forest. Plant Soil 2020, 452, 137–151. [Google Scholar] [CrossRef]
  25. R Development Core Team. R: A Language and Environment for Statistical Computing; R Foundation for Statistical Computing: Vienna, Austria, 2019. [Google Scholar]
  26. Oksanen, J.; Blanchet, F.G.; Kindt, R.; Legendre, P.; Minchin, P.R.; O´Hara, R.B.; Simpson, G.L.; Solymos, P.; Stevens, M.H.H.; Szoecs, E.; et al. Package ‘vegan’. Community Ecol. 2013, 2, 1–295. [Google Scholar]
  27. Doneda, A.; Aita, C.; Giacomini, S.J.; Miola, E.C.C.; Giacomini, D.A.; Schirmann, J.; Gonzato, R. Biomass and decomposition of cover crop residues in monoculture and intercropping. Rev. Bras. Cienc. Solo 2012, 36, 1714–1723. [Google Scholar] [CrossRef] [Green Version]
  28. Azevedo, D.M.P.; Spehar, C.R. Decomposição da Palhada de Culturas Para Plantio no Período de Safrinha em Solos de Tabuleiros Costeiros; Embrapa Meio-Norte: Teresina, Brazil, 2002; pp. 1–4. [Google Scholar]
  29. Silva, P.C.G.; Foloni, J.S.S.; Fabris, L.B.; Tiritan, C.S. Fitomassa e relação C/N em consórcios de sorgo e milho com espécies de cobertura. Pesqui. Agropecu. Bras. 2009, 44, 1504–1512. [Google Scholar] [CrossRef]
  30. Roscoe, R.; Mercante, F.M.; Salton, J.C. Dinâmica da Matéria Orgânica do Solo em Sistemas Conservacionistas: Modelagem Matemática e Métodos Auxiliares; Embrapa Agropecuária Oeste: Dourados, Brazil, 2006; pp. 17–41. [Google Scholar]
  31. Hungria, M.; Franchini, J.C.; Brandão-Júnior, O.; Kaschuk, G.; Souza, R.A. Soil microbial activity and crop sustainability in a long-term experiment with three soil-tillage and two crop-rotation systems. Appl. Soil Ecol. 2009, 42, 288–296. [Google Scholar] [CrossRef]
  32. Teixeira, C.M.; Carvalho, G.J.; Andrade, M.J.B.; Silva, C.A.; Pereira, J.M. Decomposição e liberação de nutrientes das palhadas de milheto e milheto + crotalária no plantio direto do feijoeiro. Acta Sci. Agron. 2009, 31, 647–653. [Google Scholar] [CrossRef] [Green Version]
  33. Guimarães, N.F.; Gallo, A.S.; Fontanetti, A.; Meneghin, S.P.; Souza, M.D.B.; Morinigo, K.P.G.; Silva, R.F. Biomassa e atividade microbiana do solo em diferentes sistemas de cultivo do cafeeiro. Rev. Ciênc. Agrárias 2017, 40, 34–44. [Google Scholar] [CrossRef]
  34. Silva, J.M.; Alburquerque, L.S.D.; Santos, T.M.C.D.; Oliveira, J.U.L.D.; Guedes, E.L.F. Mineralização de vermicompostos estimada pela respiração microbiana. Rev. Verde Agroecol. Desenv. Sustent. 2013, 8, 132–135. [Google Scholar]
  35. Souza, E.D.; Costa, S.E.V.G.A.; Anghinoni, I.; Lima, C.V.S.; Carvalho, P.C.F.V.; Martins, A.P. Biomassa microbiana do solo em sistema de integração lavoura-pecuária em plantio direto. submetido a intensidades de pastejo. Rev. Bras. Cienc. Solo 2010, 34, 79–88. [Google Scholar] [CrossRef]
  36. Carneiro, M.A.C.; Souza, E.D.; Reis, E.F.; Pereira, H.S.; Azevedo, W.R. Atributos físicos, químicos e biológicos de solo de Cerrado sob diferentes sistemas de uso e manejo. Rev. Bras. Cienc. Solo 2009, 33, 147–157. [Google Scholar] [CrossRef] [Green Version]
  37. Alves, T.S.; Campos, A.L.L.; Elias Neto, N.; Matsuoka, M.; Loureiro, M.F. Biomassa e atividade microbiana de solo sob vegetação nativa e diferentes sistemas de manejos. Acta Sci. Agron. 2011, 33, 341–347. [Google Scholar] [CrossRef]
  38. Schmidt, R.O.; Sana, R.S.; Leal, F.K.; Andreazza, R.; Camargo, F.A.O.; Meurer, E.J. Biomassa e atividade microbiana do solo em sistemas de produção olerícola orgânica e convencional. Cienc. Rural. 2013, 43, 270–276. [Google Scholar] [CrossRef]
  39. Schmidt, R.G.K.; Bossange, A.V.; Mitchell, J.; Scow, K. Long-term use of cover crops and no-till shift soil microbial community life strategies in agricultural soil. PLoS ONE 2018, 13, 1–19. [Google Scholar] [CrossRef] [PubMed]
  40. Bertin, C.; Yang, X.; Weston, L.A. The role of root exudates and allelochemicals in the rhizosphere. Plant Soil 2003, 256, 67–83. [Google Scholar] [CrossRef]
  41. Clarke, K.R. Non-parametric multivariate analysis of changes in community structure. Aust. J. Ecol. 1993, 18, 117–143. [Google Scholar] [CrossRef]
  42. Clarke, K.R. Detecting change in benthic community structure. In Proceedings of the 14th International Biometric Conference, Namour, Belgium, 1988; Oger, R., Ed.; Société Adolphe Quiételet: Gembloux, Belgium; pp. 131–142.
  43. Clarke, K.R.; Gorley, R.N. Primer V5: User Manual/Tutorial; Primer-E Ltd.: Plymouth, New Zealand, 2001. [Google Scholar]
  44. Schlemper, T.R.; Leite, M.F.A.; Lucheta, A.R.; Shimels, M.; Bouwmeester, H.J.; Veen, J.A.; Kuramae, E.E. Rhizobacterial community structure differences among sorghum cultivars in different growth stages and soils. FEMS Microbiol. Ecol. 2017, 93, 205–214. [Google Scholar] [CrossRef] [PubMed] [Green Version]
  45. Romdhane, S.; Spor, A.; Busset, H.; Falchetto, L.; Martin, J.; Bizouard, F.; Bru, D.; Breuil, M.; Philippot, L.; Cordeau, S. Cover crop management practices rather than composition of cover crop mixtures affect bacterial communities in no-till agroecosystems. Front. Microbiol. 2019, 10, 1–11. [Google Scholar] [CrossRef] [PubMed]
  46. Peixoto, R.S.; Madari, B.E.; Coutinho, H.L.C.; Machado, P. Soil aggregation and bacterial community structure as affected by tillage and cover cropping in the Brazilian Cerrados. Soil Tillage Res. 2006, 90, 16–28. [Google Scholar] [CrossRef]
  47. Lannes, L.S.; Bustamante, M.M.C.; Edwards, P.J.; Venterink, H.O. Native and alien herbaceous plants in the Brazilian Cerrado are (co-) limited by different nutrients. Plant Soil 2016, 400, 231–243. [Google Scholar] [CrossRef] [Green Version]
Figure 1. Climogram for 2018. Source: POWER Data Access Viewer database, 2019. PREC: precipitation, MAXT: maximum temperature, MINT: minimum temperature, AVET: average temperature.
Sustainability 13 08318 g001
Figure 2. Aerial dry biomass of different cover crops. Sor = Sorghum bicolor; Cro = Crotalaria ochroleuca; Pen = Pennisetum americanum; Pan = Panicum miliaceum; UrR = Urochloa ruziziensis. Rap = Raphanus sativus L., and UrB = Uroclhoa brizantha cv. Xaraés. Bars with different lowercase letters above indicate significant differences (p < 0.05).
Sustainability 13 08318 g002
Figure 3. Non-metric multidimensional scaling analysis (nMDS) for the bacterial rrs 16S rRNA gene, determined by T-RFLP, as a function of the cultivation of different cover crops in soil in the no-tillage system. Cro = Crotalaria ochroleuca; Pan = Panicum miliaceum; Pen = Pennisetum americanum; Fal = fallow; Rap = Raphanus sativus L.; Sor = Sorghum bicolor; UrB = Urochloa brizantha cv. Xaraés; and UrR = Urochloa ruziziensis.
Sustainability 13 08318 g003
Figure 4. (A) Wealth indices for the bacterial gene rrs 16S rRNA, determined by T-RFLP, as a function of the cultivation of different cover crops in the soil under the no-tillage system. (B) Shannon’s H index for the bacterial gene rrs 16S rRNA, determined by T-RFLP, as a function of the cultivation of different cover crops in the soil under no-tillage system. Sor = Sorghum bicolor; Cro = Crotalaria ochroleuca; Pen = Pennisetum americanum; Pan = Panicum miliaceum; UrR = Urochloa ruziziensis; Rap = Raphanus sativus L.; UrB = Uroclhoa brizantha cv. Xaraés; and Fal = fallow. CV = coefficient of variation. LSD = least significant difference. Equal lowercase letters above the bars indicate that there was no significant difference (p < 0.05).
Sustainability 13 08318 g004
Table 1. Soil composition of the experimental area.
Cover CropClaySiltSandOMpHPKZnCaMgH + AlCEC
%CaCl2mg·dm−3cmolc·dm−3
Sorghum bicolor41.019.040.02.95.114.853.09.52.31.163.57.1
Crotalaria ochroleuca40.020.040.03.06.017.471.06.54.01.423.07.5
Pennisetum americanum41.017.042.03.26.212.478.05.54.81.651.78.3
Panicum miliaceum42.020.038.03.05.821.270.05.73.11.472.37.0
Urochloa ruziziensis38.011.051.02.75.620.686.08.13.21.631.96.9
Raphanus sativus39.019.042.02.35.417.353.06.72.91.212.87.0
Urochloabrizantha38.020.042.02.95.425.171.07.43.41.542.37.4
Fallow44.018.038.02.65.824.465.07.23.91.92.18.1
OM: organic material; pH; P: phosphorus; K: potassium; Zn: zinc; Ca: calcium; Mg: magnesium; H + Al: potential acidity; CEC: cation exchange capacity.
Table 2. Microbial biomass carbon (MBC), basal soil respiration (BR), metabolic quotient (qCO2), and the abundance of the 16S rRNA gene (log number of copies per gram of soil) in soils cultivated with different cover crops.
Cover CropMBC µg Microbial C G−1 SoilC-CO2 100 G Soil−1Qco216S Rrna N° of 16S Rrna Gene Copies G−1 Soil
Sorghum bicolor199.52a120.40c6.04d1.61 × 108b
Crotalaria ochroleuca187.98b123.20c6.56d1.18 × 108c
Pennisetum americanum152.93c84.30e5.52d2.38 × 108a
Panicum miliaceum90.09e67.41f7.50c9.83 × 107c
Urochloa ruziziensis71.93f142.27a19.79a1.42 × 108b
Raphanus sativus83.46e129.47b15.57b1.07 × 108c
Urochloabrizantha123.06d102.30d8.33c1.15 × 108c
Fallow180.85b119.17c6.59d3.95 × 107d
Means followed by the same letter in the column do not differ by the Scott-Knott test at 5% significance.
Table 3. Dissimilarity (R value) obtained through similarity analysis (ANOSIM) comparing the structure of the bacterial community of the rrs 16S rRNA gene in soils managed with different cover crops.
S. bicolorC. ochroleucaP. americanumP. miliaceumU. ruziziensisR. sativusU. brizanthaFallow
S. bicolor0
C. ochroleuca0.22 ns0
P. americanum1 ns0.25 ns0
P. miliaceum1 ns0.37 ns0.44 ns0
U. ruziziensis1 ns0.33 ns0.70 ns0.18 ns0
R. sativus0.96 ns0.33 ns0.51 ns−0.33 ns0.22 ns0
U. brizantha1 ns0.33 ns0.48 ns−0.33 ns0.40 ns−0.40 ns0
Fallow1 ns0.33 ns0.77 ns0.18 ns1 ns0.11 ns−0.07 ns0
significant values (p < 0.05); ns = non-significant values.
Table 4. Spearman’s rank correlation coefficient of the bacterial community of the different cover and fallow plants with the different microbiological attributes evaluated, as well as the aerial dry biomass.
MBCBRqCO2qPCRADB
Sorghum bicolor0.50 ns1.00 **−0.50 ns0.50 ns−0.50 ns
Pennisetum americanum0.87 ns−0.87 ns−0.87 ns−0.87 ns0.00 ns
Panicum miliaceum0.50 ns1.00 **−0.50 ns1.00 **−1.00 **
Urochloa Ruziziensis1.00 **−0.50 ns−1.00 **0.50 ns0.50 ns
Raphanus sativus0.50 ns0.50 ns−0.50 ns−0.50 ns−1.00 **
Urochloa brizantha1.00 **0.00 ns−1.00 **−0.50 ns−1.00 **
Fallow−1.00 **−0.50 ns1.00 **0.50 nsNA
MBC: microbial biomass carbon, BR: baseline respiration, qCO2: metabolic quotient, qPCR: bacterial abundance assessed by the rrs 16S rRNA gene, ADB: aerial dry biomass. ns: not significant, ** p < 0.001, NA: not evaluated because there was no measurement of dry matter at fallow.
Publisher’s Note: MDPI stays neutral with regard to jurisdictional claims in published maps and institutional affiliations.

