Abstract
The Covid-19 induced economic crisis has significantly affected almost all businesses from nearly every sector, causing severe financial problems, lack of cash assets, and decrease of revenues. In this context, the economic entities were forced to look for adjustment and rescue solutions of their activities. One possible solution for the recovery and reorganization of economic entities’ activities is demerger. This paper evaluates the impact of demerger upon the sustainable development of economic entities in terms of economic efficiency and financial performances. To achieve this goal, a statistical analysis of profitability ratios before and after the demerger, as well as a structural analysis of 268 demerger projects for the April 2012–April 2021 period, were performed. The results attest there are no significant differences between the ex-ante and ex-post financial performances. However, demerger seems to have a positive effect upon analyzed companies helping them to overcome economic hardships, rethink their business strategies, and continue their activity in the medium and long-term time horizon.
1. Introduction
To cope with economic hardships exacerbated by the sanitary crisis and avoid bankruptcy, economic entities need to look for solutions to continue their activities and develop sustainably. One of the main measures economic entities can adopt to protect their businesses in the context of the pandemic is restructuring. Demerger represents a type (a mechanism) of restructuring, a strategy for rescuing entities in financial difficulties, and implicitly an instrument supporting the sustainable development of businesses. The demerger process allows the identification and focusing on a given market segment for each company resulted from the process, as well as for the cedent company. The partial division (demerger) represents a reorganizing operation and “implies the secession of part of a company’s wealth/patrimony, which still continues to exist, and in transferring this part to one or more legal entities which already exist or they are created in this way.” The demerger is defined in Romania by Fiscal Code’s Law no. 227/2015 [1], subsequently added and modified and by the Law of Economic Societies no. 31/1990 [2], republished with subsequent additions and modifications in Ministry of Public Finances Order no. 897/2015 [3]. The dividing company is called assignor, whereas the companies already existing or which are created in the demerger process are called beneficiaries.
The main objective of this paper is to evaluate the impact of demerger upon the sustainable development of economic entities in terms of economic efficiency and financial performance. A structural analysis for 268 demerger projects from the April 2012–April 2021 period and a statistical analysis of profitability ratios before and after the demerger were performed to reach this objective. The profitability analysis before and after the demerger was necessary to properly highlight the effects generated by the demerger. The purpose of this paper is to realize a statistical analysis of the ex-ante and ex-post demerger performances and find whether the demerger had a positive impact upon sampled companies’ efficiency and financial sustainability. The studies from reference literature pay more attention to the typology of these transactions and/or their tax and accounting treatment, with a lesser focus on the effect demerger may have on the efficiency and financial performance of economic entities. The analysis of financial profitability ratios from before and after the demerger is essential for the managers of involved companies, allowing them to assert the impact and benefits of the partial division and decide the restructuring format best suited for the success of the operation. The detailed analysis of demerger projects and the study of demerger impact upon sampled entities’ financial performances may represent an approach of the demerger analysis. This study contributes to an in-depth knowledge of economic entities’ restructuring and identifying the financial characteristics of these transactions. It shows the economic and financial implications which the demerger process can have upon these entities’ sustainable development.
The paper is structured as follows: the second section approaches the current research stage, followed by research methodology, including the structural analysis of demerger projects. Section four presents the statistical analysis’ results of differences’ recorded between the ex-ante and ex-post demerger sub-periods, whereas section five contains the conclusions, limitations, and future research directions.
2. Literature Review
In the Romanian legislation, reorganization is approached in various ways, such as mergers, demerger, sector/sectors’ activity transfer, acquisition-sale of sector/sectors’ activity. The demerger was analyzed in reference literature either from the perspective of typology characteristics or from the standpoint of shareholders’ wealth and value creation for the entity, respectively, for the impact demerger has upon company performances.
2.1. Demerger Characteristics, Typology of Restructuration through the Demerger
Rachisan et al. [4] analyzed demerger operations from the January 2006–30 June 2007 period. Their study looked to identify restructuration typology through demerger practiced by Romanian economic entities. The authors concluded demerger is a restructuration process that usually develops in the maturity stage of an entity’s life cycle.
2.2. Impact of Demerger upon Shareholders’ Wealth and the Price of Shares of Stock
The impact demerger can have upon shareholders’ wealth and the price of shares of stock was studied by recent research papers [5,6,7,8]. Singh et al. [5] have investigated the way in which shareholders’ wealth was influenced before and after the demerger. The authors have found that equity value increased following the demerger, due to the reduction of negative synergies and unlocking the value through a break-up. Vyas et al. [6] analyzed the impact of spin-off announcements on stock prices. They took data of 51 spin-off announcements from 2012 to 2014. Their results show that the spin-off announcements lead to a positive impact on the stock prices of the parent company. Padmanabhan [7] and Aggarwal & Garg [8] also analyzed the effect of spin-off announcements on share prices of Indian firms.
2.3. Creating Value through Spin-Offs
Some of the most recent studies from reference literature focused upon the relationship between spin-offs and value creation for shareholders and companies [9,10,11,12]. Studies show that spin-offs generate both benefits and problems. Khurana and Gupta [11] studied a few demergers in India to establish that demergers resulted in a significant increase in the total market capitalization of involved companies. The reason for that was attributed to improved focus. The authors suggest that demerger may allow companies to strengthen their core competencies and realize the true value of their business. Chai et al. [12] studied the impact on spin-off announcements in Australia. The authors found Australian spin-offs are associated with a positive excess stock performance for up to 24 months after the spin-off. Basak [13] produced another paper investigating whether demerger restructuring can create value for shareholders. The author realized a comparative analysis of ex-ante and ex-post performances, concluding that this restructuring format creates value for interested parties.
2.4. Impact of Demerger upon Company Performances
The consequences of demerger upon company performances and financial situation have been researched in various recent studies [14,15,16,17]. In most cases, demergers tend to have a positive influence over the company. Johnson et al. [14] consider spin-offs create value by improving investment incentives and economic performances. Mallick and Rakshit [15] compared financial performances from before and after the demerger. The authors concluded that financial performances improved after the demerger, the latter allowing the companies to impose widened control and create value. Rakshit and Ghosh [16] measured the financial and operational efficiency of JK Industries by comparing the ex-ante and ex-post demerger periods. The financial and operational efficiency improved after the demerger, which was the conclusion reached by the authors. Panda and Rao [17] concluded there is a very significant improvement in the return and revenue performances of companies in the ex-post compared to the ex-ante demerger period. Bao [18] realized another study measuring the impact of demerger upon financial performances. The author evaluated banks’ financial performances from the ex-ante, respectively, ex-post demerger periods.
3. Data and Methodology
The purpose of this paper is to evaluate the demerger’s impact upon the sustainable development of economic entities, using a structural analysis of 268 demerger projects from the April 2012–April 2021 period and a statistical analysis of profitability ratios from before and after the demerger.
3.1. Structural Analysis of Demerger Projects
The first objective of this study is a detailed analysis of demerger projects to identify characteristics such as demerger year, companies’ legal form, sector of activity, and number of beneficiary companies. The yearly evolution of demerger projects is shown in Figure 1.
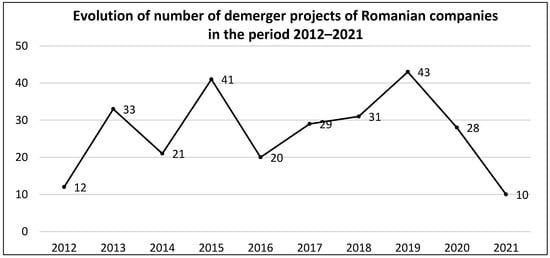
Figure 1.
The evolution of the demerger projects during the 2012–2021 period.
The structural analysis also envisioned identifying the causes, motivation, and advantages of the demerger projects. The database includes all the 268 demerger projects published by Romanian Trade Office Register [19] for the April 2012–April 2021 period. The analysis counted 10 projects in 2021, 28 projects in 2020, 43 projects in 2019, 31 projects in 2018, 29 projects in 2017, 20 projects in 2016, 41 projects in 2015, 21 projects in 2014, 33 projects in 2013, and 12 projects in 2012. Most of the concerned societies are organized as limited liability societies, such as following the demerging, as it usually results from only one beneficiary company. Of the total 268 companies, 67 (respectively 25% of the demerger projects) are incorporated shares companies, whereas 201 are limited liability companies, respectively 75% of the total. The main type of demerger was the patrimonial transfer toward the newly established companies at the demerger moment.
Figure 2 presents the distribution of the demerger projects by sectors of activity.
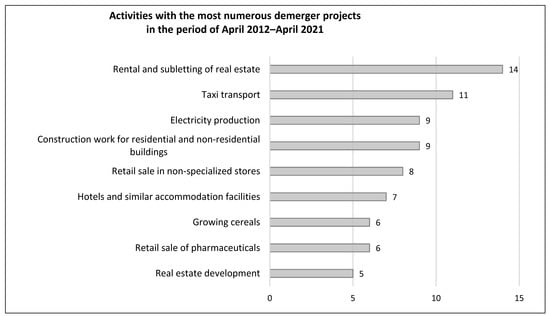
Figure 2.
Main sectors of activity of demerged companies.
The divided companies originate from virtually all activity sectors. Yet, predominant are the ones from letting and subletting real estate assets sector (14), taxi transportation (11), electricity production (9), commercial and non-commercial real estate construction companies (9), retail sales in non-specialized stores (8), hotels and assimilated accommodation structures (7), retail of pharmaceutical products (6), growing crops (5) and other activities with a smaller number of projects.
The content analysis revealed the reasons and foundations of demerging the 268 involved economic entities. The main economic and commercial reasons substantiating the demerger projects are summarized and presented in Table 1, ordered by their decreasing frequency.

Table 1.
Advantages and motivation of demerger.
The analysis reveals a variety of reasons which determine companies to subject themselves to a demerger process. The demerger is justified by the necessity of separating specific projects and activities realized by divided entities in view of better-focused and more efficient management of available resources. The content analysis revealed that increasing economic efficiency was the main reason for dividing the concerned Romanian entities.
Creating distinct entities specialized in a specific sector of activity, with separated budgets of revenues and expenditures, can contribute to a better efficiency and profitability of each entity. Smaller companies are easier to manage and control and more responsive to market reactions. A smaller company can benefit from a more efficient management, more efficient use of resources, productivity increase, all resulting in increased profitability and quality of products and services offered to the clients. The demerger process allows a proper identification and focus on a given market segment for each company resulted from demerger. In addition, splitting the activities can improve negotiation power with business partners, offering the companies an improved market response capacity and generating a consolidation of market positioning. The content analysis revealed situations which justified demerging due to misunderstandings between shareholders/associates regarding the investment and management policies of concerned entities. A large number of shareholders/associates can generate problems in the decision-making process. Separating and empowering the management structures can optimize expenditures, reduce operating costs and increase long-term profitability.
Another reason for company demerger is the negative effects of the sanitary crisis upon sales turnover. The companies which divided in 2020 and 2021 maintained demerging was necessary due to current economic context (Covid-19 generated), due to financial and social crisis, and implicitly because of the need for a long-term increase of efficiency and profitability.
3.2. Statistical Analysis of the Differences between the Ex-Ante and Ex-Post Demerger Sub-Periods
Another objective of this paper is to evaluate the impact of demerger strategy upon companies’ efficiency and profitability. The profitability analysis for the ex-ante and ex-post periods is necessary to ensure a better highlight of the effects generated by the demerger.
One purpose of this paper is to realize a statistical analysis of the performance differences from the before and after demerger sub-periods and to find whether the demerger had a positive impact upon sampled companies’ efficiency and financial sustainability.
This paper investigates whether demerger can be a solution for saving and recovering the companies found in financial distress. To see whether companies’ financial performances have improved after the demerger, it was selected a sample with 72 economic entities demerged, only from those entities which reported financial situations in the 2005–2019 period. The economic entities included in the sample were analyzed in four stages, using 4 panels, respectively, one with 8 companies demerged in 2012, one with 22 companies demerged in 2013, a panel with 17 companies demerged in 2014, and another one with 25 companies demerged in 2015. The analysis also included 20 entities demerged in 2020 and 6 economic entities demerged in 2021 to find whether the demerger restructuring was needed and useful from an economic and financial point of view.
The analysis started by selecting those entities which reported financial data in the 2005–2019 period. The main source of data was the financial statements of demerged companies, using the site www.romanian-companies.eu (accessed on 29 April 2021) [20].
We have selected as measures of financial performances the profitability ratios of ROA (return on assets) and ROE (Return on Equity).
ROA shows management performances in using company assets to generate net income. We calculated ROA as Net profit after tax divided by Total Assets.
ROE expresses financial performance, and it informs shareholders about the company’s capacity to use its invested capital (Equity) to generate profits. We calculated ROE as Net profit after tax divided by Equity.
The analysis of these profitability ratios for the sample considered can offer information about companies’ financial performances from the before and after demerger periods.
The purpose of this research is to analyze the impact of demerger upon sampled companies’ financial performances, these were established and statistically tested two sets of hypotheses:
- Testing the ROA level differences in the ex-ante and ex-post demerger periods
Hypothesis 0 (H0):
There are no significant differences between the ex-ante and ex-post demerger levels of ROA.
Hypothesis 1 (H1):
There are significant differences between the ex-ante and ex-post demerger levels of ROA.
- 2.
- Testing the ROE level differences in the ex-ante and ex-post demerger periods
Hypothesis 2 (H2):
There are no significant differences between the ex-ante and ex-post demerger levels of ROE.
Hypothesis 3 (H3):
There are significant differences between the ex-ante and ex-post demerger levels of ROE.
In this sense, the SPSS T-test was used to verify the significance of ROA and ROE average differences for the two ex-ante, respectively, ex-post demerger periods.
4. Results and Discussions
4.1. Statistical Analysis of 2012, 2013, 2014, and 2015 Panels
The sample of 72 companies used in the statistical analysis was distributed in four panels, corresponding to the demerging years, respectively, 2012, 2013, 2014, and 2015. The demerging years were selected to allow a comparative analysis of the two sub-periods, from before and after the demergers.
4.1.1. Statistical Analysis of ROA in the Ex-Ante and Ex-Post Demerger Sub-Periods
To ensure results’ robustness, a statistical analysis of ROA and ROE was performed for the ex-ante and ex-post demerger sub-periods using the SPSS statistical software. Table 2 centralizes the descriptive statistics results, respectively, the average and standard deviation for ROA and each of the four panels, before and after the demerger.
Table 2.
Descriptive statistics.
The first sub-period includes the demerger year, whereas the second sub-period starts with the first year after the demerger. For the 2012 and 2015 panels, the ROA average from after the demerger decreased, registering a small decline for the 2015 panel and a dramatic fall for the 2012 panel, with the average ROA becoming negative. An explanation for the situation of the 2012 panel could reside in the smaller number of sampled companies. For the 2014 panel, a higher variation of ROA average after the demerger can be noticed compared to the ex-ante demerger sub-period. In the 2015–2019 sub-period, the ROA average is 11.2%, with a standard deviation of 21.3%, whereas for the 2005–2014 sub-period, before the demerger, the ROA average was 7.6%, with a standard deviation of 12%.
To verify the statistical significance of ROA average differences between the two sub-periods (before and, respectively, after the demerger) the T-test and F of Levene’s tests were used. The two sub-periods are considered as samples originating either from equal or unequal variances’ populations. The T-test is calculated for both situations. The F test verifies variances’ equality for the two sub-periods and indicates which of the two situations can be considered for interpreting the T-test. The T-test values for the F test’s hypotheses are similar and do not affect the acceptance or rejection of the null hypothesis, H0. The results obtained applying the T and F tests are presented in Table 3. The F test does not reject the H0 hypothesis of ROA variances’ equality for the two sub-periods, for the 2012, 2013, and 2015 panels. For these panels, the T-test and P-value (Sig. (2-tailed)), corresponding to variances’ equality situation, in the bolded rows of Table 3 are considered. For the 2014 panel, the Levene’s F test rejects the H0 hypothesis; hence, we conclude the two sub-periods originate from unequal variances’ samples, in the bolded row of Table 3. For the 2012 panel, the T-test rejects the H0 hypothesis of equality for ROA averages from before and after the demerger as Sig. (2-tailed) is lower than 5%. The negative difference of ROA averages is significantly different from zero, and the ex-post demerger ROA average is significantly lower compared to the previous period, at a 5% significance threshold. The conclusion of the T-test is also supported by a declining ROA trend for the 2013–2019 sub-period on the ROA chart of the 2012 panel, in Figure 3. For the 2013, 2014, and 2015 panels, the T-test fails to reject the H0 hypothesis as Sig. (2-tailed) is higher than 5%. For 2014 panel, the T-test fails to reject the H0 hypothesis of the two sub-periods of ROA averages’ equality; Sig. (2-tailed) equals 15.3%, which is higher than 5% significance level.
Table 3.
T-test for equality of means.
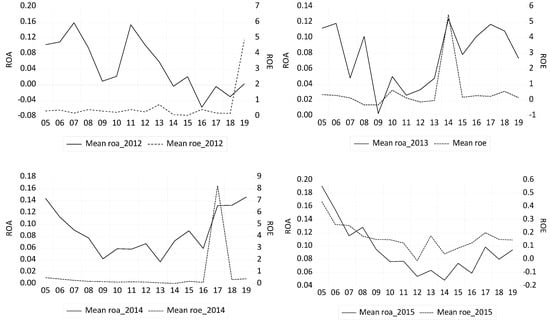
Figure 3.
Average evolutions of ROA and ROE in the 2005–2019 period for the four panels.
The conclusion is that the differences between ROA averages of the two sub-periods do not significantly differ from zero at a 5% significance threshold. For these panels, the confidence intervals of averages’ differences between the two sub-periods change the sign from “−” to “+”, suggesting the averages’ difference can be equal to zero; respectively, the ROA averages of the two sub-periods can be equal. The diagrams from Figure 3 reveal the evolution of ROA and ROE for the 2005–2019 period for the four panels.
ROA shows a declining trend during the second sub-period for the panel with the companies demerged in 2012 and a growing trend for the other three panels after the corresponding demerger year.
4.1.2. Statistical Analysis of ROE in the Ex-Ante and Ex-Post Demerger Periods
Table 4 centralizes the descriptive statistics results, respectively, the average and standard deviation for ROE and each of the four panels, before and after the demerger.
Table 4.
Descriptive statistics.
For the panels with companies demerged in 2012, 2013, and 2014, the average ROE is higher in the ex-post demerger sub-period. For these panels, which registered a higher ROE after the demerger, a larger variation of ROE in the second sub-period can also be noticed, as, during this sub-period, the average standard deviations of ROE are significantly larger compared to the previous sub-period.
For the panel of 2015 demerged companies, the average ROE is slightly lower in the ex-post demerger period of 2016–2019 compared to the previous sub-period of 2005–2015. This panel displays a lower variation of ROE after the demerger.
To verify the statistical significance of ROE averages’ differences between the two sub-periods (from before and, respectively, after the demerger) the T-test and F of Levene’s tests were used. The results obtained are presented in Table 5.
Table 5.
T-test for equality of means.
The difference of sub-periods of ROE averages is negative for the 2015 panel and positive for all the other panels, respectively, the ex-post ROE averages were higher than the ex-ante ones. An explanation for 2015’s panel could be the shorter ex-post sub-period, of only 4 years considered after the 2015 demerger.
As in the ROA case, for the 2014 panel, the Levene’s F test statistics reject the H0 hypothesis so that the two sub-periods originate from unequal variances’ samples, in the bolded row of Table 5. For the other panels, the Levene’s F test fails to reject the H0 hypothesis of the sub-periods’ variances’ equality; as seen in the bolded rows of Table 5.
The T-test fails to reject the H0 hypothesis of insignificant differences between the ROE averages of the two sub-periods, having the value of Sig. (2-tailed) higher than 5% for all the panels.
The diagrams from Figure 3 reveal the evolution of ROE in the 2005–2019 period for the four panels included in the sample. For the 2015 panel, there is an unfavorable evolution compared to the previous period, yet this difference is statistically insignificant.
4.1.3. Comparative Analysis of ROA and ROE for the Ex-Ante and Ex-Post Demerger Sub-Periods
The comparative analysis of ROA and ROE was made for both company and panel levels. For the companies from each panel, the statistical signification of the ROA and ROE average differences were computed for the two sub-periods delimited by the corresponding demerger year.
The effects that demergers had upon these two profitability ratios were determined. The tests’ results regarding the significance of sub-periods’ averages’ differences, for ROA and ROE, for each company inside the 2012, 2013, 2014, and 2015 panels, as well as at each panel level, are analyzed in Table 6.
Table 6.
Summary of applying T-test for means’ equality, at company level.
The results from Table 6 reveal that for all panels, most of the companies (about 60% of them) have not recorded significant changes in ROA and ROE in the ex-post period compared to the ex-ante demerger period.
The weight of companies registering significant changes is higher in the case of ROA compared to ROE, with the notable exception of the panel created for the companies divided in 2012.
In case of ROA, for all analyzed panels, negative changes are predominant for the companies which recorded significant changes, whereas, for ROE, the positive changes are predominant, obviously for the companies displaying significant changes.
For all the panels, except for 2012, divided companies registered insignificant changes for both ROA and ROE. For the 2012 panel, significant differences were reported ex-post in case of ROA, with a negative trend, whereas ROE did not mark any significant changes. One explanation could be that the number of companies included in the 2012 panel is considerably lower than for the panels with companies divided in the following years.
The conclusions of this research reflect the working hypotheses of the statistical tests initially established. The previous results lead to accepting the null hypothesis, H0, for both indicators. There are no significant differences between the ex-ante and ex-post demerger levels of ROA and ROE.
4.2. Statistical Analysis of ROA and ROE for the 2020 and 2021 Panels
Looking further to the panels with recently demerged, from 2020 and 2021, the results of the descriptive statistics for ROA and ROE previous to the demerger years, i.e., for the entire period of 2005–2019, are centralized in Table 7 and Figure 4.
Table 7.
Descriptive statistics.
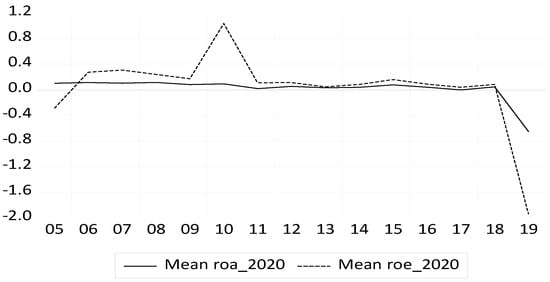
Figure 4.
The evolution of average ROA and ROE for the 2020 panel.
The ROA and ROE variables have registered a declining trend before 2020, the year of the demerger, indicating that some form of reorganizing the activity of sampled entities was needed (see Table 7 and Figure 4).
Regarding the entities divided in 2021, the ROA and ROE variation was more intense, still with a declining trend in the period preceding the demerger (see Figure 5).
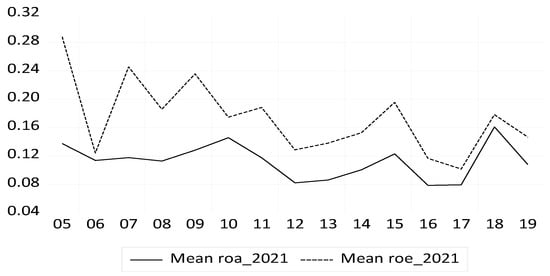
Figure 5.
The evolution of average ROE and ROA for the 2021 panel.
The decrease in profitability and efficiency revealed by ROE levels under the economic crisis generated by the Covid-19 pandemic in 2020 is a factor which determined the companies to reorganize and appeal to demergers. Investors often use ROE measures to set their investment strategies in any given company.
The fact that ROA and ROE levels did not change significantly after the demerger can reveal some interesting aspects. Given the technical construction of ROA and ROE ratios, if their levels remain the same in the ex-post demerger period compared to the ex-ante period, this could signal that the demerger process was carefully planned and implemented. Since total assets (from the denominator of ROA ratio) decrease following the demerger action and yet ROA remain virtually the same, it means the divided companies maintained approximately the same efficiency as previously. The resulting companies obtained a portfolio of assets with relatively the same profitability as cedent company. The same reasoning is probably valid for ROE levels.
In the coming periods, both ROA and ROE could increase if their managers implement investment strategies that best suit the specific features of their clients and markets.
5. Conclusions
The current crisis, generated by the Covid-19 pandemic, has produced and still produces significant effects upon companies’ sustainable development.
The current paper evaluated whether demerger can represent a recovery solution for the companies in distress or even generate beneficial effects upon sampled companies’ economic and financial profitability. Usually, demerger is justified by the necessity of reorganizing, restructuring, and rethinking companies’ activity and business.
The content analysis showed that demerger was mainly performed for economic reasons, respectively, for reasons of increasing the profitability and efficiency of company activities. Through the demerger, the companies follow an increase of profitability and efficiency. Yet, the demerger does not determine an immediate improvement (as proven by the statistical analysis) but rather a preservation of existing efficiency levels for about four years, after which it is possible to register a slight increase.
The statistical analysis results revealed that for all the panels, most of the companies (over 60% of them) did not register significant changes in ROA and ROE levels in the ex-post period compared to the ex-ante demerger period; respectively, the H0 hypothesis was validated.
The demerger did not generate an immediate increase of profitability ratios for neither ROA or ROE, yet it did allow the companies to survive and continue the activity for a period of at least 4 years after the demerger, as evidenced by the evolutions from Figure 3.
This study supports the conclusion that demerger determines increased independence and a focus upon base activities, thereby ensuring long-term efficiency and favoring companies’ sustainable development. A smaller company can benefit from more efficient management, more efficient use of its resources, and preservation of financial profitability levels for a longer-term.
The results obtained are in the same line with previous studies [15,16,17,18], as they support the conclusion of a positive impact of demerger upon financial performances and efficiency of sampled companies.
This study differs from previous ones in this segment by the statistical analysis performed in four stages, using four panels, pertaining to the years when demergers took place. Our study encompasses a longer period of time, of 15 years, to allow an ex-ante and an ex-post demerger performance analysis, as well as a relatively significant number of divided companies (72 companies). Moreover, the study performed a detailed analysis of 268 demerger projects.
We consider that both managers and investors can use the results obtained from this research to assess the growth and development potential of the economic entities resulted from the demerger. Our study can help managers identify the restructuring method for the company they administrate. This study revealed that ROA and ROE levels do not register an immediate increase after the demerger; however, this process allows companies and managers to continue their activity in the medium and long run, for at least four years (as it resulted from available data analysis). The demerger allows increased independence and a focus upon the underlying activities, ensuring increase of efficiency and a sustainable development of these companies. This aspect can be revealed by the graphs put together for each separate panel (for both ROA and ROE measures). The experience acquired by demerger companies, reflected by this research, can represent a model of good practices for other companies confronted with financial difficulties after the Covid-19 pandemic.
5.1. Scientific Contributions to the Literature
The paper brings value to reference literature to complete the research area in economic entities’ restructuring direction. This study represents a useful analysis tool for characterizing the demerger phenomenon in any economy.
The present study is the first one in Romanian approaching demergers from a financial perspective, also looking to the demerger effects upon the companies’ sustainable development. The statistical processing from this research offers a complex analysis of the impact demergers have upon Romanian companies’ financial performances and economic efficiency.
The research contributes to the existing literature in several ways.
First of all, it assessed the impact demergers had upon the sampled companies (72 Romanian companies), using ROA and ROE, during fifteen years.
Secondly, it applied some tests to check the statistical significance of the differences between the ex-ante and ex-post demerger performances and provided robust results.
Thirdly, it found whether demerger companies have endured in the market for at least 4 or 5 years after the demerger (they did not file liquidation procedures) and if they registered positive values of ROA and ROE.
Fourthly, it assessed and analyzed in detail a great number of demerger projects (268 projects) published in the 2012–2021 period. The analysis of demerger projects is meant to identify the characteristics of this restructuring phenomenon.
5.2. The Limits of the Study
The research was limited by the extent of the information offered by the demerger projects, as some projects provided only partial information. Another limitation of the study was the small number of sampled companies (8 companies) from the panel with economic entities divided in 2012.
The heterogeneity of activity domains and, moreover, the specificities of companies may be a serious limit in interpreting the average values of ROA and ROE at the panel level. However, this was handled with checking the significance of differences between the sub-periods of ROA and ROE averages for each company, and then formulating a conclusion at panel data level.
5.3. Further Directions of the Research
A further research direction is related to approach the demerger phenomenon for separate economic branches to find whether there are sectorial differences in economic performances, extending the analysis period and account for global crisis years (such as 2008–2009).
Another future direction could be identifying some tendencies of merger-demerger actions, appropriate for different development stages of economies. Some comparisons of structural entities’ reorganization may describe national economies’ dynamics and even establish some reorganization actions for different economies’ profiles.
Future research could use interviews within the ranks of divided companies’ managers to learn their opinions regarding the effects of demerger upon the efficiency of the activity and the advantages and disadvantages identified by them following the demerger process.
Author Contributions
C.M.B.: Writing Original Draft, Validation, Visualization. C.D.: Methodology, Data Curation, Validation. M.S.D.: Conceptualization, Supervision, Writing, Review & Editing. L.D.: Software, Statistical analysis, Investigation. G.D.: Resources, Supervision, Project administration. All authors have read and agreed to the published version of the manuscript.
Funding
This research received no external funding.
Institutional Review Board Statement
Not applicable.
Informed Consent Statement
Not applicable.
Data Availability Statement
The data presented in this study are available on request from the corresponding author.
Conflicts of Interest
The authors declare no conflict of interest.
References
- Law No. 227/2015, Regarding the Fiscal Code, Published in the Official Gazette of Romania No. 688/10, September 2015. Available online: http://legislatie.just.ro/Public/DetaliiDocumentAfis/171282 (accessed on 10 December 2020).
- Company Law No. 31/1990, Republished in the Official Gazette of Romania No. 1066/17, November 2004. Available online: http://legislatie.just.ro/Public/DetaliiDocument/56732 (accessed on 20 November 2020).
- Ministry of Public Finances. Order No. 897/2015 for Approving the Methodological Norms Regarding the Accounting Representation of the Main Corporate Merger, Demerger, Dissolution, and Liquidation Operations, as Well as Those for Excluding Certain Associates from Companies, Published in the Official Gazette of Romania No. 0711/22, September 2015. Available online: http://legislatie.just.ro/Public/DetaliiDocument/171454 (accessed on 8 October 2020).
- Rachisan, P.R.; Grosanu, A.; Berinde, S.R. The Typology of Restructuring by Demerger Practiced Mostly by the Entities from Romania. Int. J. Strateg. Manag. 2008, 8, 115–125. [Google Scholar]
- Singh, R.; Bhowal, A.; Bawari, V. Impact of Demerger on Shareholders’ Wealth. Enterp. Risk Manag. 2009, 1, 44–59. [Google Scholar] [CrossRef]
- Vyas, P.; Pathak, B.V.; Saraf, D. Impact of Demerger Announcement on Shareholder Value Evidences from India. J. Manag. Public Policy 2015, 7, 13–26. [Google Scholar]
- Padmanabhan, P. Do Demerger Announcements Impact Shareholders Wealth? An Empirical Analysis Using Event Study. Vision 2018, 22, 22–31. [Google Scholar] [CrossRef]
- Aggarwal, P.; Garg, S. Restructuring through spin-off: Impact on shareholder wealth. Manag. Financ. 2019, 45, 1458–1468. [Google Scholar] [CrossRef]
- Veld, C.; Veld-Merkoulova, Y.V. Do spin-offs really create value? The European case. J. Bank. Financ. 2004, 28, 1111–1135. [Google Scholar] [CrossRef] [Green Version]
- Veld, C.; Veld-Merkoulova, Y.V. Value creation through spin-offs: A review of the empirical evidence. Int. J. Manag. Rev. 2009, 11, 407–420. [Google Scholar] [CrossRef] [Green Version]
- Khurana, V.K.; Gupta, M. Effectiveness of demerger as a tool for wealth creation. JIM QUEST 2013, 9, 42–53. [Google Scholar]
- Chai, D.; Lin, Z.; Veld, C. Value-creation Through Spin-offs: Australian Evidence. Aust. J. Manag. 2018, 43, 353–372. [Google Scholar] [CrossRef]
- Basak, R. Corporate restructuring through demerger: A case study on Hindustan Unilever Limited. Int. J. Bus. Ethics Dev. Econ. 2017, 5, 22–28. [Google Scholar]
- Johnson, S.A.; Klein, D.P.; Thibodeaux, V.L. The effects of spin-offs on corporate investment and performance. J. Financ. Res. 1996, 19, 293–307. [Google Scholar] [CrossRef]
- Mallick, A.K.; Rakshit, D. Corporate Restructuring through Demerger: A case study. Financ. India 2006, 20, 1321–1338. [Google Scholar]
- Rakshit, D.; Ghosh, S. Demerger: Sailing with the Global Wind. NSHM J. Manag. Res. Appl. 2010, 2, 22–31. [Google Scholar]
- Panda, B.; Rao, P.H. Corporate restructuring: Demerging impact. SCMS J. Indian Manag. 2012, 9, 80–87. [Google Scholar]
- Bao, H. Evaluation of pre and post DemergerMerger performance: Using ABN AMRO Bank as an example. Int. J. Econ. Financ. 2017, 9, 196–204. [Google Scholar] [CrossRef] [Green Version]
- Available online: https://www.onrc.ro (accessed on 29 April 2021).
- Available online: https://www.romanian-companies.eu (accessed on 4 January 2021).
Publisher’s Note: MDPI stays neutral with regard to jurisdictional claims in published maps and institutional affiliations. |
© 2021 by the authors. Licensee MDPI, Basel, Switzerland. This article is an open access article distributed under the terms and conditions of the Creative Commons Attribution (CC BY) license (https://creativecommons.org/licenses/by/4.0/).