Article

Dynamic Norms and Food Choice: Reflections on a Failure of Minority Norm Information to Influence Motivation to Reduce Meat Consumption

School of Psychology, University of Sussex, East Sussex BN1 9QH, UK
*
Author to whom correspondence should be addressed.
Sustainability 2021, 13(15), 8315; https://doi.org/10.3390/su13158315
Submission received: 13 May 2021 / Revised: 5 July 2021 / Accepted: 8 July 2021 / Published: 26 July 2021

Abstract

:
Recent research in the US shows the potential of providing information about minority norms that are increasing on positively influencing interest and engagement in desired behaviours. Although these are promising findings, there is little published research replicating or testing this effect outside the US. The study reported here is a direct replication of Sparkman and Walton’s (2017) research. We explored the effects of different kinds of normative information, particularly information about increasing (referred to as ‘dynamic’ or ‘trending’) minority norms, on interest in reducing meat consumption, attitudes toward reducing meat consumption, intentions to reduce meat consumption, and expectations to do so. Following pilot work (n = 197), we used a double-blind online study with three conditions: dynamic norm (n = 276), static norm (n = 284), and no norm (n = 286). The sample consisted of British people, with ages ranging from 18 to 79 (Mage = 37.21, SDage = 13.58; 56.38% female). There was no effect of dynamic norm information on any outcomes, including predictions about future meat consumption norms. Exploratory analyses suggest that political position and gender were associated with meat consumption outcomes. The findings are discussed in relation to conditions under which dynamic normative information may be successful in influencing motivation to engage in desired behaviours, and to possible improvements in research design.

1. Dynamic Norms and Meat Consumption Outcomes

Climate change is a pressing global issue with potentially devastating effects on the environment and the lives of humans and other animals. Greenhouse gas emissions significantly contribute to anthropogenic climate change (i.e., change arising from human activity), with people’s eating choices being a significant influential factor. One of the largest sources of greenhouse gas emissions is people’s eating choices: it has been estimated that livestock alone contribute 14.5% of total human-caused greenhouse gas emissions, which is equivalent to emissions caused by transportation including all cars, trucks, planes, and ships on the planet combined [1]. Research has shown that switching to more environmentally sustainable eating decisions, such as opting for chicken, fish, or vegetables rather than red meat, could reduce the costs of climate change mitigation by as much as 50% by 2050 [2]. Furthermore, eating a plant-based diet has significantly higher potential to reduce emissions than many commonly promoted and researched strategies such as recycling and switching to hybrid cars [3].

1.1. Social Norms

A fundamental challenge lies in persuading or otherwise influencing individuals to make more environmentally sustainable eating choices. There are many decisions an individual may make to effect more environmentally sustainable choices. In this paper, we specifically focus on decisions to limit meat consumption. A common way of influencing behaviour is by providing people with information about social norms. Social norms are “the predominant behaviours, attitudes, beliefs, and codes of conduct of a group” [4] (p. 1). Cialdini et al. [5] define injunctive norms as “rules or beliefs as to what constitutes morally approved and disapproved conduct”. They typically guide individuals’ behaviours to comply with societal standards and to avoid social sanctions. Descriptive norms refer to “what is typical or normal” (p. 1015), and what is done by most people. The two types of norms are related and often interact with one another. People are likely to conform to the aspect of the norm that is most salient (i.e., focused on temporarily or dispositionally) [5].
Researchers have recently differentiated between descriptive norms that are static and descriptive norms that are changing or trending [6,7,8,9]. Static norms refer to levels of current engagement in a behaviour and imply the unchanging character of that level of engagement, whereas dynamic norms refer to a collective change in others, or trends in norms over time [10]. For instance, a static norm would refer to the current unchanging prevalence of people who cycle to work, and dynamic norm would refer to an increasing (or decreasing) trend of people cycling to work. Information about static norms has been found to be particularly influential when it emphasizes a behaviour performed by the majority [11,12,13], but it can backfire when it provides information about behaviours performed by a minority of the individual’s ingroup (e.g., supermarket customers learning that a minority of 9% of other shoppers buy at least one eco product becoming less likely to buy eco products themselves, see [14]). One possible way to counteract this is through the use of information about dynamic norms to increase engagement in behaviours that are only performed by the minority. Sparkman and Walton [8] found that people responded more positively to salient information about change in collective behaviour or attitudes when the change aspect was made salient, even if the behaviour was currently only performed by a minority of the group’s members. Dynamic norm research has shown particular promise in online, laboratory, and field studies in targeting sustainable behaviours such as reduced interest in eating meat and using less water [6,7,8,15]. Sparkman and Walton [16] also found evidence for the efficacy of dynamic norms in a range of other domains. The authors conducted a series of studies where they found dynamic norm information increased participants’ intentions to attempt to quit smoking, interest in avoiding screen use before sleep, interest in avoiding sugary beverages, and male participants’ identification as feminists. Moreover, female high school students who read a passage on the uptake of female high school graduates entering into STEM degrees subsequently reported a greater intention to pursue a similar path, relative to those reading static norm messages [17]. Dynamic norms have even been found to encourage intergroup contact with immigrants in the UK [18]. However, research in this area has been sparse and inconsistent; for example, Chalasani et al. [19] found no effect of dynamic norm messaging on purchase of energy-efficient products in the federal sector. Another recent randomized controlled trial of norm-based feedback on household waste in Sweden found no evidence that dynamic-norm feedback was more effective than static norm feedback using a standard ‘Home Energy Report’ [20].
Norms are a particularly interesting tool to tackle unsustainable behaviours, as normative social influence is both often powerful [21] and under-detected (e.g., [22]). Among different motivators, Nolan et al. [22] found that the descriptive norm about neighbours’ energy conservation influenced participants’ own energy conservation behaviours the most, despite participants perceiving it as the least influential motivator. Some research has indicated that people tend to believe they are less susceptible to normative influence and their behaviour is less conforming, while also believing that others are more likely to conform [23].

1.2. Current Study

Although recent research has emerged which explores the effects of dynamic norms on sustainable behaviour norms, published research has so far been largely limited to participant samples in the US. It is important to investigate the effectiveness of dynamic norms in different settings in varying socio-political contexts and cultures. Moreover, most published research on dynamic norms and sustainable eating behaviours has been tested in relation to interest in reducing meat consumption, but there has been no research directly testing the relationship between dynamic normative information and other, more familiar, cognitive predictors of action, such as attitudes, expectations, and intentions to reduce meat consumption (see [24,25,26]). Within the theory of planned behaviour (e.g., [27]), there is a clear causal relationship between attitudes and intentions and behaviour, and a similar predictive effect of expectations on behaviour has been acknowledged [25].
This study sought to replicate the effect of dynamic norm information on interest in reducing meat consumption found in Sparkman and Walton [8], as well as other meat consumption-related variables. For the purpose of the study, we defined meat consumption as consumption of any animal flesh (pork, chicken, beef, fish, etc.).
Sparkman and Walton’s [8] research found evidence for the effect of dynamic norm information on predicted meat consumption in the future, where participants who read dynamic norm information about reduced meat consumption were more likely to predict a decline in consumption, compared to participants in the static norm control condition. The authors’ results suggest a mediating effect of “preconformity”—conforming to a predicted future norm—on interest in reducing own consumption. We were interested in replicating the effect of condition on expectations about future norm in our own study and sought to test this effect using the existing measure of preconformity from the original study, as well as via an additional measure estimating participants’ perception of future meat consumption in the UK.
The original study also found consistent associations of political orientation and gender with interest in reducing meat consumption, such that liberals and women were more likely to be interested in eating less meat, than were conservatives and men, respectively. We were interested in exploring the effects of demographic information on outcomes of interest, but we did not have predictions about any possible effects. Additionally, in tests of seven highly-cited social psychological phenomena (including opinion change resulting from conformity or persuasion) using randomly sampled, representative groups of American adults, Yeager et al. [28] found that age significantly moderated the average effect size across all studies. Specifically, they found that middle-aged adults (25–45 years) manifested the weakest effects. Thus, we were interested in exploring whether age would influence the effects of condition on the outcomes.
In the light of these research gaps, the current investigation aims to answer the following questions:
Confirmatory questions:
(1)
Does making dynamic norms about reduced meat consumption in the UK salient lead to higher interest in reducing meat consumption (compared to static norm salience)?
Hypothesis 1 (H1).
Participants exposed to dynamic minority norm information about reduced meat consumption will report higher interest in reducing their meat consumption than will participants exposed to static minority norm information.
(2)
Will participants in the dynamic norm condition be more likely (than those in the static norm control) to predict a future decrease in meat consumption in the UK?
Hypothesis 2 (H2).
Participants exposed to dynamic minority norm information about reduced meat consumption will predict a larger decline in future meat consumption than will participants exposed to static minority norm information.
Exploratory questions:
(3)
Does dynamic norm (versus static norm) information lead to more positive attitudes, intentions, and expectations to reduce meat consumption?
(4)
Does age interact with norm condition to influence dependent variables?
(5)
Do demographic factors such as age, gender, and political position predict the primary dependent variables?

2. Method

2.1. Pilot Study

We conducted a pilot study using a sample (N = 197) of the study population exploring current perceived meat consumption norms in the UK in order to minimize the discrepancy between the normative information used in the main study and people’s actual perception of the norm.
In line with Sparkman and Walton’s [8] approach to examining perceived norms, participants were split into two groups where they were either asked to: (a) estimate the percentage of people in the UK who make an effort to reduce their meat consumption, or (b) the percentage of people who have started to make this effort. Each estimate corresponds to the percentage used in either the static or dynamic norm condition, respectively. The average estimates provided by both groups were in the region of 30% (see Table 1). All participants were also asked if they had heard about a decrease in meat consumption in the UK (Yes/No), and their expectations about future meat consumption (1 = Decrease, 2 = Stay the same, 3 = Increase). There was no difference between groups in estimation of meat consumption norms, t(186.14) = 0.06, p = 0.950. There were also no significant differences between conditions in the percentage aware of a decrease in meat consumption, χ2(1, N = 197) = 0.12, p = 0.727, or the percentage of participants expecting a decrease in meat consumption, χ2(2, N = 197) = 0.17, p = 0.919. The key findings are shown in Table 1.

2.2. Main Study

2.2.1. Design and Procedure

A double-blind, between-participants, experimental design was employed in the main study. The study was presented as a survey on attitudes toward meat consumption. All participants were directed from their recruitment platform to a Qualtrics survey and read an introductory statement where we defined meat as any animal flesh, including pork, chicken, beef, fish, etc. There were 3 conditions: in the experimental conditions, each participant read a norm statement depicting either a static norm or a dynamic norm; in the ‘no task’ control condition, participants did not read any text and so proceeded to the dependent measures without an intervening task. All materials and preregistration are publicly available online (https://osf.io/6bdfz/, accessed on 15 July 2021).
To create the norm statements, we examined various sources to estimate the change in meat consumption in the UK. National data estimates ranged between 26% and 33% reduction in meat consumption (relative to 12 months prior to data collection) across the UK [29,30,31]. Based on the results of the pilot study, we chose 30% as an estimate for the created normative statements in order to enhance the believability of the normative information; it transpires, fortuitously, that this is the same as the estimate used in Sparkman and Walton’s [8] research.
After participants read the statements and answered a free response question (“why do you think this is?”), they completed dependent measures relating to meat consumption, followed by demographic questions. Similar to the original study design, we included the free response question “why do you think this is?” to increase participants’ engagement with the text.

2.2.2. Participants

Prior to data collection, we planned to use a Bayesian stopping rule to stop data collection once B > 6 or <1/6 for the primary outcome (see [32]), or when a minimum of 800 participants had completed the study (this part of the rule was adopted because of budgetary constraints). We sequentially tested Bayes factors at intervals of 30 participants, assuming 30 participants per iteration would be sufficient to make a difference in calculated Bayes factors. The choice of testing at 30 participant intervals was arbitrary. After several iterations, we increased the intervals of participants to 100 as we found that 30 participants were insufficient to make changes in the sensitivity of the Bayes factor. After the threshold of 800 participants was reached, our Bayes factors still did not reach a threshold of sensitivity. We then allocated additional funds to the study in an attempt to reach conclusive results either in support of, or against, the predicted effect for the primary hypothesis. Consistent with the pre-registration, this a-priori threshold was set at B > 5 or < 1/5 (https://osf.io/6bdfz/, accessed on 15 July 2021).
We report a supplementary power analysis using standardized effect sizes in the supplementary materials; however, this was not used in the study design or inferencing (see S5.1).
A total of 1146 participants were recruited through a survey posted on Prolific, an online participant recruitment platform. Of these, 300 were excluded from the reported analyses: 184 because they did not complete the survey, 98 because they indicated being vegan/vegetarians, five because they indicated that their results should not be included in the analysis, and 13 who failed to select the correct response in an attention check. The final sample (N = 846) ranged in age from 18 to 79 years (Mage = 37.21, SDage = 13.58; 56.38% female). Each participant received GBP 0.35 (approximately USD 0.45) for completing the task.

2.3. Materials

2.3.1. Normative Statements

Norm statements were based very closely on those used by Sparkman and Walton [8].
Static norm. In the static norm condition, the text read: ‘Recent research has shown that 30% of people in the UK make an effort to limit their meat consumption. That means that 3 in 10 people in the UK eat less meat than they otherwise would. Why do you think this is?’
Dynamic norm. In the dynamic norm condition, the text read: ‘Recent research has shown that, in the last 5 years, 30% of people in the UK have now started to make an effort to limit their meat consumption. That means that, in recent years, 3 in 10 people in the UK have begun to eat less meat than they otherwise would. Why do you think this is?’

2.3.2. Dependent Measures

We measured interest in reducing meat consumption, attitudes toward meat consumption, intentions and expectations regarding reducing own meat consumption. Additionally, we measured expectations about future meat consumption in the UK. The items are listed below (response scales options are indicated in parenthesis). These items are standard items widely used in the literature (see [25,26]).
Interest. To measure interest in reducing meat consumption, participants responded to a single item measure “How interested are you in eating less meat?” (not at all (1) to extremely (7); [8]).
Items measuring attitudes towards reducing meat consumption and intentions to reduce meat consumption were adapted from Fishbein and Ajzen [25].
Attitudes. To measure attitudes, participants responded to the statement: “My attitude towards reducing my meat consumption is...” (extremely unfavourable (1) to extremely favourable (7), and extremely negative (1) to extremely positive (7)). Participants also responded to the statement “reducing my meat consumption would be…” (extremely bad (1) to extremely good (2)).
Intentions. To measure intentions, participants responded to three statements: “I intend to reduce my meat consumption within the next year”, “I plan to reduce my meat consumption within the next year”, and “I will try to reduce my meat consumption within the next year” (very strongly disagree (1) to very strongly agree (7)).
Expectations. To measure expectations to reduce meat consumption, participants responded to a total of three statements. We adapted two items from Warshaw and Davis [26]: “I am going to reduce my meat consumption from now on” and “I will reduce my meat consumption from now on”, with responses on a 1–7 Likert scale from ‘extremely unlikely’ to ‘extremely likely’. Participants also responded to “I expect to reduce my meat consumption from now on” (very strongly disagree (1) to very strongly agree (7)).
Estimates of future meat consumption (‘Future Norm’). To assess whether the effect of normative statements rests on the participant’s assumption that the norm will increase in the future, participants responded to the statement, “In the next 5 years, I expect meat consumption in the UK to…” (decrease significantly (1) to increase significantly (7)).
Preconformity. We also used Sparkman and Walton’s [8] measure of preconformity “In the foreseeable future, to what extent do you think that many people will make an effort to eat less meat?” (not at all (1) to extremely (7)).
Estimate of current norm. Participants completed a series of questions to assess perceptions of the static norm, and construal of limiting meat consumption across conditions (adapted from [8]). The questions were presented in order to rule out alternative explanations for the effect of the norm statements, specifically a shift in the perceived static norm (please refer to the supplementary materials for the relevant secondary analyses). To assess perceptions of the static norm, two items were added: “What percentage of people do you think make an effort to limit their meat consumption?” (0 to 100%), and a Likert scale measure “Roughly, how many people in the UK make an effort to limit their meat consumption?” (none (1) to a lot (5)). To examine the construal of limiting meat consumption by condition, participants estimated the number of meatless meals of 21 total meals eaten each week by people who limited their meat consumption.

2.3.3. Demographic Variables

To control for participants’ background, participants reported their political position (very left wing (1) to very right wing (7)), age, gender, and nationality.

3. Results

3.1. Data Analyses

3.1.1. Data Inspection

We transferred the data into RStudio and examined it to check randomization to conditions: (a) ANOVA tests to compare participants’ age and political position, (b) Pearson chi-square tests to compare participants’ gender, and nationality. There were no missing data.
We proceeded to analyse the data to answer each research question using the steps outlined in the study’s pre-registration (https://osf.io/6bdfz/, accessed on 15 July 2021). We deviated from the preregistered analyses in two aspects: (a) rather than creating a structural path model with latent variables for the exploratory analyses, we used composite scores for each construct in the path models due to the large correlation between the items measuring each construct, and (b) measures of expectations and intentions to reduce meat consumption were very highly correlated (r > 0.90) and were averaged to create a composite score. We combined intentions and expectations because these constructs are conceptually very close, and because the items commonly used to measure them are closer still. In a discussion of intentions and expectations (and ‘willingness’), Fishbein and Ajzen [25] suggest “available evidence to date suggests that there is little to be gained by the proposed distinctions” (p. 41). We did not combine other items because of—what we see to be—their conceptual distinctiveness (e.g., the conceptual distinction between attitudes and intentions).

3.1.2. Confirmatory Analysis

We used a Bayesian inferencing approach to answer the confirmatory research questions. A Bayesian approach made it possible to distinguish between the null hypothesis, the alternative hypothesis, and lack of evidence for either. This is particularly important in the wake of the replicability crisis, and mathematical modelling has shown that “most published research findings are false” (see [33]).
To test our confirmatory hypotheses, we conducted direct contrasts to examine differences between conditions, rather than an omnibus test comparing the three conditions. We used Bayes factors (B) to determine strength of evidence, with B < 1/5 taken as “moderate” evidence for no effect—that is, null (H0) over the alternative (H1) hypothesis, B > 5 showing moderate evidence for the null over H1, and 1/5 < B < 5 indicating insensitivity to either hypothesis [32]. Each model of H1 is a probability distribution of effects given a hypothesis. To specify a model of H1 for each hypothesis test, we use a normal distribution centred on zero for the prior distribution. We set the mode of the distribution at zero, and the standard deviation (SD) is set to the approximate size of the predicted effect—the distribution’s scale factor. The scale factors used in testing each confirmatory hypothesis are based on the effects found in Sparkman and Walton [8]. Since our theory makes a directional positive prediction for both confirmatory questions, we removed half of the distribution below zero (see [34]).
Sensitivity analysis. To check how robust our conclusions are to changes in the predicted effect, we used robustness regions. Robustness regions contain the range of scale factors that would lead to the same conclusion reached by the Bayes factor [34].
Reporting. Reporting BHN(0,x) indicates that predictions of H1 were modelled as a half-normal distribution with an SD of x where x is a scale factor for the expected effect size [35]. We reported Robustness Regions (RR) for each B by giving the range of scale factors that supported the same range of evidence as described above: RR [x1, x2] indicates where the same conclusion is arrived at by the smallest (x1) and largest (x2) SD [36]. We also reported p-values associated with all statistical tests conducted.

3.1.3. Exploratory Analysis

Due to the exploratory nature of our latter research questions, we rely on Bayesian estimation methods rather than inferential statistical tools such as the Bayes factor or the null-hypothesis significance test (for full discussion on advantages of Bayesian estimation, see [37]). Bayesian estimation methods incorporate: (a) prior knowledge/assumptions about a given parameter before data are collected, and (b) observed data. This results in a posterior probability distribution for a given parameter capturing certainty about the parameter value. Specifically, we obtain an interval with a probability that this interval contains the regression coefficient [38].
All exploratory research questions were addressed using path models, estimated in R using blavaan [39]. First, we fit a model exploring the effect of condition on the outcome variables, following which we explored the potential interaction between condition and age using multi-sample analysis. Finally, we fitted a full model with condition and demographic variables as predictors of measured outcomes. For each regression parameter, we specified the hyperparameters of their normal distribution: the mean and the standard deviation. The mean refers to the parameter value we deem most likely, and the standard deviation reflects our certainty about this value. The smaller the standard deviation, the higher our certainty about a parameter value. Increased certainty about a parameter value reflected in the prior increases the influence of the prior specification on posterior results. Uninformative priors have little influence on estimated posterior distributions of a given parameter. We implemented uninformative default priors for all parameters which do not take into account any informed prior distributions (M = 0, SD = 10).
We determined how well the hypothesized model fitted the sample data using fit indices. We used Markov chain Monte-Carlo sampling to make simulated draws from a distribution and form a Markov chain that represents the posterior distribution. Three Markov chains with 1500 iterations each were implemented for each parameter to estimate posterior probability distributions. To assess chain convergence, the Gelman and Rubin convergence diagnostic was implemented, in which values close to one indicate model convergence. This diagnostic is referred to as the potential scale reduction factor (PSRF). We also visually inspected the trace plots for each model parameter to ensure consistency with the convergence diagnostic. To assess the model’s absolute fit, we used a posterior predictive p (ppp) in which values closer to 0.5 indicate a model that fits the observed data, and values closer to 0 indicate the opposite.
Sensitivity analysis. Incorporating information in the prior distribution of the model parameters provides some direction for their estimation [40]. We implemented two additional models with varying priors for the regression parameters predicted by condition: (a) model 2 using weakly informative priors (M = 0.50, SD = 0.75), and (b) model 3 using moderately informative priors (M = 0.50, SD = 0.35). We relied on the default prior settings of blavaan for all other parameters across all models. To examine how parameter estimates differ across models, we used the percentage of relative deviation of models using informative priors compared to uninformative priors. The computation for percent of relative deviation for a given model parameter is as follows: ((estimate from initial model) − (estimate from expanded model)/(estimate from initial model)) × 100. We refer to these as percentage of relative bias.
Reporting. We reported the estimated mean of the posterior distribution for each regression parameter and the corresponding 95% posterior probability interval (PPI). The PPI indicates a 95% probability that the population value lies between the lower and upper limits of the PPI, allowing us to explore the range of plausible effect sizes for estimated parameters [41]. We reported the percentage of relative bias for regression parameters from the additional models to the default model estimated in blavaan. We used the WAMBS-checklist for guidance on transparent reporting of Bayesian statistics [42].

3.2. Randomization Check

A preliminary randomization check was conducted. The check revealed no systematic differences between the three conditions in terms of gender, age, political position, and nationality (all p’s > 0.05; see Table 2 for the distribution).

3.3. Preliminary Analysis

Means, SDs, Cronbach’s alpha coefficients, and correlations for all measures are displayed in Table 3.

3.4. Research Question 1: Does Making Dynamic Norms about Reduced Meat Consumption in the UK Salient Lead to Higher Interest in Reducing Meat Consumption (Compared to Static Norm)?

To answer this question, we replicated the analyses conducted in Sparkman and Walton [8] to examine the differences between conditions. Sparkman and Walton [8] found effects of dynamic norms on interest in reducing meat consumption ranging from Mdiff = 0.60 to 0.78. We modelled H1 using a half-normal distribution with a mean of 0, and SD of Mdiff = 0.69. Thus, the rough size of effect expected if there was an effect of dynamic norm compared to static norm is Mdiff = 0.69. We will interpret all effects with respect to the Bayes factors.
There was no difference in interest in reducing meat consumption between the dynamic norm (M = 3.64, SD = 1.83) and static norm (M = 3.68, SD = 1.84) conditions, Δ M = 0.03 , 95% CI ( 0.34 , 0.27 ) , t ( 843 ) = 0.23 , p = 0.821 , d = −0.02, B HN ( 0 , 0.69 ) = 0.18, RR (0.65, 2). Although, descriptively, participants in the no-task control condition showed the least interest in reducing meat consumption (M = 3.41, SD = 1.77), they did not differ significantly from those in the dynamic-norm condition, Δ M = 0.23 , 95% CI ( 0.07 , 0.53 ) , t ( 843 ) = 1.52 , p = 0.130 , d = 0.13, or the static-norm condition, Δ M = 0.27 , 95% CI ( 0.03 , 0.57 ) ,   t ( 843 ) = 1.76 , p = 0.08 , d = 0.15.

3.5. Research Question 2: Will Participants in the Dynamic norm Condition Be More Likely (Than Static Norm Control) to Predict a Future Decrease in Meat Consumption in the UK?

We modelled H2 using a half-normal distribution with a mean of 0 and SD of Mdiff = 0.40. The plausible maximum effect was set at twice the predicted effect of Mdiff = 0.80. A Bayes factor was calculated for each test (see Tables S2.4 and S2.5).
There was no evidence for or against the presence of a difference between the dynamic norm condition (M = 5.26, SD = 0.93) and static norm conditions (M = 5.20, SD = 0.85) in expectations about future meat consumption, Δ M = 0.06 , 95% CI ( 0.08 , 0.21 ) , t ( 843 ) = 0.85   p = 0.397 , d = 0.07, B HN ( 0 , 0.40 ) = 0.42, RR (0.05, 0.8).
There was no evidence for or against the presence of a difference between the dynamic norm (M = 4.35, SD = 1.18) and static norm (M = 4.24, SD = 1.19) conditions in the expectation that many people would make an effort to reduce their meat consumption in the future, Δ M = 0.11 , 95% CI ( 0.09 , 0.31 ), t ( 843 ) = 1.08 , p = 0.279 , d = 0.09, B HN ( 0 , 0.40 ) = 0.72, RR (0.05, 1.5).

3.6. Research Question 3: Does Dynamic Norm (Versus Static) Information Lead to More Positive Attitudes, Intentions, and Expectations to Reduce Meat Consumption?

We conducted an exploratory path analysis to explore the effect of condition on meat consumption outcomes. We estimated the path model using non-informative priors in blavaan, followed by two models with increasing degrees of information as a method for detecting how much influence our informative priors had on the posterior results. A visual inspection of each model’s trace plots suggest that sampling chains converged (see Figures S4.1–S4.3). The mean estimates of the posterior distributions were relatively low for interest (M = 0.04, SD = 0.16), attitudes (M = −0.05, SD = 0.11) and the composite index of intentions and expectations (M = −0.04, SD = 0.14). With increasing degrees of information, mean regression parameter coefficients increased. Figure 1 shows the posterior distributions of the regression parameters across the three models. Thin horizontal lines indicate the 95% PPI for a given parameter, and thick horizontal lines indicate the 80% PPI.
To understand the exact influence of priors, we estimated the relative bias of both informative models (models 2 and 3) compared to the uninformative model (model 1). The informative priors had a large influence on the posterior results of the regression coefficients (model 1 vs. model 2 = −130.56% to 122.5%; model 1 vs. model 3 = −413.89% to 390%). Due to the relative bias in posterior results, we conclude that there is a difference based on prior settings, and that different models result in different conclusions. The model that fits the observed data best was model 1, ppp = 0.499 (see Table S4.1). In summary, the estimates and credibility intervals do not suggest an effect of condition on the measured meat consumption outcomes.

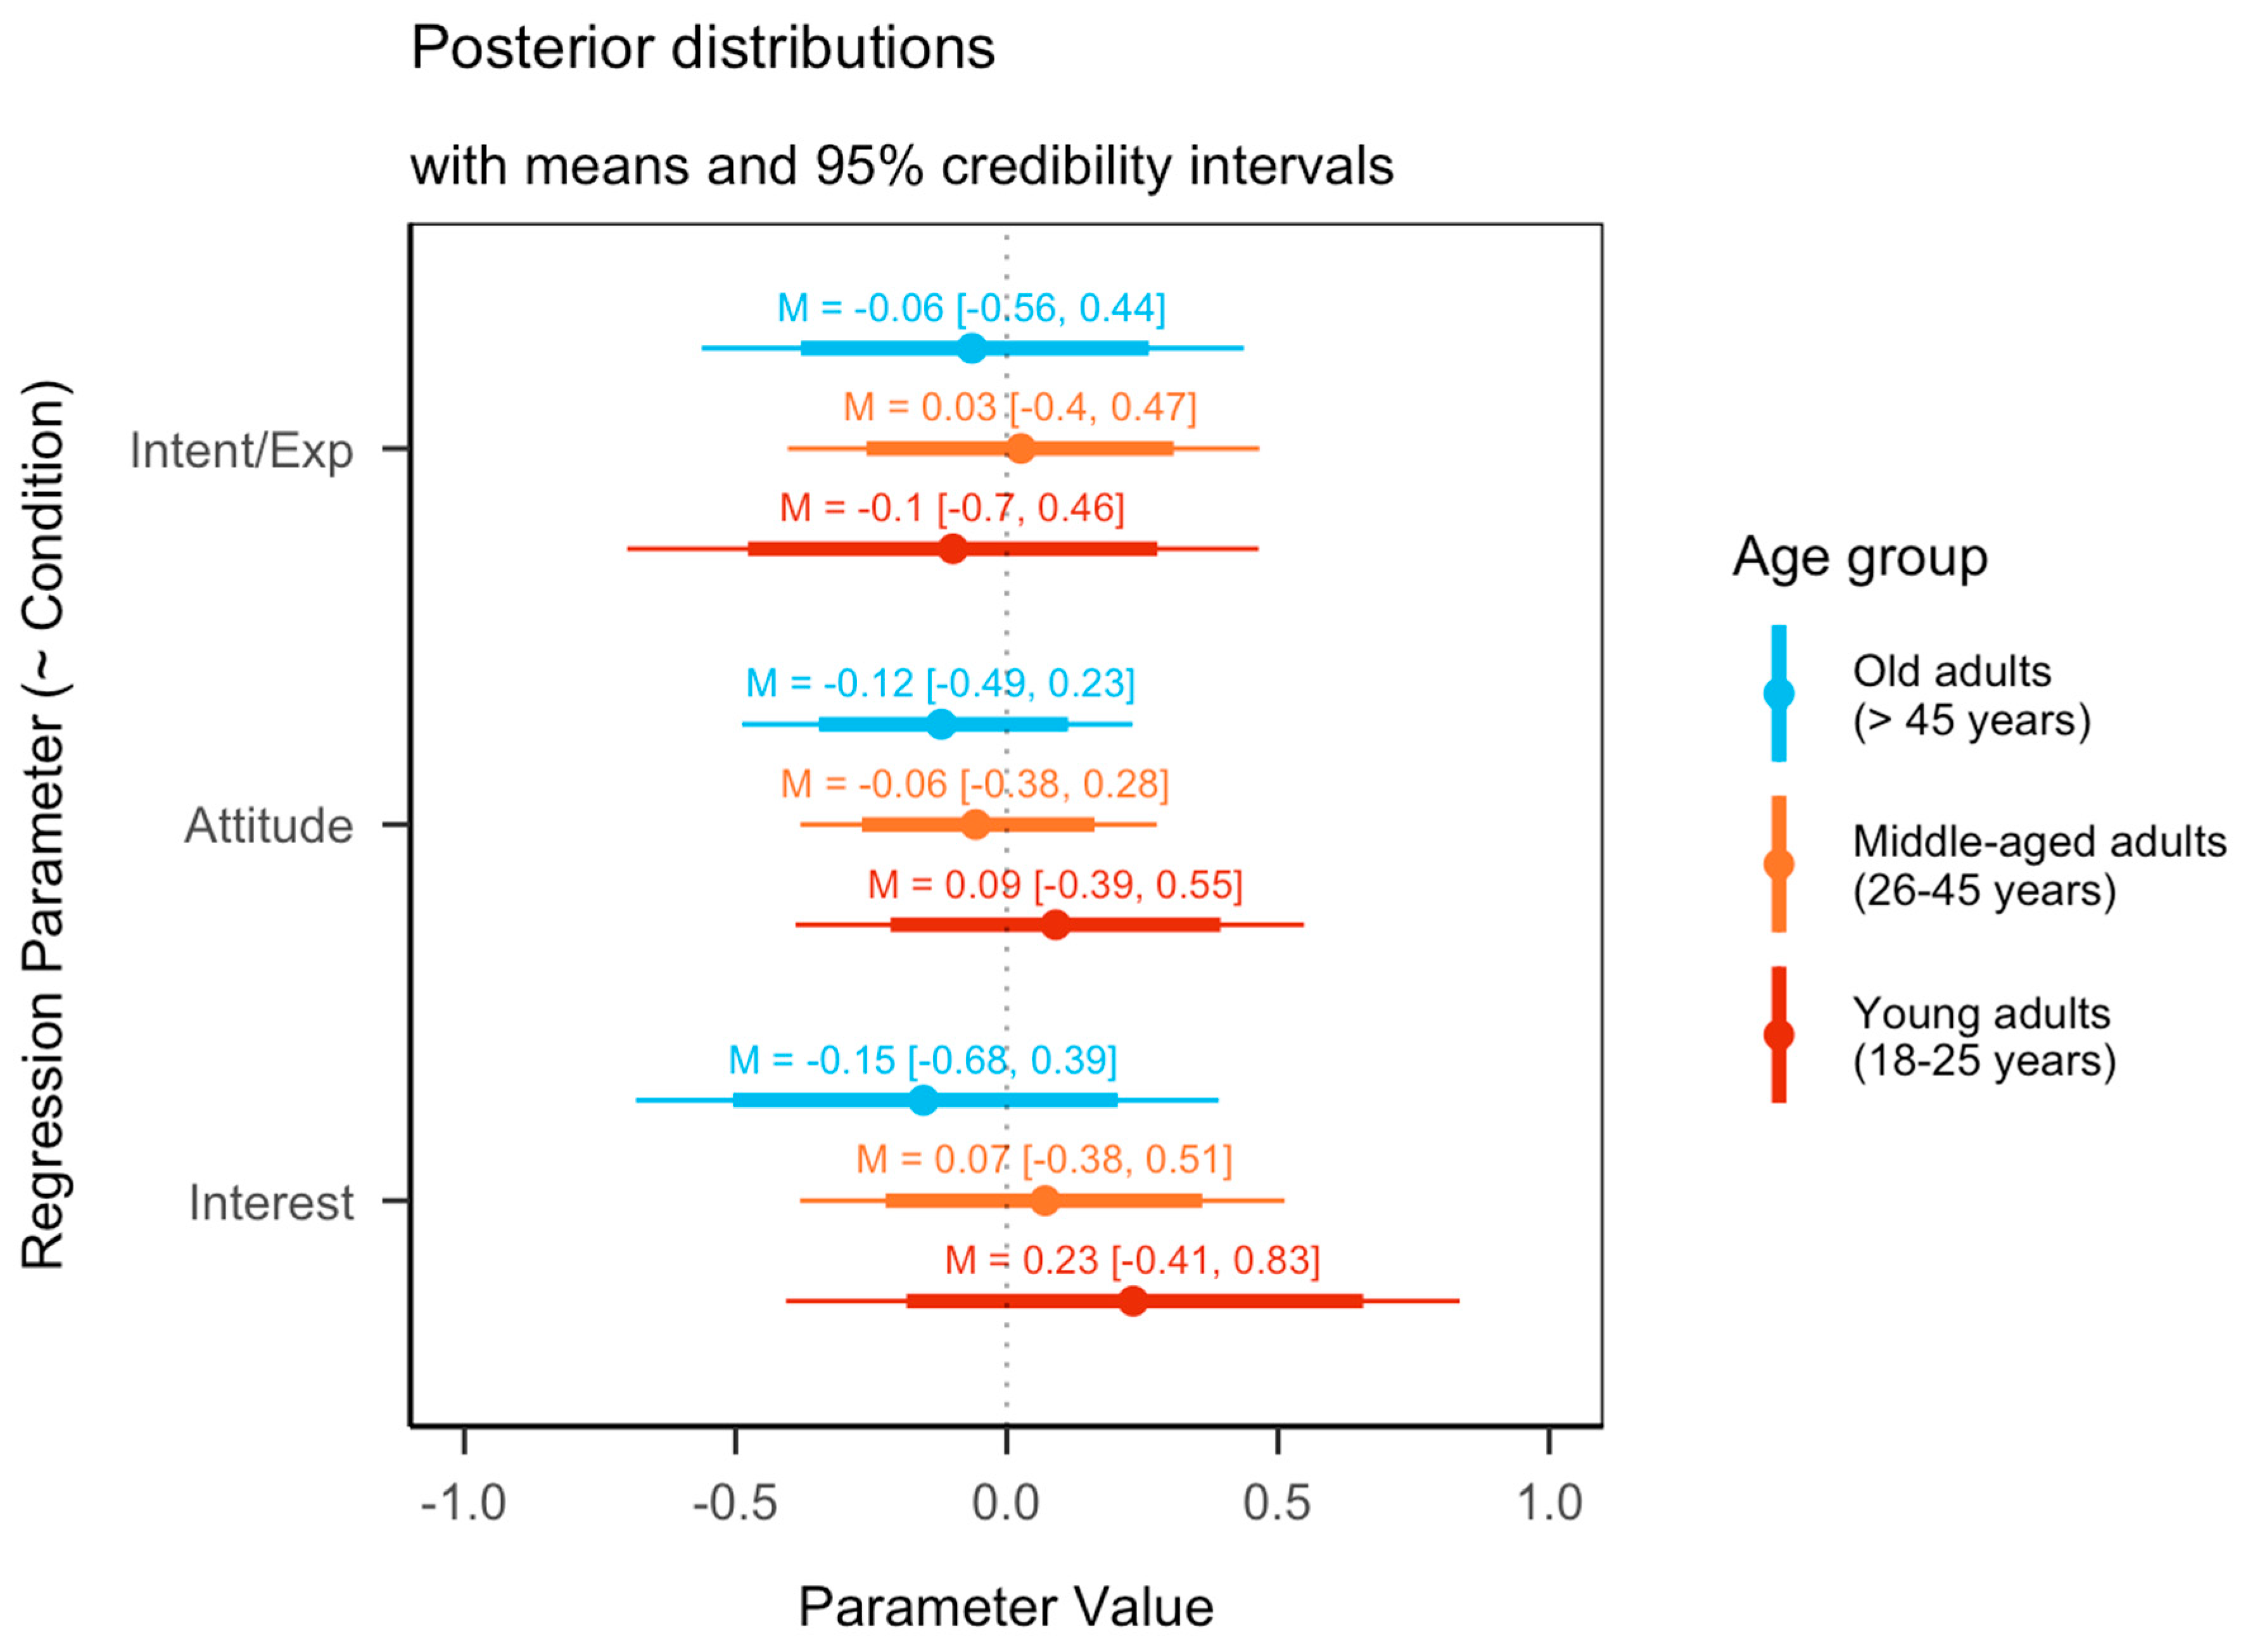
3.7. Research Question 4: Does Age Interact with Norm Condition to Influence Dependent Variables?

We conducted a multi-sample path analysis exploring the differences in relationships between condition and meat consumption outcomes. We explored the differences in estimates based on age groups: (a) young adults (18–25 years), (b) middle-aged adults (26–45 years), and (c) old adults (>45 years). We estimated the path model using non-informative priors in blavaan, followed by two models with increasing degrees of information as a method for detecting how much influence our informative priors had on the posterior results. A visual inspection of each model’s trace plots suggest that sampling chains converged (see Figures S4.6–S4.8).
The 95% PPI suggest that younger adults (aged 18 to 25) had increased interest and positive attitudes towards reducing meat consumption. Figure 2 shows the posterior distributions of the regression parameters in the model with uninformative priors. Thin horizontal lines indicate the 95% PPI for a given parameter, and thick horizontal lines indicate the 80% PPI.
We estimated the relative bias of both informative models (models 2 and 3) compared to the uninformative model (model 1). The informative priors had a large influence on the posterior results of the regression coefficients (model 1 vs. model 2 = −201.56 % to 296.15%; model 1 vs. model 3 = −542.19% to 942.31%). Due to the relative bias in posterior results, we conclude that there is a difference based on prior settings, and that different models result in different conclusions. The model that fits the observed data best was model 1, ppp = 0.486 (see Table S4.2). In summary, although young adults appeared to show more positive attitudes and interest in reducing their meat consumption, the estimates and credibility intervals do not suggest the presence of a difference in the effect of condition based on age groups. Similarly, the conclusions remained the same when we explored the possible moderating effect of age using age as a continuous variable, rather than a categorical one (see Table S4.3).

3.8. Research Question 5: How Do Demographic Factors (Age, Gender, and Political Position) Predict Primary Dependent Variables Relating to Meat Consumption?

We conducted further path analyses incorporating demographic factors such as age, gender, and political position as predictors of meat consumption outcomes. We used uninformed beta priors for all regression parameters predicted by demographic variables. A visual inspection of each model’s trace plots suggest that sampling chains converged (see Figures S4.10–S4.12).
The 95% PPI suggest that gender and political position consistently predict all meat consumption-related outcomes across all models. Specifically, women and left-leaning participants were more likely to report positive outcomes. Figure 3 shows the posterior distributions of the regression parameters in the model with uninformative priors. Thin horizontal lines indicate the 95% PPI for a given parameter, and thick horizontal lines indicate the 80% PPI.
We estimated the relative bias of both informative models (models 2 and 3) compared to the uninformative model (model 1). The informative priors had a large influence on the posterior results of the regression coefficients (model 1 vs. model 2 = −177.78 % to 58.73%; model 1 vs. model 3 = −783.33% to 230.16%). Due to the relative bias in posterior results, we conclude that there is a difference based on prior settings, and that different models result in different conclusions. The model that fits the observed data best was model 1, ppp = 0.501 (see Table S4.4).

3.9. Unregistered Exploratory Analyses

We conducted additional analyses to examine whether demographic variables may moderate the effect of the manipulation used on measured outcomes. We found no evidence for a moderating effect of any demographic variable on interest, attitudes, or intentions (see Tables S5.1–S5.3). To explore whether attitudes may be a mediator of the effect of condition on intentions and expectations to reduce meat consumption, we conducted a path analysis, but we did not find evidence for a partial or total mediation (see Table S5.4).

4. Discussion

This study examined the effect of dynamic norms on various meat consumption-related outcomes. Although previous research found that providing information about dynamic (changing) minority norms increased interest in engaging in minority behaviour, the current study did not find evidence for this effect. There was no difference between any condition or combination of conditions on meat consumption-related outcomes (viz., interest, attitudes, intentions, expectations). There was no evidence for or against the presence of a difference in predicted future meat consumption in the UK. Gender and political orientation were associated with all meat consumption-related outcomes: participants who identified as female, and participants who were politically left-leaning, were more likely to report positive interest, positive attitudes, positive intentions, and positive expectations vis-a-vis reducing their own meat consumption. Additionally, age did not appear to moderate the effect of condition on any of the primary dependent variables.

4.1. Strengths

This study replicated the design of the original research [8] very closely using a UK sample. Randomization checks suggested no differences in any demographic distribution that could have influenced the results. Much social psychological research uses samples of primarily university undergraduates; although true random sampling was not possible, conducting our study online using a relatively diverse sample allows us to increase the generalizability of our findings [28]. We examined additional outcomes of interest, such as attitudes toward reducing meat consumption, intentions to reduce own consumption, and expectations to do so. We also included a ‘no norm’ control to compare the effects of presenting different normative information to presenting none at all. The analyses used Bayesian inferencing, allowing us to discriminate between the null hypothesis and insensitive results. It also made it possible to examine the influence of our Bayesian priors on the results and estimate the bias between results from models with uninformative priors, and models with varied prior distributions. We also conducted a sensitivity analysis for all Bayesian effect sizes and reported robust estimates for all statistical tests conducted.

4.2. Limitations

We did not include a manipulation check to ascertain whether the dynamic norm was salient in that experimental condition, so it is difficult to infer whether we the failure to replicate the effect of dynamic norm information on interest in reducing meat consumption is due to the particular manipulation used or to dynamic norm information, in itself. In addition, there is increasing media coverage and awareness of increasing availability of plant-based foods, as well as a rise in veganism/vegetarianism [43]. The amount of plant-based supermarket ready-meals offered in the UK increased from 3% in 2018 to 16% in 2020, and most retailers expanded their plant-based options [44]. It is possible that participants in the control and static norm conditions were aware of the changing norms without us highlighting it experimentally. Another noteworthy point was the wording of the normative information: it is difficult to discern how participants construed the meat consumption norm in each condition and whether “are making an effort” in the static norm condition was construed differently from “starting to make an effort” in the dynamic norm condition, for example. We also did not include a measure of in-group identification to test whether the study sample actually identified with the UK population (which was used as a reference group). Evidence shows that normative social influence is strengthened when participants identify with the reference group, and ingroup identification may be a potential moderator for the effect of perceived social norms (e.g., [45,46]). Another limitation is that we only used one item to measure interest in reducing meat consumption. Moreover, despite adapting Fishbein and Ajzen’s [25] widely-used items to measure attitudes, intentions, and expectations, we did not conduct independent psychometric assessment to support the appropriateness of treating these measured variables as conceptually distinct. Furthermore, our approach does not take a position on the ontological status of, for example, attitudes (e.g., the extent to which measured attitudes represent a latent construct of some sort or represent an expressive act of communication). We have relied on (the face validity of) popular questionnaire items. We do not have psychometric evidence concerning the conceptual distinctions that we have made. Future studies may benefit from alternative approaches to measuring these constructs. Additionally, we found the three-item scales used to measure attitudes, intentions, and expectations all to be highly correlated, with Cronbach’s alpha values above 0.90. This may be an indication of the redundancy of items used, or a narrow coverage of the constructs [47]. Although we measured intentions as a possible proxy for behaviour, correlations between intentions and behaviours are modest, and people’s past behaviour may be a better predictor of behaviour in certain situations [48]. Including past consumption of meat as a potential moderator of normative social influence, and predictor of intentions to limit meat consumption.

4.3. Summary and Recommendations for Further Research

There could be multiple reasons why we could not replicate the effect of dynamic norm information reported by Sparkman and Walton [8]. Previous research on dynamic norms has been mostly conducted on US-based samples, so it is possible that such interventions are more effective in particular populations. Furthermore, given the rise in availability of meat alternatives and vegetarian options in stores and restaurants, it is possible that participants are already aware of the dynamic nature of meat-eating norms in the UK. Indeed, in our pilot study, 62.94% of participants reported being aware of a decrease in meat consumption in the UK. Moreover, 84.16% of participants in our study estimated that meat consumption would decrease in the next five years. Considering that Sparkman and Walton [8] found that expectations about future meat consumption mediate the effect of dynamic norms on interest in reducing meat consumption, participants may already have been influenced by their perception of a changing norm, regardless of the manipulation. Perhaps in addition to increasing the salience of the dynamic nature of current norms (in one condition), the static feature of the static norm manipulation could likewise be made more explicit, and thereby more salient.
Another challenge lies in manipulating salience of dynamic norms in order to increase their distinctiveness from static norms. Visual cues depicting the dynamic or static aspect of the norms may be used to examine if people respond positively to such information (cf. [49]). Moreover, the phrasing of the normative information could perhaps be improved by removing the ambiguity of whether the reference population is actually succeeding or not in making an effort to limit their meat consumption. A possible reason that the manipulation did not work is that participants did not sufficiently engage with the text. Visual cues may be a promising alternative method of communicating normative information.
It would be beneficial for future research to explore possibilities for manipulation checks, and alternative phrasing of the normative information. It is possible that explicitly stating the prevalence/amount of meat consumption in the past as well as in the present could make the change more salient, thereby inducing different effects. Furthermore, there is potential for changing the format of the normative information to depict an increasing norm. For example, rather than using percentage engagement in desired minority behaviour, using the number of people engaged (cf. [50]) could result in different effects (e.g., 20 million UK people, as opposed to 30% of the UK population). It would also be interesting to assess the effect of potential moderator variables such as personality, identity, in-group identification, and cultural orientation in order to explore how these interact with normative information to affect key outcomes. With few exceptions (e.g., [17]), most published research on dynamic norms uses samples from Western, educated, industrialized, rich and democratic (WEIRD) societies. In fact, a recent systematic review of social psychological research on climate change shows that 109 out of 118 reviewed studies involved samples or data from WEIRD countries [51]. Future research should explore the effects of dynamic norm research in varied contexts to broaden demographic representation. In Wynes et al.’s [52] review of behavioural interventions to reduce greenhouse gas emissions, they found that the majority of studies on diets described measurements of a period of weeks at most. Future research may benefit from longer follow-up periods to measure the persistence of normative influence in the diet change domain.
Future studies may also benefit from examining potential moderators of the effect of dynamic norms on outcomes of interest. Cialdini and Jacobson [4] discuss moderators of normative social influence such as identification with behaviour, conflicting cues in the social environment, and identification with the reference group.
This study explores an under-researched hypothesis in a domain of vital importance. Reducing meat consumption has positive effects on the environment, animal welfare, and health. It is also considered one of the most impactful actions we can take in our day-to day-lives to curb carbon emissions [3]. This replication study attempted to corroborate the effects of dynamic norms on interest in reducing meat consumption using a Bayesian framework, allowing for a more informed evaluation of replications than the use of p-values [53]. Finally, this study demonstrated the need to explore alternative empirical formulations of dynamic norm information in order to help us understand the conditions under which norm-based interventions may or may not be successful.

Supplementary Materials

The following are available online at https://osf.io/nhe6s/ (accessed on 26 July 2021). S5.1: Power analysis using standardized effect sizes, Table S2.4: Contrasts between conditions in expectations about future meat consumption, Table S2.5: Contrasts between conditions in preconformity, Table S4.1: Posterior results of simple path model, Table S4.2 Posterior results of multi-sample analysis of simple path model by age groups, Table S4.3: Posterior results of interaction model using age as continuous variable, Table S4.4: Posterior results of full path model, Table S5.1: Exploring moderation of demographic variables on attitude, Table S5.2: Exploring moderation of demographic variables on intentions/expectations, Table S5.3: Exploring moderation of demographic variables on interest, Table S5.4: Exploring mediating effect of attitude on intentions/expectations, Figure S4.1: Traceplots of parameters estimated in the simple path model (uninformative priors), Figure S4.2: Traceplots of parameters estimated in the simple path model (weak priors), Figure S4.3: Traceplots of parameters estimated in the simple path model (moderate priors), Figure S4.6: Traceplots of parameters estimated in the multi-sample analysis (uninformative priors), Figure S4.7: Traceplots of parameters estimated in the multi-sample analysis (weak priors), Figure S4.8: Traceplots of parameters estimated in the multi-sample analysis (moderate priors), Figure S4.10: Traceplots of parameters estimated in the full path model (uninformative priors), Figure S4.11: Traceplots of parameters estimated in the full path model (weak priors), Figure S4.12: Traceplots of parameters estimated in the full path model (moderate priors).

Author Contributions

Conceptualization, A.A., P.S. and P.R.H.; methodology, A.A., P.S. and P.R.H.; formal analysis, A.A.; data curation, A.A.; writing—original draft preparation, A.A.; writing—review and editing, A.A., P.S. and P.R.H.; visualization, A.A.; supervision, P.S. and P.R.H. All authors have read and agreed to the published version of the manuscript.

Funding

This research received no external funding.

Institutional Review Board Statement

The study was conducted according to the guidelines of the Declaration of Helsinki, and approved by the University of Sussex ethics committee, Protocol ER/AA2049/10 with the most recent modification approved 22 March 2021.

Informed Consent Statement

Informed consent was obtained from all subjects involved in the study, and they remain anonymous.

Data Availability Statement

Anonymized data, analysis code, materials, questionnaires, and associated pre-registrations are publicly available at the Open Science Framework (OSF; https://osf.io/6bdfz/, accessed on 15 July 2021).

Acknowledgments

We would like to thank the reviewers and the review editor for their thoughtful reflections on our work, and their valuable suggestions for improvement.

Conflicts of Interest

The authors declare no conflict of interest.

Disclosure

All measures, conditions, data exclusions, and sampling considerations are reported in this manuscript. For full details, please check the preregistration (https://osf.io/mvtsf/, accessed on 15 July 2021).

References

  1. Gerber, P.; Steinfeld, H.; Henderson, B.; Mottet, A.; Opio, C.; Dijkman, J.; Falcucci, A.; Tempio, G. Tackling Climate Change through Livestock: A Global Assessment of Emissions and Mitigation Opportunities; Food and Agriculture Organization of the United Nations (FAO): Rome, Italy, 2013. [Google Scholar]
  2. Stehfest, E.; Bouwman, L.; van Vuuren, D.P.; den Elzen, M.G.J.; Eickhout, B.; Kabat, P. Climate benefits of changing diet. Clim. Chang. 2009, 95, 83–102. [Google Scholar] [CrossRef]
  3. Wynes, S.; Nicholas, K.A. The climate mitigation gap: Education and government recommendations miss the most effective individual actions. Environ. Res. Lett. 2017, 12, 1–9. [Google Scholar] [CrossRef] [Green Version]
  4. Cialdini, R.B.; Jacobson, R.P. Influences of social norms on climate change-related behaviors. Curr. Opin. Behav. Sci. 2021, 42, 1–8. [Google Scholar] [CrossRef]
  5. Cialdini, R.B.; Reno, R.R.; Kallgren, C.A. A Focus Theory of Normative Conduct: Recycling the Concept of Norms to Reduce Littering in Public Places. J. Personal. Soc. Psychol. 1990, 58, 1015–1026. [Google Scholar] [CrossRef]
  6. Mortensen, C.R.; Neel, R.; Cialdini, R.B.; Jaeger, C.M.; Jacobson, R.P.; Ringel, M.M. Trending Norms: A Lever for Encouraging Behaviors Performed by the Minority. Soc. Psychol. Personal. Sci. 2019, 10, 201–210. [Google Scholar] [CrossRef]
  7. Sparkman, G.; Weitz, E.; Robinson, T.N.; Malhotra, N.; Walton, G.M. Developing a Scalable Dynamic Norm Menu-Based Intervention to Reduce Meat Consumption. Sustainability 2020, 12, 2453. [Google Scholar] [CrossRef] [Green Version]
  8. Sparkman, G.; Walton, G.M. Dynamic Norms Promote Sustainable Behavior, even if It Is Counternormative. Psychol. Sci. 2017, 28, 1663–1674. [Google Scholar] [CrossRef]
  9. Tankard, M.E.; Paluck, E.L. Consequences of an Institutional Decision for Perceived Norms in Support of Gay Marriage; Department of Psychology, Princeton University: Princeton, NJ, USA, 20 October 2015. [Google Scholar]
  10. Sparkman, G.; Howe, L.; Walton, G. How social norms are often a barrier to addressing climate change but can be part of the solution. Behav. Public Policy 2020, 1–28. [Google Scholar] [CrossRef]
  11. Allcott, H. Social norms and energy conservation. J. Public Econ. 2011, 95, 1082–1095. [Google Scholar] [CrossRef] [Green Version]
  12. Goldstein, N.J.; Cialdini, R.B.; Griskevicius, V. A Room with a Viewpoint: Using Social Norms to Motivate Environmental Conservation in Hotels. J. Consum. Res. 2008, 35, 472–482. [Google Scholar] [CrossRef] [Green Version]
  13. Hallsworth, M.; Snijders, V.; Burd, H.; Prestt, J.; Judah, G.; Huf, S.; Halpern, D. Applying Behavioral Insights: Simple Ways to Improve Health Outcomes; World Innovation Summit for Health: Doha, Qatar, 2016; p. 48. [Google Scholar]
  14. Demarque, C.; Charalambides, L.; Hilton, D.J.; Waroquier, L. Nudging sustainable consumption: The use of descriptive norms to promote a minority behavior in a realistic online shopping environment. J. Environ. Psychol. 2015, 43, 166–174. [Google Scholar] [CrossRef]
  15. Loschelder, D.D.; Siepelmeyer, H.; Fischer, D.; Rubel, J.A. Dynamic norms drive sustainable consumption: Norm-based nudging helps café customers to avoid disposable to-go-cups. J. Econ. Psychol. 2019, 75, 102146. [Google Scholar] [CrossRef]
  16. Sparkman, G.; Walton, G.M. Witnessing change: Dynamic norms help resolve diverse barriers to personal change. J. Exp. Soc. Psychol. 2019, 82, 238–252. [Google Scholar] [CrossRef]
  17. Cheng, L.; Hao, M.; Xiao, L.; Wang, F. Join us: Dynamic norms encourage women to pursue STEM. Curr. Psychol. 2020. [Google Scholar] [CrossRef]
  18. Meleady, R. Nudging intergroup contact: Normative social influences on intergroup contact engagement. Group Process. Intergroup Relat. 2021, in press. Available online: https://ueaeprints.uea.ac.uk/id/eprint/79811/1/ACCEPTED_MANUSCRIPT.pdf (accessed on 15 July 2021). [CrossRef]
  19. Chalasani, S.; Johnson, C.; Morabito, M.; Newkirk, A.; Wang, L.; Hoffman, I.; Payne, C. Messaging for Impact: Behavioral Science-Based Communication Strategies to Advance Energy Efficiency. 2020. Available online: https://escholarship.org/uc/item/0751t4c2 (accessed on 15 July 2021).
  20. Ek, C.; Söderberg, M. Norm-Based Feedback on Household Waste: Large-Scale Field Experiments in Two Swedish Municipalities; Working Paper No. 804; 2021; Available online: https://gupea.ub.gu.se/handle/2077/68470 (accessed on 21 July 2021).
  21. Thaler, R.H.; Sunstein, C.R. Nudge: Improving Decisions about Health, Wealth, and Happiness; Penguin Books: New York NY, USA, 2009. [Google Scholar]
  22. Nolan, J.M.; Schultz, P.W.; Cialdini, R.B.; Goldstein, N.J.; Griskevicius, V. Normative social influence is underdetected. Personal. Soc. Psychol. Bull. 2008, 34, 913–923. [Google Scholar] [CrossRef]
  23. Pronin, E.; Berger, J.; Molouki, S. Alone in a crowd of sheep: Asymmetric perceptions of conformity and their roots in an introspection illusion. J. Personal. Soc. Psychol. 2007, 92, 585–595. [Google Scholar] [CrossRef] [Green Version]
  24. Ajzen, I.; Fishbein, M. Understanding Attitudes and Predicting Social Behavior; Prentice-Hall Inc.: Englewood Cliffs, NJ, USA, 1980. [Google Scholar]
  25. Fishbein, M.; Ajzen, I. Predicting and changing behavior: The reasoned action approach. In Predicting and Changing Behavior: The Reasoned Action Approach; Psychology Press: New York, NY, USA, 2010. [Google Scholar] [CrossRef]
  26. Warshaw, P.R.; Davis, F.D. Disentangling behavioral intention and behavioral expectation. J. Exp. Soc. Psychol. 1985, 21, 213–228. [Google Scholar] [CrossRef]
  27. Ajzen, I. The theory of planned behavior. Organ. Behav. Hum. Decis. Process. 1991, 50, 179–211. [Google Scholar] [CrossRef]
  28. Yeager, D.S.; Krosnick, J.A.; Visser, P.S.; Holbrook, A.L.; Tahk, A.M. Moderation of classic social psychological effects by demographics in the U.S. adult population: New opportunities for theoretical advancement. J. Personal. Soc. Psychol. 2019, 117, e84–e99. [Google Scholar] [CrossRef] [PubMed] [Green Version]
  29. Knight, R. Cutting Down on Meat Saved British People More Than £2.8bn Last Year, Survey Claims. The Independent. 11 June 2019. Available online: https://www.independent.co.uk/news/uk/home-news/vegetarian-food-cost-savings-benefit-health-environment-vegan-meat-eating-a8722771.html (accessed on 15 July 2021).
  30. Lee, L.; Simpson, I. Are We Eating Less Meat? A British Social Attitudes Report; NatCen Social Research: London, UK, 2016; pp. 1–31. Available online: https://www.bl.uk/collection-items/are-we-eating-less-meat-a-british-social-attitudes-report (accessed on 15 July 2021).
  31. Waitrose & Partners. Food and Drink Report 2018–2019; 2018; pp. 1–12. Available online: https://www.waitrose.com/content/dam/waitrose/Inspiration/Waitrose%20&%20Partners%20Food%20and%20Drink%20Report%202018.pdf (accessed on 21 July 2021).
  32. Schönbrodt, F.D.; Wagenmakers, E.-J.; Zehetleitner, M.; Perugini, M. Sequential hypothesis testing with Bayes factors: Efficiently testing mean differences. Psychol. Methods 2017, 22, 322–339. [Google Scholar] [CrossRef] [Green Version]
  33. Ioannidis, J.P.A. Why Most Published Research Findings Are False. PLoS Med. 2005, 2, 6. [Google Scholar] [CrossRef] [PubMed] [Green Version]
  34. Dienes, Z. How do I know what my theory predicts? Adv. Methods Pract. Psychol. Sci. 2019, 27. [Google Scholar] [CrossRef]
  35. Dienes, Z. Using Bayes to get the most out of non-significant results. Front. Psychol. 2014, 5. [Google Scholar] [CrossRef] [PubMed] [Green Version]
  36. De Bruine, L.; Dienes, Z. Bayes Factors and Robustness Regions. 2020. Available online: https://debruine.github.io/bfrr/ (accessed on 15 July 2021).
  37. Wagenmakers, E.-J.; Marsman, M.; Jamil, T.; Ly, A.; Verhagen, J.; Love, J.; Selker, R.; Gronau, Q.F.; Šmíra, M.; Epskamp, S.; et al. Bayesian inference for psychology. Part I: Theoretical advantages and practical ramifications. Psychon. Bull. Rev. 2018, 25, 35–57. [Google Scholar] [CrossRef]
  38. van de Schoot, R.; Depaoli, S. Bayesian analyses: Where to start and what to report. Eur. Health Psychol. 2014, 16, 75–84. [Google Scholar]
  39. Merkle, E.C.; Fitzsimmons, E.; Uanhoro, J.; Goodrich, B. Efficient Bayesian Structural Equation Modeling in Stan. arXiv 2020, arXiv:2008.07733. Available online: http://arxiv.org/abs/2008.07733 (accessed on 15 July 2021).
  40. Lüdtke, O.; Ulitzsch, E.; Robitzsch, A. A Comparison of Penalized Maximum Likelihood Estimation and Markov Chain Monte Carlo Techniques for Estimating Confirmatory Factor Analysis Models with Small Sample Sizes [Preprint]. PsyArXiv 2020. [Google Scholar] [CrossRef]
  41. van de Schoot, R.; Kaplan, D.; Denissen, J.; Asendorpf, J.B.; Neyer, F.J.; van Aken, M.A.G. A Gentle Introduction to Bayesian Analysis: Applications to Developmental Research. Child Dev. 2014, 85, 842–860. [Google Scholar] [CrossRef] [PubMed]
  42. Depaoli, S.; van de Schoot, R. Improving transparency and replication in Bayesian statistics: The WAMBS-Checklist. Psychol. Methods 2017, 22, 240–261. [Google Scholar] [CrossRef] [PubMed]
  43. Interest in veganism is surging. The Economist. 29 January 2020. Available online: https://www.economist.com/graphic-detail/2020/01/29/interest-in-veganism-is-surging (accessed on 15 July 2021).
  44. Eating Better. Ready Meals 2020 Snapshot Survey. 2020. Available online: https://www.eating-better.org/uploads/Documents/2019/ready-meal-survey-final.pdf (accessed on 15 July 2021).
  45. Reed, M.B.; Lange, J.E.; Ketchie, J.M.; Clapp, J.D. The relationship between social identity, normative information, and college student drinking. Soc. Influ. 2007, 2, 269–294. [Google Scholar] [CrossRef]
  46. Rinker, D.V.; Neighbors, C. Do different types of social identity moderate the association between perceived descriptive norms and drinking among college students? Addict. Behav. 2014, 39, 1297–1303. [Google Scholar] [CrossRef] [Green Version]
  47. Panayides, P. Coefficient Alpha: Interpret with Caution. Eur. J. Psychol. 2013, 9, 687–696. [Google Scholar] [CrossRef]
  48. Gollwitzer, P.M. Implementation Intentions. Am. Psychol. 1999, 54, 493–503. [Google Scholar] [CrossRef]
  49. Slovic, P.; Peters, E. Risk Perception and Affect. Curr. Dir. Psychol. Sci. 2006, 15, 322–325. [Google Scholar] [CrossRef]
  50. Gigerenzer, G. Reckoning with Risk: Learning to Live with Uncertainty; Penguin: London, UK, 2002. [Google Scholar]
  51. Tam, K.-P.; Leung, A.K.-Y.; Clayton, S. Research on climate change in social psychology publications: A systematic review. Asian J. Soc. Psychol. 2021. [Google Scholar] [CrossRef]
  52. Wynes, S.; Nicholas, K.A.; Zhao, J.; Donner, S.D. Measuring what works: Quantifying greenhouse gas emission reductions of behavioural interventions to reduce driving, meat consumption, and household energy use. Environ. Res. Lett. 2018, 13, 113002. [Google Scholar] [CrossRef]
  53. Dienes, Z. How Bayes factors change scientific practice. J. Math. Psychol. 2016, 72, 78–89. [Google Scholar] [CrossRef]
Figure 1. Simple path model. Note. The x-axis shows estimated regression parameters predicted by condition (dynamic vs. static norm). The point estimates indicate the mean of each posterior probability distribution. The 95% PPI are indicated by the thin horizontal lines. Thick lines indicate the 80% PPI.
Sustainability 13 08315 g001
Figure 2. Multi-sample of simple path model estimated using uninformative regression priors. Note. Beta prior = normal (0,10), model fit (ppp value) = 0.486. Posterior probability distributions of meat consumption outcomes predicted by condition and measured demographic variables are shown. The point estimates indicate the mean of each posterior probability distribution. The 95% PPI are indicated by the thin horizontal lines. Thick lines indicate the 80% PPI.
Sustainability 13 08315 g002
Figure 3. Full path model estimated using uninformative regression priors. Note. Beta prior = normal (0,10), model fit (ppp value) = 0.501. Posterior probability distributions of meat consumption outcomes predicted by condition and measured demographic variables are shown. The point estimates indicate the mean of each posterior probability distribution. The 95% PPI are indicated by the thin horizontal lines. Thick lines indicate the 80% PPI.
Sustainability 13 08315 g003
Table 1. Pilot study results.
GroupnPerceived % of People Making Effort
M ± SD
% Expecting Decrease% Aware of Decrease
A9829.54% ± 14.43%76.53%61.22%
B9929.39% ± 18.20%74.75%64.65%
TotalN = 19729.47% ± 16.39%75.64%62.94%
Table 2. Means and Standard Deviations for Demographic Variables by Condition Including Statistical Tests for the Randomization Check.
ItemDynamic NormStatic NormNo TaskSignificance Test
Age (years)37.34 ± 14.2237.90 ± 12.9736.40 ± 13.55F(2, 843) = 0.89, MSE = 184.49, p = 0.409
Gender (%)Female (60.14%)Female (58.1%)Female (51.05%)χ2(4, N = 846) = 6.92, p = 0.140
Political position3.47 ± 1.223.54 ± 1.263.45 ± 1.26F(2, 843) = 0.39, MSE = 1.55, p = 0.679
Nationality (%)England (84.06%)England (80.99%)England (80.77%)χ2(6, N = 846) = 3.23, p = 0.779
Scotland (3.62%)Scotland (5.28%)Scotland (5.94%)
Wales (9.78%)Wales (8.45%)Wales (8.74%)
Northern Ireland (0.72%)
Other (1.81%)
Northern Ireland (1.41%)
Other (3.87%)
Northern Ireland (1.75%)
Other (2.8%)
Table 3. Means, Standard Deviations, Reliabilities, and Inter-Correlations Among Study Measures.
MeasureαMSDCorrelations
123456
1. Interest-3.581.82
2. Attitude0.904.641.290.80 **
3. Intention0.984.221.800.83 **0.82 **
4. Expectation0.993.931.750.80 **0.80 **0.92 **
5. Intention/expectation composite-4.081.740.83 **0.83 **0.98 **0.98 **
6. Perception of change-5.140.900.27 **0.26 **0.27 **0.25 **0.27 **
7. Preconformity-4.181.200.44 **0.40 **0.39 **0.37 **0.39 **0.37 **
Note. α = Cronbach’s alpha. N = 846. ** p < 0.01. Measure of future norm was reverse coded in order to be positively scaled.
Publisher’s Note: MDPI stays neutral with regard to jurisdictional claims in published maps and institutional affiliations.

