Article

Indoor Air Quality and Human Health Risk Assessment in the Open-Air Classroom

by
Jenjira Kaewrat
1,2,
Rungruang Janta
1,2,*,
Surasak Sichum
2,* and
Thongchai Kanabkaew
3
1
School of Languages and General Education, Walailak University, Nakhon Si Thammarat 80160, Thailand
2
Center of Excellence in Sustainable Disaster Management, Walailak University, Nakhon Si Thammarat 80160, Thailand
3
Faculty of Public Health, Thammasat University, Pathum Thani 10120, Thailand
*
Authors to whom correspondence should be addressed.
Sustainability 2021, 13(15), 8302; https://doi.org/10.3390/su13158302
Submission received: 28 June 2021 / Revised: 22 July 2021 / Accepted: 23 July 2021 / Published: 25 July 2021

Abstract

:
Indoor air quality is associated with academic performance and harmful health effects on students and teachers who participate in the classroom. Outdoor sources always contribute to classroom air quality. This study aims to estimate the amounts of indoor and outdoor pollutants and the influence of outdoor sources on open-air classrooms in a school located in the city. A health risk assessment was applied to assess the non-carcinogenic risk to students and teachers from exposure to the pollutants in the classroom. The concentrations of indoor NO2 ranged between 46.40 and 77.83 µg/m3, which is about 0.8 times that of outdoor NO2. A strong correlation and a high indoor/outdoor (I/O) ratio (>0.5) without a source, indicated that indoor NO2 is significantly influenced by outdoor sources. The range of indoor PM2.5 concentrations was 1.66 to 31.52 µg/m3 which was influenced by meteorological conditions. The indoor PM2.5 concentrations were affected by both indoor and outdoor sources. Although the level of indoor air pollutants met the official standard, the young children were exposed to indoor air pollutants which were above the recommended limits to human health with regard to the hazard index (HI) of 1.12. Instant measures such as regularly cleaning the classrooms, zoning the students, and installation of solid and vegetation barriers are recommended to reduce the daily dose of pollutants affecting students in open-air classrooms.

1. Introduction

Indoor air quality is the quality of air within and around buildings including homes, schools, and offices. It greatly influences human wellbeing because people spend most of their time indoors. The World Health Organization (WHO) reported that 3.8 million people die annually from exposure to indoor air pollution. Health effects including irritation, respiratory diseases, heart disease, and cancer are associated with indoor air quality [1,2]. Newborn and young children are also more susceptible to air pollution because of their immature immune systems and rapid breathing [3]. Children who have been exposed to high levels of air pollution suffer from an increase in respiratory diseases. Moreover, air pollution inhibits cognitive development in childhood [4]. It is therefore important to provide children with a clean environment to promote good health and learning ability in childhood. Air quality in schools should also be controlled because children spend over 8 h per day in school.
Nitrogen oxides (NOx), sulfur dioxide (SO2), ozone (O3), carbon monoxide (CO), volatile organic compounds (VOCs), particulate matter (PM), radon, and microorganisms are known to be common indoor air pollutants. Some pollutants are usually found as a result of both indoor and outdoor conditions. Many studies indicate that the level of indoor air pollutants is related to human activities. However, outdoor air pollutants also play an important role in indoor air quality [5,6,7]. Particularly, PM and NOx which are the two main pollutants are mainly caused by the combustion engines of vehicles found in urban and urban fringe areas [8]. High concentrations of PM and NOx in rooms without air pollutant sources such as classrooms have been related mainly to outdoor sources [5,9].
Pallar’es et al. [10] indicated that building characteristics such as ventilation, orientation, morphology of the streets, cleaning, open–close windows, etc. are more important for indoor air quality than environmental area such as urban, industrial, and rural areas. Air ventilation is referred to outdoor air moves into and spreads through rooms playing a crucial role in indoor air quality. It can dilute the pollutants originating in the room and remove the pollutants outdoors. However, outdoor air can also bring pollutants from outside and increase indoor concentrations. Natural, mechanical, and hybrid (mixed-mode) ventilation are well known as basic types of air ventilation [11]. Natural ventilation is the most economically and environmentally friendly because it requires only natural force and large openings. However, natural ventilation is difficult to control and requires a proper design. Mechanical ventilation using fans can control the flow rate and can be integrated with air conditioning to control air temperature and humidity. A filter system can be installed in this ventilation in order to improve indoor air quality from outside sources. Hybrid ventilation is the mixing of natural and mechanical ventilation systems. The study of Chen et al. [12] suggested that natural ventilation can reduce indoor air pollutants generated by outdoor sources ranging from 5 to 20% but that it varies among cities depending on climate conditions and pollutant concentrations. Closed windows with air conditioning can reduce air exchange rates by about 50% because they reduce the infiltration of ambient air pollutants in the indoor environment. Moreover, the use of a filter can reduce the indoor/outdoor (I/O) ratio of PM2.5 to 0.3–0.8 depending on the thickness of the filter [13]. Therefore, the use of ventilation controlled by air conditioning, for example, is widely applied to reduce adverse health effects on students from exposure to indoor air pollution in developing countries. However, this system is inappropriate for low-income communities because of installation and operation costs. Thus, the open-air classroom with ceiling fans is the normal style of classrooms in developing countries, particularly in a tropical zone.
While an open-air classroom with a ceiling fan is useful for air circulation, ambient air containing outdoor pollutants can also move through the room. There are still a limited number of studies on indoor air quality and the assessment of adverse health impacts for this type of classroom. Thus, this study aims to measure the concentrations of indoor and outdoor pollutants, and to estimate the influence of outdoor pollutants on the air quality in an open-air classroom with a ceiling fan. The human health risk from exposure to indoor air pollutants was then estimated according to the age of the students in order to provide guidelines on how to reduce health risks to students and teachers who use such a classroom. The findings from this study should be useful for school directors and the relevant agencies to apply appropriate measures to control exposure to indoor air pollutants in order to reduce the effects on human health, particularly for young children.

2. Materials and Methods

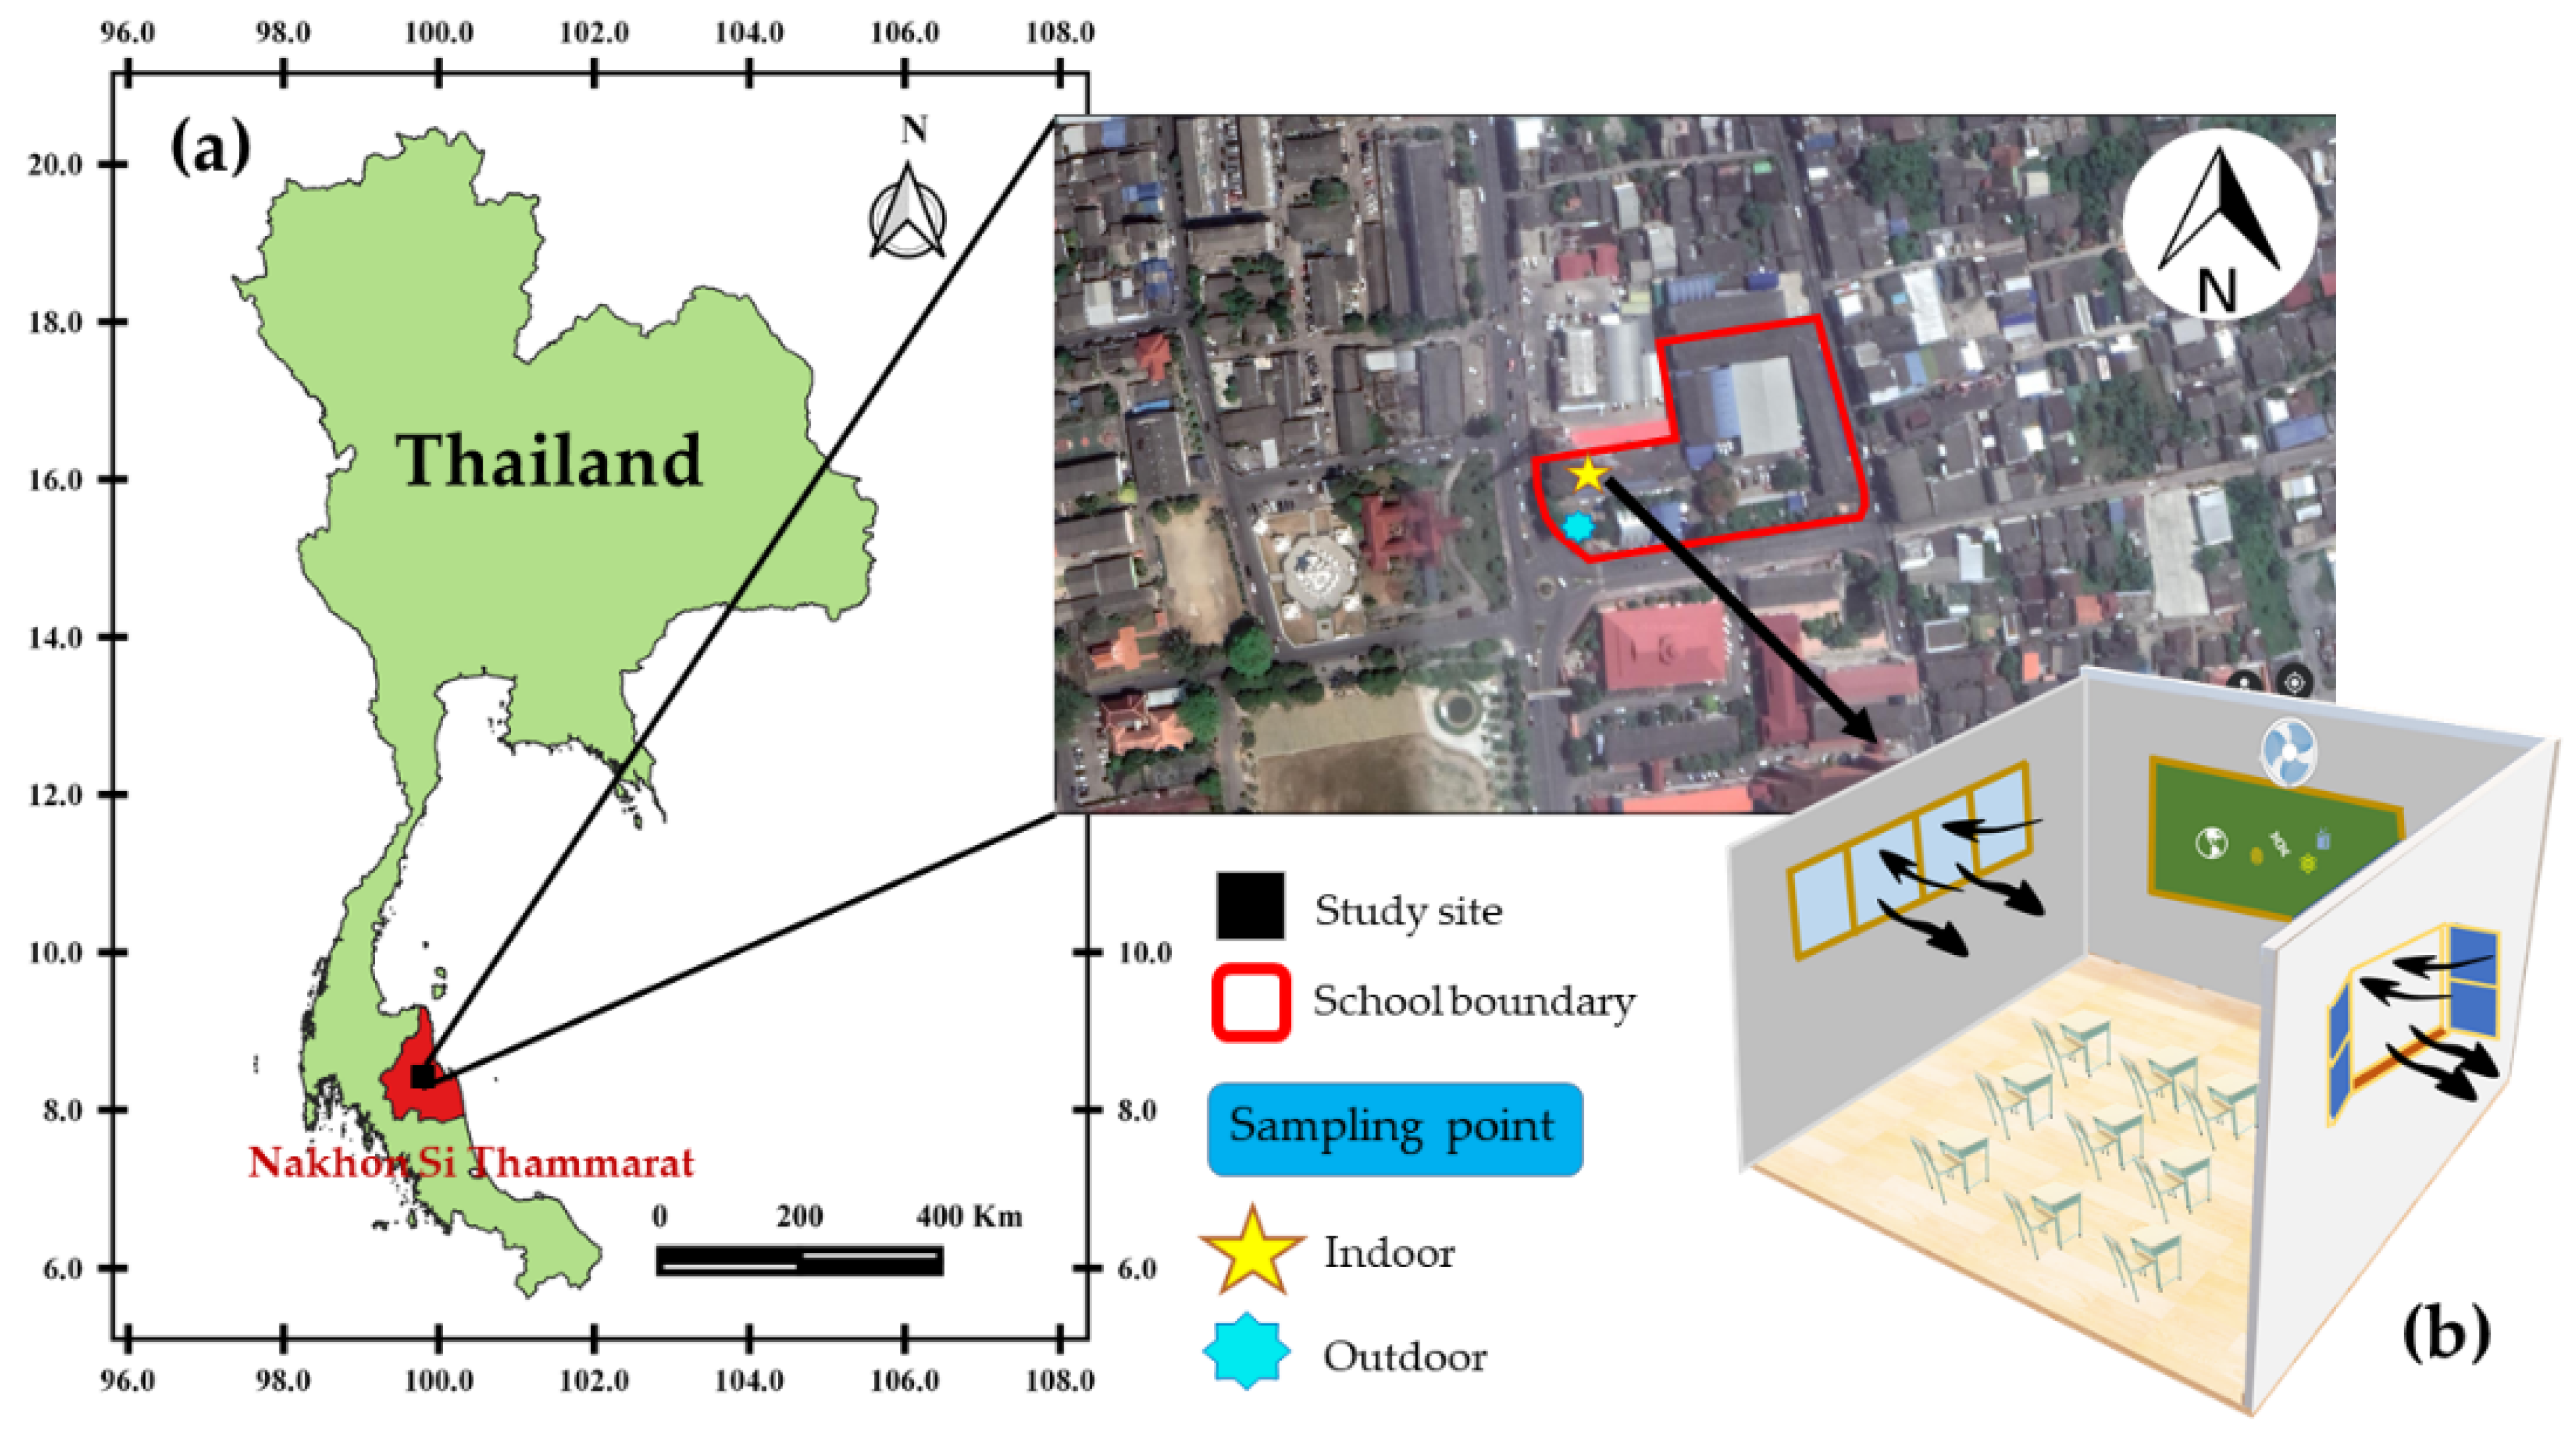
2.1. Location of Study

This study was conducted at a primary school in Nakhon Si Thammarat (8.431° N, 99.963° E). The school is located in the city center of Nakhon Si Thammarat Province, Thailand, which is near an intersection of main roads with a day-time traffic volume of around 10,000 to 16,000 vehicles per day (Figure 1a). The primary school is close to high schools and government offices. Traffic congestion is usually found in this area, especially in the mornings and evenings. This area has a low influence from the street canyon because of the wide space between buildings. The street canyon is more influenced by a single road of infinite length delimited by high buildings on both sides of the road (tall buildings and narrow street) and low frequency of short-time variations of wind velocity [14]. High pollution levels have been often observed in urban street canyons, which is caused by a high building height-to-street-width aspect ratio, due to a lack of natural ventilation.
The sampling was conducted at a playground and classrooms at a distance of 100 and 200 m from the side of the road, respectively. The outdoor sampling point is an open area which is directly exposed to traffic area in the south and west directions. The indoor sampling point is located in a classroom inside the building at a distance of 100 m from the outdoor point to the north. In the classroom, the door is located in the south while the windows are installed in both the south and north (Figure 1b). Ceiling fans were installed inside all the classrooms in order to decrease room temperature and increase air ventilation. The doors and windows are usually open for the whole day while the air freely flows through the classroom. Traditionally, shoes are not allowed to be worn inside the classrooms. Moreover, white boards are used in the classrooms in order to prevent the dust from chalk.

2.2. Meteorological Conditions

Nakhon Si Thammarat has a prevailing tropical rainforest climate. The climate is affected by both the northeast monsoon winds (mid-May to October) and the southwest monsoon wind (November to January) causing a rainy season in this area. Whereas the transitional period from the northeast to southwest monsoons (February to mid-May) is the summer season. Additionally, the Gulf of Thailand is located in the east of this province, it is approximately 10 Km from the study area. The climate of this province is also impacted by a land–sea breeze in the west–east direction, particularly in morning and evening.
The air samples were conducted in both rainy and summer seasons. The meteorological conditions during study periods were obtained from Nakhon Si Thammarat meteorological station, which is about 10 Km from the study area. In the rainy season, the temperature ranged between 21 and 30 °C. The relative humidity was approximately 90%. Average wind speed was 4 Km/hour from northeast and east directions. In the summer season, the temperature ranged between 22 and 35 °C. The relative humidity was approximately 70%. Average wind speed was 5 Km/hour from the east.

2.3. Sampling of Air Pollutants

Air pollutants including nitrogen dioxide (NO2) and PM were measured inside the classroom (indoor) and playground (outdoor) which were about 200 and 100 m from the main road, respectively. Details of the sampling are shown in Table 1 below.

2.3.1. NO2 Sampling

NO2 was collected by a passive sampler on working days (3 days per week) for 6 weeks during the rainy and dry seasons in 2019–2020 (see Table 1). The sampler was developed by the Environmental Chemistry Research Laboratory (ECRL), Chiang Mai University, Thailand. Details on the device preparation are provided in Bootdee et al. [15]. In brief, a set of the passive sampler consists of 3 blank tubes and 5 sample tubes. NO2 was trapped by triethanolamine (TEA) which was coated on the filter paper and placed at the bottom of the passive tubes. The passive tubes are always covered and sealed with parafilm before use. In the sampling area, the covers were removed from the sample tubes, but not from the empty tubes. The set of passive samplers was placed in a shelter to avoid interference from meteorological conditions. It was then hung at 1.5–2 m above ground level for 24 h. After that the samplers were covered and sealed for further analysis in the laboratory.
After sampling, a total of 96 samplers were extracted by using 2 mL of deionized water (DI water). Then 1 mL of the extracted solution was transferred and mixed with 2 mL of Saltzman reagent. The transparent solution changed to a purple color as a result of purple azodye forming. The absorbance of the purple solution was measured using a spectrophotometer (Dynamica VIS-20, Dietikon, Switzerland) at 540 nm. The NO2 concentration in the sample was calculated from the standard curve of NO2 solution. Details of chemical preparation and extraction are explained in Bootdee et al. [15].

2.3.2. PM Sampling

The pollutants were sampled on working days (5 days per week) for 6 weeks during the rainy and dry seasons in 2020–2021 (see Table 1). Outdoor PM was sampled by using a dichotomous air sampler (Thermo Scientific, Waltham, MA, USA) at a flow rate of 16 L/min at 1.5 m above ground level. A total of 20 coarse particles of sizes between 2.5 and 10 µm (PM2.5–10) were collected in the first stage while another total of 20 fine particles of size ≤ 2.5 µm (PM2.5) were collected in the second stage. Then the sum of PM2.5–10 and PM2.5 was calculated. A pure quartz fiber filter (Whatman’s, Maidstone, UK, Ø 47 mm) was used to collect the PM. The samples were separately collected during day-time (7:00 a.m.–7:00 p.m.) and night-time (7:00 p.m.–7:00 a.m.). The 24 h PM concentration was an average of day-time and night-time concentrations.
Traffic area is a major source of PM2.5 in urban areas and it is deposited deeper in the respiratory system than PM10, causing a greater proportion of adverse health effects. In this study, PM2.5 was then concentrated in indoor air quality monitoring and health risk assessment. For indoor PM sampling, a total of 20 PM2.5 samples were collected from the classroom by using a respirable dust sampler (SKC, Eighty Four, PA, USA) with a flow rate of 2.5 L/min at 1.5 m above ground level and 1 m from the wall [16]. The PM was collected during working time (8:00 a.m.–16:00 p.m.) using a polyvinyl chloride (PVC) filter (SKC, Eighty Four, PA, USA, Ø 37 mm).

2.4. Statistical Analysis

Statistical methods were applied to explore the relationships and variations of NO2 and PM for both indoor and outdoor as well as rainy season and summer concentrations in the study area. A t-test was used to compare the concentration of pollutants between indoor and outdoor conditions and Spearman’s correlation was applied to test the correlation between the indoor and outdoor concentrations. Positive and negative correlations are shown by plus and minus symbols, respectively.

2.5. Health Risk Assessment

Health risk assessment for air pollution is the estimation of the health impact to be expected from exposure to air pollutants. The assessment contains several processes, including population estimates, population exposure to pollutants, and assessment of adverse health impacts through specific concentration-response functions [17]. The non-cancer risk from inhalation was considered for health risk assessment in this study. The assessment focused on 3 groups of people who had activities in the study area, according to their ages, including young children (1–5 years), children (6–12 years), and teachers (>20 years).
The hazard quotient (HQ) was used for health risk assessment from exposure to indoor NO2 and PM in the school. HQ is the ratio of potential exposure to pollutants and its level without adverse health effects. The level of hazard was classified by the HQ value as follows: HQ values less than 0.1 show no hazard exists; HQ values in the range of 0.1–1.0 show a low hazard risk; HQ values in the range of 1.1–10 show a moderate hazard risk, and finally, HQ values over 10 show a high hazard risk [18,19]. The HQ value was calculated from Equation (1) [20].
HQ = ADD RfD
where the average daily dose ADD (mg/kg.day) is the exposure to pollutants by respiratory inhalation (mg/kg.day), and the reference dose (RfD) refers to an estimated level of human daily intake without adverse health effects during a lifetime (mg/kg.day). RfD of NO2 is 1.1 × 10⁻² mg/kg.day [21]. While RfD of PM2.5 lacks consensus, so it was estimated from its value of the reference concentration (RfC) by Equation (2). RfC of diesel particles (DPM) at 5 μg/m3 was applied for calculations in this study [22,23]. Inhalation rate; IR (m3/day) and body weight: BW (kg) of each group are presented in Table 2.
RfD   = RfC   ×   IR BW
The ADD of groups of people were evaluated from Equation (3) [21,24]. Details of each parameter are presented in Table 2.
ADD = CA   × IR × ET × EF × ED BW   × AT
where ADD is for pollutants and CA is the concentration of air pollutants (mg/m3) which was calculated from an average of pollutant concentrations in both the summer and rainy seasons, IR is the inhalation rate of the group (m3/hour), ET is the exposure time (hours/day), and EF is the exposure frequency (days/year). ED is the exposure duration (years), BW is the body weight (kg), and AT is the average time (days).
Table 2. Exposure factor of air pollutants in the classroom.
Exposed ParametersSymbolUnitYoung Children
(1–5 Years)
Children
(6–12 Years)
Teacher
(>20 Years)
Concentration NO2 C A N O 2 mg/m30.0630.0630.063
Concentration PM2.5 C A P M 2.5 mg/m30.0110.0110.011
Inhalation rateIR (1)m3/hour0.320.460.54
The exposure timeET (2)hours/day888
The exposure frequencyEF (3)days/year248248248
The exposure durationEDyears4640
Body weight BW (1)kg162965
The average timeATdayED × 365 (day/year)
Remark: (1) BW and IR values refer to the study of Prasertsin and Nathapindhu [25]; (2) ET is the study time in the classroom (8:00 a.m.–4:00 p.m.); (3) EF is calculated from the number of working days minus special holidays.
Additionally, the total non-carcinogenic risk was calculated by the hazard index (HI) to estimate the risk from exposure to many pollutants at the same time. It was calculated by Equation (4) [26]:
HI = HQ 1   +   HQ 2   + +   HQ n
where 1–n: specified pollutants in the air.

3. Results and Discussions

3.1. NO2 Concentration

The average concentration of outdoor NO2 in the rainy season was 69.87 ± 3.75 µg/m3 while the concentration was 91.61 ± 5.91 µg/m3 in the summer. Whereas the concentrations of indoor NO2 in the rainy and the summer season were 55.75 ± 6.45 and 70.04 ± 3.46 µg/m3, respectively (Figure 2a). Since this study collected NO2 by using passive sampling for 24 h (a limitation of the passive sampler), the 24 h NO2 quality standard of New Zealand, Japan, South Korea, and Kuwait were selected for comparison instead of the 1 h and annual concentrations which are indicated in the WHO and Thailand air quality standards. The guidelines of those countries ranged between 100 and 123 µg/m3 [27,28,29,30]. The concentrations of NO2 collected in this study did not exceed the level of the 24 h NO2 quality standard. This study found that the concentrations in the rainy season were approximately 0.8 times those of the summer season. The result was similar to our previous study [31], which showed the influence of meteorological conditions. In Nakhon Si Thammarat province, relative humidity (RH) and rainfall in the rainy season are higher than in the summer season. RH refers to the amount of water vapor (H2O) in the air. When water vapor is exposed to the sun, molecules of water are broken down and they form hydroxyl radicals (hydroxyl radical: ·OH). They usually react with nitrogen dioxide to form nitric acid (HNO3) causing ambient NO2 reduction. Additionally, the amount of higher rainfall in the rainy season can leach air pollution to the ground [31,32].
Both indoor and outdoor NO2 concentrations were strongly correlated with a correlation coefficient (r) of 0.90 at 99% confidence level (Figure 2b) which indicated the same source of NO2. Moreover, this school does not have a major source of indoor NO2 such as tobacco smoke or coal-burning appliances (stoves, ovens, and water heaters). Additionally, the indoor and outdoor (I/O) ratio ranged between 0.69 and 0.90 with a mean value of 0.79 ± 0.06 (mean ± sd) and without a significant difference between seasons. It was suggested that outdoor NO2 could significantly contribute to indoor NO2 in the room [9,33]. Several indoor air quality studies in schools established that the value of NO2 I/O ratios was influenced by various factors such as type of ventilation, air exchange rates, airtightness of the envelope, location of the building (distance from outdoor pollutant source), and occupants’ behavior (such as opening windows). A building envelope provides limited shielding from ambient NO2, and peak indoor concentration can reach the same maximum as the outdoor concentration [34,35,36]. Thus, we can conclude from our study that the indoor NO2 concentrations in the open-air classroom were mainly from an outdoor source.

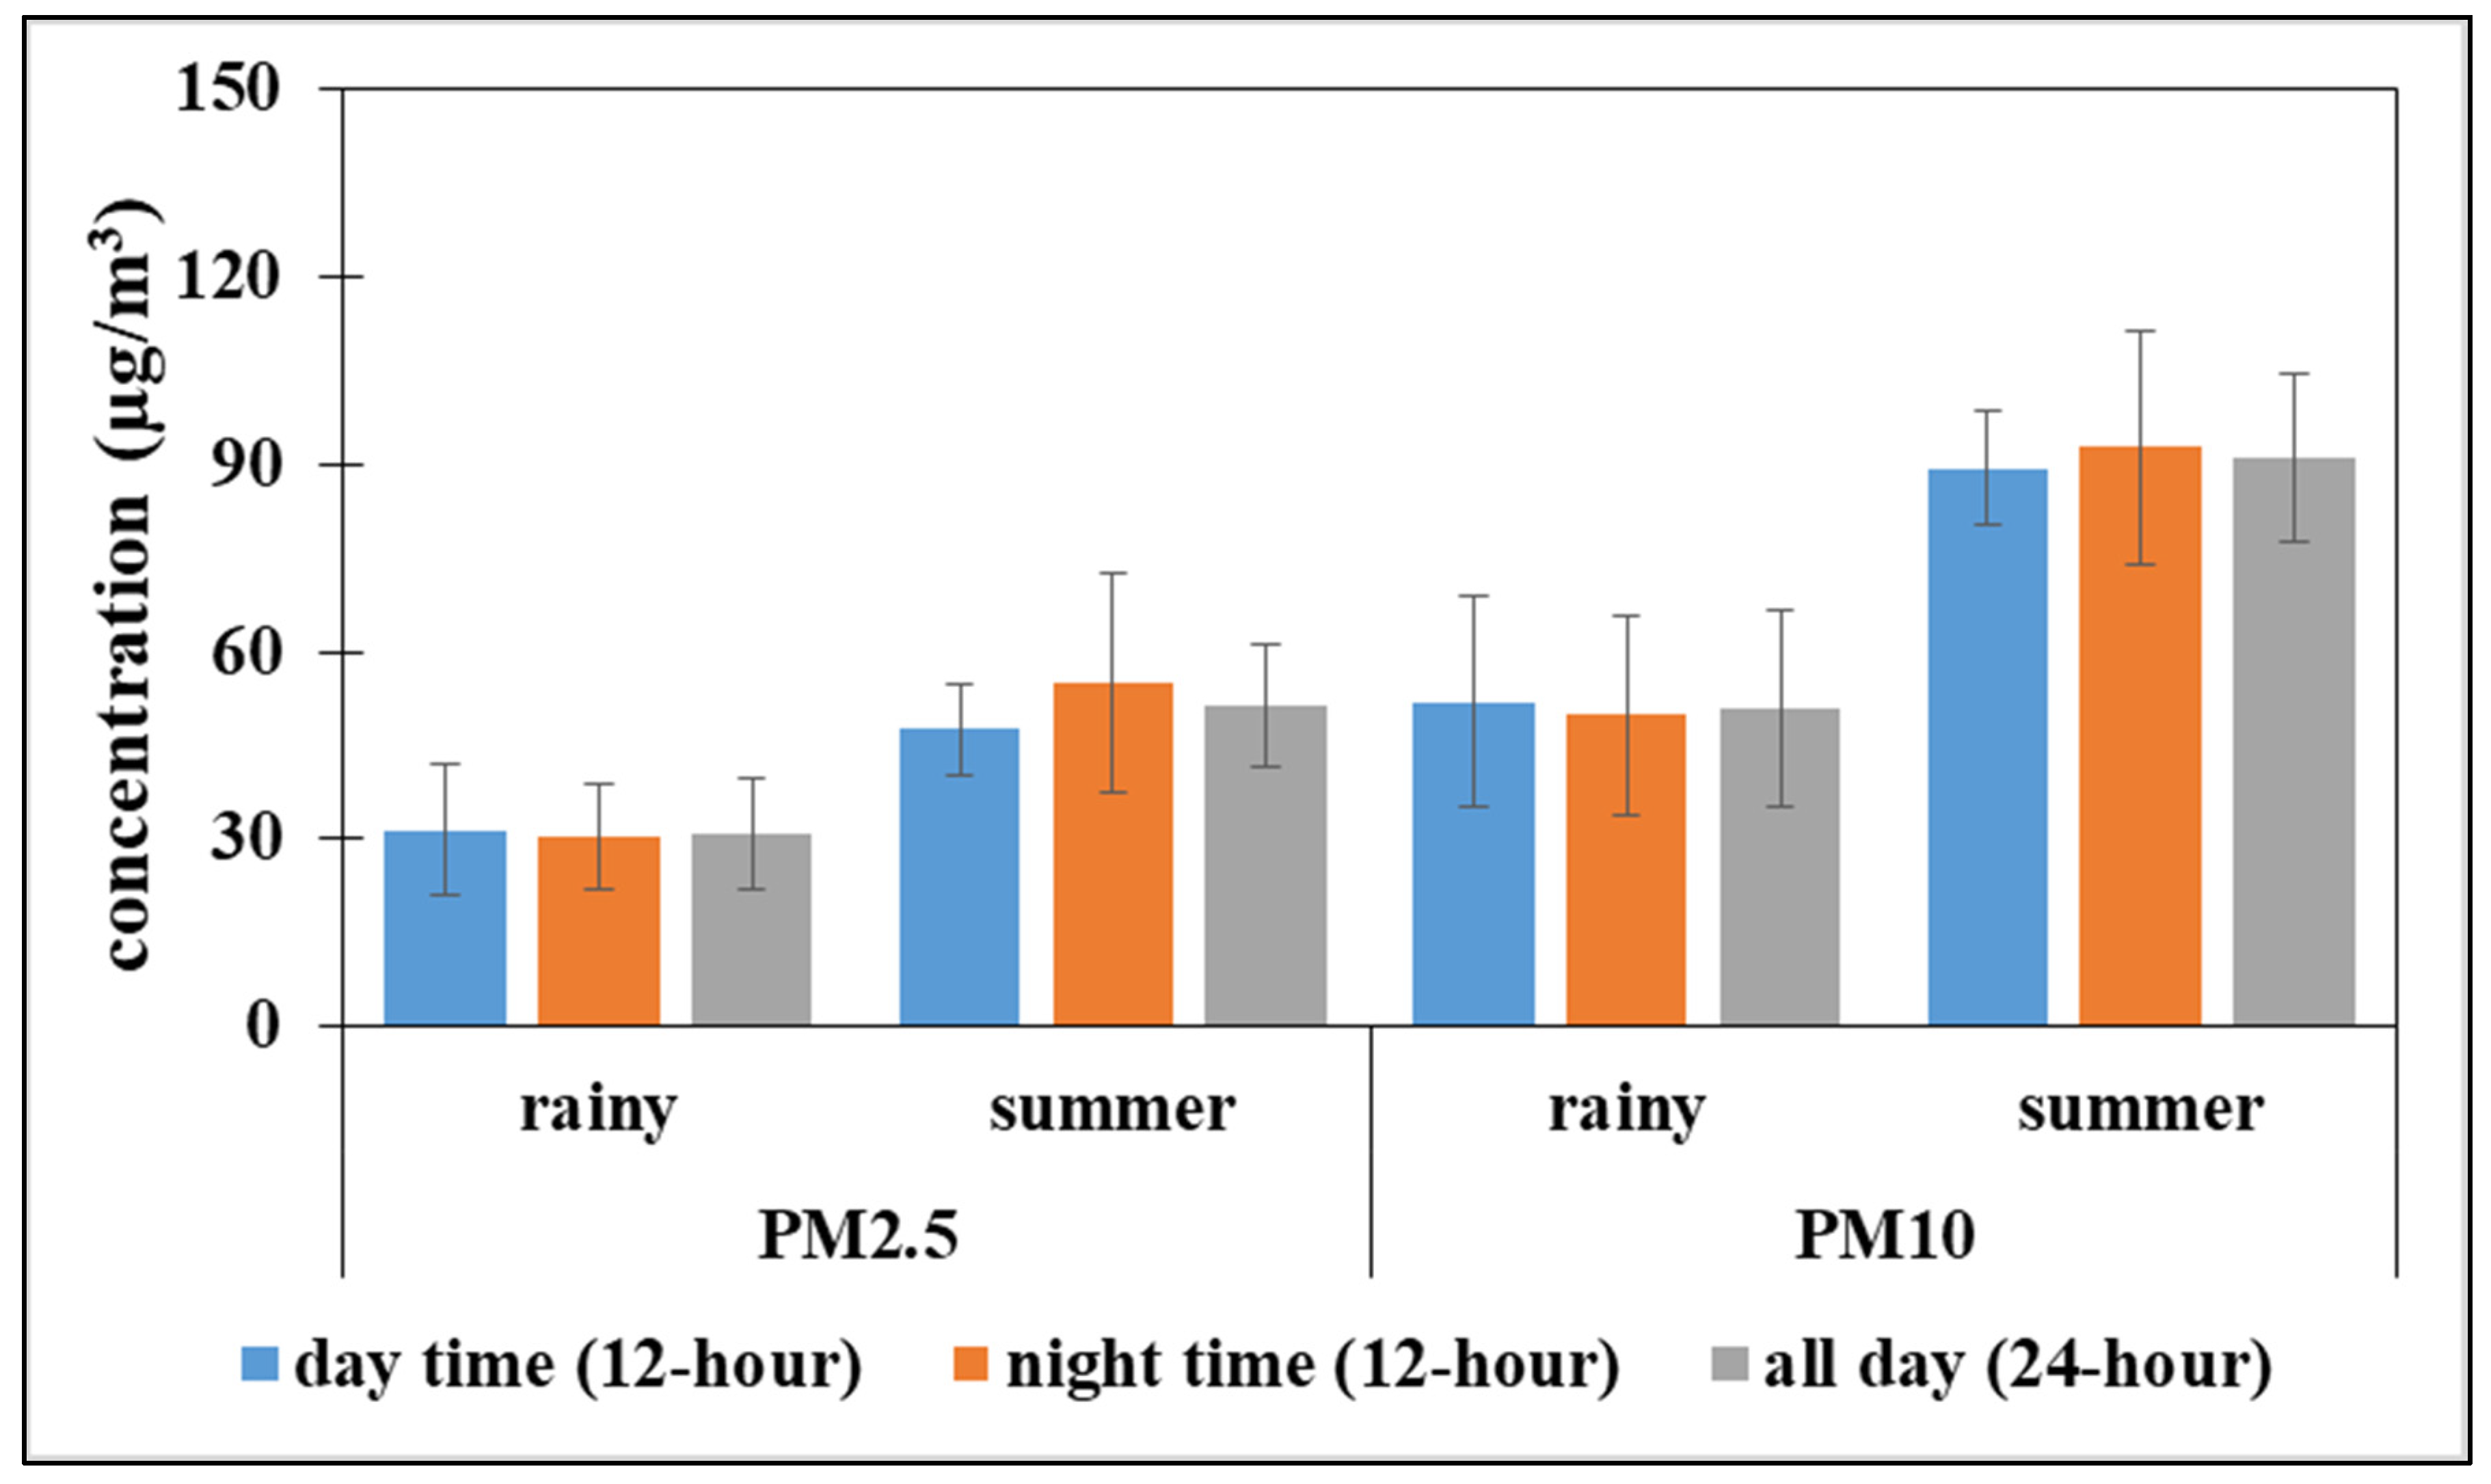
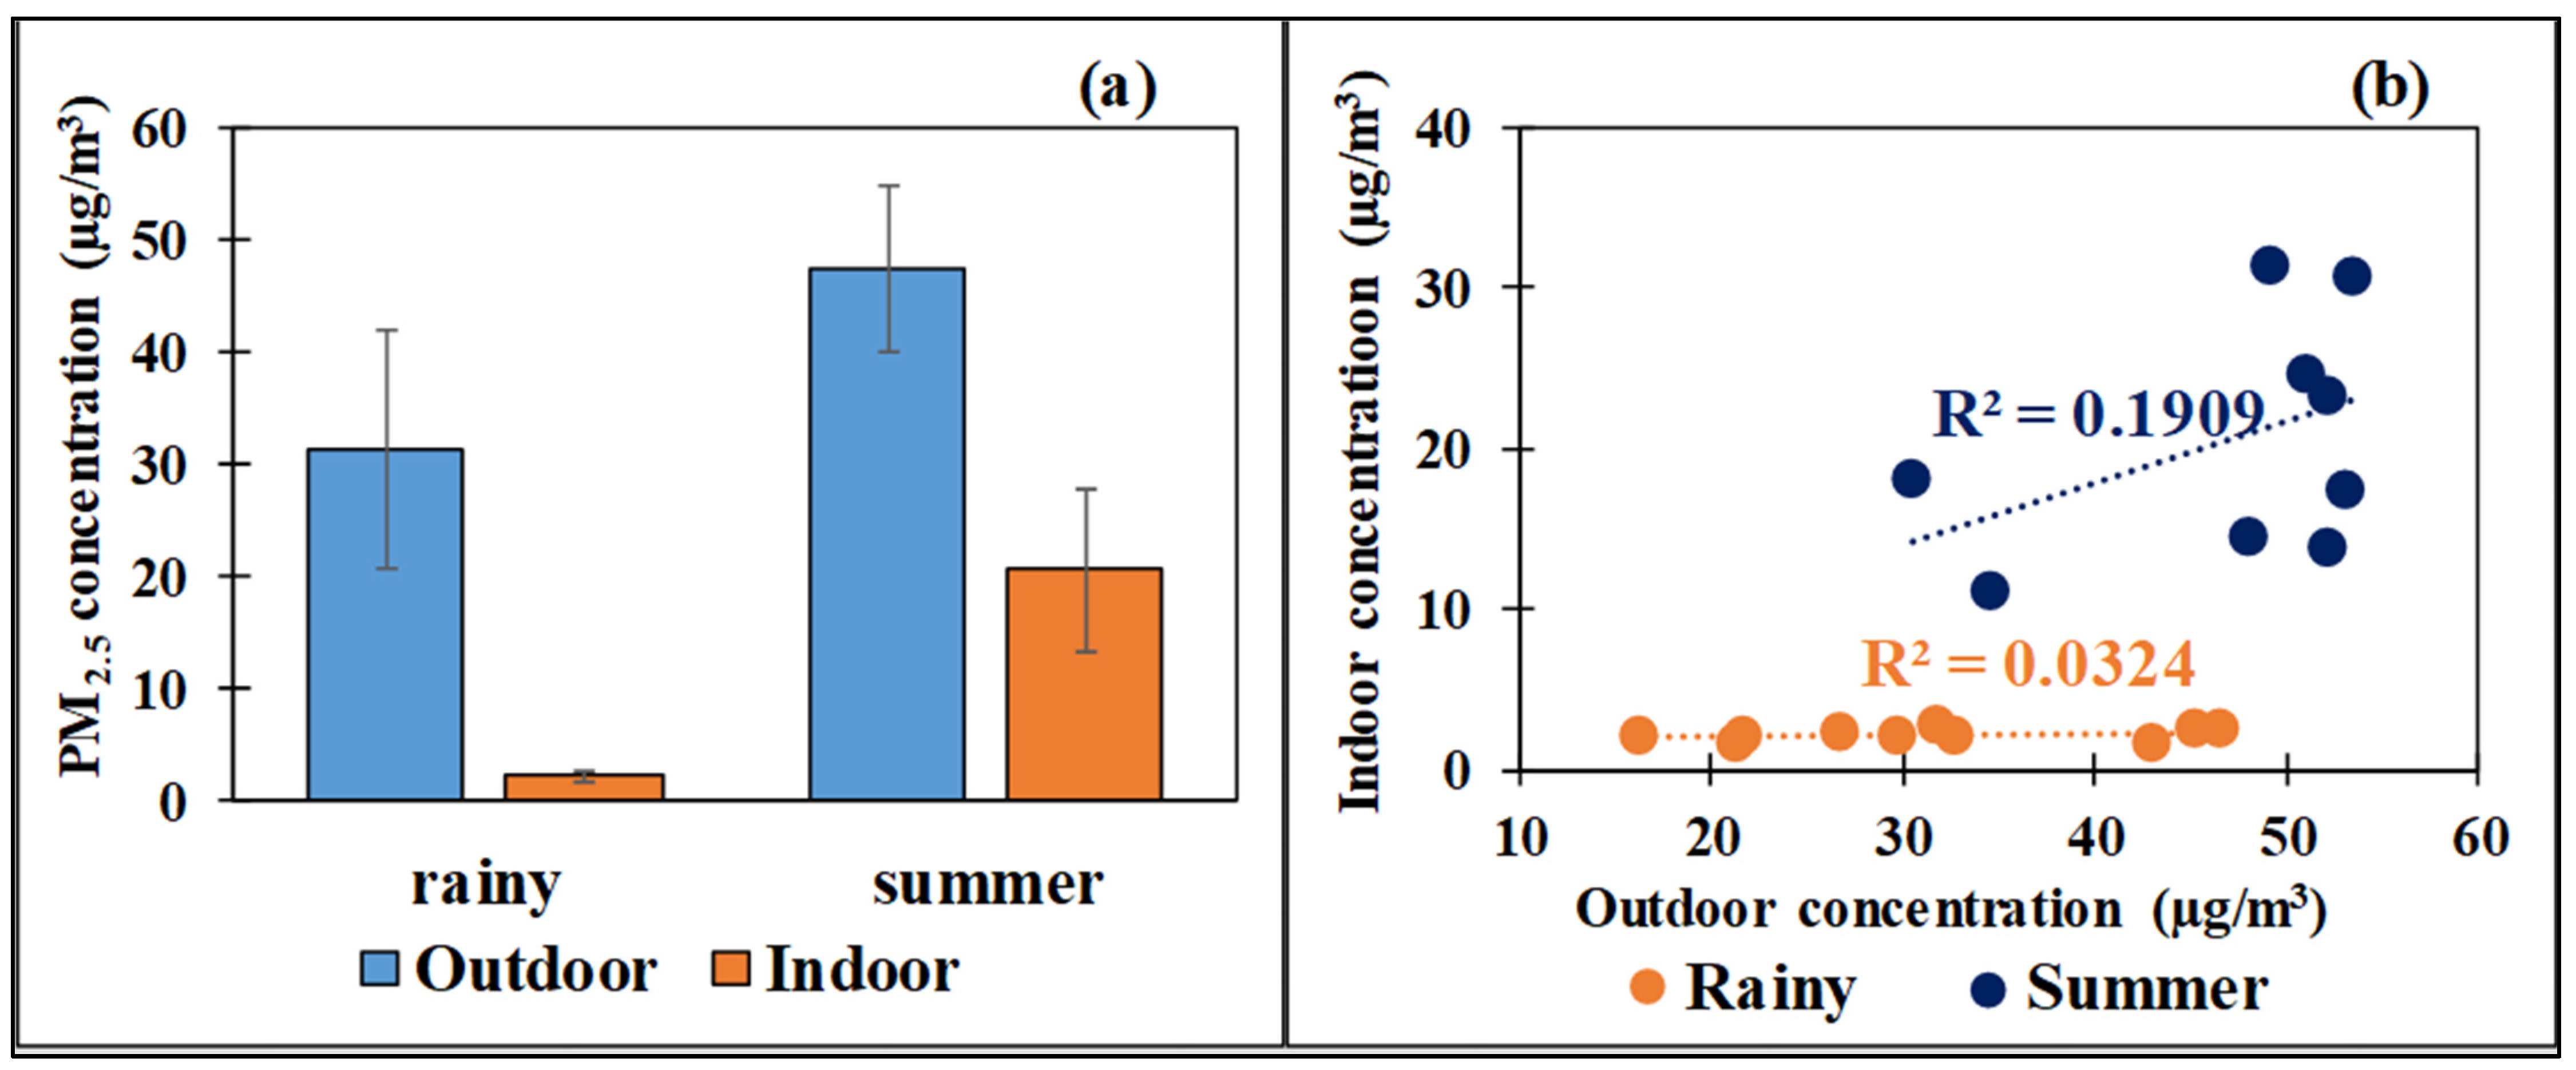
3.2. PM Concentration

The average 24 h concentration of outdoor PM2.5 was 51.39 ± 9.91 µg/m3 in the summer season and 30.88 ± 8.77 µg/m3 in the rainy season (Figure 3). While the average 24 h concentration of outdoor PM10 was 91.07 ± 13.26 and 50.91 ± 15.70 µg/m3 in the summer and the rainy seasons, respectively. This study found that PM concentrations were not significantly different between day and night-time. Moreover, PM2.5 and PM10 had a strong correlation with r of 0.98 at a 99% confidence level. Therefore, both pollutants must have originated from the same source. The ratio between PM2.5 and PM10 was 0.60 ± 0.11 which was greater than 0.5, indicating a higher number of fine particles. The PM in this study must have been affected by vehicle combustion because there was a greater dominance of fine particles from internal combustion than coarse particles [37,38]. As for the seasonal variations, both PM2.5 and PM10 concentrations show significant difference between seasons at a 99% confidence level. More precipitation in the rainy season causes PM leaching from the air. Moreover, the rainfall period also reduces photochemical reactions which enhance PM reduction [39]. Comparing the 24 h Thailand air quality standard of PM2.5 (50 µg/m3) and PM10 (120 µg/m3), the results show that PM2.5 concentrations were over the standard value in the summer season, while the PM10 concentrations were below the standard value for both seasons. Thus, installation of a public monitoring station for PM2.5 and measures to reduce exposure to outdoor PM2.5 such as avoiding outdoor activities and wearing masks are necessary in this area, particularly in the summer season.
The indoor PM2.5 concentrations were calculated from an 8 h sampling period during the period of the study in the classroom. The average 8 h concentration was 20.60 ± 7.39 µg/m3 in the summer season and 2.24 ± 0.36 µg/m3 in the rainy season. The concentration in the rainy season was about 0.1 times that in the summer season. The concentrations in this study were below the standard value of 8 h of PM2.5 for indoor air quality in office buildings specified by the Ministry of Public Health, Thailand (35 µg/m3). This indicates that PM2.5 would not likely cause any acute health effects from exposure. The concentration of outdoor PM2.5 (day-time samples) was selected to compare with that of the indoor concentration. It was found that PM2.5 I/O was about 0.1 and 0.4 in the rainy and summer seasons, respectively (Figure 4a). However, the concentrations of indoor and outdoor PM2.5 were not significantly correlated for the two seasons with a correlation coefficient (r) of 0.44 and 0.18 for the summer and rainy seasons, respectively (Figure 4b). The low correlation between indoor and outdoor may also be a consequence of a higher influence from indoor sources [40]. Moreover, prevailing winds and the land–sea breeze during the study duration mainly contributed from the northeast and east. While in the classroom, the windows were located in the north–south direction. The winds seem to have a small influence on the outdoor PM transportation through the room because of the room orientation. The result was related to the study of Cichowicz and Dobrzański [41], who indicated a weak correlation between outdoor and indoor PM on the leeward side compared with the windward. The result in this study indicated that there were other influencing factors, apart from traffic emission, i.e., meteorological factors and sources related to the students’ activities.
PM2.5 I/O during day-time in the summer season ranged between 0.27 and 0.64 while it ranged between 0.04 and 0.14 in the rainy season. The studies of Barmpadimos et al. [42] and Hernandez et al. [43] showed a negative correlation between PM and RH. RH over 75% enhances PM accumulation due to hygroscopic growth of high moisture which ultimately leads to depositions of the particles on the ground. Additionally, warm temperatures enhance secondary PM formation; for example, a positive relationship between PM and temperature was observed in Kapwata et al. [44]. These studies provide useful information with regard to the meteorological conditions in this study. There was a high RH with a slightly lower temperature (about 80% and 24 °C) in the rainy season, while it was about 65% and 26 °C in the summer season. This suggests that the meteorological conditions, particularly RH, in the classroom have a stronger influence on the PM2.5 reduction in the rainy season.
There was another reason which accounts for the lack of a correlation between indoor and outdoor PM. Indoor PM2.5 levels could have also been influenced by physical activities. Di Gilio et al. [45] indicated that contribution indoor sources could contribute to PM2.5 as a result of the resuspension of particles in the classroom. This finding is consistent with that of Blondeau et al. [9]: when a room was occupied, PM2.5 concentrations were higher than in an unoccupied room. The ratio between occupied and unoccupied was found to range between 1 and 10 for PM2.5 [9]. Possible sources for this could also be from the resuspension of previously deposited particles.

3.3. Human Health Risk Assessment

Hazard quotient (HQ) values were used to estimate the non-carcinogenic risks for indoor NO2 and PM2.5 exposure. It was observed that the HQ values for young children, children, and teachers from exposure to NO2 in the classroom were 0.62, 0.49, and 0.26, respectively (Figure 5). While the values from indoor PM2.5 were similar at 0.50. The HQ value of individual pollutants in this study indicated a low hazard to people who had used the classroom. While the hazard index (HI) for all groups ranged between 0.76 and 1.12, the HI for young children (1–5 years) was 1.12 which was classified as a moderate hazard. However, the values of the children and adult group were lower than 1. This shows that young children have higher adverse health effects from exposure to indoor air pollutants than others. This is most likely due to the pollutant intake per unit body weight of young children being higher than that of children and teachers. The results are similar to those of other studies such as Oliveira et al. [22] which indicated that the toxicological risk of PM2.5 from biomass burning in children under the age of 8 was 12% higher than the risk for adolescents (12–14 years). Kaewrat and Janta [46] and Bootdee et al. [47] also found the HQ values for children from NO2 exposure in schools and at tourist destinations were greater than that for adults. Moreover, a lower body weight is also related to a greater HI value [26]. Additionally, the health risks of air pollutants also depend on the activities of the receptor such as exposure time and duration, and other types of activities which are associated with inhalation rate [48,49].
According to Equation (1), HQ value is related to the amount of the daily dose of air pollutants, so reduction of the daily dose by reducing exposure time and frequency as well as the pollutant concentration could reduce the hazard level from indoor air pollutants. The three basic strategies to improve indoor air quality suggested by USEPA [1] are source controlling, ventilation improvement, and air-cleaner installation. The source control seems to be the most effective solution for the classroom with a natural ventilation system. Annesi-Maesano et al. [50] indicated that the source of NO2 in schools was mainly from outdoor sources such as traffic and industries, while the PM2.5 originated from both indoor and outdoor sources. These results are similar to those of this study. The indoor sources of particulates include dry walls, dry furniture, and soil dust released from students’ shoes and clothes, and the secondary particles formed by gas pollutants [51]. Therefore, it was suggested that source reductions could be made by leaving shoes outside, repainting the walls and furniture, and increasing the cleaning schedule in order to remove dry deposition, particularly during the dry season. According to the recommendations of the Occupational Safety and Health Administration (OSHA) on the reduction of indoor PM, cleaning work should be carried out after the class in order to reduce student exposure to PM dispersion in the room [52]. If doors and windows are completely closed when nobody is using the classroom, dry deposition of the outdoor pollutants could be prevented. Installation of an air cleaner or air conditioning is a better choice for prevention of ambient air pollutants. However, the latter solution requires high investment costs and electricity charges. As many schools still use natural ventilation systems, e.g., open windows with a ceiling fan, the other solutions would be necessary to reduce the hazards from outdoor sources.
Distances from pollutant sources also plays a major role in the reduction of pollutants. Several studies indicate that air pollutant concentrations decrease according to the distance from the sources as reported by Faus-Kessler et al. [53] and Liu et al. [54] whose studies indicated that NO2 reductions of approximately 17, 21, and 50% occur at a distance of 100, 300, and 500 m from traffic. A reduction of about 25% PM2.5 was reported at a distance of 400 m from the source [55]. Therefore, zoning of the road distances according to the age of the students could be an alternative solution to reduce the health risk of students. Young children (1–5 years) who have a larger pollutant intake per unit of body weight should be assigned as far as possible to a classroom which is at a maximum the distance from the road in order to minimize the daily dose of pollutants. Additionally, Tong et al. [56] and Abhijith et al. [57] indicated that both solid and vegetation barriers had the potential to reduce near-road air pollution. Thus, combining classroom zoning by age, and solid or vegetation barriers would be useful as an immediate solution for the improvement of indoor air quality in natural ventilation systems such as open-air classrooms with a ceiling fan.

4. Conclusions

This study estimated the concentration of indoor air pollutants (NO2 and PM2.5) and the influence of outdoor pollutants on an open-air classroom with a ceiling fan and natural ventilation. The measured concentrations were later applied to assess the non-carcinogenic risks for students and teachers who were exposed to the indoor air pollutants at the school. With respect to gas pollutants, the concentration of indoor and outdoor NO2 were within the 24 h NO2 quality standard. The outdoor NO2 indicated a strong influence on indoor NO2 because a strong correlation was found between both concentrations and the NO2 I/O ratio was over 0.5 (0.69 and 0.90 in the rainy and summer seasons, respectively). In the case of particulate pollutants, the concentration of indoor PM2.5 was at an acceptable level for indoor air quality in office buildings. The PM2.5 I/O ratio was less than 0.5 (0.1 and 0.4 in the rainy and summer seasons, respectively) with no significant correlation between indoor and outdoor sources or the influence of RH (relative humidity) on the indoor PM2.5. Even though both concentrations of NO2 and PM2.5 were below the air quality standard values, the HI value indicated that the young children’s exposure to indoor air pollutants were above the recommended limits for human health. Long term and daily exposure of young children to NO2 and PM2.5 at such levels could cause respiratory disease and inhibit cognitive development. As a result of our study, we recommend classroom cleaning, zoning of students at certain distances from the road distance based on their age, and the erection of solid or vegetation barriers should be carried out in order to reduce daily exposure.

Author Contributions

Conceptualization, J.K., R.J., S.S. and T.K.; Data curation, J.K. and S.S.; Formal analysis, R.J.; Investigation, R.J. and S.S.; Methodology, J.K. and R.J.; Resources, J.K.; Supervision, T.K.; Writing—original draft, R.J. and S.S.; Writing—review & editing, T.K. All authors have read and agreed to the published version of the manuscript.

Funding

This research received no external funding.

Institutional Review Board Statement

Not applicable.

Informed Consent Statement

Not applicable.

Data Availability Statement

Not applicable.

Acknowledgments

The authors would like to thank the school director and staff at the school of Nakhon Si Thammarat Na Nakhon Uthit for providing a location and support during the sample collection for this study. We are also grateful to Janpen Rasee, Thinaporn Suttiviriya and Titamaporn Srichun for their support during the sample collection.

Conflicts of Interest

The authors declare no conflict of interest.

References

  1. US EPA. Indoor Air Quality. An Official Website of the United States Government. 2021. Available online: https://www.epa.gov/report-environment/indoor-air-quality (accessed on 1 May 2021).
  2. Tran, V.V.; Park, D.; Lee, Y.-C. Indoor Air Pollution, Related Human Diseases, and Recent Trends in the Control and Improvement of Indoor Air Quality. Int. J. Environ. Res. Public Health 2020, 17, 2927. [Google Scholar] [CrossRef] [Green Version]
  3. Buka, I.; Koranteng, S.; Osornio-Vargas, A.R. The effects of air pollution on the health of children. Paediatr. Child. Health 2006, 11, 513–516. [Google Scholar] [CrossRef] [Green Version]
  4. Sunyer, J.; Esnaola, M.; Alvarez-Pedrerol, M.; Forns, J.; Rivas, L.; López-Vicente, M.; Suades-González, E.; Foraster, M.; Gar-cia-Esteban, R.; Basagaña, X.; et al. Association between Traffic-Related Air Pollution in Schools and Cognitive Development in Primary School Children: A Prospective Cohort Study. PLoS Med. 2015, 12, e1001792. [Google Scholar] [CrossRef]
  5. Leung, D.Y.C. Outdoor-indoor air pollution in urban environment: Challenges and opportunity. Front. Environ. Sci. 2015, 2, 69. [Google Scholar] [CrossRef]
  6. Shrestha, P.M.; Humphrey, J.L.; Carlton, E.J.; Adgate, J.L.; Barton, K.E.; Root, E.D.; Shelly, L.; Miller, S.L. Impact of Out-Door Air Pollution on Indoor Air Quality in Low-Income Homes during Wildfire Seasons. Int. J. Environ. Res. Public Health 2019, 16, 3535. [Google Scholar] [CrossRef] [Green Version]
  7. Becerra, J.A.; Lizana, J.; Gil, M.; Barrios-Padura, A.; Blondeau, P.; Chacartegui, R. Identification of potential indoor air pol-lutants in schools. J. Clean. Prod. 2020, 242, 118420. [Google Scholar] [CrossRef]
  8. Winkler, S.L.; Anderson, J.E.; Garza, L.; Ruona, W.C.; Vogt, R.; Wallington, T.J. Vehicle criteria pollutant (PM, NOx, CO, HCs) emissions: How low should we go? Npj Clim. Atmos. Sci. 2018, 1, 26. [Google Scholar] [CrossRef]
  9. Blondeau, P.; Iordache, V.; Poupard, O.; Genin, D.; Allard, F. Relationship between outdoor and indoor air quality in eight French schools. Indoor Air 2005, 15, 2–12. [Google Scholar] [CrossRef]
  10. Pallarés, S.; Gómez, E.; Martínez, A.; Jordán, M.M. The relationship between indoor and outdoor levels of PM10 and its chemical composition at schools in a coastal region in Spain. Heliyon 2019, 5, e02270. [Google Scholar] [CrossRef] [Green Version]
  11. World Health Organization (WHO). Natural Ventilation for Infection Control in Health-Care Settings; WHO Regional Office for Europe: Copenhagen, Denmark, 2009. [Google Scholar]
  12. Chen, J.; Brager, G.S.; Augenbroe, G.; Song, X. Impact of outdoor air quality on the natural ventilation usage of commercial buildings in the US. Appl. Energy 2019, 235, 673–684. [Google Scholar] [CrossRef]
  13. Laumbach, R.; Meng, Q.; Kipen, H. What can individuals do to reduce personal health risks from air pollution? J. Thorac. Dis. 2015, 7, 96–107. [Google Scholar] [CrossRef]
  14. Murena, F.; Mele, B. Effect of short-time variations of wind velocity on mass transfer rate between street canyons and the atmospheric boundary layer. Atmos. Pollut. Res. 2014, 5, 484–490. [Google Scholar] [CrossRef] [Green Version]
  15. Bootdee, S.; Chalemrom, P.; Chantara, S. Validation and field application of tailor-made nitrogen dioxide passive samplers. Int. J. Environ. Sci. Technol. 2012, 9, 515–526. [Google Scholar] [CrossRef] [Green Version]
  16. World Health Organization (WHO). Methods for Monitoring Indoor Air Quality in Schools. In Proceedings of the Methods for Monitoring Indoor Air Quality in Schools: Report of A Meeting, Bonn, Germany, 4–5 April 2011.
  17. Bhat, T.H.; Jiawen, G.; Farzaneh, H. Air Pollution Health Risk Assessment (AP-HRA), Principles and Applications. Int. J. Environ. Res. Public Health 2021, 18, 1935. [Google Scholar] [CrossRef]
  18. Lina, N.D.; Engelbrecht, J.C.; Wright, C.Y.; Oosthuizen, M.A.; Thabethe, N.D.L. Human health risks posed by exposure to PM10 for four life stages in a low socio-economic community in South Africa. Pan Afr. Med. J. 2014, 18, 206. [Google Scholar] [CrossRef]
  19. Lemly, A. Evaluation of the Hazard Quotient Method for Risk Assessment of Selenium. Ecotoxicol. Environ. Saf. 1996, 35, 156–162. [Google Scholar] [CrossRef]
  20. US EPA. Concepts Methods and Data Sources for Cumulative Health Risk Assessment of Multiple Chemicals, Exposures and Effects: A Resource Document, EPA/600/R-06/013F; US EPA: Washington, DC, USA, 2007.
  21. Garbero, V.; Montalto, A.; Lazovic, N.; Salizzoni, P.; Berrone, S.; Soulhac, L. The Impact of the Urban Air Pollution on the Human Health: A Case-Study in Turin. Air Pollut. Model. Its Appl. XXI 2011, 11, 729–732. [Google Scholar] [CrossRef]
  22. Oliveira, B.F.A.; Igotti, E.; Artzxo, P.; Saldiva, P.H.N.; Juger, W.L.; Hacon, S. Risk assessment of PM2.5 to child residents in Brazilian Amazon region with biofuel production. Environ. Health 2012, 11, 64. [Google Scholar] [CrossRef] [PubMed] [Green Version]
  23. Kumar, S.; Goyal, P. Health Risk of Ambient PM2.5 Concentration: A Case study of New Delhi, India. Int. J. Agric. Environ. Sustain. 2019, 1, 10–16. [Google Scholar]
  24. US EPA. The Risk Assessment Guidance for Superfund (RAGS) Part A. Office of Emergency and Remedial Response, U.S.A. 2010. Available online: https://www.epa.gov/risk/risk-assessment-guidance-superfund-rags-part (accessed on 1 May 2021).
  25. Prasertsin, S.; Nathapindhu, G. The Temporal Pattern of Ambient PM2.5 and Health Risk Assessment in Thailand. Indian J. Public Health Res. Dev. 2020, 11, 1096–1100. [Google Scholar]
  26. Gruszecka-Kosowska, A. Assessment of the Kraków inhabitants’ health risk caused by the exposure to inhalation of outdoor air contaminants. Stoch. Environ. Res. Risk Assess. 2018, 32, 485–499. [Google Scholar] [CrossRef] [Green Version]
  27. Abdul-Wahab, S.A.; En, S.C.F.; Elkamel, A.; Ahmadi, L.; Yetilmezsoy, K. A review of standards and guidelines set by international bodies for the parameters of indoor air quality. Atmos. Pollut. Res. 2015, 6, 751–767. [Google Scholar] [CrossRef]
  28. New Zealand Government. Ambient Air Quality Guidelines: 2002 Update; New Zealand Government: Wellington, New Zealand, 2002. Available online: https://environment.govt.nz/facts-and-science/air/air-pollutants/nitrogen-dioxide-effects-health/ (accessed on 10 May 2021).
  29. Ministry of the Environment Government of Japan. Environmental Standards for Nitrogen Dioxide; Ministry of the Environment Government of Japan: Tokyo, Japan, 2020. Available online: https://www.env.go.jp/kijun/taiki2.html (accessed on 13 May 2021).
  30. South Korea’s Ambient Air Quality Standards. 2018. Available online: https://www.transportpolicy.net/standard/south-korea-air-quality-standards/ (accessed on 10 May 2021).
  31. Janta, R.; Kaewrat, J.; Rattikansukha, C.; Sichum, S. Measurement of Nitrogen Dioxide Concentration in Traffic Areas of Nakhon Si Thammarat Province and Health Risk Assessment. J. KMUTNB 2020, 30, 481–494. (In Thai) [Google Scholar] [CrossRef]
  32. Cros, C.J.; Terpeluk, A.L.; Crain, N.E.; Juenger, M.C.; Corsi, R.L. Influence of environmental factors on removal of oxides of nitrogen by a photocatalytic coating. J. Air Waste Manag. Assoc. 2015, 65, 937–947. [Google Scholar] [CrossRef] [Green Version]
  33. Hwang, S.H.; Park, W.M. Indoor air concentrations of carbon dioxide (CO2), nitrogen dioxide (NO2), and ozone (O3) in multiple healthcare facilities. Environ. Geochem. Health 2020, 42, 1487–1496. [Google Scholar] [CrossRef]
  34. Chatzidiakou, L.; Mumovic, D.; Summerfield, A.J. What do we know about indoor air quality in school classrooms? A critical review of the literature. Intell. Build. Int. 2012, 4, 228–259. [Google Scholar] [CrossRef]
  35. Kalimeri, K.K.; Bartzis, J.G.; Sakellaris, I.A.; de Oliveira Fernandes, E. Investigation of the PM2.5, NO2 and O3 I/O ratios for office and school microenvironments. Environ. Res. 2019, 179, 108791. [Google Scholar] [CrossRef]
  36. Salonen, H.; Salthammer, T.; Morawska, L. Human exposure to NO2 in school and office indoor environments. Environ. Int. 2019, 130, 104887. [Google Scholar] [CrossRef] [PubMed]
  37. Xu, G.; Jiao, L.; Zhang, B.; Zhao, S.; Yuan, M.; Gu, Y.; Liu, J.; Tang, X. Spatial and Temporal Variability of the PM2.5/PM10 Ratio in Wuhan, Central China. Aerosol Air Qual. Res. 2016, 17, 741–751. [Google Scholar] [CrossRef] [Green Version]
  38. Adães, J.; Pires, J.C.M. Analysis and Modelling of PM2.5 Temporal and Spatial Behaviors in European Cities. Sustainability 2019, 11, 6019. [Google Scholar] [CrossRef] [Green Version]
  39. Kanchanasuta, S.; Sooktawee, S.; Patpai, A.; Vatanasomboon, P. Temporal Variations and Potential Source Areas of Fine Particulate Matter in Bangkok, Thailand. Air Soil Water Res. 2020, 13, 1–10. [Google Scholar] [CrossRef]
  40. Meier, R.; Eeftens, M.; Phuleria, H.C.; Ineichen, A.; Corradi, E.; Davey, M.; Fierz, M.; Ducret-Stich, R.E.; Aguilera, I.; Schindler, C.; et al. Differences in indoor versus outdoor concentrations of ultrafine particles, PM2.5, PMabsorbance and NO2 in Swiss homes. J. Expo. Sci. Environ. Epidemiol. 2015, 25, 499–505. [Google Scholar] [CrossRef]
  41. Cichowicz, R.; Dobrzański, M. Indoor and Outdoor Concentrations of Particulate Matter and Gaseous Pollutants on Different Floors of a University Building: A Case Study. J. Ecol. Eng. 2021, 22, 162–173. [Google Scholar] [CrossRef]
  42. Barmpadimos, I.; Hueglin, C.; Keller, J.; Henne, S.; Prevot, A. Influence of meteorology on PM10 trends and variability in Switzerland from 1991 to 2008. Atmos. Chem. Phys. Discuss. 2011, 11, 1813–1835. [Google Scholar] [CrossRef] [Green Version]
  43. Hernandez, G.; Berry, T.-A.; Wallis, S.L.; Polyer, D. Temperature and Humidity Effects on Particulate Matter Concentrations in a Sub-Tropical Climate during Winter. Int. Proc. Chem. Biol. Environ. Eng. 2017, 102, 41–49. [Google Scholar]
  44. Kapwata, T.; Language, B.; Piketh, S.; Wright, C.Y. Variation of Indoor Particulate Matter Concentrations and Association with Indoor/Outdoor Temperature: A Case Study in Rural Limpopo, South Africa. Atmosphere 2018, 9, 124. [Google Scholar] [CrossRef] [Green Version]
  45. Di Gilio, A.; Farella, G.; Marzocca, A.; Giua, R.; Assennato, G.; Tutino, M.; de Gennaro, G. Indoor/Outdoor Air Quality As-sessment at School near the Steel Plant in Taranto (Italy). Adv. Meteorol. 2017, 2017, 1526209. [Google Scholar] [CrossRef] [Green Version]
  46. Kaewrat, J.; Janta, R. Health Risk Assessment of Residents in a Tourist City: A Case Study of Nakhon Si Thammarat Province. Walailak J. Sci. Techol. 2021, 18, 11510. [Google Scholar]
  47. Bootdee, S.; Phantu, S.; Lamlongrat, P.; Khumphai, T. Indoor Nitrogen Dioxide Investigation and Health Risk Assessment in Primary Schools at Rayong City, Thailand. Curr. J. Appl. Sci. 2020, 19, 248–262. [Google Scholar]
  48. Cheng, Z.; Li, B.; Yu, W.; Wang, H.; Zhang, T.; Xiong, J.; Bu, Z. Risk assessment of inhalation exposure to VOCs in dwellings in Chongqing, China. Toxicol. Res. 2017, 7, 59–72. [Google Scholar] [CrossRef] [Green Version]
  49. Du, Z.; Mo, J.; Zhang, Y. Risk assessment of population inhalation exposure to volatile organic compounds and carbonyls in urban China. Environ. Int. 2014, 73, 33–45. [Google Scholar] [CrossRef]
  50. Annesi-Maesano, I.; Baiz, N.; Banerjee, S.; Rudnai, P.; Rive, S. Indoor Air Quality and Sources in Schools and Related Health Effects. J. Toxicol. Environ. Health Part B 2013, 16, 491–550. [Google Scholar] [CrossRef]
  51. Carrion-Mattaa, A.; Kanga, C.-M.; Gaffin, J.M.; Hauptman, M.; Phipatanakul, W.; Koutrakisa, P.; Gold, D.R. Classroom in-door PM2.5 sources and exposures in inner-city schools. Environ. Int. 2019, 131, 104968. [Google Scholar] [CrossRef] [PubMed]
  52. Occupational Safety and Health Administration (OSHA). Indoor Air Quality in Commercial and Institutional Buildings; Occupational Safety and Health Administration U.S. Department of Labor: Washington, DC, USA, 2011. Available online: https://www.osha.gov/sites/default/files/publications/3430indoor-air-quality-sm.pdf (accessed on 1 May 2021).
  53. Faus-Kessler, T.; Kirchner, M.; Jakobi, G. Modelling the decay of concentrations of nitrogenous compounds with distance from roads. Atmos. Environ. 2008, 42, 4589–4600. [Google Scholar] [CrossRef]
  54. Liu, S.V.; Chen, F.-L.; Xue, J. A meta-analysis of selected near-road air pollutants based on concentration decay rates. Heliyon 2019, 5, e02236. [Google Scholar] [CrossRef] [PubMed] [Green Version]
  55. Hitchins, J.; Morawska, L.; Wolff, R.; Gilbert, D. Concentrations of submicrometre particles from vehicle emissions near a major road. Atmos. Environ. 2000, 34, 51–59. [Google Scholar] [CrossRef] [Green Version]
  56. Tong, Z.; Baldauf, R.W.; Isakov, V.; Deshmukh, P.; Zhang, K.M. Roadside vegetation barrier designs to mitigate near-road air pollution impacts. Sci. Total. Environ. 2016, 541, 920–927. [Google Scholar] [CrossRef]
  57. Abhijith, K.; Kumar, P.; Gallagher, J.; McNabola, A.; Baldauf, R.; Pilla, F.; Broderick, B.; DI Sabatino, S.; Pulvirenti, B. Air pollution abatement performances of green infrastructure in open road and built-up street canyon environments—A review. Atmos. Environ. 2017, 162, 71–86. [Google Scholar] [CrossRef]
Figure 1. (a) Location of primary school in the city center of Nakhon Si Thammarat province, Thailand; (b) classroom diagram.
Sustainability 13 08302 g001
Figure 2. Indoor and outdoor concentrations of nitrogen dioxide. (a) The concentrations in the rainy and summer seasons (a capital and a small letter present significant difference at 99% confidence level between season and indoor/outdoor conditions, respectively.); (b) correlation between outdoor and indoor concentrations.
Sustainability 13 08302 g002
Figure 3. Concentrations of outdoor particulate matter at the school.
Sustainability 13 08302 g003
Figure 4. The average 8 h PM2.5 concentrations. (a) The concentrations in the rainy and summer seasons; (b) correlation between outdoor and indoor concentrations.
Sustainability 13 08302 g004
Figure 5. HQ and HI values for people in the classroom.
Sustainability 13 08302 g005
Table 1. Summary of NO2 and PM sampling.
ParametersSampling PeriodOutdoorIndoor
TimeSample NumberTimeSample Number
NO2November 2019–February 202024 h4824 h48
PM2.5February–March 2020,
January 2021
7:00 a.m.–7:00 p.m.;
7:00 p.m.–7:00 a.m.
20
20
8:00 a.m.–4:00 p.m.
-
20
-
PM10February–March 2020,
January 2021
7:00 a.m.–7:00 p.m.;
7:00 p.m.–7:00 a.m.
20
20
-
-
-
-
Publisher’s Note: MDPI stays neutral with regard to jurisdictional claims in published maps and institutional affiliations.

