
Research on High-Quality Development Efficiency and Total Factor Productivity of Regional Economies in China

Abstract
:1. Introduction
2. Literature Review
3. Materials and Methods
3.1. The Evaluation with SBM-DDF Model
3.2. Spatial Autocorrelation Model
3.3. Tobit Model for Influencing Factors
3.4. Indicators for Evaluation
3.5. Data Sources
4. Results
4.1. The Evaluation on High-Quality Development Efficiency and TFP
4.2. The Spatial Trends of High-Quality Development Efficiency and TFP
4.3. The Spatial Correlation Pattern of High-Quality Development Efficiency and TFP
4.4. Influential Factors of High-Quality Development Efficiency and TFP
5. Discussion
5.1. Indicators of High-Quality Development
5.2. Evaluation on High-Quality Development TFP
6. Conclusions
6.1. Summaries and Policy Recommendations
- (1)
- The high-quality development efficiency of the eastern region is the highest, followed by the northeast region, the western region, and the central region. Only Guangdong, Shanghai, Jiangsu, and Tibet are on the production boundary of high-quality development efficiency. Yunnan, Guizhou, and Guangxi have lower high-quality development efficiency. The average growth rate of the high-quality development TFP in the eastern region is the largest, and that in the central region is the lowest. Only Beijing, Tianjin, and Zhejiang have positive TFP, pure efficiency change, pure technological progress, scale efficiency change, and technological scale change at the same time.
- (2)
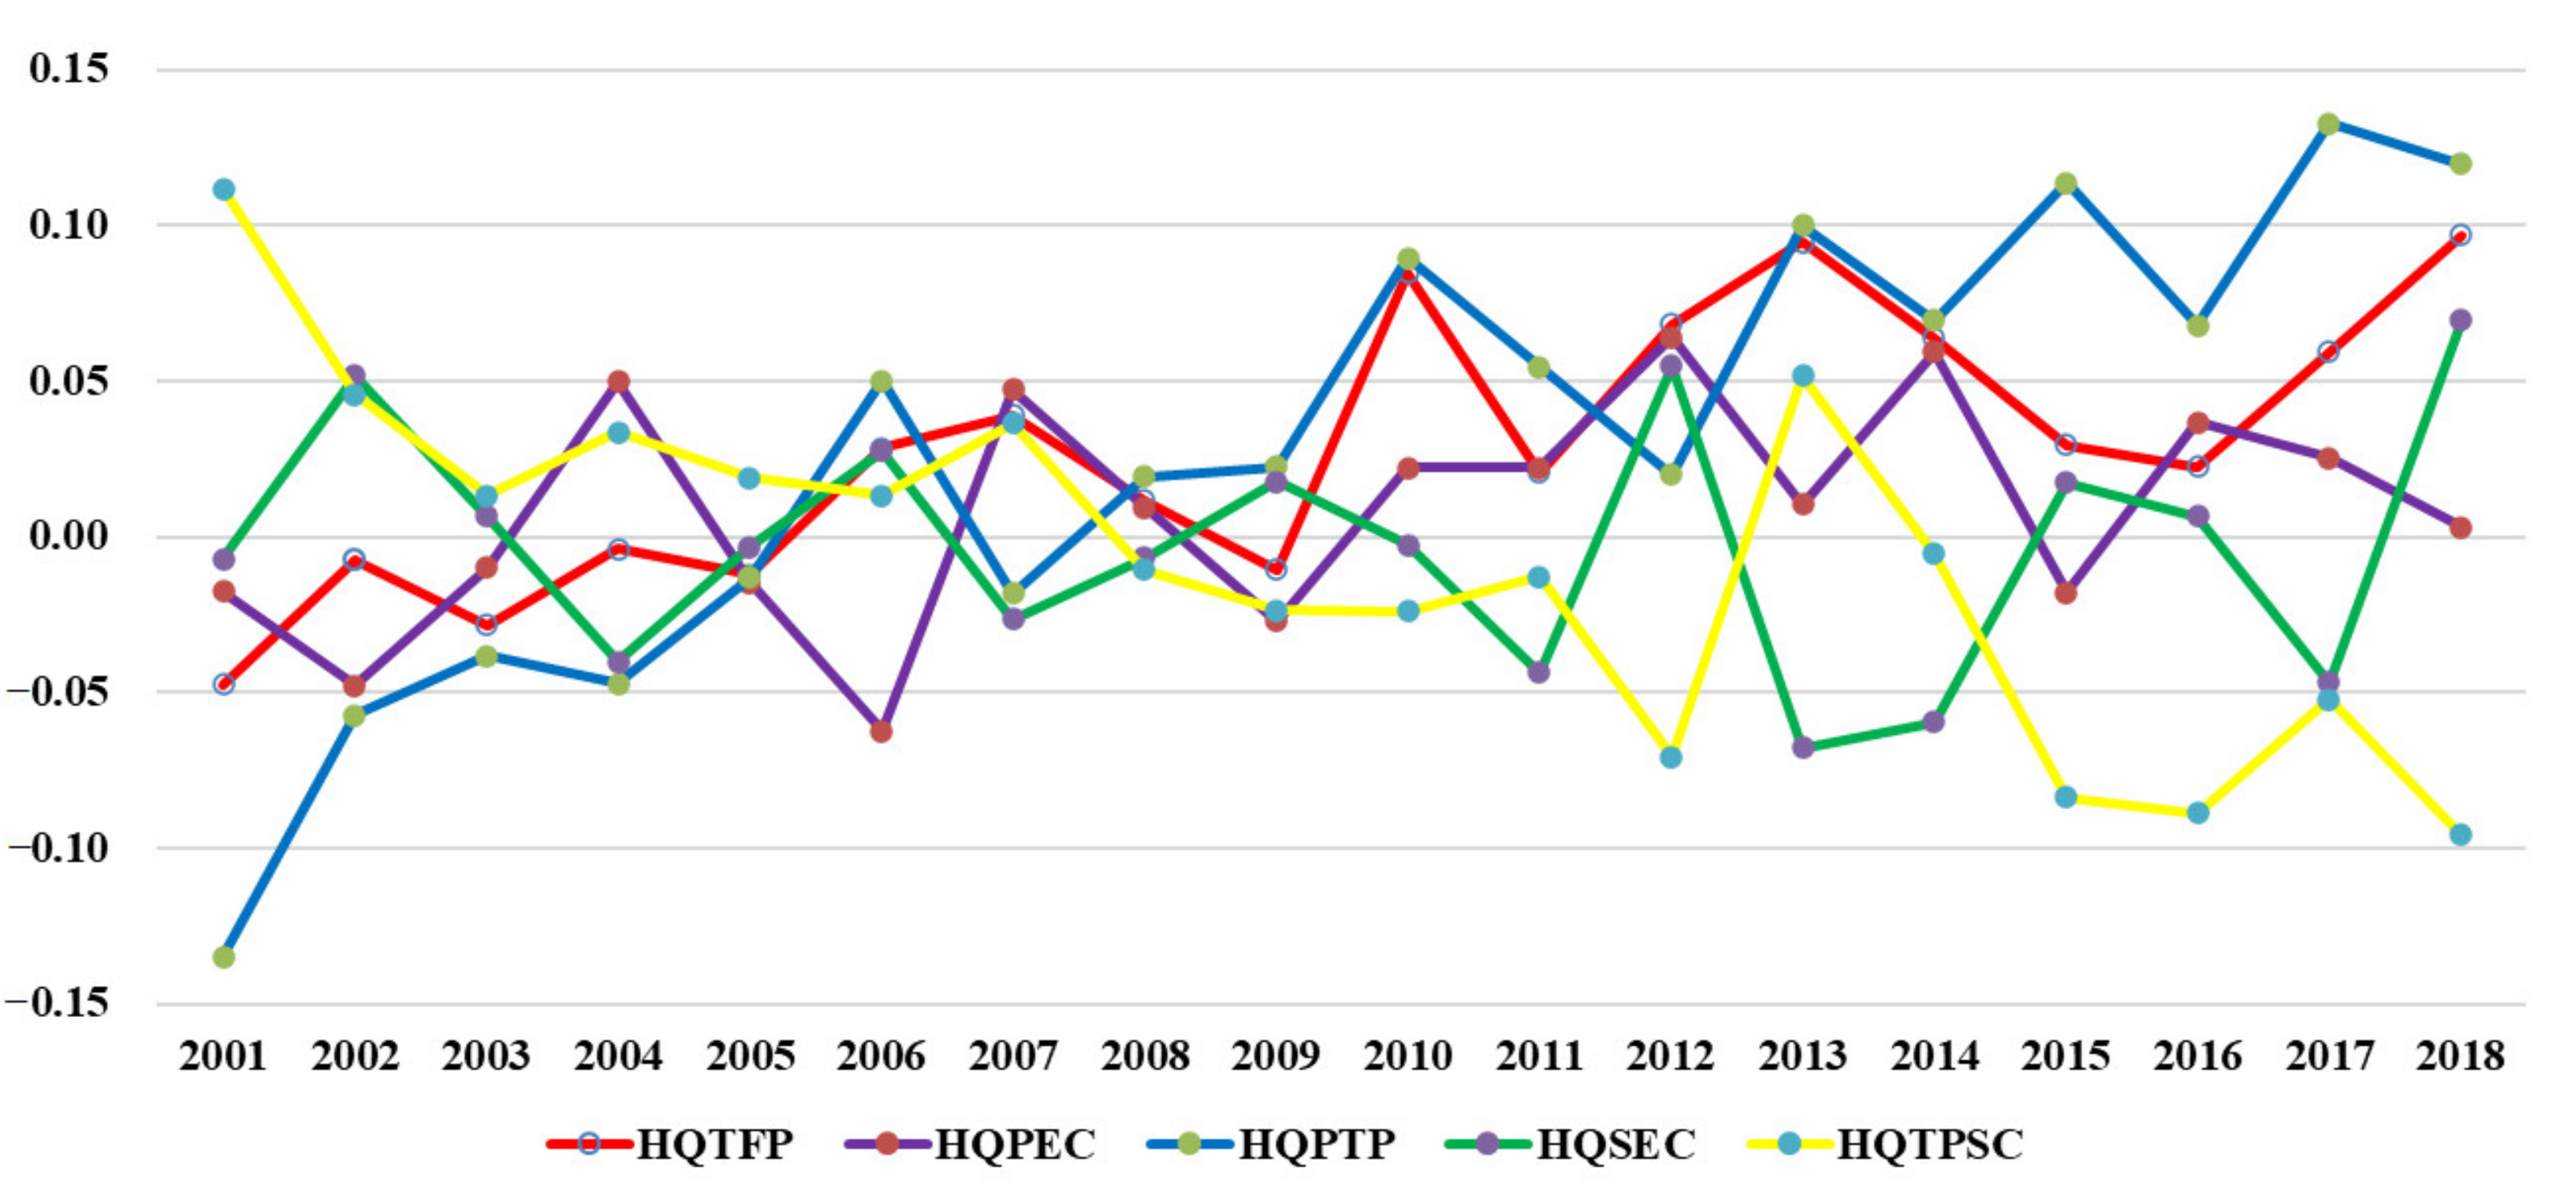
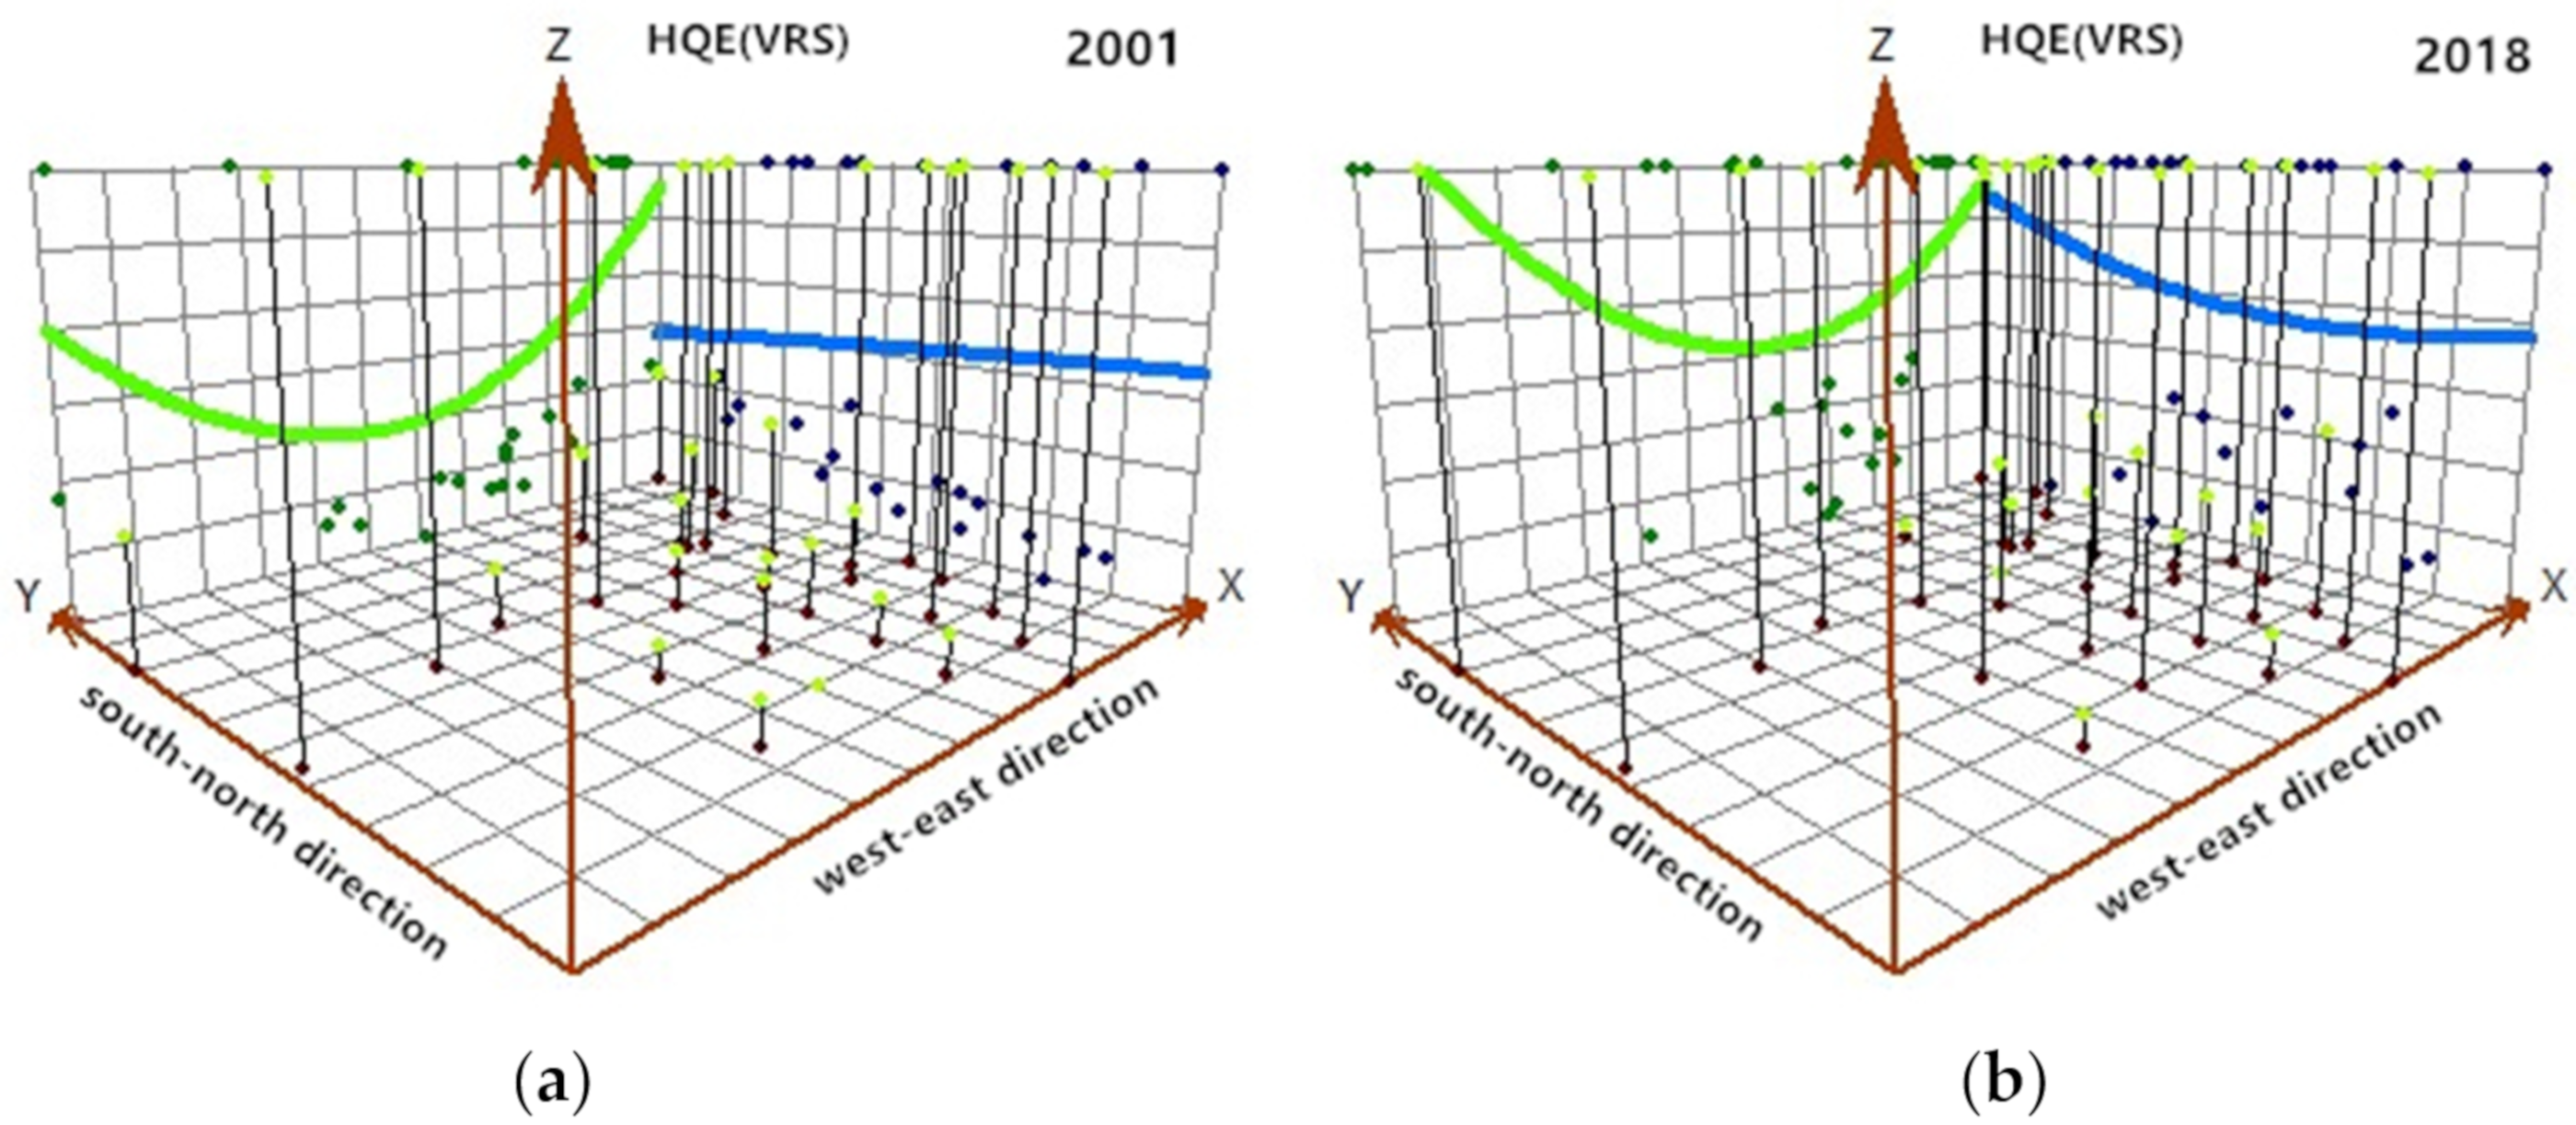
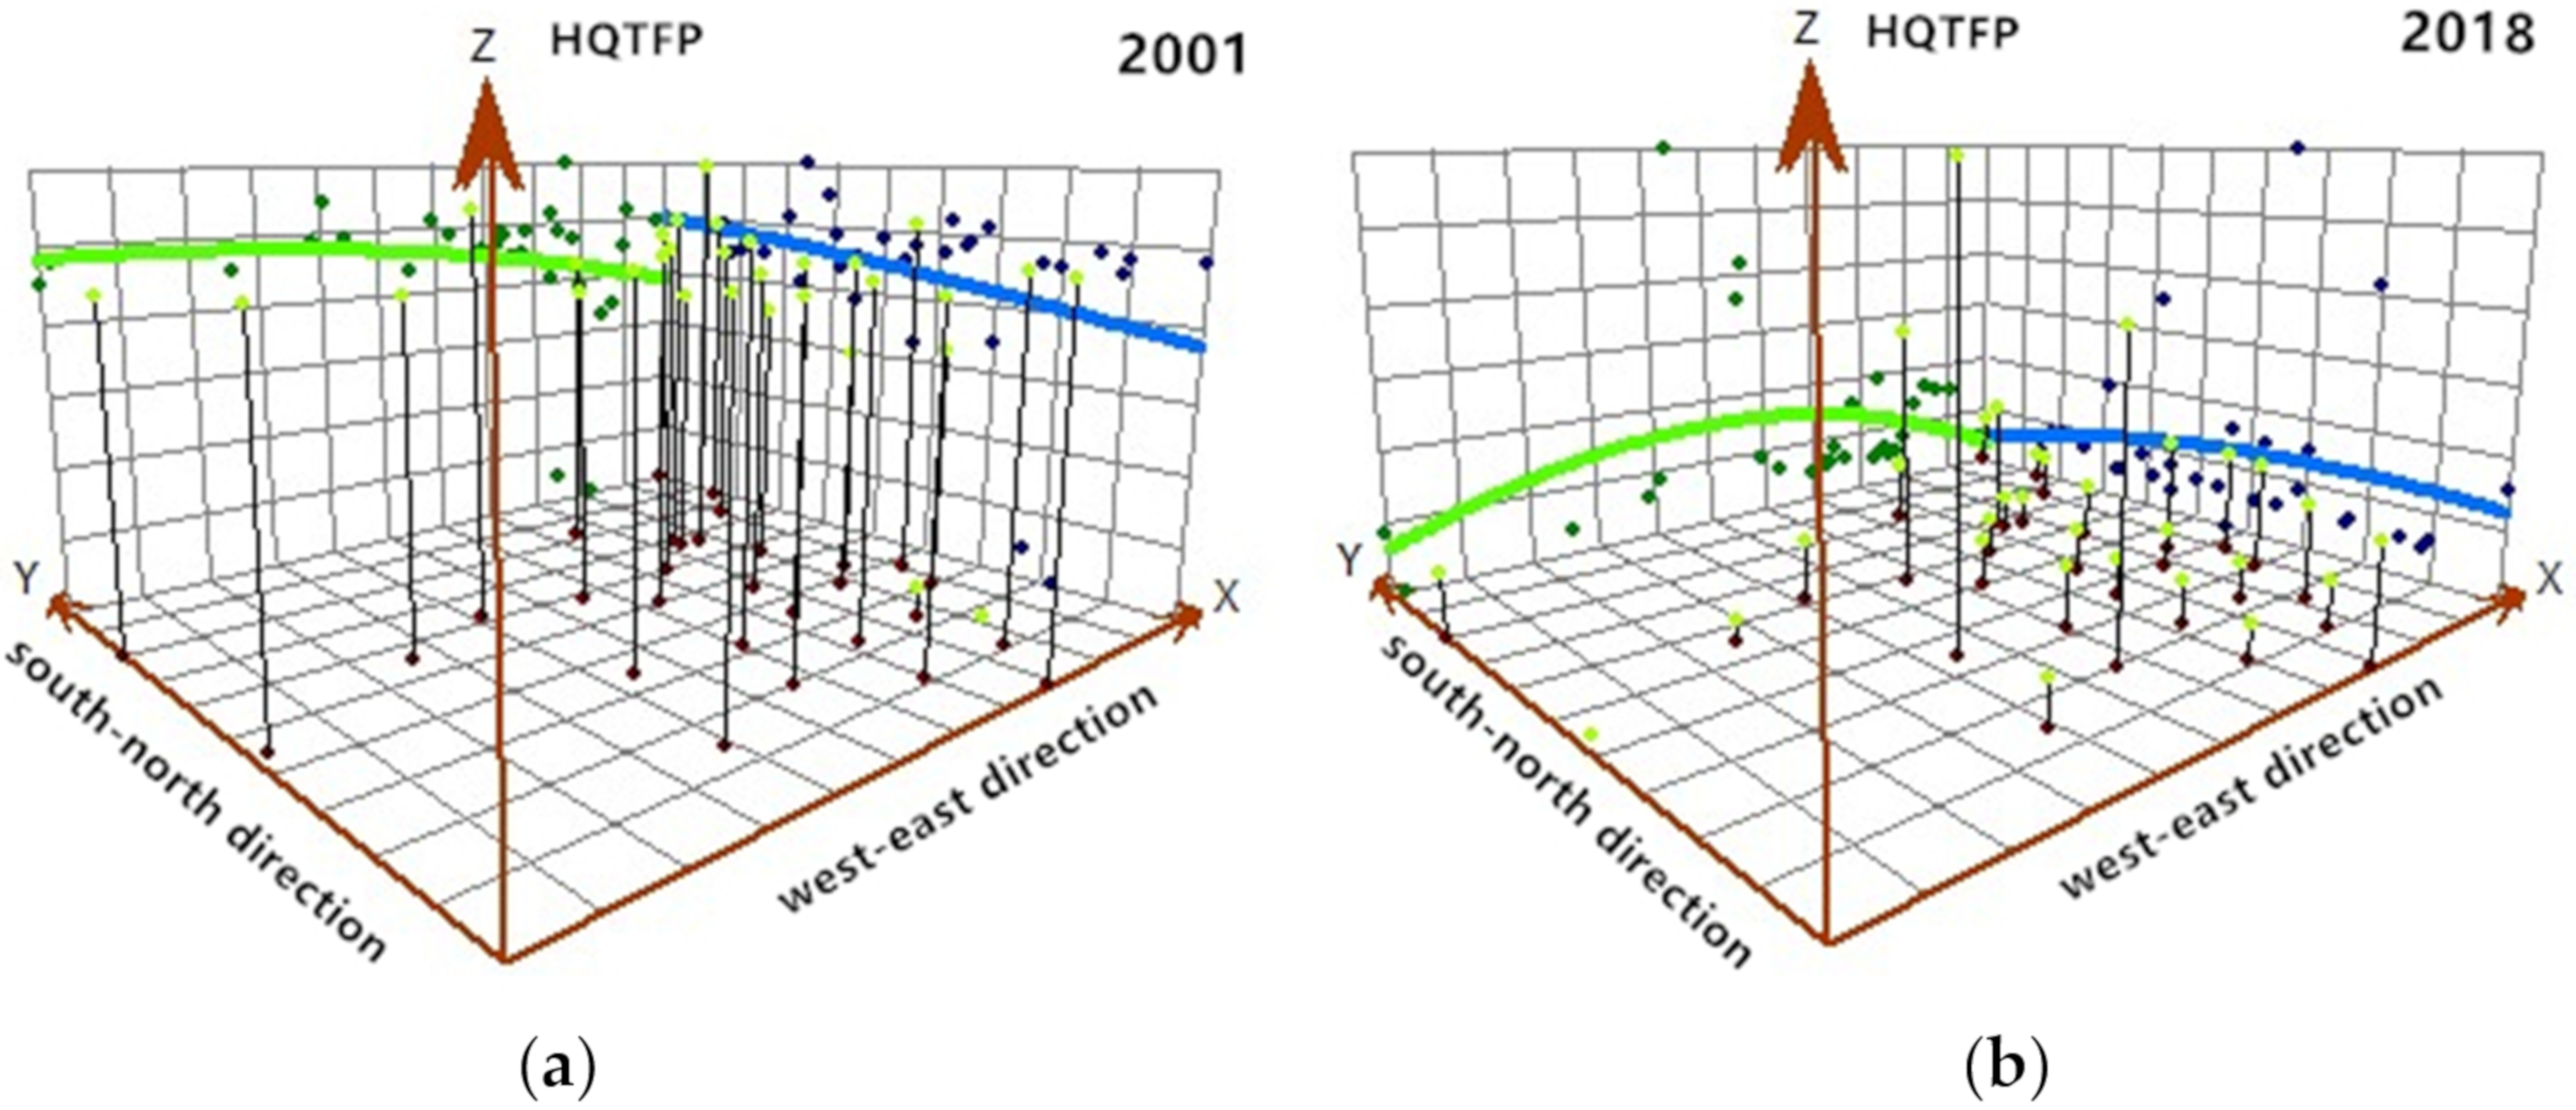
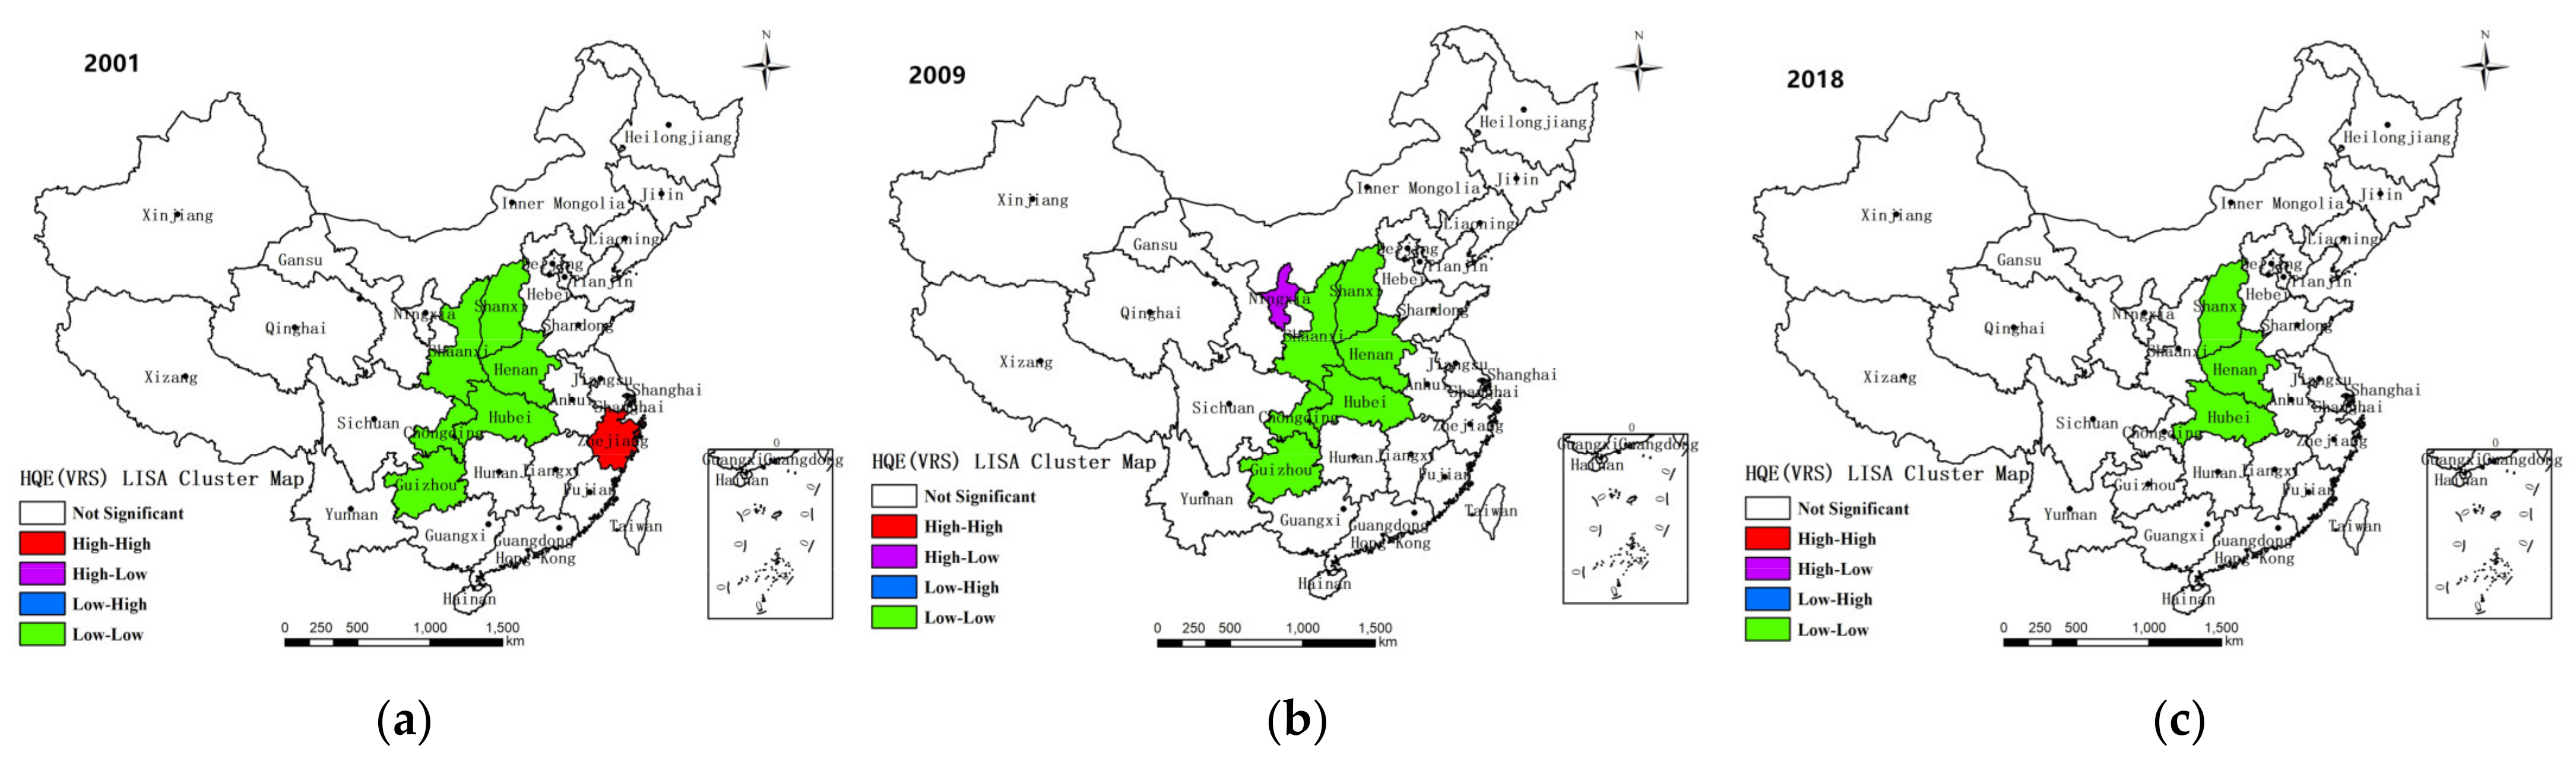
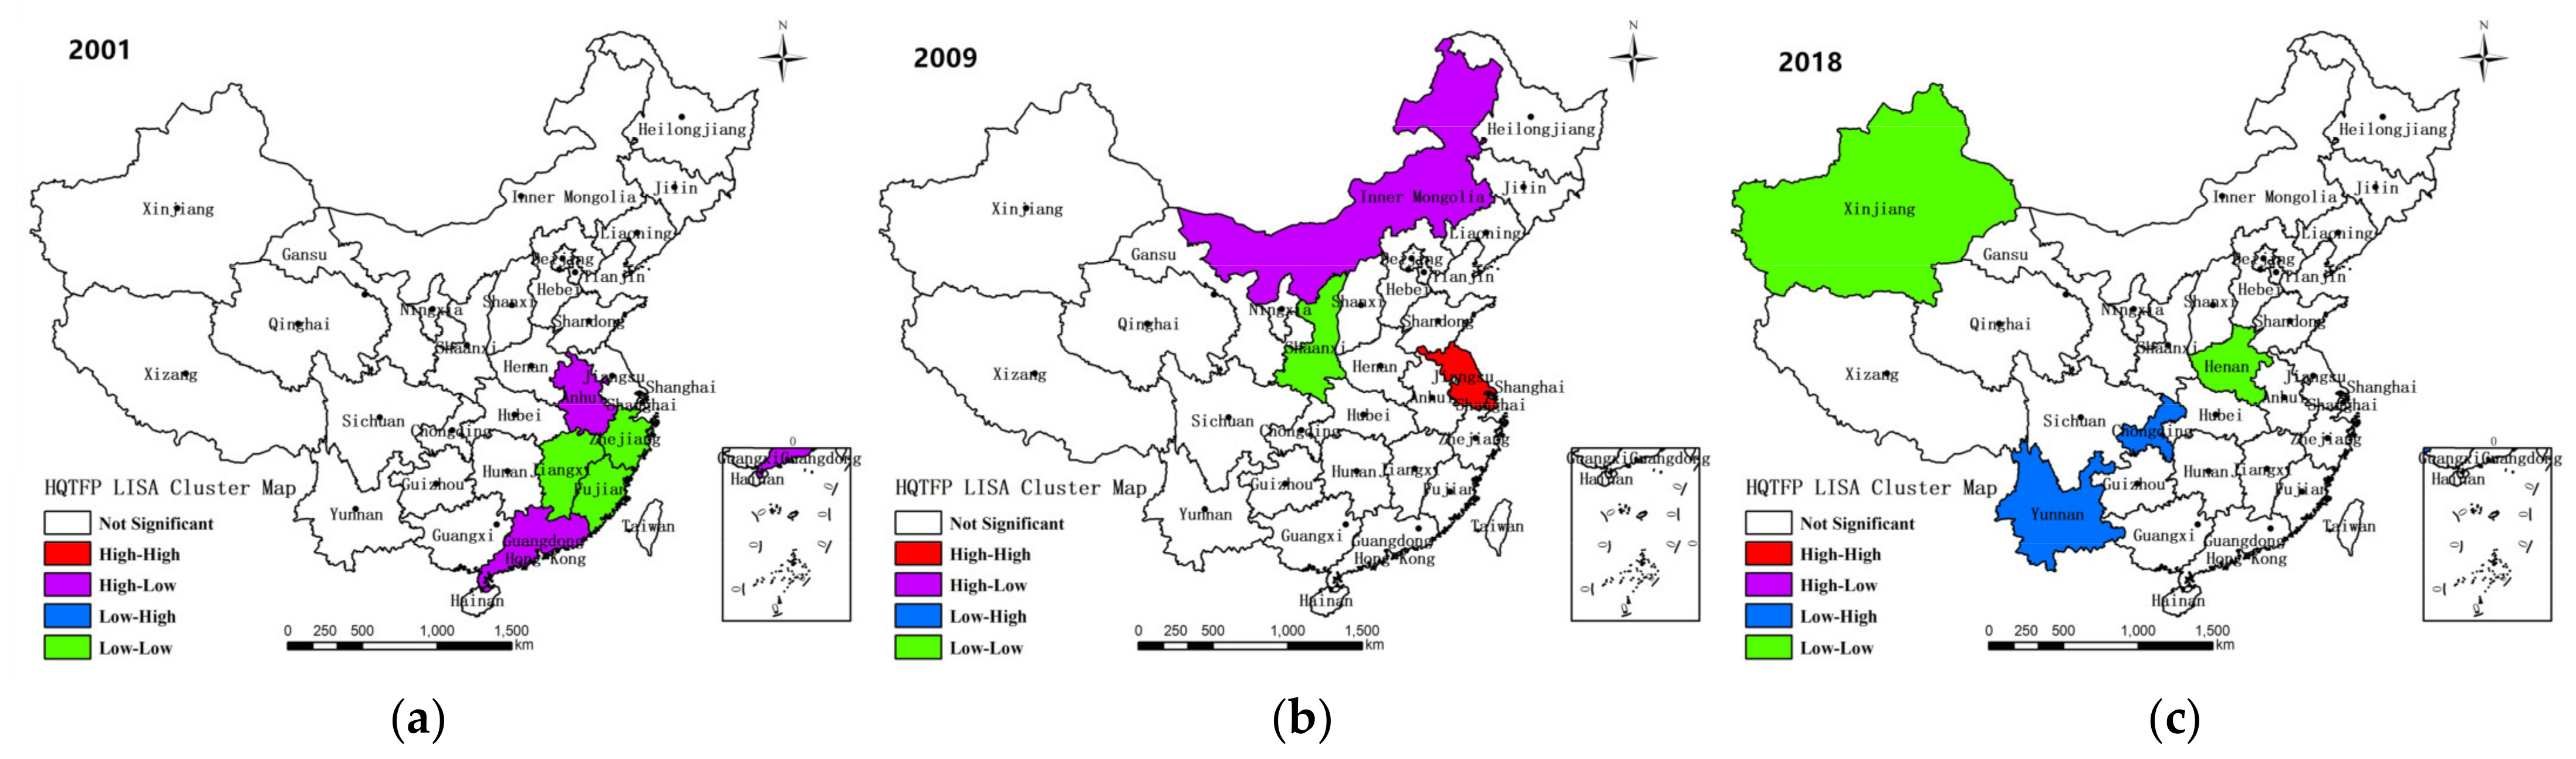
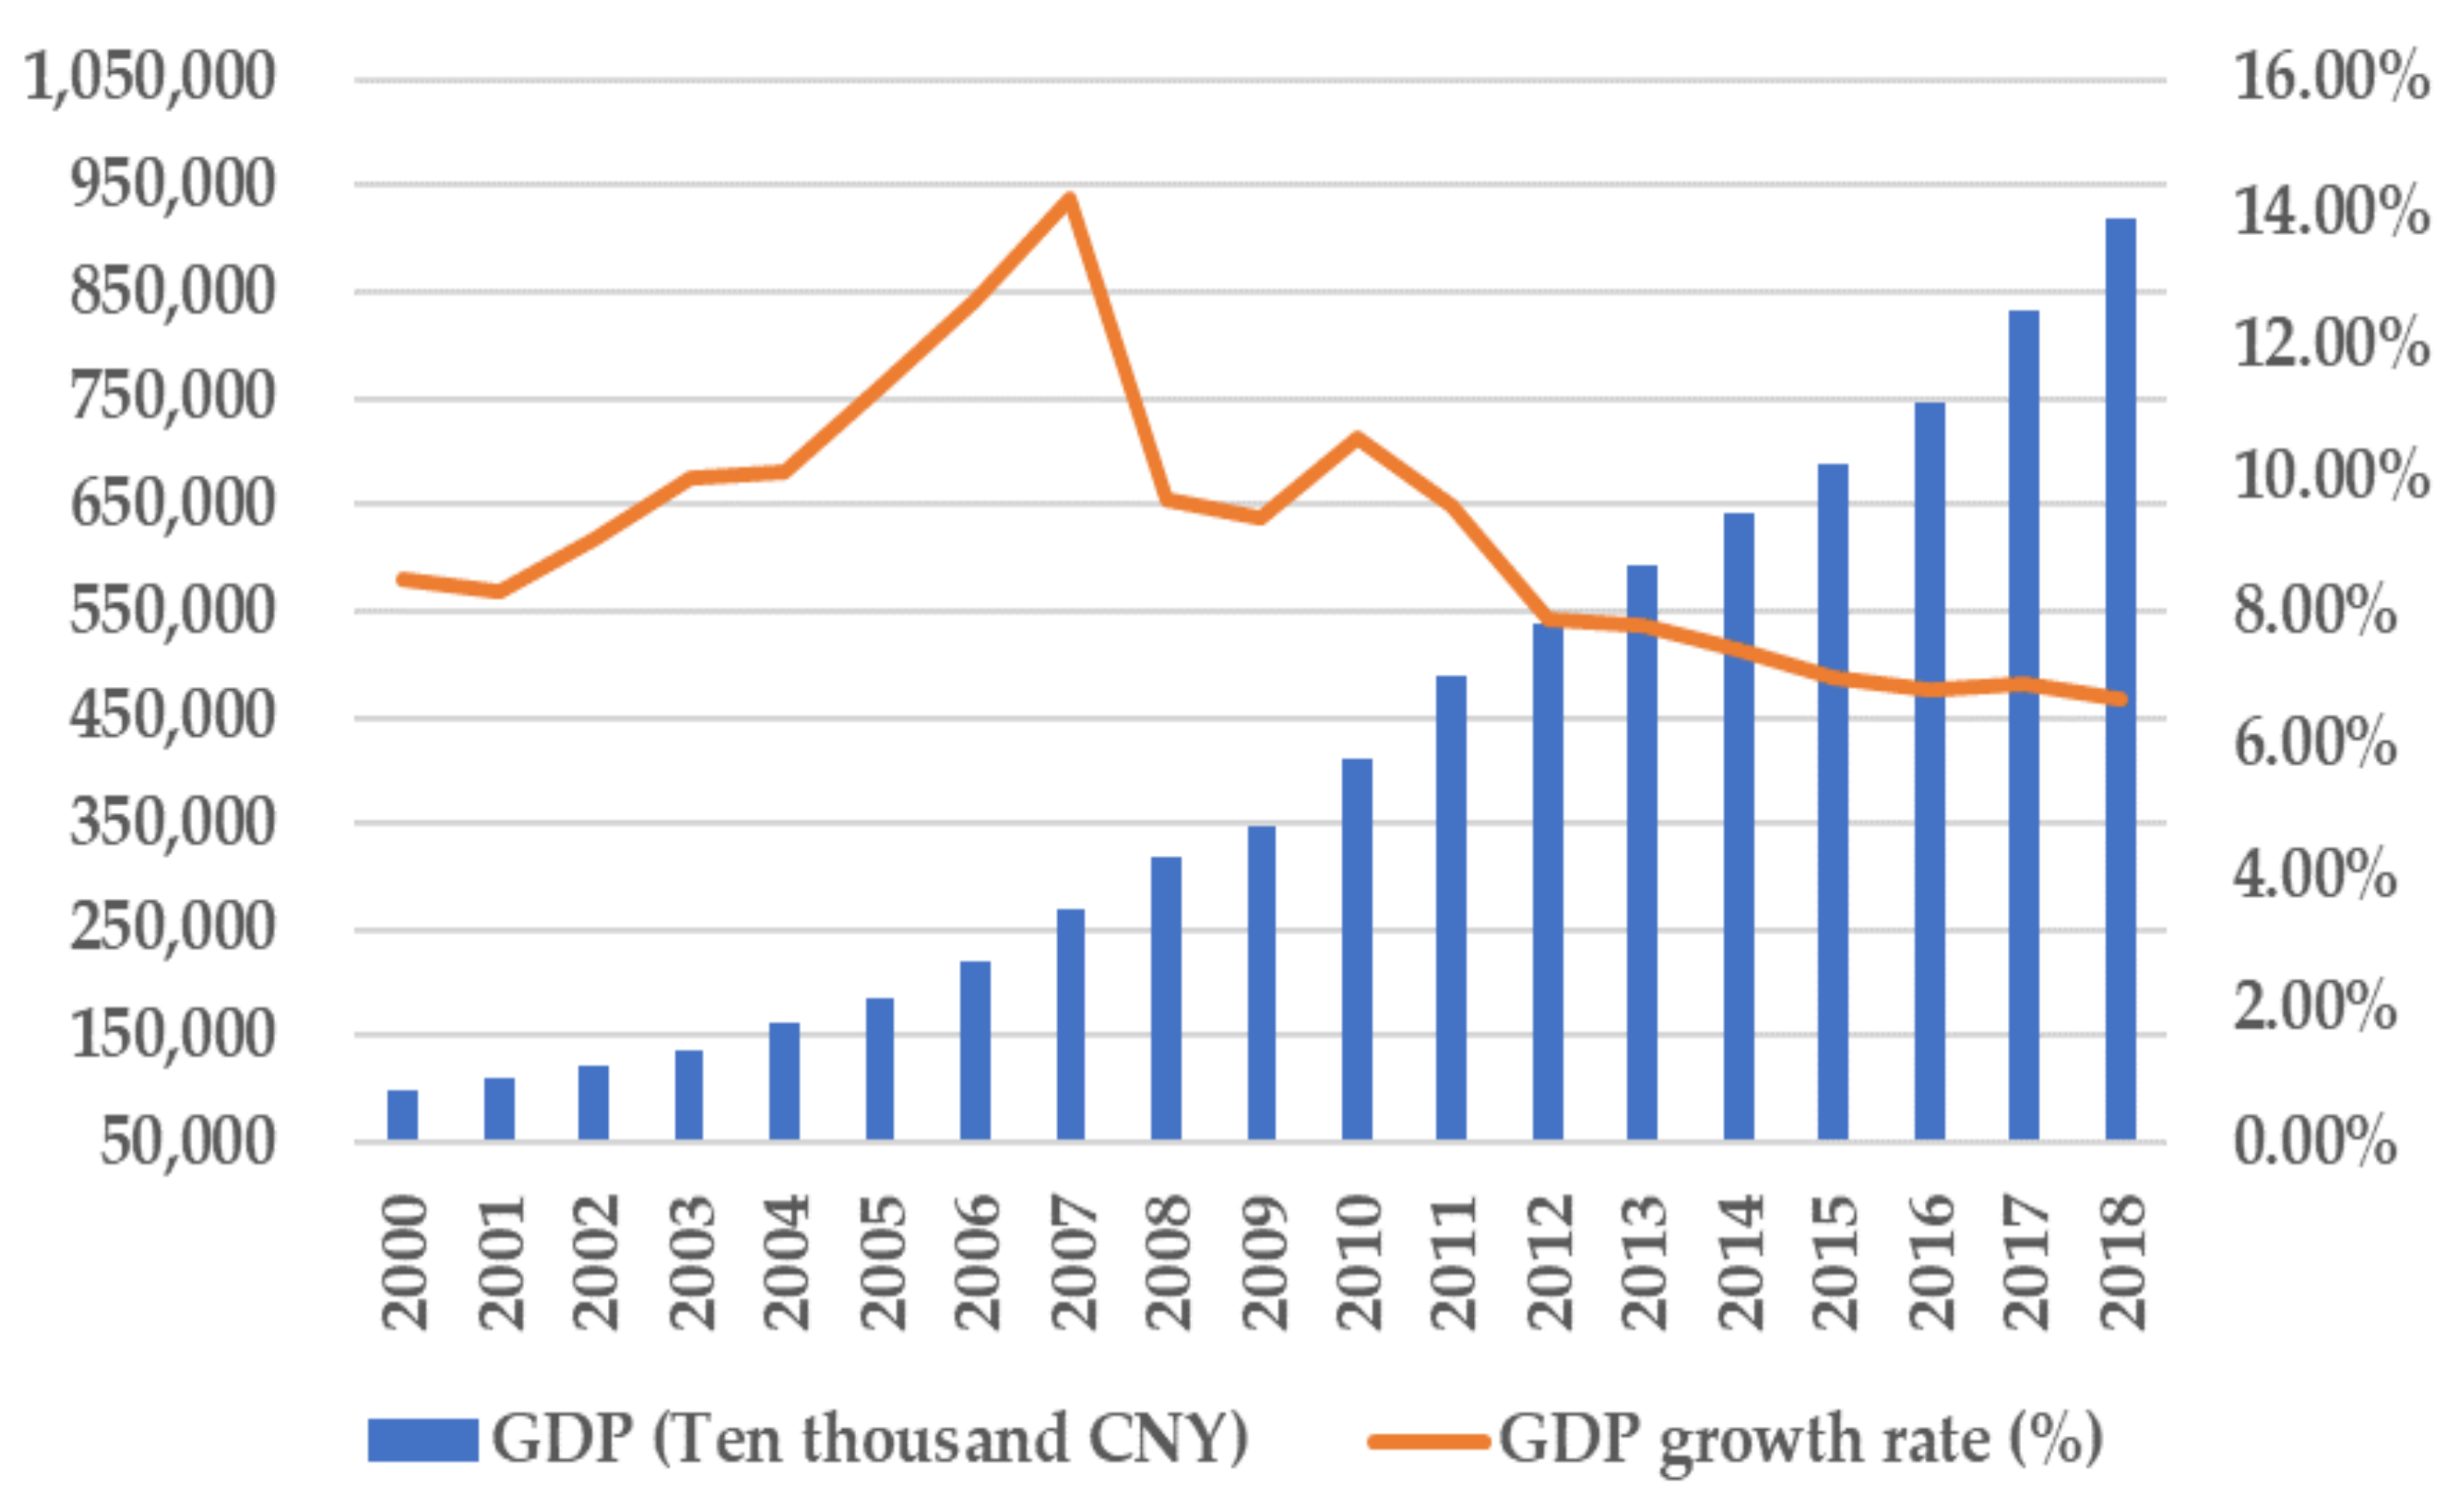
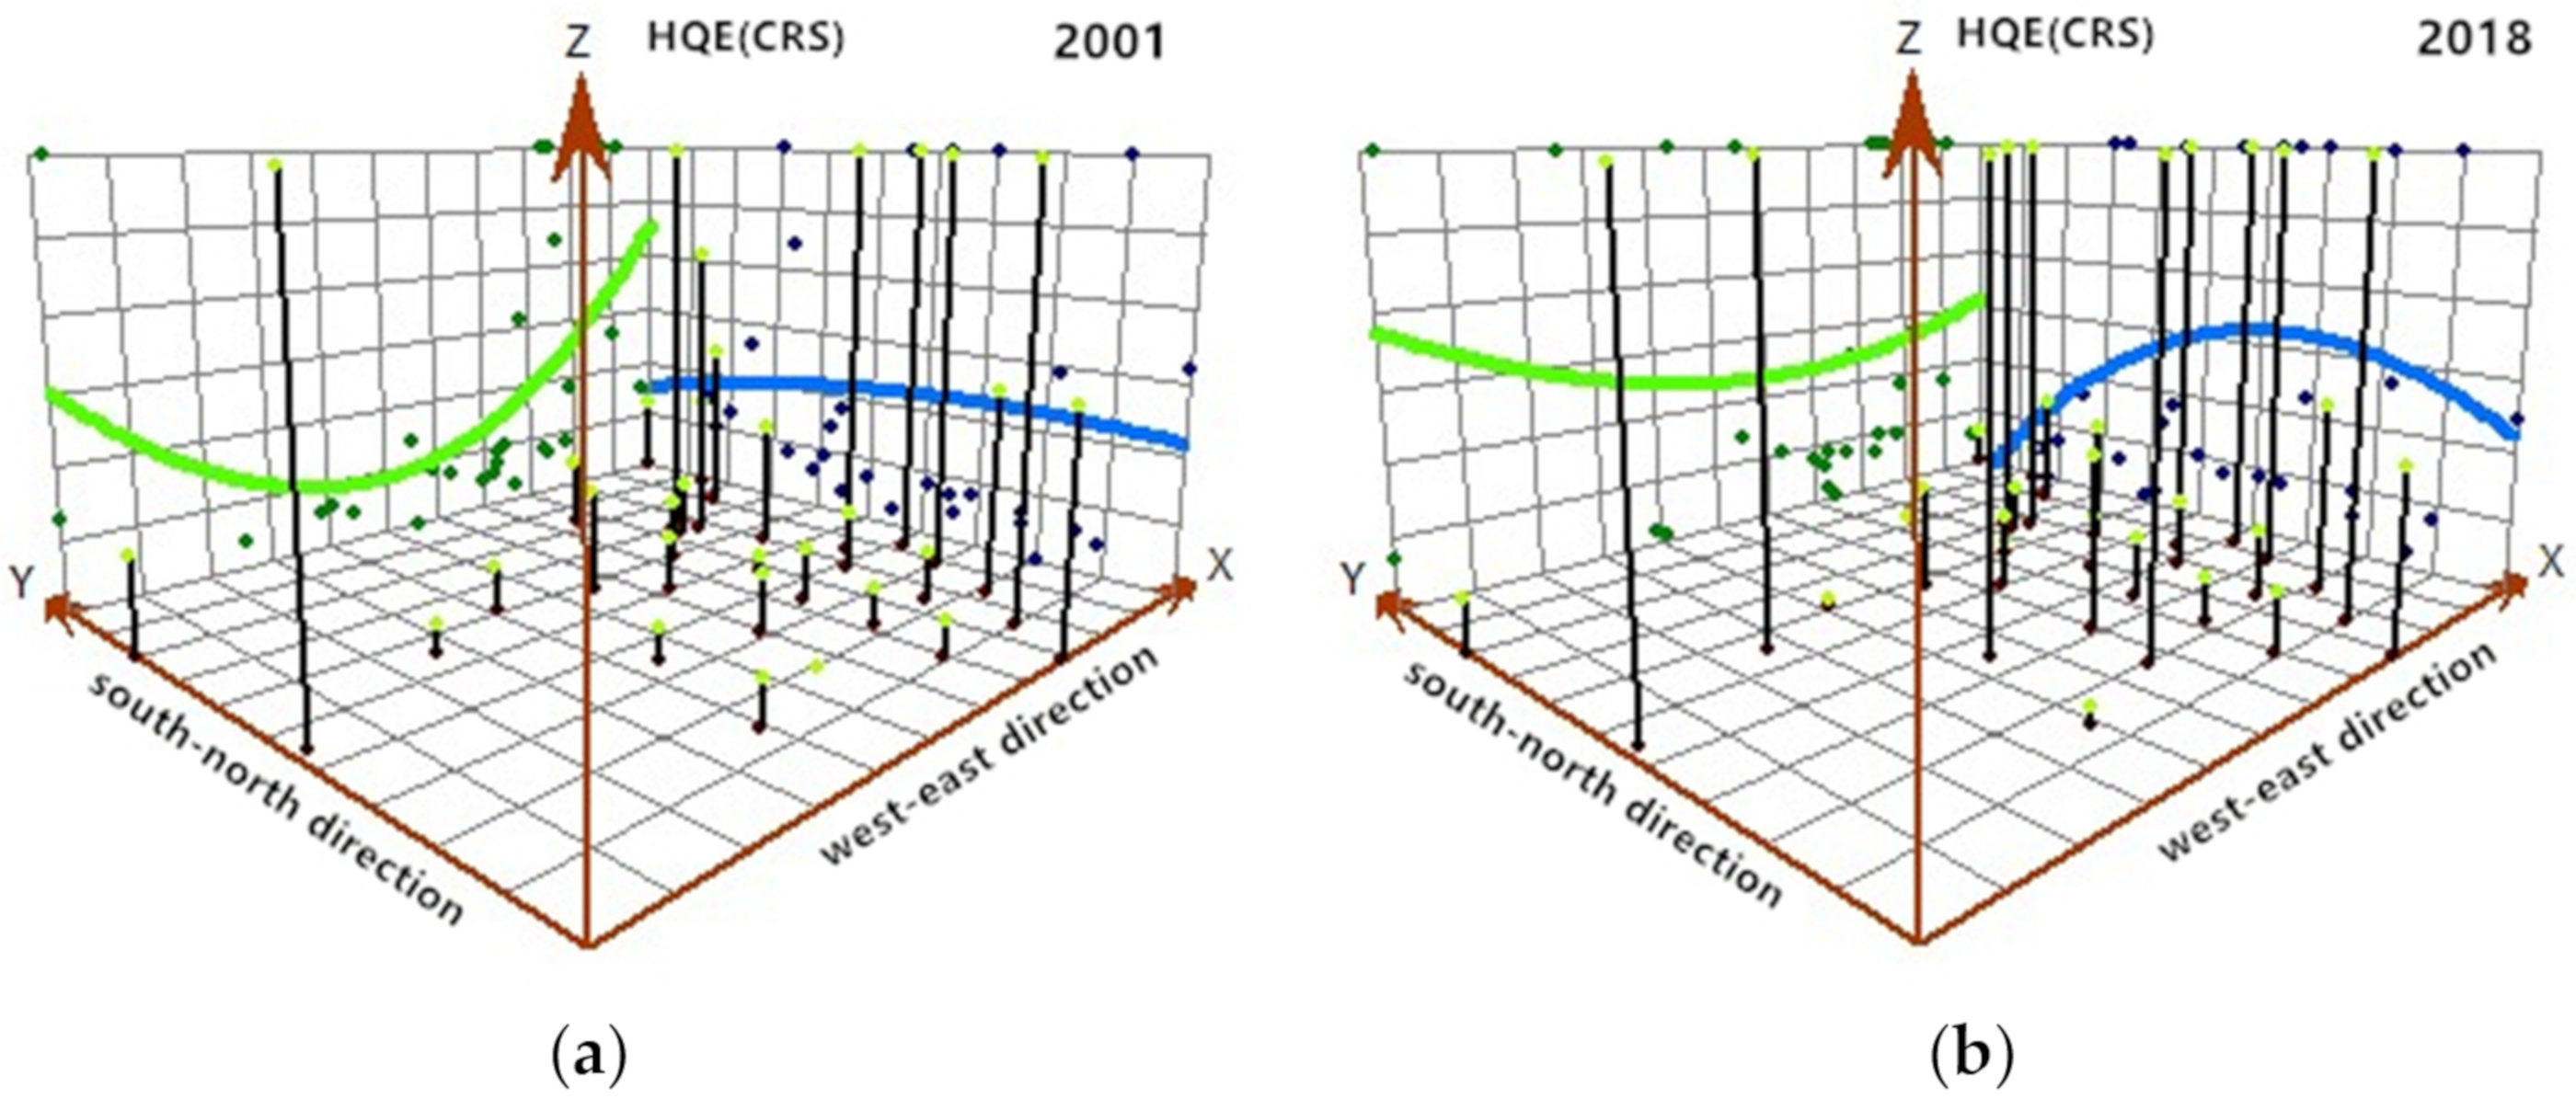
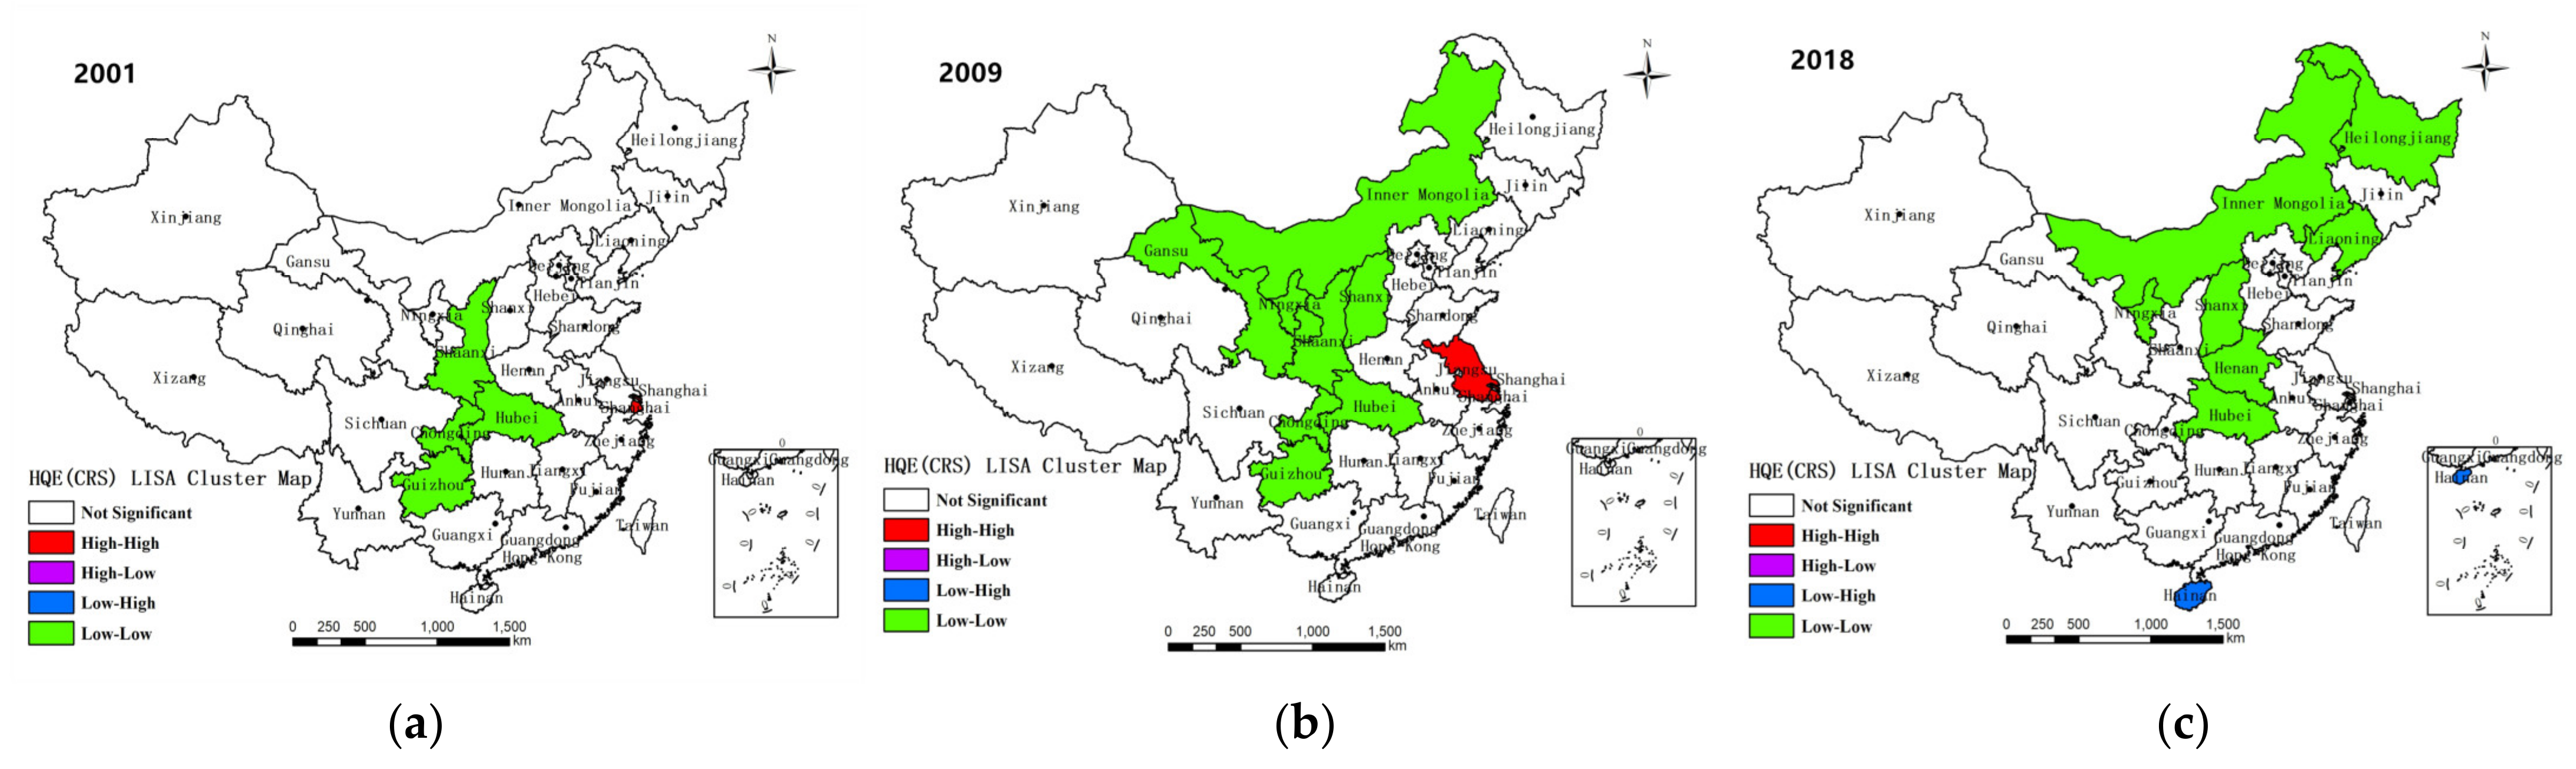
- From 2001 to 2018, the high-quality development TFP shows a fluctuating rising trend overall. The U and inverted-U trend lines show that the high-quality development efficiency has significant regional differences in the east–west direction, presenting a significant feature of spatial imbalance. The high-quality development TFP of the eastern regions is slightly higher than that of the western regions, and that of the northern regions is slightly higher than that of the southern regions. There is significant positive spatial autocorrelation in the high-quality development efficiency, which is mainly characterized by the L-L type.
- (3)
- The role of government, urbanization rate, and marketization levels have a positive and significant impact on high-quality development efficiency and TFP. Financial development, infrastructure, and foreign direct investment can improve the high-quality development efficiency but can also reduce high-quality development TFP. The capital–labor ratio has a negative and significant impact on high-quality development efficiency and TFP.
6.2. Main Contributions
6.3. Limitations and Future Research
Author Contributions
Funding
Institutional Review Board Statement
Informed Consent Statement
Data Availability Statement
Acknowledgments
Conflicts of Interest
References
- Zhong, J.; Li, T. Impact of financial development and its spatial spillover effect on green total factor productivity: Evidence from 30 provinces in China. Math. Probl. Eng. 2020, 26, 5741387. [Google Scholar] [CrossRef] [Green Version]
- Gu, W.T.; Wang, J.Y.; Hua, X.Y.; Liu, Z.D. Entrepreneurship and high-quality economic development: Based on the triple bottom line of sustainable development. Int. Entrep. Manag. J. 2020, 17, 1–27. [Google Scholar] [CrossRef]
- Zhang, J.K.; Hou, Y.Z.; Liu, P.L.; He, J.W.; Zhuo, X. The goal and strategic path of high-quality development. Manag. World 2019, 7, 1–7. (In Chinese) [Google Scholar]
- Sun, Y.F.; Ma, A.B.; Su, H.R.; Su, S.L.; Chen, F.; Wang, W.; Weng, M. Does the establishment of development zones really improve industrial land use efficiency? Implications for China’s high-quality development policy. Land Use Policy 2020, 90, 104265. [Google Scholar] [CrossRef]
- Jin, B. Study on the high-quality development economics. China Ind. Econ. 2018, 4, 5–18. (In Chinese) [Google Scholar]
- Jin, P.; Peng, C.; Song, M. Macroeconomic uncertainty, high-level innovation, and urban green development performance in China. China Econ. Rev. 2019, 55, 1–18. [Google Scholar] [CrossRef]
- Wei, M.; Li, S.H. Study on the measurement of economic high-quality development level in China in the new era. J. Quant. Tech. Econ. 2018, 11, 3–20. (In Chinese) [Google Scholar]
- Zhao, A.; Guan, H.; Sun, Z. Understanding high-quality development of marine economy in China: A literature review. Mar. Econ. Manag. 2019, 2, 124–130. [Google Scholar] [CrossRef]
- Chen, Z. A Study on the problems and countermeasures of the development of rural ecotourism in China. J. Adv. Econ. Financ. 2019, 4, 43–47. [Google Scholar] [CrossRef]
- Li, J.C.; Shi, L.M.; Xu, A.T. Discussion on evaluation index system of high-quality development. Stat. Res. 2019, 36, 4–14. (In Chinese) [Google Scholar]
- Ma, R.; Luo, H.; Wang, H.W.; Wang, T.C. Study of evaluating high-quality economic development in Chinese regions. China Soft Sci. 2019, 7, 60–67. (In Chinese) [Google Scholar]
- Wang, S.H.; Mao, C.S. Research on the construction of urban quality development evaluation system from the perspective of macro-quality. In Proceedings of the 5th International Conference on Social Science and Management (ICSSM 2020), Hangzhou, China, 11–12 January 2020; pp. 107–111. [Google Scholar]
- Wang, Q.; Ding, Y.W.; Guo, X.M. Construction of index system for high-quality development of county economy in China. Soft Sci. 2021, 35, 115–119. (In Chinese) [Google Scholar]
- Lu, C.C.; Cui, Y. Research on time and space convergence of China’s high-quality development regional gap. J. Quant. Tech. Econ. 2020, 37, 62–79. (In Chinese) [Google Scholar]
- Shi, D.; Li, P. Measurement and international comparison of China’s high-quality economic development. Southeast. Acad. 2019, 5, 169–180. (In Chinese) [Google Scholar]
- Sun, H.; Gui, H.Q.; Yang, D. Measurement and evaluation of the high-quality development of China’s provincial economy. Zhejiang Soc. Sci. 2020, 8, 4–14. (In Chinese) [Google Scholar]
- Davidovic, M.; Uzelac, O.; Zelenovic, V. Efficiency dynamics of the Croatian banking industry: DEA investigation. Econ. Res. 2019, 32, 33–49. [Google Scholar] [CrossRef] [Green Version]
- Masuda, K. Eco-Efficiency Assessment of intensive rice production in Japan: Joint application of life cycle assessment and data envelopment analysis. Sustainability 2019, 11, 5368. [Google Scholar] [CrossRef] [Green Version]
- Hung, S.-W.; Chang, C.-L.; Liu, S.M. Innovation system assessment model for sustainability planning in Taiwan. Sustainability 2019, 11, 7040. [Google Scholar] [CrossRef]
- Lin, Y.; Wang, Y.M.; Shi, H.L. Mergers and acquisitions matching for performance improvement: A DEA-based approach. Econ. Res. 2020, 33, 3545–3561. [Google Scholar]
- Lovell, C.K.; Pastor, J.T. Radial DEA models without inputs or without outputs. Eur. J. Oper. Res. 1999, 118, 46–51. [Google Scholar] [CrossRef]
- Hu, X.Y.; Li, J.S.; Li, X.Y.; Cui, J.C. A revised inverse data envelopment analysis model based on radial models. Mathematics 2020, 8, 803. [Google Scholar] [CrossRef]
- Khan, I.U.; Karam, F.W. Intelligent business analytics using proposed input/output oriented data envelopment analysis DEA and slack based DEA models for US-airlines. J. Intell. Fuzzy Syst. 2019, 37, 8207–8217. [Google Scholar] [CrossRef]
- Amini, A.; Alinezhad, A.; Yazdipoor, F. A TOPSIS, VIKOR and DEA integrated evaluation method with belief structure under uncertainty to rank alternatives. Int. J. Adv. Oper. Manag. 2019, 11, 171–188. [Google Scholar]
- Tavana, M.; Khalili-Damghani, K.; Arteaga, F.J.S.; Hosseini, A. A fuzzy multi-objective multi-period network DEA model for efficiency measurement in oil refineries. Comput. Ind. Eng. 2019, 135, 143–155. [Google Scholar] [CrossRef]
- Gökgöz, F.; Güvercin, M.T. Energy security and renewable energy efficiency in EU. Renew. Sustain. Energy Rev 2018, 96, 226–239. [Google Scholar] [CrossRef]
- Chen, X.; Liu, X.; Gong, Z.; Xie, J. Three-stage super-efficiency DEA models based on the cooperative game and its application on the R&D green innovation of the Chinese high-tech industry. Comput. Ind. Eng. 2021, 156, 107234. [Google Scholar] [CrossRef]
- Yin, Q.; Wang, Y.; Wan, K.; Wang, D. Evaluation of green transformation efficiency in Chinese mineral resource-based cities based on a three-stage DEA method. Sustainability 2020, 12, 9455. [Google Scholar] [CrossRef]
- Guo, Y.R.; Hu, Y.; Shi, K.; Bilan, Y. Valuation of water resource green efficiency based on SBM–TOBIT panel model: Case study from Henan province, China. Sustainability 2020, 12, 6944. [Google Scholar] [CrossRef]
- Bigerna, S.; D’Errico, M.C.; Polinori, P. Environmental and energy efficiency of EU electricity industry: An almost spatial two stages DEA approach. Energy J. 2019, 40, 31–56. [Google Scholar] [CrossRef]
- Yu, D.S.; Li, X.P.; Yu, J.J.; Li, H. The impact of the spatial agglomeration of foreign direct investment on green total factor productivity of Chinese cities. J. Environ. Manag. 2021, 290, 112666. [Google Scholar] [CrossRef]
- Amri, F. Carbon dioxide emissions, total factor productivity, ICT, trade, financial development, and energy consumption: Testing environmental Kuznets curve hypothesis for Tunisia. Environ. Sci. Pollut. Res. 2018, 25, 33691–33701. [Google Scholar] [CrossRef]
- Adnan, N.; Nordin, S.M. How COVID 19 effect Malaysian paddy industry? Adoption of green fertilizer a potential resolution. Environ. Dev. Sustain. 2020, 23, 1–41. [Google Scholar] [CrossRef] [PubMed]
- Song, X.; Hao, Y.; Zhu, X. Analysis of the environmental efficiency of the Chinese transportation sector using an undesirable output slacks-based measure data envelopment analysis model. Sustainability 2015, 7, 9187–9206. [Google Scholar] [CrossRef] [Green Version]
- Zhang, J.; Kang, L.; Li, H.; Ballesteros-Pérez, P.; Skitmore, M.; Zuo, J. The impact of environmental regulations on urban green innovation efficiency: The case of Xi’an. Sustain. Cities Soc. 2020, 57, 102123. [Google Scholar] [CrossRef]
- Fukuyama, H.; Weber, W.L. A directional slacks-based measure of technical inefficiency. Socio. Econ. Plan. Sci. 2009, 43, 274–287. [Google Scholar] [CrossRef]
- Tone, K. A slacks-based measure of efficiency in data envelopment analysis. Eur. J. Oper. Res. 2001, 130, 498–509. [Google Scholar] [CrossRef] [Green Version]
- Hou, J.; Chen, H.; Xu, J. External knowledge sourcing and green innovation growth with environmental and energy regulations: Evidence from manufacturing in China. Sustainability 2017, 9, 342. [Google Scholar] [CrossRef] [Green Version]
- Lan, S.; Tseng, M.L.; Yang, C.; Huisingh, D. Trends in sustainable logistics in major cities in China. Sci. Total Environ. 2020, 712, 136381. [Google Scholar] [CrossRef]
- Färe, R.; Grosskopf, S. Directional distance functions and slacks-based measures of efficiency. Eur. J. Oper. Res. 2010, 200, 320–322. [Google Scholar] [CrossRef]
- Lin, R.; Chen, Z. Super-efficiency measurement under variable return to scale: An approach based on a new directional distance function. J. Oper. Res. Soc. 2015, 66, 1506–1510. [Google Scholar] [CrossRef]
- Yildirim, C.; Kacak, H.; Yildirim, S.; Kavuncubasi, S. Comprehensive efficiency assessment of Turkish teaching hospitals: Technical, pure technical and scale efficiencies with data envelopment analysis. J. Appl. Bus. Econ. 2019, 21, 124–140. [Google Scholar]
- Wang, Y.; Sun, X.; Guo, X. Environmental regulation and green productivity growth: Empirical evidence on the porter hypothesis from OECD industrial sectors. Energ. Policy 2019, 132, 611–619. [Google Scholar] [CrossRef]
- Li, H.; Li, B. The threshold effect of environmental regulation on the green transition of the industrial economy in China. Econ. Res. 2019, 32, 3134–3149. [Google Scholar] [CrossRef] [Green Version]
- Miao, Z.; Chen, X.; Baležentis, T.; Sun, C. Atmospheric environmental productivity across the provinces of China: Joint decomposition of range adjusted measure and Luenberger productivity indicator. Energy Policy 2019, 132, 665–677. [Google Scholar] [CrossRef]
- Shen, Z.; Baležentis, T.; Ferrier, G.D. Agricultural productivity evolution in China: A generalized decomposition of the Luenberger-Hicks-Moorsteen productivity indicator. China Econ. Rev. 2019, 57, 101315. [Google Scholar] [CrossRef]
- Hao, J.; Shi, H.; Shi, V.; Yang, C. Adoption of automatic warehousing systems in logistics firms: A technology–organization–environment framework. Sustainability 2020, 12, 5185. [Google Scholar] [CrossRef]
- Lu, X.; Xu, C. The difference and convergence of total factor productivity of inter-provincial water resources in China based on three-stage DEA-Malmquist index model. Sustain. Comput. Inform. 2019, 22, 75–83. [Google Scholar] [CrossRef]
- Li, W.T.; Feng, R.H.; Li, T.; Du, Y.B.; Zhou, N.; Hong, X.Q.; Yi, S.H.; Zha, W.T.; Lv, Y. Spatial-temporal analysis and visualization of scarlet fever in mainland China from 2004 to 2017. Geospat. Health 2020, 15, 33–41. [Google Scholar] [CrossRef] [Green Version]
- Habeeb, R.; Gupta, Y.; Chinwan, H.; Barker, E. Assessing demographic and water sensitivities arising due to urban water insecurity in Haldwani, Uttarakhand (India): A GIS-based spatial analysis. J. Geovis. Spat. Anal. 2019, 3, 1–19. [Google Scholar] [CrossRef]
- Kumari, M.; Sarma, K.; Sharma, R. Using moran’s I and GIS to study the spatial pattern of land surface temperature in relation to land use/cover around a thermal power plant in Singrauli district, Madhya Pradesh, India. Remote Sens. Appl. Soc. Environ. 2019, 15, 100239. [Google Scholar] [CrossRef]
- Wu, X.; Li, B.; Li, M.; Guo, M.; Zang, S.; Zhang, S. Examining the relationship between spatial configurations of urban impervious surfaces and land surface temperature. Chin. Geogr. Sci. 2019, 29, 568–578. [Google Scholar] [CrossRef] [Green Version]
- Feng, C.; Wang, M. Journey for green development transformation of China’s metal industry: A spatial econometric analysis. J. Clean. Prod. 2019, 225, 1105–1117. [Google Scholar] [CrossRef]
- Yang, Z.; Fang, H. Research on green productivity of Chinese real estate companies-based on SBM-DEA and TOBIT models. Sustainability 2020, 12, 3122. [Google Scholar] [CrossRef] [Green Version]
- Shuai, S.; Fan, Z. Modeling the role of environmental regulations in regional green economy efficiency of China: Empirical evidence from super efficiency DEA-Tobit model. J. Environ. Manag. 2020, 261, 110227. [Google Scholar] [CrossRef]
- Xu, K.; Bossink, B.; Chen, Q. Efficiency evaluation of regional sustainable innovation in China: A slack-based measure (SBM) model with undesirable outputs. Sustainability 2020, 12, 31. [Google Scholar] [CrossRef] [Green Version]
- Xu, J.; Huang, D.; He, Z.; Zhu, Y. Research on the structural features and influential factors of the spatial network of China’s regional ecological efficiency spillover. Sustainability 2020, 12, 3137. [Google Scholar] [CrossRef] [Green Version]
- Cui, X.; Fang, C.; Liu, H.; Liu, X. Assessing sustainability of urbanization by a coordinated development index for an urbanization-resources-environment complex system: A case study of Jing-Jin-Ji region, China. Ecol. Indic. 2019, 96, 383–391. [Google Scholar] [CrossRef]
- Tian, D.; Zhao, F.; Mu, W.; Kanianska, R.; Feng, J. Environmental efficiency of Chinese open-field grape production: An evaluation using data envelopment analysis and spatial autocorrelation. Sustainability 2016, 8, 1246. [Google Scholar] [CrossRef] [Green Version]
- Zhang, J.; Zhang, N.; Bai, S. Assessing the carbon emission changing for sustainability and high-quality economic development. Environ. Technol. Inno. 2021, 22, 101464. [Google Scholar] [CrossRef]
- Wadim, S.; Tatyana, V.; Manuela, T.; Natalja, L. Economic efficiency and energy security of smart cities. Econ. Res. 2020, 33, 788–803. [Google Scholar]
- Li, Y.; Chen, Y.Y. Development of an SBM-ML model for the measurement of green total factor productivity: The case of pearl river delta urban agglomeration. Renew. Sustain. Energy Rev. 2021, 145, 111131. [Google Scholar] [CrossRef]
- Hou, S.Y.; Song, L.R. Market integration and regional green total factor productivity: Evidence from China’s province-level data. Sustainability 2021, 13, 472. [Google Scholar] [CrossRef]
- Ahmed, E.M. Green TFP intensity impact on sustainable East Asian productivity growth. Econ. Anal. Policy 2012, 42, 67–78. [Google Scholar] [CrossRef]
- Pishdar, M.; Shakib, M.D.; Antucheviciene, J.; Vilkonis, A. Interval type-2 fuzzy super SBM network DEA for assessing sustainability performance of third-party logistics service providers considering circular economy strategies in the era of industry 4.0. Sustainability 2021, 13, 6497. [Google Scholar] [CrossRef]
- Bansal, P.; Mehra, A.; Kumar, S. Dynamic metafrontier malmquist–luenberger productivity index in network DEA: An application to banking data. Comput. Econ. 2021. [Google Scholar] [CrossRef]
- Chen, Y.F.; Cheng, S.Y.; Zhu, Z.T. Measuring environmental-adjusted dynamic energy efficiency of China’s transportation sector: A four-stage NDDF-DEA approach. Energy Effic. 2021, 14, 1–14. [Google Scholar] [CrossRef]
- Justas, S.; Zhuang, M.; Tomas, B. Creation of climate-smart and energy-efficient agriculture in the European Union: Pathways based on the frontier analysis. Bus. Strategy Env. 2021, 30, 576–589. [Google Scholar]
- Tan, X.; Choi, Y.; Wang, B.; Huang, X. Does China’s carbon regulatory policy improve total factor carbon efficiency? A fixed-effect panel stochastic frontier analysis. Technol. Forecast. Soc. 2020, 160, 120222. [Google Scholar] [CrossRef]


| Type | Indicator | Definition | Unit |
|---|---|---|---|
| Input indicators | Labor | Number of employees in the whole society | Ten thousand people |
| Financial capital | Capital stock | Hundred million CNY | |
| Human capital | Average years of Education | Year | |
| Energy | Total electricity consumption | Ten thousand kWh | |
| Desirable outputs | Economic development | Per capita GDP | CNY per person |
| Innovation development | Patent authorization | Piece | |
| Coordinated development | Income level ratio of urban and rural residents | % | |
| Shared development | Number of beds per capita in health care institutions | Piece per person | |
| Open development | Total import and export volume | Ten thousand USD | |
| Undesirable outputs | Nongreen development | Sulphur dioxide emissions | Ten thousand tons |
| Influencing Variables | The role of government | The proportion of fiscal expenditure to GDP | % |
| Marketization level | The proportion of non-state-owned fixed assets investment in all regions | Point | |
| Urbanization rate | The proportion of urban population in the total population | % | |
| Financial development | Loan balance of financial institutions | Hundred million CNY | |
| Infrastructure | Per capita road construction area | Square meter per person | |
| Endowment structure | The proportion of capital in labor | % | |
| Foreign direct investment | The proportion of foreign direct investment in GDP | % |
| Region | Province |
|---|---|
| Eastern China | Beijing, Tianjin, Heibei, Shandong, Jiangsu, Shanghai, Zhejiang, Fujian, Guangdong, Hainan |
| Central China | Shangxi, Henan, Hubei, Hunan, Jiangxi, Anhui |
| Western China | Chongqing, Sichuan, Guangxi, Guizhou, Yunnan, Shaanxi, Gansu, Neimenggu, Qinghai, Ningxia, Xinjiang, Tibet |
| Northeast China | Heilongjiang, Jilin, Liaoning |
| Variable | Number | Minimum | Maximum | Average | Standard Deviation |
|---|---|---|---|---|---|
| Labor | 589 | 124.18 | 6766.86 | 2452.12 | 1705.464 |
| Financial capital | 589 | 38.26 | 42,498.7 | 7123.558 | 7456.79 |
| Human capital | 589 | 2.948 | 12.826 | 8.373385 | 1.298329 |
| Energy | 589 | 2.11 | 6323.354 | 1253.316 | 1151.42 |
| Economic development | 589 | 2759 | 140,211 | 32,394.98 | 25,580.09 |
| Innovation development | 589 | 7 | 478,082 | 24,381.71 | 50,299.46 |
| Coordinated development | 589 | 0.035871 | 0.541962 | 0.355785 | 0.071937 |
| Shared development | 589 | 0.001527 | 0.007213 | 0.003817 | 0.00132 |
| Open development | 589 | 10,594 | 128,119,159 | 8,327,484 | 17,809,179 |
| Non-green development | 589 | 734 | 2,002,000 | 611,413.5 | 434,610.5 |
| The role of government | 589 | 0.046791 | 1.379161 | 0.227471 | 0.177298 |
| Marketization level | 589 | 0.01 | 12.06778 | 6.064838 | 2.157696 |
| Urbanization rate | 589 | 9.235315 | 95.3221 | 50.82968 | 16.4596 |
| Financial development | 589 | 80.62 | 145,169.4 | 16,578.8 | 20,183.24 |
| Infrastructure | 589 | 0.421739 | 11.08042 | 3.863139 | 2.181689 |
| Endowment structure | 589 | 0.227729 | 12.92507 | 3.167673 | 2.523579 |
| Foreign direct investment | 589 | 0.655474 | 75.0313 | 5.871033 | 7.040357 |
| Regions | HQE(CRS) | HQE(VRS) | HQTFP | HQPEC | HQPTP | HQSEC | HQTPSC |
|---|---|---|---|---|---|---|---|
| Beijing | 0.9675 | 0.9721 | 0.0723 | 0.0020 | 0.0470 | 0.0000 | 0.0313 |
| Tianjin | 0.9339 | 0.9656 | 0.0767 | 0.0007 | 0.0178 | 0.0117 | 0.0523 |
| Hebei | 0.2360 | 0.2971 | 0.0047 | 0.0011 | −0.0167 | 0.0006 | 0.0334 |
| Shanxi | 0.1773 | 0.2296 | 0.0058 | 0.0240 | −0.0067 | 0.0044 | 0.0171 |
| Inner Mongolia | 0.2315 | 0.3434 | 0.0520 | −0.0081 | 0.0913 | 0.0015 | −0.0325 |
| Liaoning | 0.3773 | 0.7767 | 0.0103 | 0.0010 | 0.0551 | −0.0070 | −0.0417 |
| Jilin | 0.2702 | 0.6653 | 0.0065 | 0.0337 | 0.0366 | −0.0378 | −0.0300 |
| Heilongjiang | 0.2801 | 0.8142 | 0.0083 | 0.0324 | 0.0112 | −0.0354 | −0.0043 |
| Shanghai | 0.9641 | 1.0000 | 0.0456 | 0.0000 | 0.0513 | −0.0004 | −0.0095 |
| Jiangsu | 0.9290 | 1.0000 | 0.0539 | 0.0000 | 0.0565 | −0.0298 | 0.0145 |
| Zhejiang | 0.9546 | 0.9571 | 0.0573 | 0.0006 | 0.0308 | 0.0000 | 0.0283 |
| Anhui | 0.2741 | 0.2841 | −0.0076 | 0.0034 | −0.0344 | 0.0011 | 0.0206 |
| Fujian | 0.5031 | 0.5830 | −0.0075 | −0.0223 | 0.0289 | −0.0005 | 0.0022 |
| Jiangxi | 0.2131 | 0.3292 | −0.0323 | −0.0267 | 0.0121 | 0.0333 | −0.0260 |
| Shandong | 0.4563 | 0.4896 | 0.0888 | 0.0013 | 0.1200 | −0.0360 | −0.0063 |
| Henan | 0.1755 | 0.2388 | 0.0370 | 0.0125 | 0.0289 | −0.0032 | −0.0299 |
| Hubei | 0.2198 | 0.4148 | 0.0148 | 0.0165 | 0.0763 | −0.0109 | −0.0542 |
| Hunan | 0.2247 | 0.2750 | 0.0146 | −0.0148 | 0.0824 | 0.0189 | −0.0702 |
| Guangdong | 1.0000 | 1.0000 | 0.0543 | 0.0000 | 0.0554 | −0.0008 | −0.0169 |
| Guangxi | 0.1918 | 0.1993 | 0.0106 | 0.0044 | 0.0069 | −0.0042 | −0.0214 |
| Hainan | 0.4478 | 0.9558 | −0.0528 | 0.0016 | 0.0165 | −0.0029 | −0.0674 |
| Chongqing | 0.2927 | 0.4462 | 0.0475 | 0.0461 | 0.0481 | −0.0188 | −0.0174 |
| Sichuan | 0.3230 | 0.4498 | 0.1128 | 0.0471 | 0.0741 | 0.0348 | −0.0489 |
| Guizhou | 0.1608 | 0.2631 | 0.0266 | 0.0488 | 0.0311 | −0.0005 | −0.0529 |
| Yunnan | 0.1564 | 0.2158 | 0.0099 | 0.0048 | 0.0249 | −0.0027 | −0.0048 |
| Tibet | 1.0000 | 1.0000 | −0.0076 | 0.0000 | −0.0623 | −0.0005 | 0.0512 |
| Shaanxi | 0.2375 | 0.2702 | 0.0206 | 0.0151 | 0.0572 | −0.0079 | −0.0447 |
| Gansu | 0.1922 | 0.2465 | 0.0052 | 0.0401 | 0.0057 | −0.0387 | −0.0037 |
| Qinghai | 0.3907 | 0.9617 | 0.0820 | −0.0001 | 0.0033 | 0.0455 | 0.0235 |
| Ningxia | 0.2518 | 0.9729 | 0.0363 | −0.0022 | 0.0325 | −0.0029 | 0.0087 |
| Xinjiang | 0.3578 | 0.8919 | 0.0322 | 0.0001 | −0.0322 | −0.0003 | 0.0548 |
| Eastern | 0.7392 | 0.8220 | 0.0393 | −0.0015 | 0.0407 | −0.0058 | 0.0062 |
| Central | 0.2141 | 0.2952 | 0.0054 | 0.0025 | 0.0264 | 0.0073 | −0.0238 |
| Western | 0.3155 | 0.5217 | 0.0357 | 0.0163 | 0.0234 | 0.0005 | −0.0073 |
| Northeast | 0.3092 | 0.7521 | 0.0084 | 0.0224 | 0.0343 | −0.0268 | −0.0253 |
| Nationwide | 0.4320 | 0.5971 | 0.0283 | 0.0085 | 0.0306 | −0.0029 | −0.0079 |
| Year | HQE(CRS) | HQE(VRS) | HQTFP | ||||||
|---|---|---|---|---|---|---|---|---|---|
| Moran’s I | Z-Value | p-Value | Moran’s I | Z-Value | p-Value | Moran’s I | Z-Value | p-Value | |
| 2001 | 0.2729 | 2.8165 | 0.0048 *** | 0.3372 | 3.3346 | 0.0008 *** | 0.2305 | 2.7953 | 0.0051 *** |
| 2002 | 0.3254 | 3.2813 | 0.0010 *** | 0.2753 | 2.7806 | 0.0054 *** | −0.0866 | −0.5159 | 0.6058 |
| 2003 | 0.3299 | 3.3193 | 0.0009 *** | 0.3532 | 3.4823 | 0.0004 *** | 0.1080 | 1.3631 | 0.1728 |
| 2004 | 0.3139 | 3.1729 | 0.0015 *** | 0.3135 | 3.1161 | 0.0018 *** | −0.0227 | 0.1395 | 0.8890 |
| 2005 | 0.2919 | 2.9873 | 0.0028 *** | 0.3123 | 3.1091 | 0.0018 *** | −0.0025 | 0.4316 | 0.6659 |
| 2006 | 0.2241 | 2.3860 | 0.0170 ** | 0.3170 | 3.1632 | 0.0015 *** | 0.0857 | 1.1524 | 0.2491 |
| 2007 | 0.2761 | 2.8488 | 0.0043 *** | 0.2531 | 2.5766 | 0.0099 *** | 0.1798 | 2.0612 | 0.0392 ** |
| 2008 | 0.2719 | 2.8113 | 0.0049 *** | 0.2552 | 2.5957 | 0.0094 *** | 0.0020 | 0.4901 | 0.6239 |
| 2009 | 0.2757 | 2.8452 | 0.0044 *** | 0.2857 | 2.8743 | 0.0040 *** | 0.0548 | 0.8186 | 0.4129 |
| 2010 | 0.2722 | 2.7933 | 0.0052 *** | 0.3076 | 3.0674 | 0.0021 *** | −0.0892 | −0.6154 | 0.5382 |
| 2011 | 0.2574 | 2.6781 | 0.0074 *** | 0.2940 | 2.9419 | 0.0032 *** | 0.0446 | 1.0652 | 0.2867 |
| 2012 | 0.2917 | 2.9428 | 0.0032 *** | 0.2301 | 2.3701 | 0.0177 ** | −0.0437 | −0.1200 | 0.9044 |
| 2013 | 0.0779 | 1.0158 | 0.3096 | 0.1743 | 1.8710 | 0.0613 * | 0.0139 | 0.5273 | 0.5979 |
| 2014 | 0.2512 | 2.6008 | 0.0093 *** | 0.0524 | 0.7741 | 0.4388 | 0.0201 | 0.7599 | 0.4472 |
| 2015 | 0.2322 | 2.4253 | 0.0152 ** | 0.0826 | 1.0455 | 0.2957 | −0.1539 | −1.3900 | 0.1645 |
| 2016 | 0.2339 | 2.4286 | 0.0151 ** | 0.0580 | 0.8261 | 0.4087 | −0.1878 | −1.9330 | 0.0532 * |
| 2017 | −0.1686 | −1.2363 | 0.2163 | −0.0701 | −0.3326 | 0.7394 | 0.1358 | 1.7874 | 0.0738 * |
| 2018 | 0.2081 | 2.1864 | 0.0287 ** | 0.2067 | 2.1692 | 0.0300 ** | −0.0142 | 0.2009 | 0.8407 |
| Variables | HQE(CRS) | HQE(VRS) | HQTFP | HQPEC | HQPTP | HQSEC | HQTPSC |
|---|---|---|---|---|---|---|---|
| Coe. Sig. | Coe. Sig. | Coe. Sig. | Coe. Sig. | Coe. Sig. | Coe. Sig. | Coe. Sig. | |
| GOV | 0.5064 | 0.6300 | 0.6676 | 0.6845 | 0.6388 | 0.6803 | 0.6891 |
| 0.0000 *** | 0.0000 *** | 0.0000 *** | 0.0000 *** | 0.0000 *** | 0.0000 *** | 0.0000 *** | |
| MAR | 1.3911 | −0.7158 | 2.6943 | 2.4503 | 2.7191 | 2.4576 | 2.4076 |
| 0.0035 *** | 0.1947 | 0.0000 *** | 0.0000 *** | 0.0000 *** | 0.0000 *** | 0.0000 *** | |
| URB | 0.0020 | 0.0034 | 0.0118 | 0.0122 | 0.0115 | 0.0121 | 0.0123 |
| 0.0051 *** | 0.0000 *** | 0.0000 *** | 0.0000 *** | 0.0000 *** | 0.0000 *** | 0.0000 *** | |
| FIN | 0.0000 | 0.0000 | −0.0000 | −0.0000 | −0.0000 | −0.0000 | −0.0001 |
| 0.0000 *** | 0.9999 | 0.0000 *** | 0.0000 *** | 0.0000 *** | 0.0000 *** | 0.0000 *** | |
| INF | 0.0193 | 0.0638 | −0.0158 | −0.0178 | −0.0145 | −0.0193 | −0.0138 |
| 0.0298 ** | 0.0000 *** | 0.0011 *** | 0.0009 *** | 0.0049 *** | 0.0011 *** | 0.1238 | |
| END | −0.0109 | −0.0124 | −0.0129 | −0.0180 | −0.0088 | −0.0187 | −0.0266 |
| 0.1055 | 0.1136 | 0.0005 *** | 0.0000 *** | 0.0251 ** | 0.0000 *** | 0.0000 *** | |
| FDI | 0.0155 | 0.0139 | −0.0067 | −0.0065 | −0.0063 | −0.0055 | −0.0061 |
| 0.0000 *** | 0.0000 *** | 0.0000 *** | 0.0000 *** | 0.0000 *** | 0.0000 *** | 0.0000 *** | |
| Sigma | −33.7830 | −33.4591 | −51.7177 | −3.9043 | −17.8377 | −85.6390 | −1.2518 |
| R2 | 0.9990 | 0.9989 | 0.9885 | 0.9930 | 0.9928 | 0.9952 | 0.9936 |
Publisher’s Note: MDPI stays neutral with regard to jurisdictional claims in published maps and institutional affiliations. |
© 2021 by the authors. Licensee MDPI, Basel, Switzerland. This article is an open access article distributed under the terms and conditions of the Creative Commons Attribution (CC BY) license (https://creativecommons.org/licenses/by/4.0/).
Share and Cite
Hua, X.; Lv, H.; Jin, X. Research on High-Quality Development Efficiency and Total Factor Productivity of Regional Economies in China. Sustainability 2021, 13, 8287. https://doi.org/10.3390/su13158287
Hua X, Lv H, Jin X. Research on High-Quality Development Efficiency and Total Factor Productivity of Regional Economies in China. Sustainability. 2021; 13(15):8287. https://doi.org/10.3390/su13158287
Chicago/Turabian StyleHua, Xiangyu, Haiping Lv, and Xiangrong Jin. 2021. "Research on High-Quality Development Efficiency and Total Factor Productivity of Regional Economies in China" Sustainability 13, no. 15: 8287. https://doi.org/10.3390/su13158287
APA StyleHua, X., Lv, H., & Jin, X. (2021). Research on High-Quality Development Efficiency and Total Factor Productivity of Regional Economies in China. Sustainability, 13(15), 8287. https://doi.org/10.3390/su13158287