Abstract
The European Union, by adopting the European Green Deal, aims at an extremely ambitious goal to become climate neutral by 2050. This objective implies a massive investment plan to reduce disparities between EU Member States and to support their transformation efforts in order to reshape the Union into a modern, resource-efficient and competitive economy. The objective of this paper is to analyze the dynamics of implementation of SDG 7 targets in EU Member States 5 years after the adoption of the Paris Agreement. Using hierarchical clustering analysis to reveal hidden associative structures, EU countries were grouped in 2015 and 2019 based on Eurostat data in order to identify and analyze key characteristics, but also to evaluate their evolution over time. The results of this research revealed clusters of high-performing countries, as well as countries that require increased attention and support to ease the transition to a greener economy. If in 2015 the cluster of the best performing countries consisted of four EU countries, in 2019, their number increased to eight EU countries, simultaneously with an improvement of the indicators, proving a real concern and involvement regarding the achievement of SDG 7 targets.
1. Introduction
Highlighting the sustainable performance of society and the economy in the context of the challenges posed by the 2030 Agenda, the level achieved by each country in terms of the Sustainable Development Goals (SDGs) is now a permanent concern of decision-makers and beyond.
In this sense, we identify the presence of numerous information, statistical analyses and specific indicators that are absolutely necessary for measuring the evolution of each SDG, but which often cannot fully highlight the new challenges or challenges, different from one period to another, from one region to another, an aspect which, unfortunately, complicates decision-making and action processes, especially in countries with lower performance and for which it is necessary to act differently [1,2]. Therefore, even if the successful implementation of the SDG agenda is the only way forward to ensure human well-being, economic prosperity and environmental protection, this is not always possible, as all SDGs must act synergistically, be strengthened and no SDGs, unanimously isolated, must be unable to generate progress.
This is the main reason why scholarly research reflects the need to permanently identify syncopes and challenges for each SDG, at the level of each country and region, but also the analysis of the correlations between them is an absolutely mandatory aspect for Agenda 2030 to be a success for all countries and regions of the world [2,3].
It is also important to note that each SDG has a multidimensional vision of development, and their analyses, individually or in groups, can often generate different results, sometimes synergies (positive results), sometimes compromises (negative results). Regardless of the SDG analyzed or the correlations existing between the SDGs at a certain point in time, we emphasize that the achievement of the 2030 Agenda and implicitly the achievement of the SDGs will largely depend on capitalizing on the synergies identified between the objectives. In addition, the highlighted trade-offs, which are obstacles to achieving the SDGs, need to be overcome and structurally transformed into profound changes in non-functional strategies [3,4]. Consequently, we emphasize that it is imperative to identify the trend that each SDG has at the local and/or regional and global level, as well as the impact that their evolution has on society, the environment and the economy.
Given that 5 years have passed since the adoption of the Paris Agreement and the discussions on the implementation of the European Green Deal occupy an important part of the European agenda, our research aims to assess the dynamics of SDG 7 target implementation in EU countries. Thus, we offer an alternative perspective for analyzing the dynamics of the evolution of EU countries by using cluster analysis and we aim to provide additional information to decision-makers and all stakeholders.
This research is all the more important as a number of researchers or international institutions point out that, although innovative policies and technologies are adapting rapidly to existing realities, the impact of the COVID-19 pandemic significantly changes the forecasts made in early 2020 for the current year. Thus, the objectives of SDG 7 may now be jeopardized, and some targets may be even further away than before [5,6,7].
Additionally, from the point of view of SDG 7, the concerns are similar and continuous among the directly responsible factors because we can globally identify an accelerated increase in energy demand, both for fossil fuels and for renewable energy [8,9]. This issue needs to be analyzed and debated from multiple points of view as we identify complex issues at the level of resource-providing countries, especially in terms of the impact of unsustainable use of energy sources [9,10,11].
Based on these considerations, our research contributes to filling the existing gap regarding the level of performance that EU Member States have achieved after 2015 (Paris Agreement) and the current time (2019, the last year for available data), but also to reveal the hidden associative groups of countries, to provide a solid ground for decision-making processes and for substantiating medium- and long-term strategies.
Our research comes as a complement to the study conducted between 1990 and 2017 in the OECD economies, which aimed to identify the type of long-term relationships between the variables of renewable energy consumption and its determinants. The results showed that revenues, human capital, energy productivity, energy prices and eco-innovation are important factors in renewable energy consumption. Therefore, in order to provide viable solutions to environmental problems and to achieve the objectives set out in the Paris Climate Agreement, it is still necessary to design policies and strategies to increase the share of renewable energy in the overall energy mix [12,13,14].
To highlight the performance of EU Member States, our research uses cluster analysis based on the set of indices identified as defining elements of SDG 7, thus reflecting ongoing processes. Through the research, we also identified the current position of each Member State in relation to the objectives of the 2030 and 2050 Agenda, which generated their grouping in clusters with similar characteristics in terms of the level of performance obtained in access to modern energy services and renewable energy (SDG 7).
On the other hand, the grouping of countries into clusters was also carried out to highlight the degree of responsibility of countries in achieving the specific objectives of SDG 7, the relative position of a country and its inclusion in a group with similar characteristics, depending on the total value of the analyzed indices.
We also consider that the permanent identification of the performance of EU Member States according to SDG 7 is a necessity because SDG 7 is one of the objectives that generates a series of multiple positive effects on society, the environment and the economy, and from this point of view it is necessary that no country/region is left behind.
Key players in the energy sector, both renewable resources and fossil fuels, must continue to commit to improving specific assets and capacities in order to achieve the goal of sustainable development, SDG 7 “Accessible and Clean Energy”. Developing countries’ capacity for sustainability can also foster overall sustainable development and contribute to the achievement of SDG 7 and the 2030 Agenda [15,16,17].
Moreover, the COVID-19 pandemic has been and continues to be a wake-up call that the environment and its degradation, global warming and overuse of resources and the existence of polluting industries must be stopped, and the global economy as a whole must become rapidly sustainable, in all respects. The need to accelerate the transition to renewable energy, to an accessible, reliable and sustainable energy system, is supported in all countries of the world, in this case and in the EU, by stepping up clean energy research efforts and stimulating investment in energy infrastructure and clean energy technology [18,19,20].
Therefore, the ongoing monitoring of SDG 7 is undeniable, as the EU (as well as all regions of the world) focuses on reducing energy consumption, ensuring a sustainable energy supply and improving access to affordable energy [21,22].
We highlight the fact that SDG 7 is supported at the level of all European states through a wide range of strategies and policies to achieve the new climate goals for 2030 and 2050, and the ongoing reformulation of action policies is a constant at the level of The European Commission, as in the current year, 2021, is to make a series of legislative proposals in this regard [23,24].
Consequently, we can emphasize that the achievement of SDG 7 is crucial for human well-being, economic growth and the achievement of global climate change goals. Additionally, in accordance with the Paris Agreement on Climate Change (2015), SDG 7 must be implemented in projects to financially support the economy, transfer technology and strengthen the capacity for sustainable development of society [19,25,26].
Therefore, the constant attention and concern in this direction are also justified by the fact that SDG 7 responds directly to the major requirement to “put the EU on a green path for the new generations”. In this regard, we identify targets such as: reduction of at least 55% of net greenhouse gas emissions by 2030 (from 1990 levels), zero net emissions by 2050, reduction of at least 40% of greenhouse gas emissions greenhouse gases (from 1990 levels), with a share of at least 32% for renewable energy and improving energy efficiency by at least 32.5% [27,28].
These priority development targets were another starting point/benchmark in the case of our research because it is obvious that both for 2015 and 2019 (years included in our research), each European state has achieved a series of synergies but also compromises, so that for the coming years, 2030 and 2050, we can identify a sustainable status of society, environment and economy. Moreover, the positive elements highlighted in our research can be capitalized as examples of good practice, and the compromises that must be made directly contribute to the formulation of sustainable transformation strategies.
A relevant point of view for the importance of permanent monitoring of SDG 7 is that of Chirambo (2018), who emphasizes the idea that improved access to energy has the potential to alleviate poverty, promote industrialization, facilitate gender equality and reduce the vulnerability of regions to climate change, and detailed knowledge of each specific detail is a strategic priority [29].
On the other hand, we cannot omit the fact that in many countries, we still identify low electrification rates, and these are undoubtedly the most pressing obstacle to economic growth, more important than access to finance, the presence of bureaucracy or corruption. Therefore, only policies, strategies and innovations in this field of clean and accessible energy for all can directly contribute to accelerating progress towards universal energy access before 2030 [29,30].
Although there are a number of shortcomings and concerns regarding the achievement of SDG 7 targets at the level of certain regions/countries, we identify an increase in concerns about rural electrification in particular, as well as energy access to agriculture in particular, with a focus on regulating funding frameworks for all energy sectors, issues that can undoubtedly develop success and mitigate negative perceptions of the growth prospects caused by global economic shocks. These initiatives undoubtedly contribute to the favorable growth of inclusion, as the 2030 Agenda seeks, by coordinating and harmonizing investment in this sector, especially in clean energy [30,31].
In the same sense, we mention the fact that the role of economic and non-economic actors that promote sustainability and support the implementation of sustainable energy in their own businesses should not be neglected. This contributes over time to the sustainable development of society in the context of sustainable energy as well as the possibility to explore scenarios and visions for future actions aimed at implementing the SDGs. Therefore, the response (positive or negative) of economic and non-economic agents to the challenges of SDG 7 is one of the reasons why we identify major differences at the level of countries/regions [32,33,34,35].
The complexity of how to measure the performance of the SDG and implicitly of SDG 7 at the level of each country should be noted in this context, because they have a double dimension, namely, a technical and a political one. Therefore, this feature sometimes makes it difficult to measure performance, which is why the position of a particular country in a particular hierarchy is often relative and depends almost entirely on the method chosen for research, the indicators selected for ranking and the assumptions taken into account [21,35,36].
We also emphasize that access to sustainable energy at affordable prices is the central objective of SDG 7, which is focused on three priority objectives: ensuring universal access to energy services (7.1), increasing the share of renewable energy sources in the mix, energy efficiency (7.2) and improving energy efficiency (7.3). Additionally, a priority in the implementation of SDG 7 is international cooperation, investment promotion, infrastructure expansion and technology modernization, especially in developing countries [37].
Indeed, clean/sustainable energy is the foundation of human development, through the sustainability of production of any kind and the support of sustainable agriculture and sustainable services, in the context in which energy resources are unevenly distributed globally. These gaps in energy resources and investments in clean/green energy sources are correlated with financial constraints, which has always generated major discrepancies between the developed and least developed countries.
Therefore, achieving the objectives of SDG 7 will have a major impact and will influence the progress of each country in multiple economic, social and environmental dimensions. However, there are connections (some positive, some negative) such as between renewable energy sources (solar, biogas) and human development that could greatly influence the development of rural communities through access to energy, but on the other hand, there is also a certain risk generated by energy prices that could cause some households to give up access to the energy network [38,39,40,41].
On the other hand, we cannot omit the fact that the SDG 7 energy efficiency objective is undoubtedly a “win–win” strategy for all economies and countries of the world because each unit of alternative energy created reduces the need for unsustainable energy and the expansion of sources renewable energy and everyone’s access to it reduces the risks for each country in terms of long-term development [42,43,44,45].
Based on the above considerations, this research aims to assess the dynamics of implementation of SDG 7 targets in the EU, with the help of hierarchical cluster analysis, in order to efficiently segment and identify the common features specific to the groups of best-performing and less-performing countries, but also to reveal associative structure between countries based on analyzed variables. Our study contributes to the development of knowledge through the analysis made at the countries’ level and also provides the knowledge and tools needed to shape a better and responsible future, addressing, at the same time, the existing gap in the current research.
2. Materials and Methods
To analyze the transition of EU countries to affordable, reliable and sustainable energy systems, we based our research on latest available data provided by Eurostat for SDG 7—Affordable and clean energy [46] for the years 2015 and 2019.
Using cluster analysis, we aim to identify the grouping patterns of EU countries according to the variables analyzed, aiming to highlight the dynamics of countries between groups and between the two periods considered for analysis. Given that cluster analysis is a hypothesis-generating rather than a hypothesis-testing technique, we aim to present to the research community the results of our study in order to explore new research directions.
Cluster analysis aims to group similar variables into groups so that the degree of association between two variables is as high as possible if they belong to the same group and as low as possible if they belong to different groups. Cluster analysis is mainly used to reveal structures in data without providing detailed explanations or causal interpretations but providing researchers with a distinct way of approaching and interpreting the variables analyzed [47].
Starting from the existing literature, and based on previous research, we consider a series of preliminary hypotheses and will verify whether they are confirmed, in whole or in part, or will be refuted:
- (1)
- The Nordic countries are likely to be grouped in a cluster of countries with high performances in terms of SDG 7;
- (2)
- Small or island countries are potentially in a disadvantageous position in terms of achieving SDG 7 targets, mainly due to the existing environmental conditions;
- (3)
- For countries that have an economy based on depletable resources, the gap will increase over time compared to countries with a high share of RES in the economy in terms of achieving SDG 7 targets.
Selected indicators were processed using basic descriptive statistics. Subsequently, the hierarchical cluster analysis in IBM SPSS Statistics [48] was used to identify clusters for years 2015 and 2019, to underline the key characteristics of the groups of countries, in order to be able to analyze their evolution simultaneously with the redistribution in time between clusters, to better understand the existing relationships [49].
In order to maintain the compatibility between the analyzed data, based on the information provided by Eurostat, the absolute values offered for primary energy consumption and final energy consumption were transformed by means of a dynamic index, based on the year 2000 (similar to greenhouse gas emissions intensity of energy consumption indicator).
Dynamics indices are a measure of the ratio between the size of the economic phenomenon analyzed between two different time periods. It is known that the dynamic indicators refer to homogeneous phenomena described in a single temporal series. Such indices are termed indices of individual dynamics [50,51,52]:
where Yn is the indicator value in a given moment and Y1 is the indicator value in a comparative period.
2.1. Sample Selection and Variables
The variables were selected for each EU member state, based on Eurostat’s latest available data (Table 1).

Table 1.
Selected variables for analysis.
Of the variables selected for analysis, “Primary energy consumption” measures the total energy needs of a country excluding all non-energy use of energy carriers, while “Final energy consumption” measures the energy end-use in a country excluding all non-energy use of energy carriers. “Energy productivity” measures the amount of economic output that is produced per unit of gross available energy; “Energy import dependency” shows the share of total energy needs of a country met by imports from other countries and “Greenhouse gas emissions intensity of energy consumption” is calculated as the ratio between energy-related GHG emissions and gross inland consumption of energy.
According to Eurostat, latest available data for greenhouse gas emissions intensity of energy consumption were provided for 2018. To forecast the necessary data for 2019, to maintain the compatibility with the rest of the variables, we used the AAA (Holt-Winters) version of the exponential smoothing (ETS) algorithm with the weights assigned to data variances over time in proportion to the terms of their geometric progression based on the following exponential scale, for the last 10 years (2009–2018): (1, (1−α), (1−α)2, (1−α)3, ..., ∞) [53,54,55].
The descriptive statistics for all the variables used in this research, both for the base year 2015 and target year 2019, are presented in Table 2.
Table 2.
Descriptive statistics.
2.2. Model and Method
To check the validity of the assumptions, the first step is to examine available data for normal distribution (Table 3 and Table 4).
Table 3.
Tests of normality for year 2015.
Table 4.
Tests of normality for year 2019.
According to the Kolmogorov–Smirnov test, and in concordance with Shapiro–Wilk test results [56,57], of the variables selected for analysis, population unable to keep home adequately warm values indicates a deviation from the normal distribution, which suggests the elimination of this variable from the analysis.
On the other hand, final energy consumption and share of renewable energy in gross final energy consumption normality test results suggest there is a reasonable suspicion that the variable does not follow a normal distribution. Comparing the Kolmogorov–Smirnov with the Shapiro–Wilk test results for these 2 variables, according to the literature and taking into account the sample size and the reduced impact of the type of distribution on the proposed analysis [57,58], we can retain both of them for hierarchical cluster analysis.
The Squared Euclidean Distance Method was used to construct the proximity matrix [59], using the Ward Method to determine the distance between clusters [60]:
Analyzing the dendrograms of the clusters for the years 2015 (Figure 1) and 2019 (Figure 2) and also taking into consideration the existing literature [61,62], we propose to select a number of four relevant clusters for both 2015 and 2019. The results obtained could provide a broader and more accurate picture of the influencing factors that manifest themselves in the exploiting of renewable energy sources in EU countries.

Figure 1.
Dendogram of clustering—year 2015.
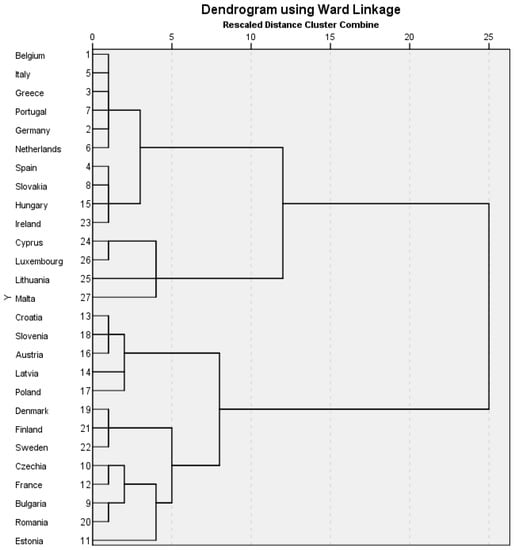
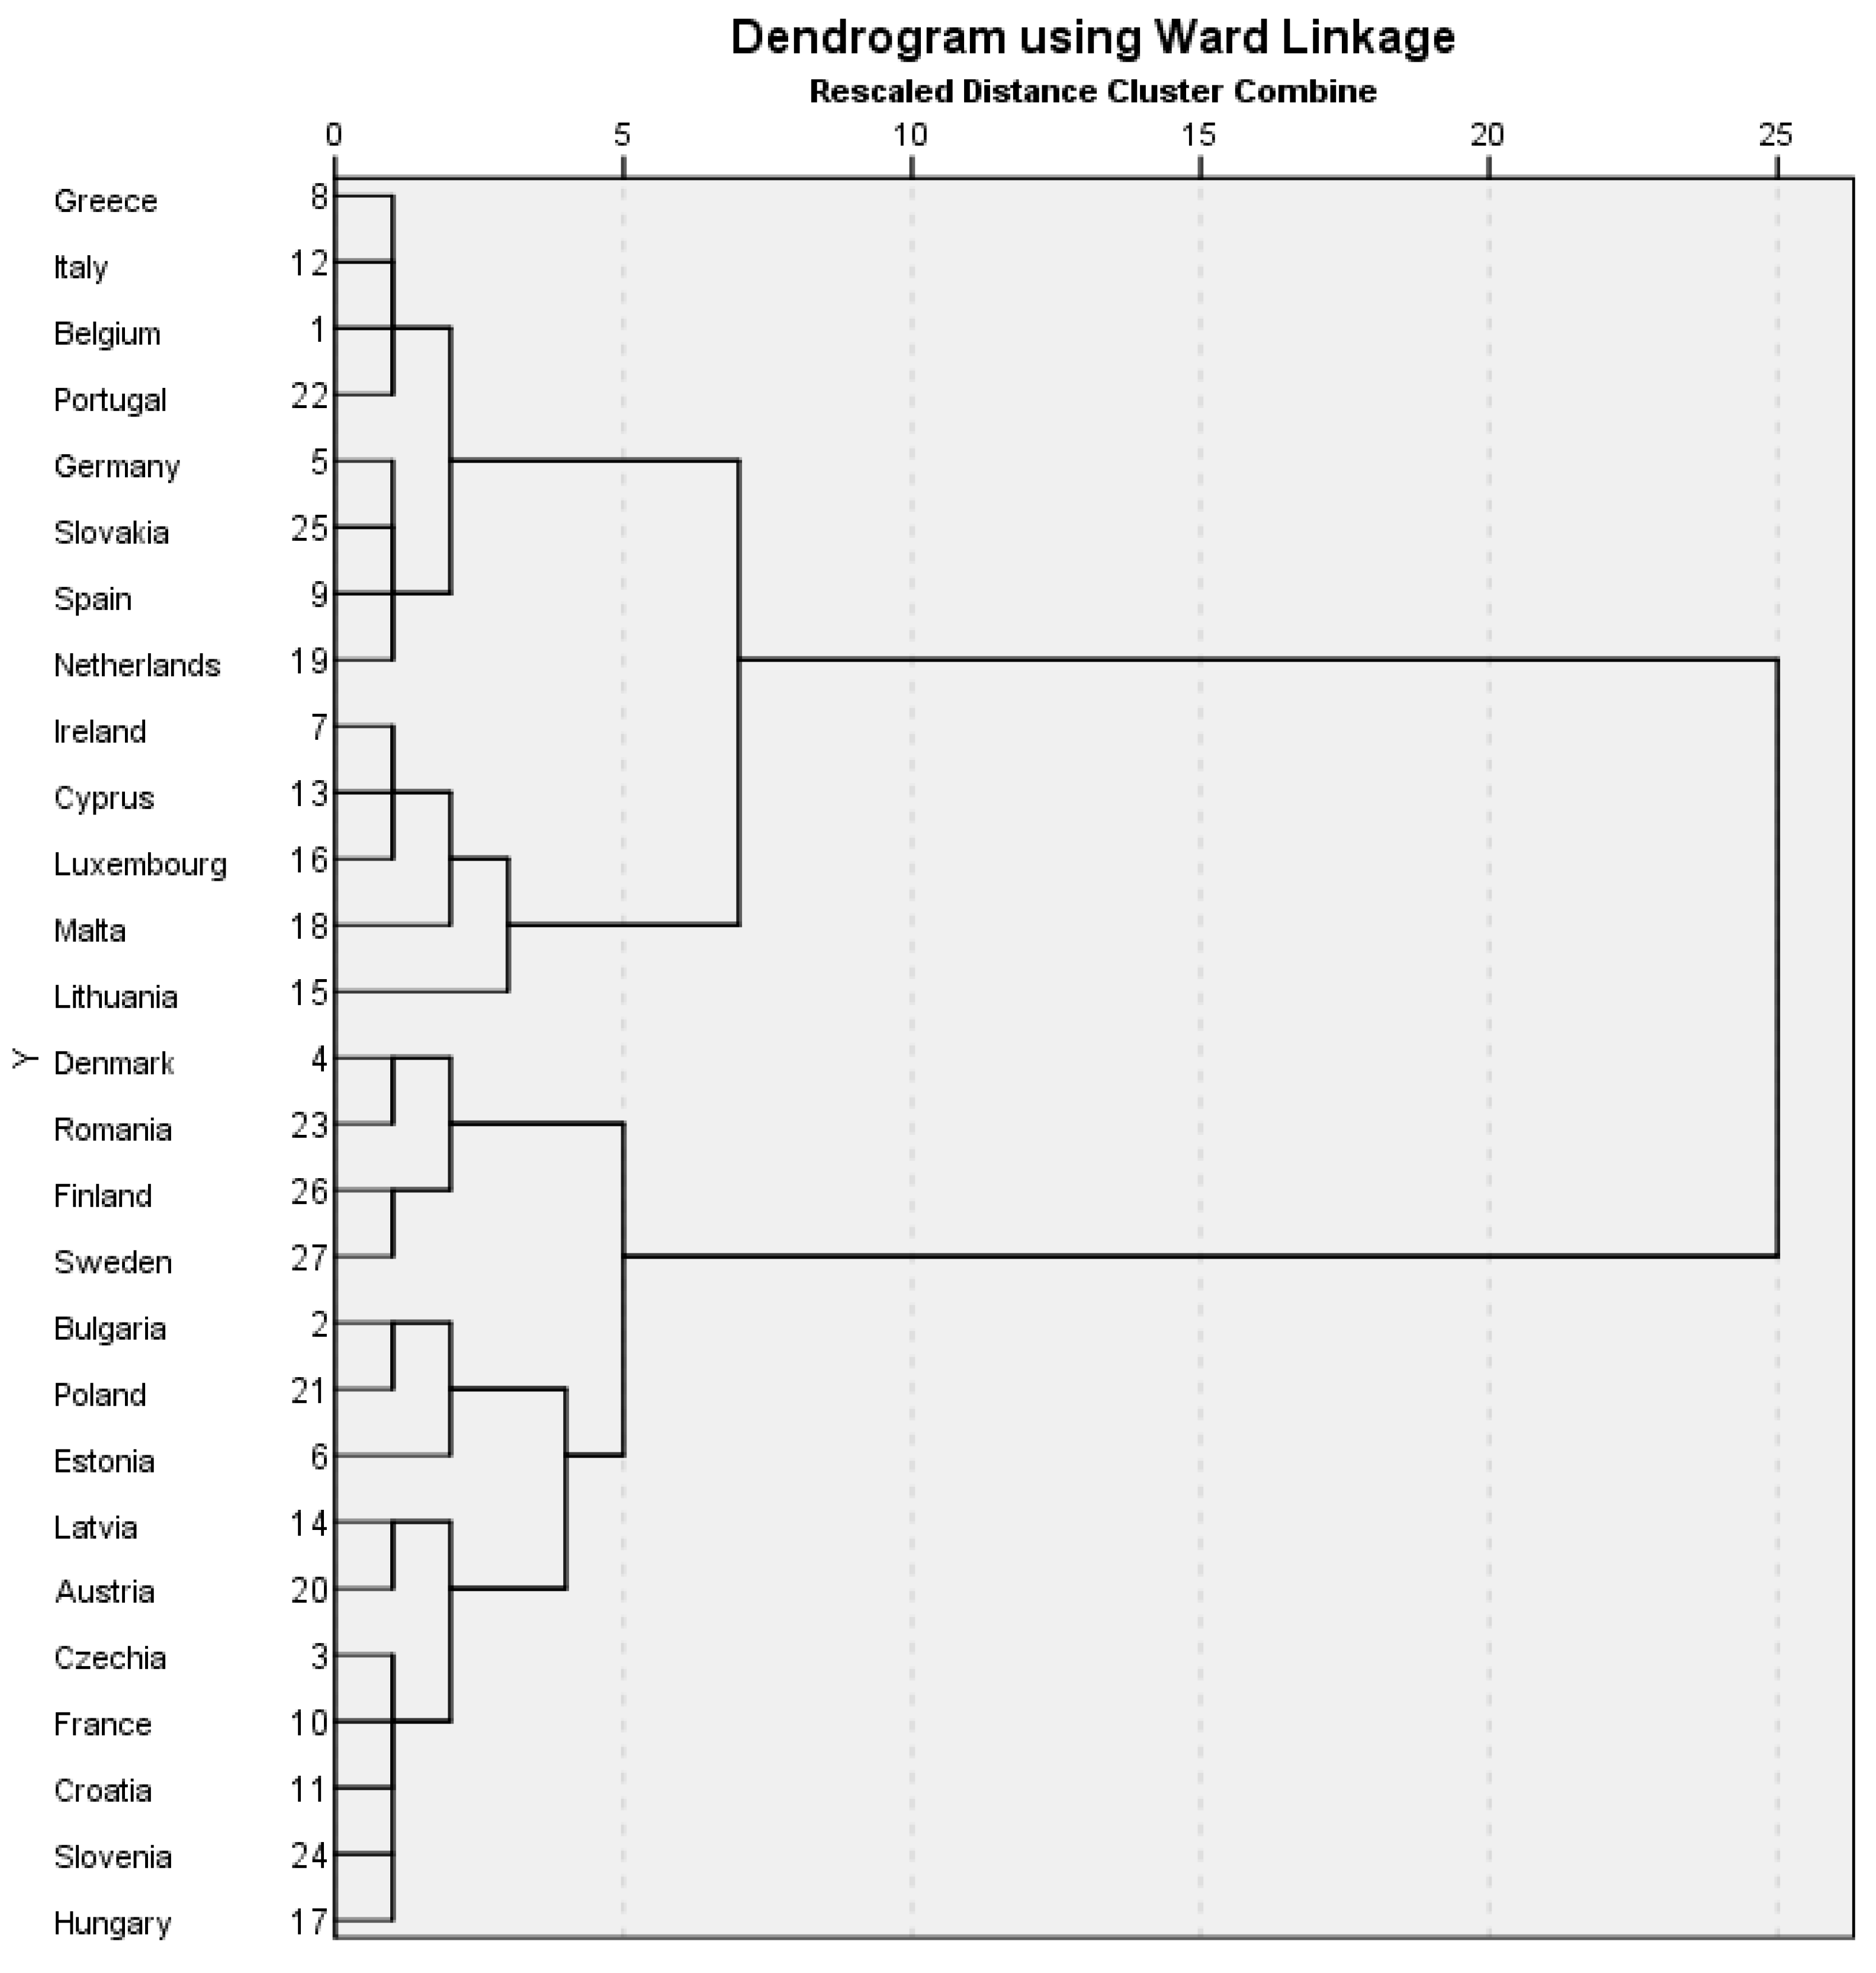
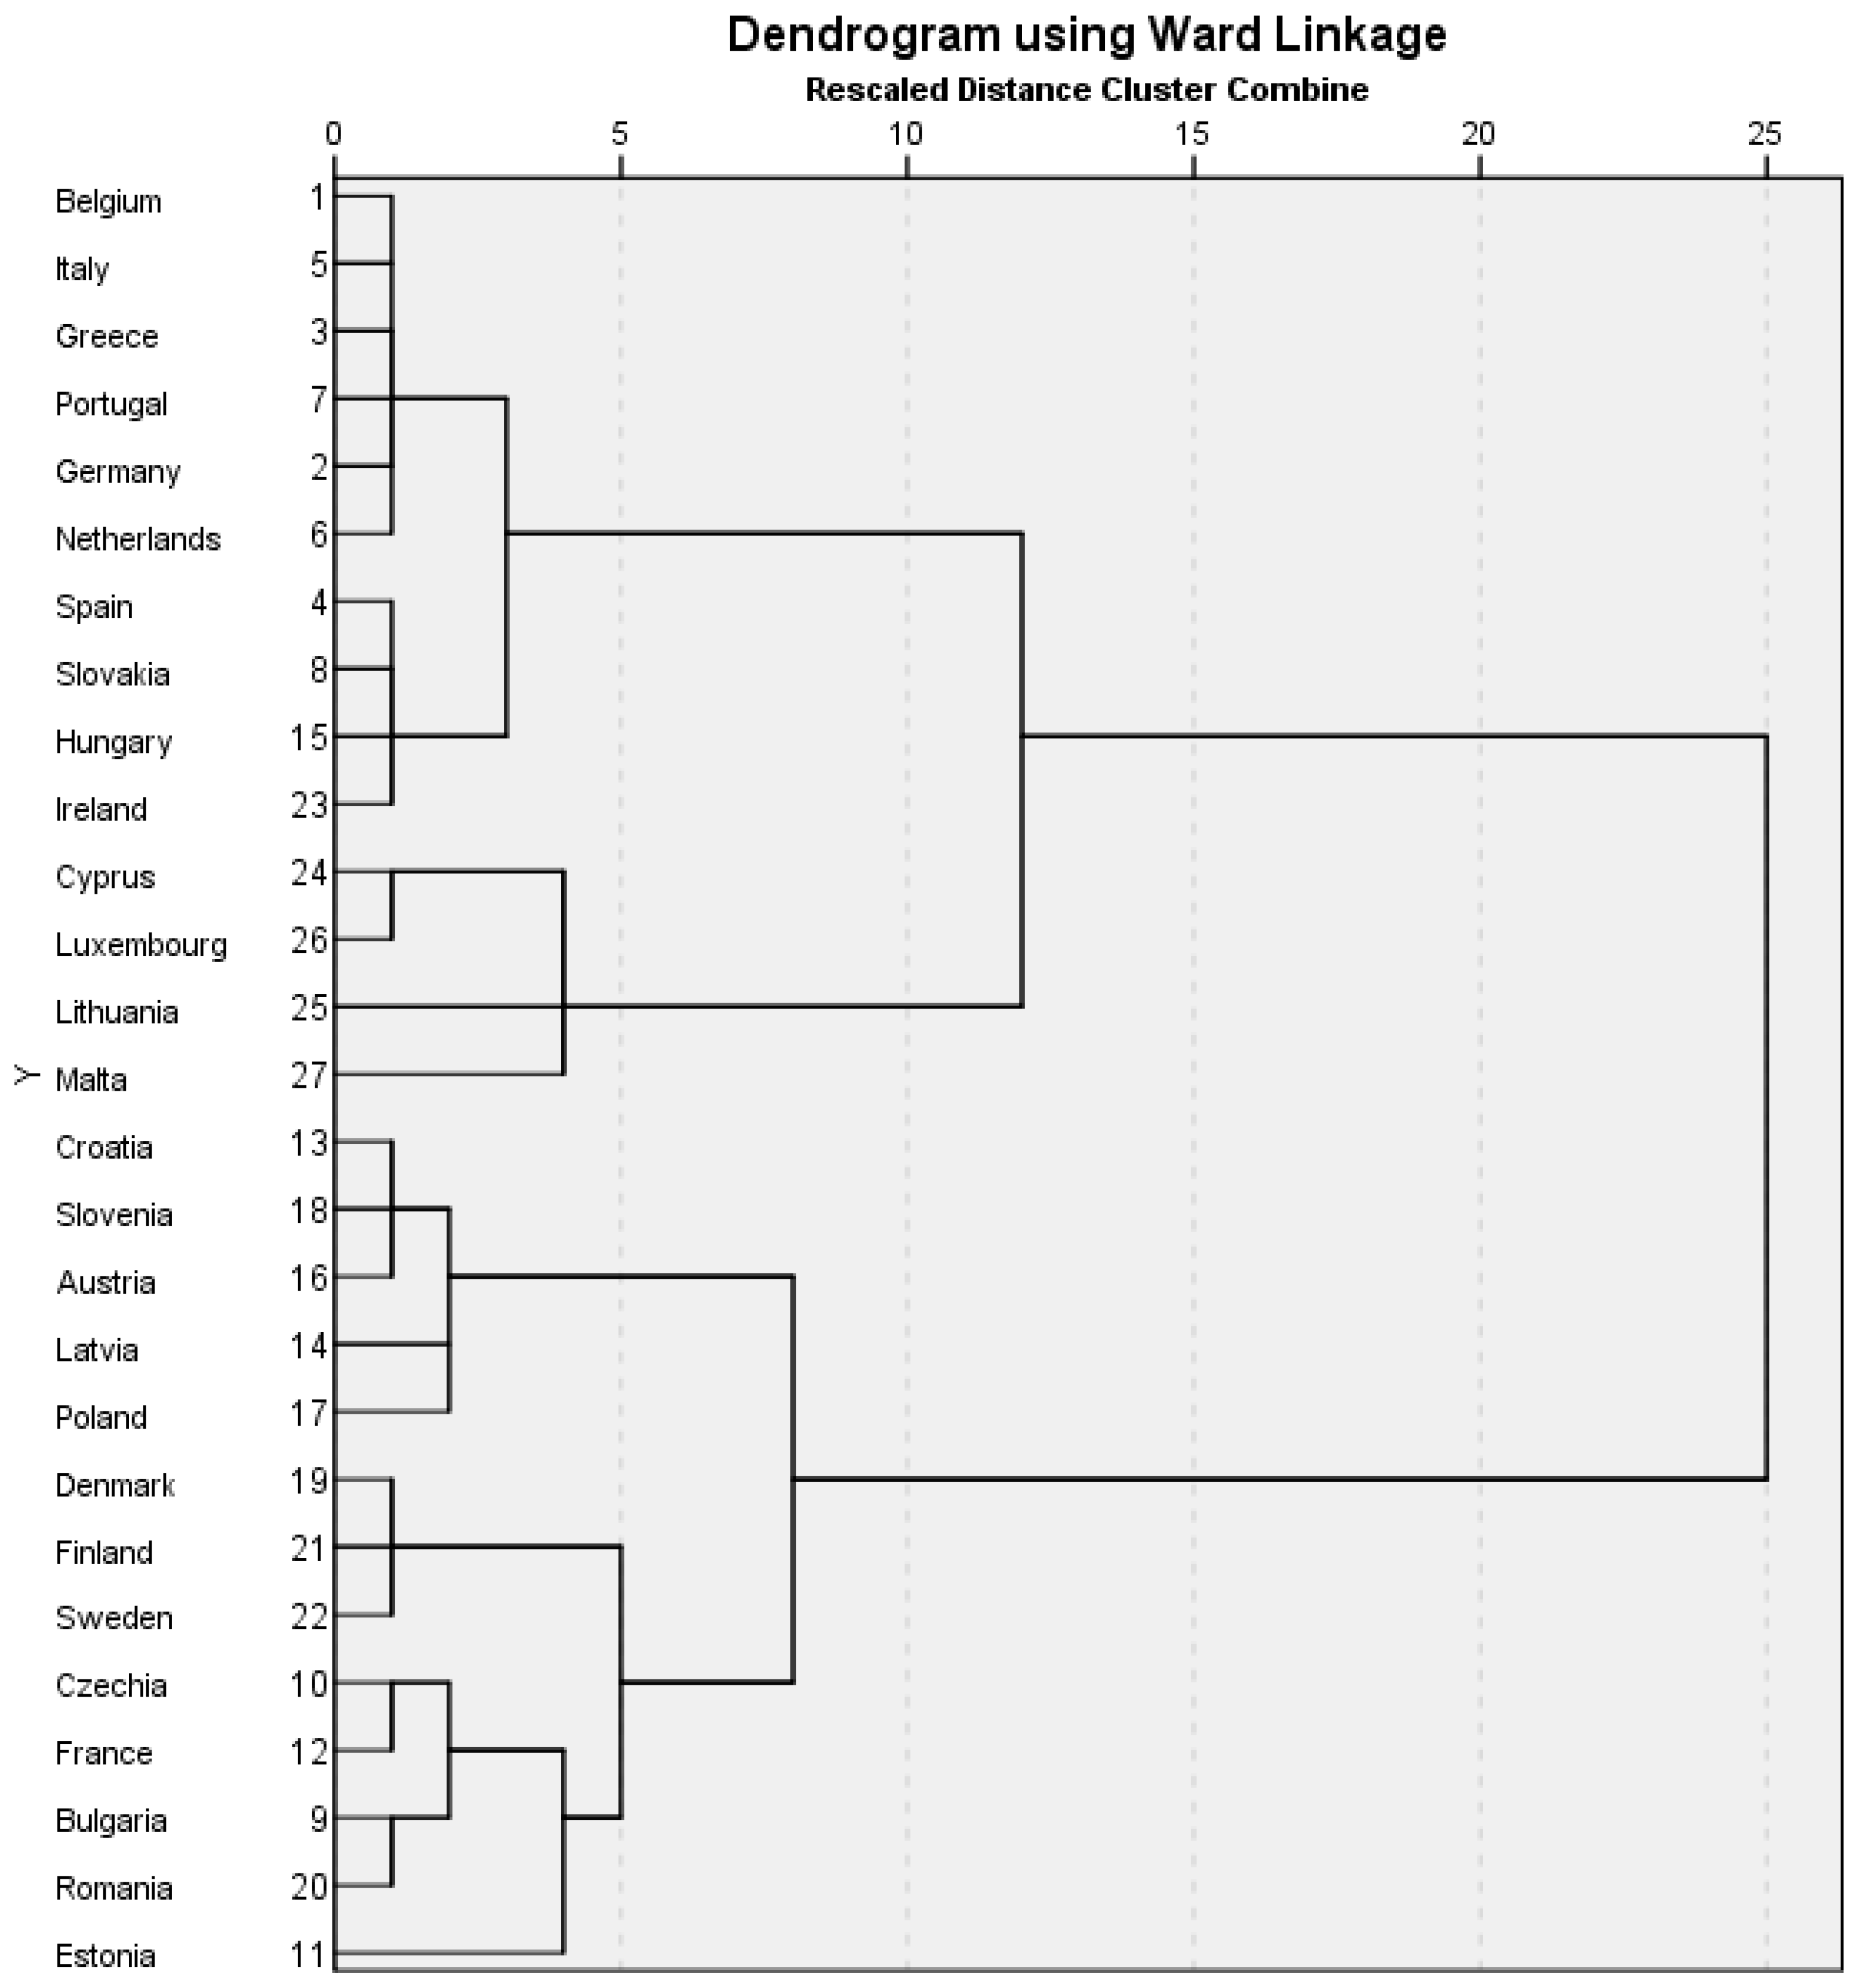
Figure 2.
Dendogram of clustering—year 2019.
To check the validity of the clusters, and taking into consideration that we have unequal sample size clusters, we decided to use the Welch Test and the Brown–Forsythe Test (with null hypothesis H1–H2: variable means do not differ significantly). The results of the tests are presented in Table 5 (year 2015) and in Table 6 (year 2019).
Table 5.
Robust tests of equality of means—year 2015.
Table 6.
Robust tests of equality of means—year 2019.
Subsequently, the results were tested by ANOVA methodology for 2015 and 2019 clusters (Table 7 and Table 8).
Table 7.
The analysis of variance (ANOVA)—year 2015.
Table 8.
The analysis of variance (ANOVA)—year 2019.
3. Results
Starting from the fact that each region/country is constantly monitored in terms of how SDG 7 is reflected in the total sustainable performance, we emphasize that this process is achievable mainly through the following specific indicators: “Primary energy consumption”, “Final energy consumption”, “Energy productivity”, “Share of renewable energy in gross final energy consumption by sector”, “Energy import dependence by products”, “Greenhouse gas emissions intensity of energy consumption”, which indices that our research is based.
Thus, we identify a series of relevant aspects as results of our research from the point of view of the analyzed indicators. Based on the research method described above, according to the existing data for 2015, four representative clusters were identified at the level of the 27 EU member states selected for analysis (Table 9, Table 10, Table 11 and Table 12).
Table 9.
Cluster A_2015.
Table 10.
Cluster B_2015.
Table 11.
Cluster C_2015.
Table 12.
Cluster D_2015.
The first cluster (A_2015) brings together a number of eight countries (Table 9). The main characteristics of these countries are the lowest average value of final energy consumption (93.54 points) compared to the EU average (102.83 points).
The countries grouped in this cluster are, in general, characterized by lower average values of primary energy production and final energy consumption than in the base period, but also lower than the EU average. The average value of energy productivity (7.46 Euro per KGOE) is higher than the EU average (6.91 Euro per KGOE), and also the average value of energy import dependence (68.94%) is slightly higher than the EU average (56.73%).
At the same time, the average value of the share of renewable energy in gross final energy consumption (15.19%) is about one-third lower than the EU average (20.38%), and the average value of greenhouse gas emissions intensity of energy consumption (89.69 points) is slightly higher than the EU average (88.16 points).
In the B_2015 cluster, at the level of 2015, a number of 10 European countries were grouped (Table 10). The characteristic values for the countries covered in this way are the highest average value of primary energy consumption (105.55 points) and the lowest average value of energy productivity (5.09 EUR per KGOE).
Among the other values that characterize the countries grouped in the B_2015 cluster, we can mention that the average value of final energy consumption (107.72 points) is slightly higher than the EU average (102.83 points), as well as the average value of the share of renewable energy in gross final energy consumption (20.60%) which is slightly higher than the average value registered by EU countries (20.38%). Additionally, the average value of energy import dependency (41.79%) is lower than the EU average (56.73%), while the average value of energy import dependence (41.79%) is substantially lower than the EU average (56.73%).
In terms of the average value of greenhouse gas emissions intensity, the countries grouped in cluster B_2015 register values very close to the EU average (88.28 points compared to, respectively, 88.16 points).
In cluster C-2015, four EU member states were reunited (Table 11). The main features of these four countries are that they record the highest average values for share of renewable energy in gross final energy consumption (36.98%), with almost 50% higher than the EU average (20.38%), as well as the most reduced average values for primary energy consumption (92.67 points compared to the EU average of 99.04 points), energy import dependency (26.94% compared to the EU average of 56.73%) and greenhouse gas emissions intensity (79.40 points compared to the EU average of 88.16 points).
In terms of the average value of final energy consumption (95.78 points), it is at a lower value than the EU average (102.83 points), while the average value of energy productivity (8.28 EUR per KGOE) is higher than the EU average (6.91 EUR for KGOE).
In the D_2015 cluster, the last five EU countries were distributed (Table 12). These are characterized by the highest average values of final energy consumption (113.57 points compared to the EU average of 102.83 points), energy productivity (8.56 EUR per KGOE compared to the EU average of 6.91 EUR per KGOE), energy import dependency (90.95% compared to the EU average of 56.73%) and greenhouse gas emissions intensity (92.46 points compared to the EU average of 88.16 points). Additionally, the countries grouped in this cluster register the lowest average value of the share of renewable energy in gross final energy consumption (10.97%) compared to the average value registered at the level of the European Union in 2015 (20.38%). Additionally, the countries grouped in the D_2015 cluster have an average value of primary energy consumption (101.06 points) slightly higher than the EU average (99.04 points).
Analyzing the data available for the year 2019, using the same method of analysis as for the year 2015, we find the formation of four representative clusters, as well as the existence of different translations of countries between clusters (Table 13, Table 14, Table 15 and Table 16).
Table 13.
Cluster A_2019.
Table 14.
Cluster B_2019.
Table 15.
Cluster C_2019.
Table 16.
Cluster D_2019.
At the level of 2019, the A_2019 cluster brings together 10 EU countries (Table 13), having as defining features the lowest average level of primary energy consumption (96.56 points) and final energy consumption (100.12 points), as well as the highest average value of energy productivity (8.75 EUR per KGOE).
Regarding the rest of the variables selected for analysis, the countries in the A_2019 cluster have lower values than the EU average for the average share of renewable energy in gross final energy consumption (16.44% compared to the EU average of 22.38%), the average of greenhouse gas emissions intensity (83.96 points compared to the EU average of 89.94 points), and the average value of energy import dependency (71.20%) is higher than the EU average (59.86%).
In the second cluster, B_2019, five EU member states were selected (Table 14), characterized by the highest average value of primary energy consumption (112.40 points) and the highest average value of greenhouse gas emissions intensity (85.67 points), but the lowest average value of energy productivity (6.28 EUR per KGOE).
Additionally, the countries grouped in the B_2019 cluster have higher average values than the European average for final energy consumption (118.81 points compared to the EU average of 108.87 points) and share of renewable energy in gross final energy consumption (27.44% compared to EU average of 22.38%). The average value of energy import dependency (54.17%) is slightly lower than the EU average (59.86%).
Regarding the third cluster, C_2019, it consists of eight EU states (Table 15). The values that characterize this group of states are the lowest average value of energy import dependency (34.11%) and the lowest average value of greenhouse gas emissions intensity (79.19 points), as well as the highest average value for the share of renewable energy in gross final energy consumption (30.98%) among the analyzed countries.
Additionally, the countries in C_2019 register a relatively low average value of primary energy consumption (98.31 points) and for final energy consumption (118.81 points), but also a lower degree of energy productivity (7.02 EUR per KGOE) compared to the EU-27 average (7.49 EUR for KGOE).
In the fourth cluster identified in 2019 (D_2019), four countries were reunited (Table 16), which are characterized by the highest average values of final energy consumption (118.81 points) and the highest average values of energy import dependency (90.08%), together with the lowest average value of the share of renewable energy in gross final energy consumption (13.70%).
Compared to the average values registered at the level of the European Union in 2019, the countries grouped in this cluster register a higher average value for primary energy consumption (110.78 points compared to the EU average of 102.12 points), but also lower average values for energy productivity (6.82 EUR per KGOE compared to the EU average of 7.49 EUR per KGOE) and greenhouse gas emissions intensity (79.19 points compared to the EU average of 89.94 points).
4. Discussion
To facilitate the comparative analysis of the results obtained from the research, results are summarized in Table 17.
Table 17.
Mean values for 2015 and 2019 clusters.
Based on the results obtained, we can identify, for each year analyzed, which group of countries have proven superior performance and which countries would need to improve their performance in order to keep up with the goals of sustainable development assumed.
Thus, in 2015, following the analysis of research results, we can say that the countries with the best performance in terms of affordable, reliable and sustainable energy systems were grouped in cluster C_2015 (Denmark, Finland, Romania, Sweden), in opposition to the countries grouped in cluster D_2015 (Cyprus, Ireland, Lithuania, Luxembourg, Malta) that did not perform so well. Obviously, in the case of small, possibly insular countries, it is clear that the degree of dependence on energy imports is high, but these countries could benefit from the advantage of geographical positioning to significantly increase the share of RES and energy productivity.
Additionally, for cluster A_2015, it should be mentioned in this context that “Primary energy consumption” is an extremely relevant indicator because it is part of energy plans, but also a result of previous projections of energy consumption at the regional level. As other researchers discuss [63], the demand for energy in the future has a growing trend, and this is because the construction sector, both residential and commercial, is growing, at which point the increased per capita values are added, aspects to be neglected and particularly important from the point of view of the EU targets for 2030 and 2050.
The characteristics values of cluster B_2015 are in line with studies conducted in certain countries, such as Spain (for the period 2010–2015), which indicate that primary energies, such as coal, crude oil and natural gas, will account for an average of 83.6% of total primary energy consumption, raising concerns about the sustainability of supply and the cost of energy [64].
Moreover, the characteristics of cluster B_2015 confirm the theory that, in middle-income countries, both primary and fossil fuel consumption increase CO2 emissions considerably and lead to the problem of greenhouse gases, wherein there is a direct relationship between urbanization, energy consumption, foreign direct investment (FDI) and carbon dioxide (CO2) emissions [65,66,67].
The countries in cluster C_2015 fold over one of the most relevant characteristics of most EU countries, whose final energy consumption is primarily influenced by an increase in energy efficiency in industry, followed by households. The main factors influencing this result are the increase of sustainable economic activity, the increase in the demand for comfort but also social factors, such as the reduction of household size [68].
In the same vein, our results are consistent with the discussions presented in the European Environment Agency Report “Trends and projections in Europe 2019”, which argues that the current efforts of Member States are still insufficient to achieve the EU targets set for 2030 [69].
For countries reunited in cluster D_2015, the increase in the “Share of renewable energy in gross final energy consumption by sector” in this group of countries is a wake-up call, as fossil fuels have been used as the main resource for energy production, and their use, unfortunately, has many negative effects, such as global warming and air pollution. On the other hand, the use of fossil fuels negatively influences the strategic dimension of sustainability, namely, the conservation of natural resources.
It is well known that fossil fuel consumption and its relationship with other variables, such as energy dependence and the share of renewable energy in gross final energy consumption, is unfortunately still a problem to be solved in most European countries that are still largely dependent on it, as evidenced by some published research [70,71].
In 2019, the countries grouped in the C_2019 cluster proved again to be the most dedicated to pursuing climate goals and achieving a transition to a sustainable energy system as soon as possible. These countries have a high degree of energy independence (having a degree of energy dependence at almost half the EU average), performing significantly in terms of GHG emissions (on average 20.81% lower than the base period), and managed to reduce their primary energy consumption compared to the reference period. Similar to the previous analysis period, in 2019, the countries with more modest performances were grouped in the D_2019 cluster.
The characteristics of the A_2019 cluster certify that the increase in sectoral energy productivity is the main driver of energy productivity improvements, which is why we can highlight and support the results of research in the field [72], which emphasizes that countries with similar demographic and economic characteristics have similar levels of energy productivity but also similar rates of improvement.
We note that the situation of countries grouped in cluster B_2019 is slightly deficient in terms of achieving the SDG 7 targets, which is why we emphasize the need for energy management, especially renewable, through constant, quantitative analysis in terms of production, such as and monitoring the performance of each Member State in order to define corrective measures against the targets set by the 2030 Agenda but also by the Paris Agreement of 2015, a need also emphasized by Cucchiella et al. [73].
Regarding the composition of cluster C_2019, it should be noted that they include former communist countries undergoing economic liberalization, and thus prove high rates of improvement of SDG 7 indicators, given the existing development gap compared to the rest of European countries with tradition. As some researchers demonstrate [62], higher levels of per capita income, as well as higher energy prices, are associated with higher energy productivity, while a higher share of industrial production is associated with lower levels of energy productivity, results consistent with our findings.
For Member States grouped in cluster D_2019, we cannot omit, however, the fact that, although economic activity is the greatest driving force to promote carbon emissions, energy intensity is in fact the greatest suppressor, which is why optimizing the industrial structure and intensifying the development of clean energy can effectively prevent the increase of carbon emissions and therefore increase the sustainability of society and the environment, as is also the case in other countries/geographical regions [74,75].
Once the mutations registered by EU countries between clusters are analyzed, we can bring back into discussion the preliminary hypotheses on which we based this research. Thus, about the first hypothesis, that the Nordic countries are likely to be grouped in a cluster of countries with high performances in terms of SDG 7, we can see that indeed the cluster C_2015 includes them, but in 2019, the component of the cluster C_2019 is extended to a number of other countries, but retaining its high performance in terms of SDG 7 targets. In this case, we can consider that the first hypothesis is verified. The results are similar to the findings of Sachs et al. [76] or the International Bank for Reconstruction and Development [5].
Regarding the second preliminary hypothesis, that small or island countries are potentially in a disadvantageous position in terms of achieving SDG 7 targets, we find that the D_2015 cluster brings together a group of countries with limited performance. The same structure is maintained in 2019, except for Ireland, which has made significant progress in achieving SDG 7 targets and has thus been allocated to another cluster. We can say that this hypothesis is also confirmed, but the most important is to highlight Ireland as a model of good practice that should be analyzed and adapted to be implemented in other countries.
Considering the third hypothesis, which assumed that for countries that have an economy based on depletable resources, the gap would increase over time compared to countries with a high share of RES in the economy in terms of achieving SDG 7 targets, the results obtained from this research cannot decisively confirm or refute the assumed hypothesis. However, analyzing the evolution of the variables that characterize clusters B_2015 and B_2019, it is found that the countries grouped in these clusters registered insignificant progress in the analyzed period, or even a decrease in performance at the individual country level, despite the fact that the cluster average suggests some progress over time, albeit limited.
The overall results of our research are also in line with current studies in the field of new, green, sustainable energy sources and respond to the new challenges that the EU, within the “Energy Union” and has taken on: decarbonization (reduction of greenhouse gases and renewable), energy security, energetic efficiency, the internal energy market, or research, innovation and competitiveness [75,76,77,78].
Similar results were presented by Popović et al. [79] and Drastichová [80], who, using the same method of analysis, demonstrated the existence of clusters of more advanced countries in terms of involvement in achieving the SDG, and in particular SDG 7. Both papers conclude that the achievements of most developed countries should also be an incentive for those that are at a lower level of development, and the changes in the allocation to clusters also reflect the path of sustainable development in the countries investigated.
Moreover, the concerns regarding the implementation of SDG 7 are not only specific to the countries of the European Union but also to other geographical areas. A number of authors have discussed the progress and obstacles in accelerating the achievement of targets in South Asia [81], India [82], Asia and Latin America [15] and Africa [83]. All these authors emphasize the importance of identifying patterns of good practice and replicating them on a regional or international scale to facilitate the transmission of knowledge to accelerate the achievement of established targets.
5. Conclusions
Given the importance of achieving the sustainable development goals set by the 2030 agenda, our work had as a starting point the analysis of the level of evolution of EU Member States in relation to the targets set by SDG 7, respectively ensuring universal access to modern energy services, improving energy efficiency and increasing the share of renewable energy.
As recent research in the field highlights [2,17,18], the issue of access to modern energy services is a challenge for all EU Member States and beyond, with a number of synergies and trade-offs that each government must take into account, as national/local/regional policies are defining in the transition to the use of renewable energy and consequently the achievement of the 2030 Agenda targets.
Our research thus adds more knowledge in terms of the current state of improved access to energy by highlighting the situation in 2015 in EU Member States and exhaustively in 2019, by identifying cluster-like groups, four in number, for each year analyzed on the basis of indicators relevant for SDG 7.
Although they registered a relatively different evolution in 2019 compared to 2015 (time intervals analyzed), we emphasize that the states grouped in clusters have a number of synergies (strengths), such as the lowest average value of final consumption energy compared to the EU average (cluster A_2019), the highest average value of primary energy consumption and the highest average value of the intensity of greenhouse gas emissions (cluster B_2019), the lowest average value of energy import dependence and the lowest average value of greenhouse gas emission intensity (cluster C_2019), the highest average values of final energy consumption and the highest average values of energy import dependence (cluster D_2019).
The results of our research also highlight the relative changes in positions between Member States’ clusters and highlight that there is a permanent dynamic at the level of specific indicators in terms of access to energy, use and supply of green energy, which leads us to the conclusion that changes in the structure of each economy in terms of achieving the targets for 2030 are permanent, constant that favors the change of society and the economy, at least in terms of fossil fuel consumption and pollution reduction.
As we pointed out in our paper, identifying the current state of play of how each European state responds to the European Green Pact, respecting the EU’s commitment to global climate action under the Paris Agreement, is a requirement but also a point-of-view reflection to identify the best solutions for Europe to become climate neutral by 2050, with a greenhouse gas-free economy.
Therefore, a relevant conclusion from our study reflects that the analysis of SDG 7-specific indicators is an absolutely necessary step that decision-makers (governments, organizations, companies, etc.) must take to bring the EU closer to the major requirements of the economy being green for the new generations. Thus, a reduction of at least 55% in net greenhouse gas emissions and a reduction of at least 40% in greenhouse gas emissions (from 1990 levels) by increasing the share to at least 32% of renewable energy and improving energy efficiency by 32.5% are certainly targets that can only be achieved by maintaining the current pace of change and intensifying efforts in lagging European countries [24].
Definitely, reducing the vulnerability of EU Member States to climate change can be achieved by identifying the most relevant policies, strategies and innovations (such as investing in green industry by increasing ICT innovation) that could help accelerate progress towards universal access to energy just before 2030. Therefore, access to green energy for industry, agriculture and services of any kind could successfully diversify European economies and reduce negative perceptions of the prospects for increasing energy efficiency, especially through renewable energy.
Not to be neglected in this context is the importance of energy productivity as an objective of SDG 7 and its correlation with the impact of information and communication technology (ICT) on the future of global energy consumption. This is because ICT equipment is consuming more and more energy and can affect the use of energy in almost all sectors, as some researchers argue [12,84].
From this point of view, we also identify a new perspective in terms of the relationship between ICT development and energy consumption because the unbalanced increase in energy productivity in each country can be improved through the development of ICT. Therefore, accelerating the development of ICT, especially in underdeveloped economies, can significantly contribute to sustainable energy consumption, results also confirmed by the existing literature [85,86].
As a corollary, there is no doubt that EU actions, through proposed policies and strategies, through launched initiatives (EU Emissions Trading System, adaptation to climate change, EU external climate finance, LIFE, low-carbon technologies, ozone layer protection, fluorinated greenhouse gases, nature and land use, mainstreaming of climate action, the Covenant of Mayors for Climate and Energy) aims at the permanent improvement of the financing and regulatory frameworks for the energy sectors, thus facilitating the favorable increase of inclusion for the horizon 2030 and later, but much remains to be accomplished.
The results of this empirical study should also be analyzed, taking into account the potential limitations they imply, but which may open new directions for further research. A potential constraint of this research is represented by the availability of the data and the methodological framework. Given that cluster analysis is a hypothesis-generating rather than a hypothesis-testing technique, we can uncover existing structures between selected variables without explaining the reasons for their existence.
The findings of this research could generate future research directions, expanding the set of variables used and trying to identify a generalized model, or target narrow models, to be able to follow the effectiveness of public policies and strategies adopted at the level of the analyzed countries and to assess the medium- and long-term effects on local and regional economies, but also on society as a whole.
Author Contributions
Conceptualization, D.F., G.H.I., R.P., L.M.C., S.T. and I.C.P.; methodology, D.F., G.H.I. and R.P.; supervision, D.F. and G.H.I.; writing—original draft, D.F., G.H.I. and R.P.; writing—review and editing, D.F., G.H.I., R.P., L.M.C., S.T. and I.C.P. All authors have read and agreed to the published version of the manuscript.
Funding
This research received no external funding.
Institutional Review Board Statement
Not applicable.
Informed Consent Statement
Not applicable.
Data Availability Statement
Not applicable.
Conflicts of Interest
The authors declare no conflict of interest.
References
- Diaz-Sarachaga, J.M.; Jato-Espino, D.; Castro-Fresno, D. Is the Sustainable Development Goals (SDG) index an adequate framework to measure the progress of the 2030 Agenda? Sustain. Dev. 2018, 26, 663–671. [Google Scholar] [CrossRef]
- Pereira, L.; Pinto, M.; Costa, R.L.D.; Dias, Á.; Gonçalves, R. The New SWOT for a Sustainable World. J. Open Innov. Technol. Mark. Complex 2021, 7, 18. [Google Scholar] [CrossRef]
- Pradhan, P.; Costa, L.; Rybski, D.; Lucht, W.; Kropp, J.P. A Systematic Study of Sustainable Development Goal (SDG) Interactions. Earth Future 2017, 5, 1169–1179. [Google Scholar] [CrossRef] [Green Version]
- Cameron, C.; Pachauri, S.; Rao, N.D.; McCollum, D.; Rogelj, J.; Riahi, K. Policy trade-offs between climate mitigation and clean cook-stove access in South Asia. Nat. Energy 2016, 1, 15010. [Google Scholar] [CrossRef] [Green Version]
- International Bank for Reconstruction and Development. Tracking SDG7: The Energy Progress Report 2021. 2021. Available online: https://irena.org/-/media/Files/IRENA/Agency/Publication/2021/Jun/SDG7_Tracking_Progress_2021.pdf (accessed on 8 July 2021).
- United Nations. Accelerating SDG7 Achievement in the Time of Covid-19. 2020. Available online: https://sustainabledevelopment.un.org/content/documents/26235UNFINALFINAL.pdf (accessed on 8 July 2021).
- Dello Strologo, A.; D’Andrassi, E.; Paoloni, N.; Mattei, G. Italy versus Other European Countries: Sustainable Development Goals, Policies and Future Hypothetical Results. Sustainability 2021, 13, 3417. [Google Scholar] [CrossRef]
- Swain, R.B.; Karimu, A. Renewable electricity and sustainable development goals in the EU. World Dev. 2020, 125, 104693. [Google Scholar] [CrossRef]
- Lafortune, G.; Fuller, G.; Schmidt-Traub, G.; Kroll, C. How Is Progress towards the Sustainable Development Goals Measured? Comparing Four Approaches for the EU. Sustainability 2020, 12, 7675. [Google Scholar] [CrossRef]
- Koman, M.; Domadenik, P.; Redek, T. How Far is the European Union from Sustainable Development Goals? In Challenges on the Path toward Sustainability in Europe; Žabkar, V., Redek, T., Eds.; Emerald Publishing Limited: Bingley, UK, 2020; pp. 31–53. [Google Scholar]
- Bowen, K.J.; Cradock-Henry, N.A.; Koch, F.; Patterson, J.; Häyhä, T.; Vogt, J.; Barbi, F. Implementing the Sustainable Development Goals: Towards addressing three key governance challenges—Collective action, trade-offs and accountability. Curr. Opin. Environ. Sustain. 2017, 26–27, 90–96. [Google Scholar] [CrossRef]
- Li, J.; Zhang, X.; Ali, S.; Khan, Z. Eco-innovation and energy productivity: New determinants of renewable energy consumption. J. Environ. Manag. 2020, 271, 111028. [Google Scholar] [CrossRef] [PubMed]
- Włodarczyk, B.; Firoiu, D.; Ionescu, G.H.; Ghiocel, F.; Szturo, M.; Markowski, L. Assessing the Sustainable Development and Renewable Energy Sources Relationship in EU Countries. Energies 2021, 14, 2323. [Google Scholar] [CrossRef]
- Bigerna, S.; Bollino, C.A.; Polinori, P. Convergence in renewable energy sources diffusion worldwide. J. Environ. Manag. 2021, 292, 112784. [Google Scholar]
- Franco, I.B.; Power, C.; Whereat, J. SDG 7 Affordable and Clean Energy. In Actioning the Global Goals for Local Impact; Franco, I., Chatterji, T., Derbyshire, E., Tracey, J., Eds.; Science for Sustainable Societies; Springer: Singapore, 2020. [Google Scholar]
- Rogelj, J.; McCollum, D.; Riahi, K. The UN’s’ Sustainable Energy for All initiative is compatible with a warming limit of 2 °C. Nat. Clim. Chang. 2013, 3, 545–551. [Google Scholar] [CrossRef]
- Eurostat. Sustainable Development in the European Union. Monitoring Report on Progress Towards the SDGs in an EU Context; Publications Office of the European Union: Luxembourg, 2020. [Google Scholar]
- Meyer-Ohlendorf, N. Implementing New EU Climate Targets—Why Member State Responsibility Must Continue. 2021. Available online: https://www.ecologic.eu/sites/default/files/publication/2021/60005-Implementing-New-EU-Climate-Targets.pdf (accessed on 15 April 2021).
- Khetrapal, S.; Bhatia, R. Impact of COVID-19 pandemic on health system & Sustainable Development Goal 3. Indian J. Med. Res. 2020, 151, 395–399. [Google Scholar] [PubMed]
- Elavarasan, R.M.; Pugazhendhi, R.; Jamal, T.; Dyduch, J.; Arif, M.T.; Kumar, N.M.; Shafiullah, G.M.; Chopra, S.S.; Nadarajah, M. Envisioning the UN Sustainable Development Goals (SDGs) through the lens of energy sustainability (SDG 7) in the post-COVID-19 world. Appl. Energy 2021, 292, 116665. [Google Scholar] [CrossRef]
- Miola, A.; Schiltz, F. Measuring sustainable development goals performance: How to monitor policy action in the 2030 Agenda implementation? Ecol. Econ. 2019, 164, 106373. [Google Scholar] [CrossRef]
- Al-Nory, M.; El-Beltagy, M. An energy management approach for renewable energy integration with power generation and water desalination. Renew. Energy 2014, 72, 377–385. [Google Scholar] [CrossRef]
- Leite Pinto, R. The (un)successful EU Environmental Policy. UNIO EU Law J. 2020, 6, 51–67. [Google Scholar] [CrossRef]
- Eras-Almeida, A.A.; Egido-Aguilera, M.A. What Is Still Necessary for Supporting the SDG7 in the Most Vulnerable Contexts? Sustainability 2020, 12, 7184. [Google Scholar] [CrossRef]
- Nam-Chol, O.; Kim, H. Towards the 2 °C goal: Achieving Sustainable Development Goal (SDG) 7 in DPR Korea. Resour. Conserv. Recycl. 2019, 150, 104412. [Google Scholar]
- Ionescu, G.H.; Firoiu, D.; Tănasie, A.; Sorin, T.; Pîrvu, R.; Manta, A. Assessing the Achievement of the SDG Targets for Health and Well-Being at EU Level by 2030. Sustainability 2020, 12, 5829. [Google Scholar] [CrossRef]
- European Commission. 2030 Climate & Energy Framework. 2021. Available online: https://ec.europa.eu/clima/policies/strategies/2030_en (accessed on 15 May 2021).
- European Commission. 2050 Long-Term Strategy. 2021. Available online: https://ec.europa.eu/clima/policies/strategies/2050_en (accessed on 15 May 2021).
- Chirambo, D. Towards the achievement of SDG 7 in sub-Saharan Africa: Creating synergies between Power Africa, Sustainable Energy for All and climate finance in-order to achieve universal energy access before 2030. Renew. Sustain. Energy Rev. 2018, 94, 600–608. [Google Scholar] [CrossRef]
- West, J.J.; Smith, S.J.; Silva, R.A.; Naik, V.; Zhang, Y.; Adelman, Z.; Fry, M.M.; Anenberg, S.; Horowitz, L.W.; Lamarque, J.-F. Co-benefits of mitigating global greenhouse gas emissions for future air quality and human health. Nat. Clim. Chang. 2013, 3, 885–889. [Google Scholar] [CrossRef] [Green Version]
- Cyrek, M.; Cyrek, P. Does Economic Structure Differentiate the Achievements towards Energy SDG in the EU? Energies 2021, 14, 2229. [Google Scholar] [CrossRef]
- Băndoi, A.; Jianu, E.; Enescu, M.; Axinte, G.; Tudor, S.; Firoiu, D. The Relationship between Development of Tourism, Quality of Life and Sustainable Performance in EU Countries. Sustainability 2020, 12, 1628. [Google Scholar] [CrossRef] [Green Version]
- Delli Paoli, A.; Addeo, F.; Mangone, E. Sustainability and Sustainable Development Goals (SDGs): From Moral Imperatives to Indicators and Indexes. A Methodology for Validating and Assessing SDGs. In Perspectives for a New Social Theory of Sustainability; Nocenzi, M., Sannella, A., Eds.; Spinger: Cham, Switzerland, 2020. [Google Scholar]
- Manta, A.G.; Florea, N.M.; Bădîrcea, R.M.; Popescu, J.; Cîrciumaru, D.; Doran, M.D. The Nexus between Carbon Emissions, Energy Use, Economic Growth and Financial Development: Evidence from Central and Eastern European Countries. Sustainability 2020, 12, 7747. [Google Scholar] [CrossRef]
- Salvia, A.L.; Brandli, L.L. Energy Sustainability at Universities and Its Contribution to SDG 7: A Systematic Literature Review. In Universities as Living Labs for Sustainable Development; World Sustainability Series; Springer: Cham, Switzerland, 2020. [Google Scholar]
- Cismas, L.M.; Miculescu, A.; Negrut, L.; Negrut, V.; Otil, M.D.; Vadasan, I. Social capital, social responsibility, economic behavior and sustainable economic development–An analysis of Romania’s situation. Transform. Bus. Econ. 2019, 18, 605–628. [Google Scholar]
- McCollum, D.; Gomez Echeverri, L.; Riahi, K.; Parkinson, S. SDG7: Ensure Access to Affordable, Reliable, Sustainable and Modern Energy for All. In A Guide to SDG Interactions: From Science to Implementation; Griggs, D.J., Nilsson, M., Stevance, A., McCollum, D., Eds.; International Council for Science: Paris, France, 2017; pp. 127–173. [Google Scholar]
- Kriegler, E.; Edmonds, J.; Hallegatte, S.; Ebi, K.L.; Kram, T. A new scenario framework for climate change research: The concept of shared limate policy assumptions. Clim. Chang. 2014, 122, 401–414. [Google Scholar] [CrossRef] [Green Version]
- Riahi, K.; Dentener, F.; Gielen, D.; Grubler, A.; Jewell, J.; Klimont, Z.; Krey, V.; McCollum, D.; Pachauri, S.; Rao, S.; et al. Global Energy Ssessment—Toward a Sustainable Future; Cambridge University Press and the International Institute for Applied Systems Analysis: Cambridge, UK; New York, NY, USA; Laxenburg, Austria, 2012; pp. 1203–1306. [Google Scholar]
- Florea, N.M.; Bădîrcea, R.M.; Pîrvu, R.C.; Manta, A.G.; Doran, M.D.; Jianu, E. The impact of agriculture and renewable energy on climate change in Central and East European Countries. Agric. Econ. Czech. 2020, 66, 444–457. [Google Scholar] [CrossRef]
- Leal Filho, W.; Azeiteiro, U.; Alves, F.; Pace, P.; Mifsud, M.; Brandli, L.; Caeiro, S.; Disterheft, A. Reinvigorating the sustainable development research agenda: The role of the sustainable development goals (SDG). Int. J. Sustain. Dev. World Ecol. 2018, 25, 131–142. [Google Scholar] [CrossRef] [Green Version]
- Fricko, O.; Havlik, P.; Rogelj, J.; Klimont, Z.; Gusti, M.; Johnson, N.; Kolp, P.; Strubegger, M.; Valin, H.; Amann, M.; et al. The marker quantification of the Shared Socioeconomic Pathway 2: A middle-of-the-road scenario for the 21st century. Glob. Environ. Chang. 2017, 42, 251–267. [Google Scholar] [CrossRef] [Green Version]
- Ionescu, G.H.; Firoiu, D.; Pîrvu, R.; Enescu, M.; Rădoi, M.-I.; Cojocaru, T.M. The Potential for Innovation and Entrepreneurship in EU Countries in the Context of Sustainable Development. Sustainability 2020, 12, 7250. [Google Scholar] [CrossRef]
- Griggs, D.J.; Nilsson, M.; Stevance, A.; McCollum, D. (Eds.) A Guide to SDG Interactions: From Science to Implementation; International Council for Science (ICSU): Paris, France, 2017. [Google Scholar]
- Weitz, N.; Carlsen, H.; Skånberg, K.; Dzebo, A. SDGs and the Environment in the EU: A Systems View to Improve Coherence. 2019. Available online: https://cdn.sei.org/wp-content/uploads/2019/10/sei-2019-pr-weitz-sdg-synergies-eu-env.pdf (accessed on 15 April 2021).
- Eurostat. SDG 7 ‘Affordable and Clean Energy’. 2021. Available online: https://ec.europa.eu/eurostat/web/sdi/affordable-and-clean-energy (accessed on 20 April 2021).
- Jain, A.K.; Murty, N.M.; Flynn, P.J. Data clustering: A review. ACM Comput. Surv. 1999, 31, 264–323. [Google Scholar] [CrossRef]
- George, D.; Mallery, P. IBM SPSS Statistics 25 Step by Step, 15th ed.; Routledge: New York, NY, USA, 2018. [Google Scholar]
- Srivastava, A.N.; Sahami, M. (Eds.) Text Mining: Classification, Clustering, and Applications, 1st ed.; Chapman and Hall/CRC: New York, NY, USA, 2009. [Google Scholar]
- Box, G.; Jennkins, G.; Reinsel, G.; Ljung, G. Time Series Analysis: Forecasting and Control, 5th ed.; John Wiley & Sons: Hoboken, NJ, USA, 2016. [Google Scholar]
- Anghelache, C.; Manole, A. Dynamic/chronological (time) series—Theoretical presentation, structure, relationships between indices. Roman. Stat. Rev. 2012, 10, 78–87. [Google Scholar]
- Baltac, A. Economic and Financial Analysis Based on Time Series Method. Int. J. Acad. Res. Account. Financ. Manag. Sci. 2015, 5, 77–82. [Google Scholar] [CrossRef] [Green Version]
- Kays, H.M.E.; Karim, A.N.M.; Daud, M.R.C.; Varela, M.L.R.; Putnik, G.D.; Machado, J.M. A Collaborative Multiplicative Holt-Winters Forecasting Approach with Dynamic Fuzzy-Level Component. Appl. Sci. 2018, 8, 530. [Google Scholar] [CrossRef] [Green Version]
- Held, B.; Moriarty, B.; Richardson, T. Microsoft Excel Functions and Formulas, 4th ed.; Mercury Learning and Information LLC: Dulles, VA, USA, 2018. [Google Scholar]
- Hyndman, R.J.; Athanasopoulos, G. Forecasting: Principles and Practice, 3rd ed.; OTexts: Melbourne, Australia, 2019. [Google Scholar]
- Weber, M.D.; Leemis, L.M.; Kincaid, R.K. Minimum Kolmogorov–Smirnov test statistic parameter estimates. J. Stat. Comput. Simul. 2006, 76, 195–206. [Google Scholar] [CrossRef] [Green Version]
- Yap, B.W.; Sim, C.H. Comparisons of various types of normality tests. J. Stat. Comput. Simul. 2011, 81, 2141–2155. [Google Scholar] [CrossRef]
- Psaradakis, Z.; Vávra, M. Normality tests for dependent data: Large-sample and bootstrap approaches. Commun. Stat. Simul. Comput. 2020, 49, 283–304. [Google Scholar] [CrossRef] [Green Version]
- Everitt, B.S.; Landau, S.; Leese, M. Cluster Analysis, 5th ed.; 2011; Available online: https://www.wiley.com/en-us/Cluster+Analysis%2C+5th+Edition-p-9780470749913 (accessed on 15 December 2020).
- Ward, J.H. Hierarchical grouping to optimize an objective function. J. Am. Stat. Assoc. 1963, 58, 236–244. [Google Scholar] [CrossRef]
- Jung, Y.; Park, H.; Du, D.-Z.; Drake, B.L. A decision criterion for the optimal number of clusters in hierarchical clustering. J. Glob. Optim. 2003, 25, 91–111. [Google Scholar] [CrossRef]
- Salvador, S.; Chan, P. Determining the number of clusters/segments in hierarchical clustering/segmentation algorithms. In Proceedings of the 16th IEEE International Conference on Tools with Artificial Intelligence, Boca Raton, FL, USA, 15–17 November 2004. [Google Scholar]
- Cabeza, L.F.; Palacios, A.; Serrano, S.; Ürge-Vorsatz, D.; Barreneche, C. Comparison of past projections of global and regional primary and final energy consumption with historical data. Renew. Sustain. Energy Rev. 2018, 82, 681–688. [Google Scholar] [CrossRef] [Green Version]
- Liu, X.; Moreno, B.; García, A.S. A grey neural network and input-output combined forecasting model. Primary energy consumption forecasts in Spanish economic sectors. Energy 2016, 115, 1042–1054. [Google Scholar] [CrossRef]
- Behera, S.R.; Dash, D.P. The effect of urbanization, energy consumption, and foreign direct investment on the carbon dioxide emission in the SSEA (South and Southeast Asian) region. Renew. Sustain. Energy Rev. 2017, 70, 96–106. [Google Scholar] [CrossRef]
- Al-mulali, U.; Fereidouni, H.G.; Lee, J.Y.M.; Sab, C.N.B.C. Exploring the relationship between urbanization, energy consumption, and CO2 emission in MENA countries. Renew. Sustain. Energy Rev. 2013, 23, 107–112. [Google Scholar] [CrossRef]
- Ghosh, S.; Kanjilal, K. Long-term equilibrium relationship between urbanization, energy consumption and economic activity: Empirical evidence from India. Energy 2014, 66, 324–331. [Google Scholar] [CrossRef]
- Reuter, M.; Patel, M.K.; Eichhammer, W. Applying ex post index decomposition analysis to final energy consumption for evaluating European energy efficiency policies and targets. Energy Effic. 2019, 12, 1329–1357. [Google Scholar] [CrossRef] [Green Version]
- European Environment Agency. Trends and Projections in Europe 2019. EEA Report 15. 2019. Available online: https://www.eea.europa.eu/publications/trends-and-projections-in-europe-1 (accessed on 15 April 2021).
- Martins, F.; Felgueiras, C.; Smitkova, M.; Caetano, N. Analysis of Fossil Fuel Energy Consumption and Environmental Impacts in European Countries. Energies 2019, 12, 964. [Google Scholar] [CrossRef] [Green Version]
- Martins, F.; Felgueiras, C.; Smitková, M. Fossil fuel energy consumption in European countries. Energy Procedia 2018, 153, 107–111. [Google Scholar] [CrossRef]
- Atalla, T.; Bean, P. Determinants of energy productivity in 39 countries: An empirical investigation. Energy Econ. 2017, 62, 217–229. [Google Scholar] [CrossRef]
- Cucchiella, F.; D’Adamo, I.; Gastaldi, M. Future Trajectories of Renewable Energy Consumption in the European Union. Resources 2018, 7, 10. [Google Scholar] [CrossRef] [Green Version]
- Yang, J.; Cai, W.; Ma, M.; Li, L.; Liu, C.; Ma, X.; Li, L.; Chen, X. Driving forces of China’s CO2 emissions from energy consumption based on Kaya-LMDI methods. Sci. Total Environ. 2020, 711, 134569. [Google Scholar] [CrossRef]
- Drastichová, M. Decomposition analysis of the material consumption in the European Union. Ekon. Časopis 2016, 64, 646–665. [Google Scholar]
- Sachs, J.; Kroll, C.; Lafortune, G.; Fuller, G.; Woelm, F. The Decade of Action for the Sustainable Development Goals: Sustainable Development Report 2021; Cambridge University Press: Cambridge, UK, 2021. [Google Scholar]
- European Commission. Integrated National Energy and Climate Plans. 2021. Available online: https://ec.europa.eu/info/energy-climate-change-environment/implementation-eu-countries/energy-and-climate-governance-and-reporting/national-energy-and-climate-plans_en#final-necps (accessed on 19 May 2021).
- Kulovesi, K.; Oberthür, S. Assessing the EU’s 2030 Climate and Energy Policy Framework: Incremental change toward radical transformation? RECIEL 2020, 29, 151–166. [Google Scholar] [CrossRef]
- Popović, B.; Janković Šoja, S.; Paunović, T.; Maletić, R. Evaluation of Sustainable Development Management in EU Countries. Sustainability 2019, 11, 7140. [Google Scholar] [CrossRef] [Green Version]
- Drastichová, M. Cluster Analysis of Sustainable Development Goal Indicators in the European Union. In Eurasian Economic Perspectives; Bilgin, M., Danis, H., Karabulut, G., Gözgor, G., Eds.; Eurasian Studies in Business and Economics; Springer: Cham, Switzerland, 2020; Volume 12. [Google Scholar]
- Nhamo, G.; Nhemachena, C.; Nhamo, S.; Mjimba, V.; Savić, I. Projecting Progress and Challenges to Accelerating the Achievement of SDG 7 in South Asia. In SDG7—Ensure Access to Affordable, Reliable, Sustainable and Modern Energy (Concise Guides to the United Nations Sustainable Development Goals); Emerald Publishing Limited: Bingley, UK, 2020. [Google Scholar]
- Sharma, H.P.; Chaturvedi, A. The performance of India in the achievement of sustainable development Goals: A way forward. Int. J. Mod. Agric. 2020, 9, 1496–1505. [Google Scholar]
- Sitembo, H. Sustainable Development Goals (SDGs): Far from Achievement for Sub-Saharan Africa. Preprints 2020, 2020050447. [Google Scholar] [CrossRef]
- Han, B.; Wang, D.; Ding, W.; Han, L. Effect of Information and Communication Technology on Energy Consumption in China. Nat. Hazards 2016, 84, 1–19. [Google Scholar] [CrossRef]
- Saidi, K.; Toumi, H.; Zaidi, S. Impact of Information Communication Technology and Economic Growth on the Electricity Consumption: Empirical Evidence from 67 Countries. J. Knowl. Econ. 2017, 8, 789–803. [Google Scholar] [CrossRef]
- Yan, Z.; Shi, R.; Yang, Z. ICT Development and Sustainable Energy Consumption: A Perspective of Energy Productivity. Sustainability 2018, 10, 2568. [Google Scholar] [CrossRef] [Green Version]
Publisher’s Note: MDPI stays neutral with regard to jurisdictional claims in published maps and institutional affiliations. |
© 2021 by the authors. Licensee MDPI, Basel, Switzerland. This article is an open access article distributed under the terms and conditions of the Creative Commons Attribution (CC BY) license (https://creativecommons.org/licenses/by/4.0/).