1. Introduction
Bus stops are an essential element of the public transport system. They are where passengers who want to use bus transport gather, and where vehicles stop to exchange passenger flows. Bus stops are, therefore, both the starting and ending places for passenger travel. For this reason, their accessibility plays a key role in increasing both the attractiveness and sustainability of public transport [
1]. In addition to accessibility, safety issues are another key factor in their design. Bus stops are a place of interaction between the vehicle and the pedestrian, which may lead to the occurrence of dangerous events threatening the health or life of passengers. However, the bus stop zone is also a place where other road users’ routes of movement intersect—passenger cars, pedestrians, and cyclists, who are also at risk of participating in hazardous events. The operation of bus stops generates points of conflict between various groups of traffic users, the victims of which may be pedestrians (both public transport passengers and bystanders in the bus stop zone). Studies, such as that by Ulak et al. [
2], confirm this, which indicates that pedestrians around public transportation bus stops and stations might be exposed to an elevated crash risk. To improve the bus system’s safety, many authors point to the need to conduct research not only on safety on board the bus but also at stops and interchange nodes [
3]. The literature review presented in point 2 proves that, despite numerous publications of various methodologies for the safety of bus stops, there is still a research gap that will allow the improvement of safety assessment tools for the current state audit, but also for the improvement of design work.
Therefore, the article aims to present a method of assessing bus stops’ safety, which is dedicated to the process of auditing and designing point infrastructure in the city. The use of the proposed method of evaluating bus stops is aimed not only at determining the current status, but above all at assigning priorities to actions aimed at increasing safety and improving the quality of life of residents. The significant contributions of the presented research include:
The categorisation of the current methods of assessing the safety of bus stops, presented in the introduction.
The developed audit evaluation form for bus stops.
The proposed template of qualification of the evaluation criteria.
Bus Stop Safety Assessment Method (BSSA).
The verification of the application of the BSSA method for fast line bus stops in Wroclaw.
The remainder of this paper is organised as follows.
Section 2 describes the methodology proposed by the authors for the safety assessment of bus stops.
Section 3 presents the results obtained during the verification of the proposed evaluation method in a selected city in Poland.
Section 4 discusses the crucial findings and provides some suggestions for point infrastructure managers in cities. Finally, conclusions and further research areas are discussed.
2. Literature Review
Safe conditions, at the bus stop and in its immediate vicinity, generate public transport users’ first impression. Therefore, they can influence residents’ future choices regarding their movement around the city [
4]. At the same time, safety has the highest priority in assessing the quality of bus stops. This is confirmed by the research conducted by [
5]. According to their results, most transport users would prefer short, predictable waits for buses in a safe environment over long waits for late-running vehicles in even the most elaborate and attractive transit stations, especially if they fear for their safety. However, it should be noted that public transport’s safety aspects may concern the degree of safety from crime or accidents and the feeling of security resulting from psychological factors. For this reason, [
6] distinguish the term ‘safety’, which indicates the possibility of being involved in an accident, from the term ‘security’, which refers to the chance of becoming the victim of a crime. The research presented in this article is the first approach identified by [
7], which refers to the concept of ‘safety’. For this reason, the main attention of the authors is focused on the assessment of the point infrastructure of the bus stop area, which may increase the risk of traffic accidents in its vicinity or the emergence of road conflicts. Any exchange of passengers on the bus and the behaviour of people waiting in the area of the bus stop may interfere with the traffic in the neighbouring areas. For this reason, the functioning of a bus stop causes conflicts between [
8]: (1) motor vehicles, (2) motor vehicles and non-motor vehicles, (3) passengers and non-motor vehicles, (4) passengers and motor vehicles. According to the research [
9], different bus stop designs have distinct influences on road users, such as vehicles, bicycles, and buses. For this reason, when assessing the safety of a bus stop, the potential points of occurrence of such conflict situations should also be analysed.
In [
10], despite the growing interest in monitoring public transport quality, there is a lack of focus on determining which bus stops lead to low-quality services. The reason for this approach is the fact that, although bus stops are the point of first contact between the passenger and the vehicle, the monitoring of all bus stops is an activity that produces a ‘low revenue’. Barabino emphasises that, in this connection, the tracking of all bus stops is typically a low-priority activity [
10]. However, such an approach should be considered inappropriate. The bus stop zone is an important area that requires actions aimed at improving safety in public transport. This is confirmed, among other things, by the bus accident studies conducted by Wahlberg in Sweden. The obtained results indicate that 26.4% of accidents occur in the stop zone [
11]. Accident investigators obtained similar results in China [
12]. According to their results, 28.2% of total bus crashes in urban areas occurred at bus stops [
12]. This situation generates a demand for activities to increase operating bus stops’ safety [
4].
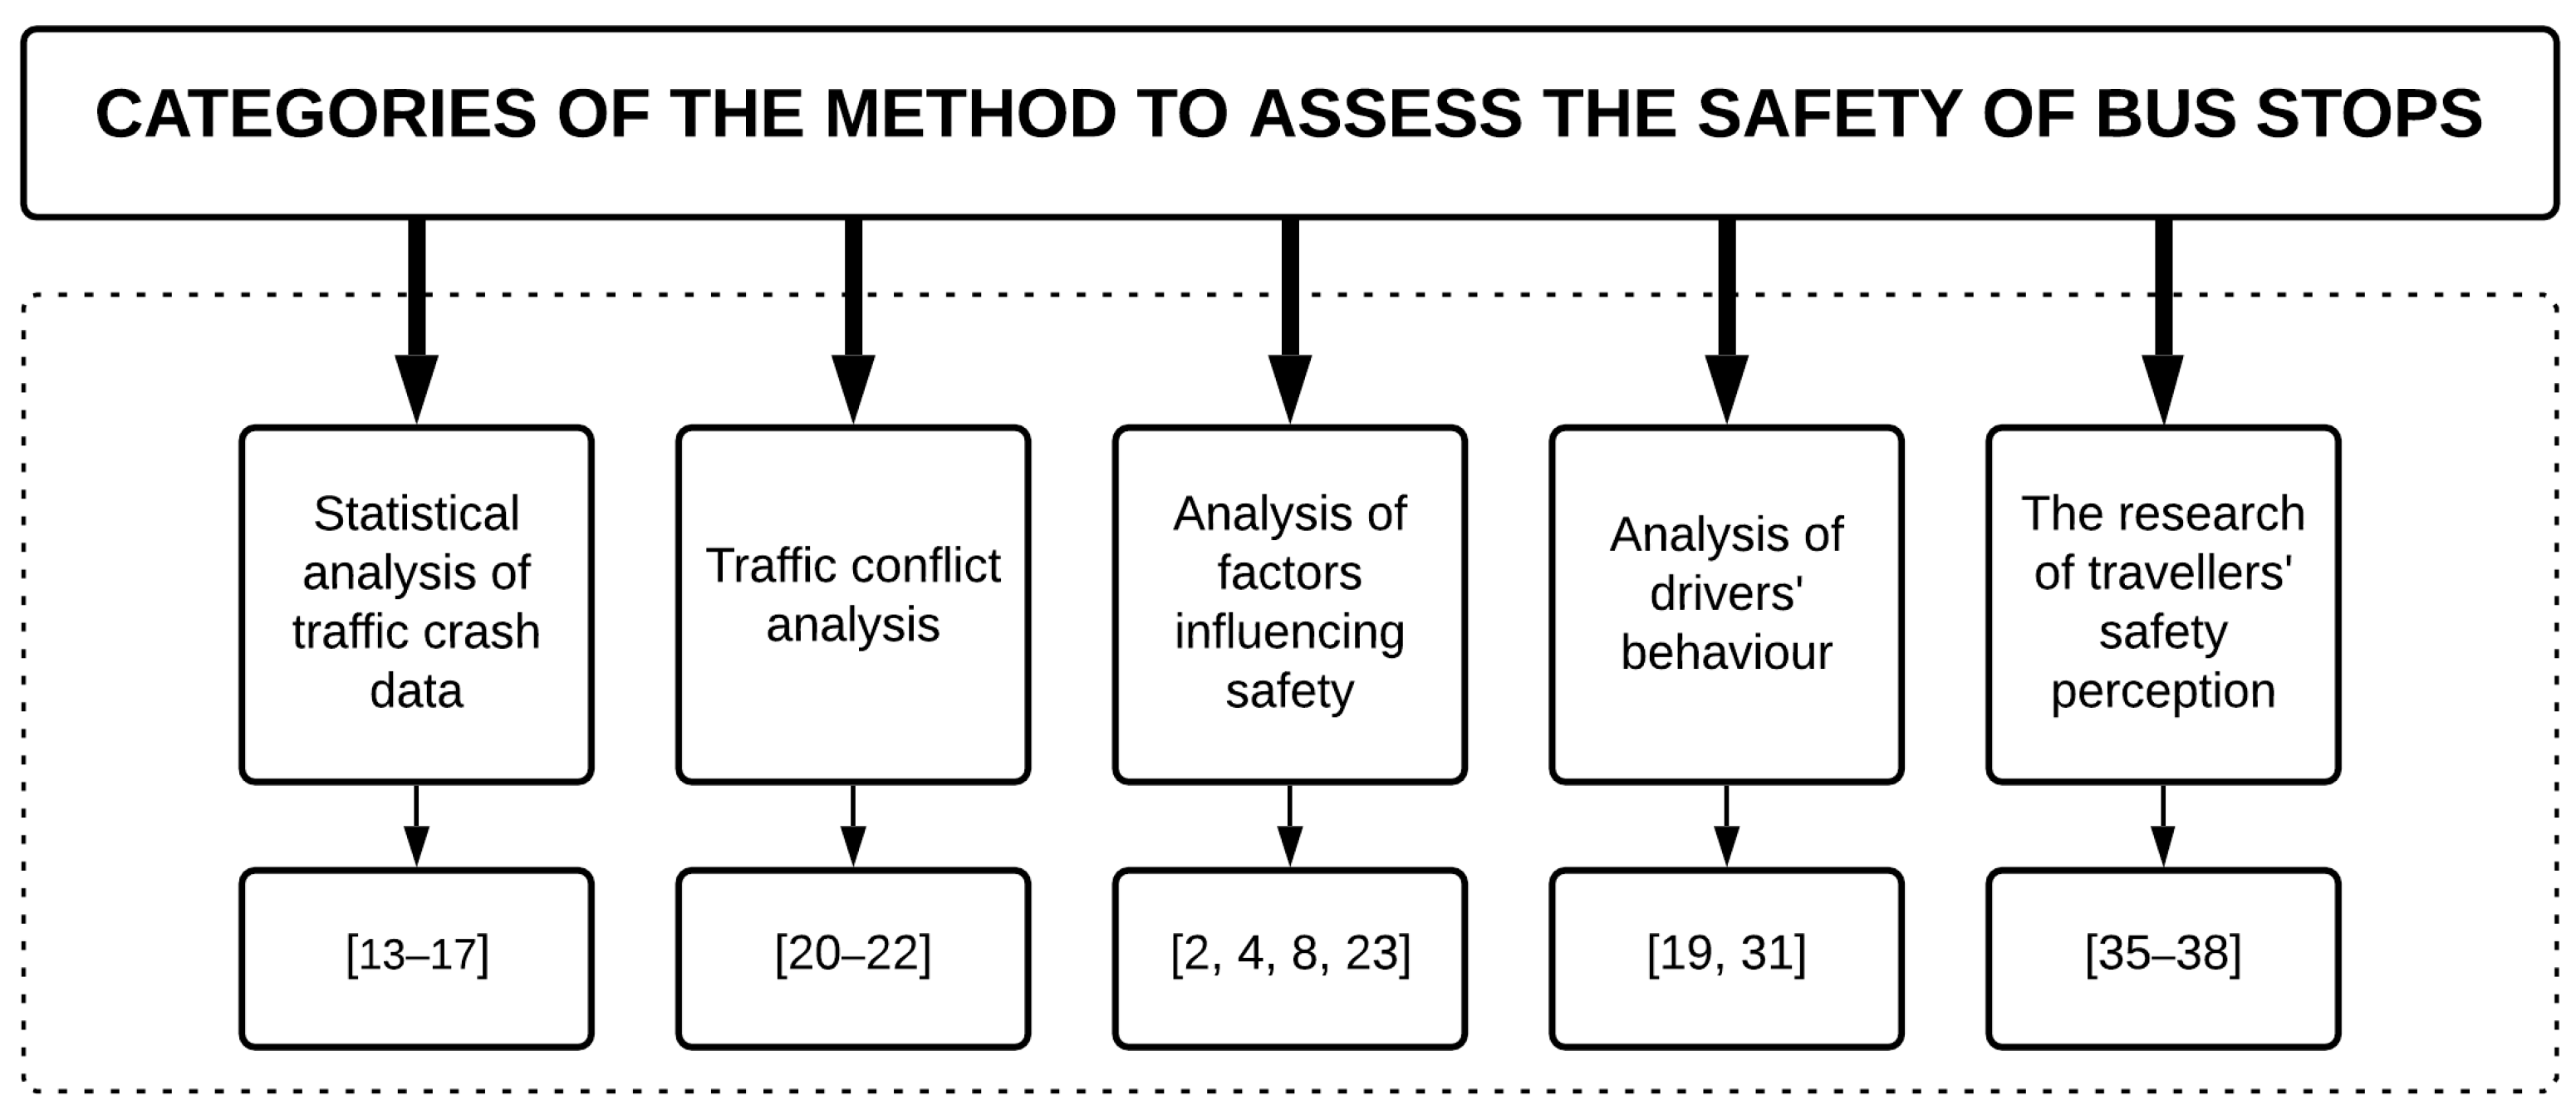
The analysis of publications on bus stops’ safety described in the literature allows distinguishing two dominant categories of evaluation methods: (1) statistical analysis of traffic crash data and (2) traffic conflict analysis. The first category of methods uses methods such as descriptive statistics, crash severity, and regression analysis. Examples of publications in this category include [
13,
14,
15,
16,
17]. In this case, the main problem is the availability of complete and up-to-date measurement data from several years for a given area. Agarwal et al. [
18] note in their research that accident data are not available or reliable in all countries (cities). Ma et al. also note that traffic crashes’ random characteristics may not reflect the bus stop’s safety level. For this reason, the prepared safety assessments of this area may be affected by errors in the results [
19].
For this reason, some researchers assess the safety level of roadway facilities using vehicular–pedestrian conflicts collected through video recording. These tests belong to the second category of traffic conflict analysis methods described in the literature. It includes, among other things, the following publications [
20,
21,
22]. The basic assumption in traffic conflict analysis is that the number of traffic conflicts is directly related to traffic crash frequency [
8]. The main advantage of this method is the fact that it does not require long-term accident data collection. Still, it is a relatively time-consuming and expensive manual process, according to Ye et al. [
8]. In addition, Cheranchery et al. [
23] note that such a research approach requires a very long implementation period. Each bus stop should be evaluated for a certain period to register the conflicts that are occurring. Simultaneously, the potential for the occurrence of conflicts may be high due to design and management deficiencies, even though the actual number of registered conflicts is not high. For this reason, Lu et al. note that this method’s weakness is also the subjectivity of the researcher’s assessment [
24].
Ye et al. [
8] point out that the bus stops’ safety assessment method should not rely on traffic crash data or traffic conflict data. In their opinion, when developing a method to assess the safety of bus stops, the following should be taken into account:
Geometric characteristic [
25];
Traffic signs and markings [
26];
Characteristics and traffic situation [
27];
Pavement conditions [
28];
Lighting conditions [
30].
Based on this approach, Ye et al. [
8] developed a concept of level-of-safety at bus stops. A similar research approach was presented by Cheranchery et al. [
23]. Their analyses assessed whether the design and management deficiencies related to bus stops contribute to bus user’s and pedestrian’s safety [
23]. The method of calculating the bus stop safety index was also proposed by Ulak et al. [
2]. Amadori and Bonino [
4] developed software for Italian bus stops using risk assessment based on traffic and geometric features. The evaluation was based on forms registering information such as vehicular traffic, vehicle speed, number of users per day at the bus stop, and number of buses per day. The authors’ research approaches create an additional category of methods for assessing bus stop safety, which has been defined as ‘analyses of factors possibly affecting safety’.
Some studies emphasise that the behaviour of bus drivers also affects the safety of stops that they use. Therefore, bus stop safety aspects also appear in qualitative research (e.g., interviews) conducted among their users, i.e., drivers. An example of such research is the analyses described in [
19], the aim of which was to identify crash risk factors associated with demographic characteristics, driving-related experiences, and aberrant driving behaviours of the drivers of public transportation vehicles. In contrast, Mirza et al. [
31] investigated the risky driving behaviour of bus drivers in Pakistan.
The last identified group of research on stop safety is the analysis of travellers’ safety perception. Research in this area indicates that some residents choose a specific mean of transportation for their daily travels to avoid events that are perceived as risky or as a threat to personal safety [
32,
33]. There is a strong link between travellers’ safety perceptions and overall travel satisfaction. This is confirmed by the research of, among others, Abenoza et al. [
34]. Their results show that perceived safety by travellers is one of the most important determinants of travel satisfaction. It should be emphasised that travellers’ perception of safety is more important than the actual level of safety. In their research, [
35] analysed the factors that might influence travellers’ self-reported safety perceptions. In the study, the authors focused on travellers’ experiences while waiting at bus stops. The subject of the analysis has three dimensions: (1) the bus stops’ design; (2) the surrounding environment of the bus stops; (3) the travellers’ characteristics [
35]. Research by Tucker [
36] is also noteworthy. In the prepared report, he proves that there are several features of bus stops that contribute to increasing the sense of safety of passengers. These include: location, surrounding environment, design, lighting, shelters, benches, maintenance and cleanliness of a stop, monitoring of a bus stop (CCTV), the amount of time waiting, number of people waiting and passing by, and the access provided to and from it [
36]. In a study of young public transport users in Melbourne [
37], it was identified that travel companions are a key element contributing to the feeling of security. Factors such as gender or the experiences of the respondents have a much smaller influence. Similar results were obtained on the basis of model studies among respondents of different ages in Melbourne [
38]. In these studies, the key elements influencing the sense of safety were trust in others and the feeling of safety of the respondents at night. In these studies, a slightly greater influence on the perception of safety was observed in terms of the respondents’ age than their gender.
The above-proposed categorisation of methods for testing the safety assessment of bus stops is shown in
Figure 1.
The literature review presented shows that there is currently a need for research on the safety assessment of bus stops and the development of concepts to improve the current solutions. For this reason, it was considered justified to develop a measurement method that would allow for identification of critical factors that should be the subject of detailed analysis, and, at the same time, accelerate the assessment process and facilitate the preparation of guidelines for the improvement of bus stops in the city. This method falls under the ‘analysis of safety determinants’ category and addresses the safety aspects of the possibility of being involved in an accident.
3. Methodology
The proposed research approach can be classified into the group of methods Analysis of factors influencing safety under the classification presented in
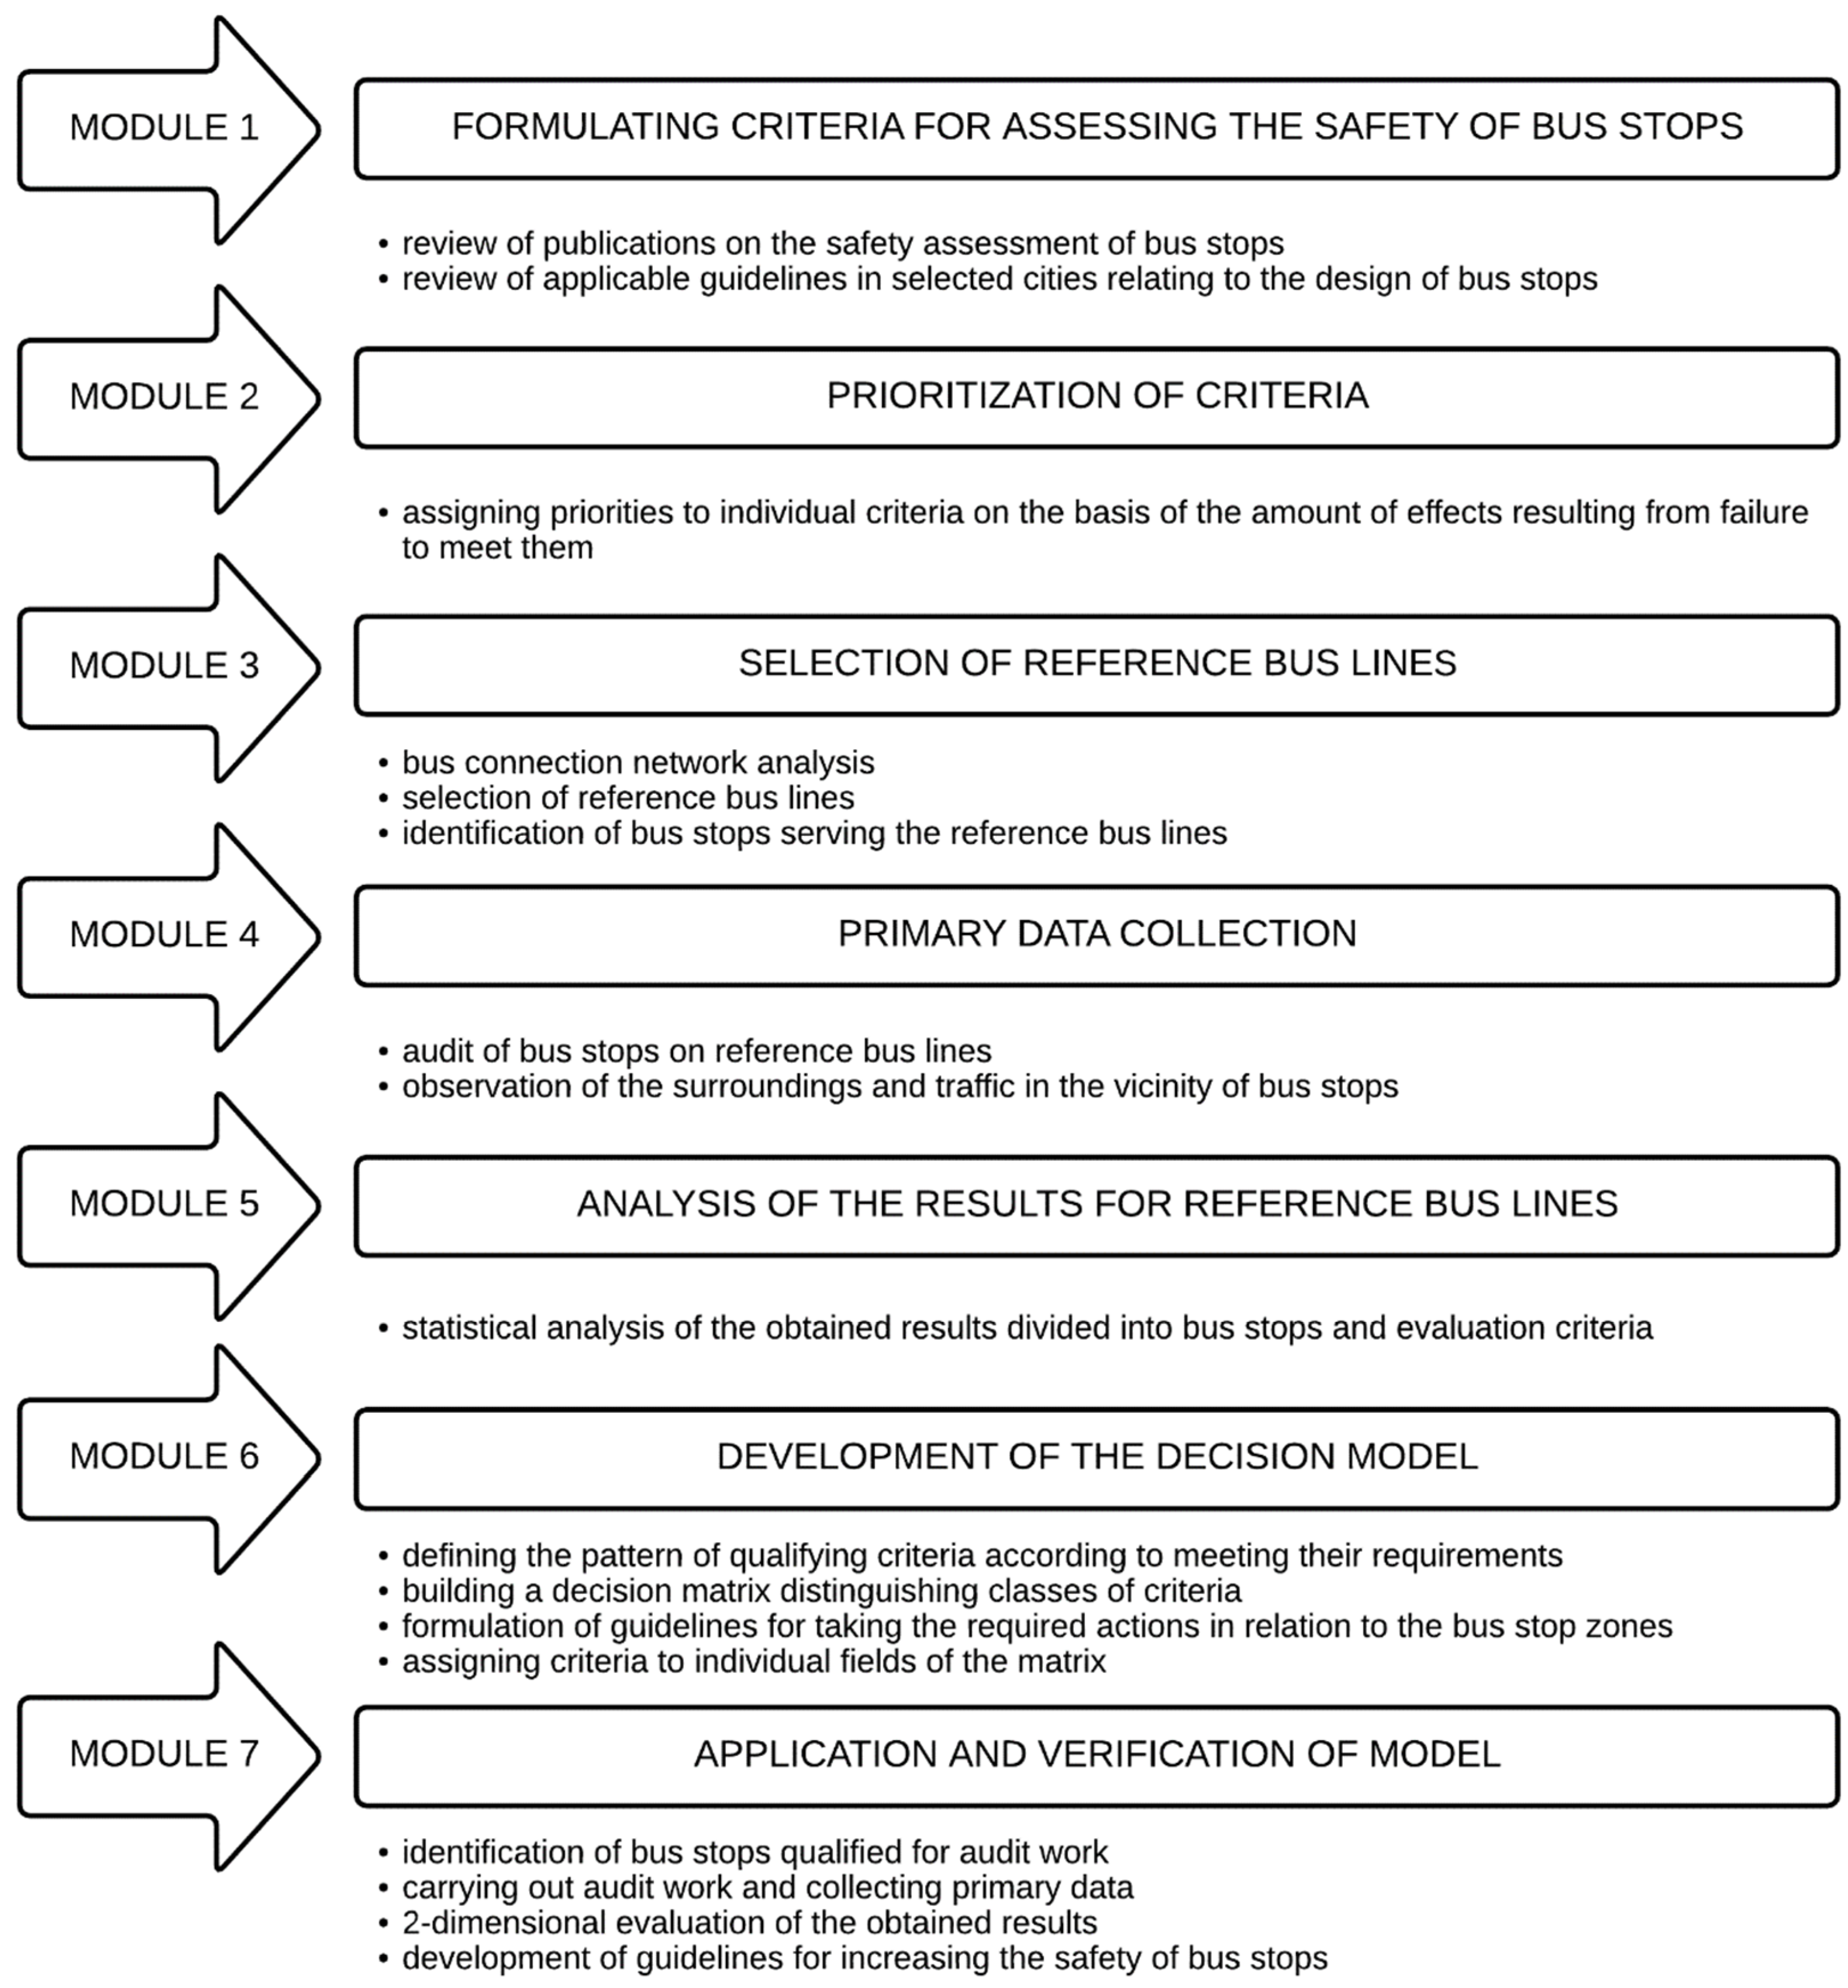
Figure 1. The proposed method refers to the point infrastructure of bus stops, and it does not include the full influence of road traffic on safety (only what is due to the infrastructure—traffic lanes, pedestrian crossings, road signs, lighting). It is dedicated to bus stops located in the bay or along the road. The method does not apply to island stops due to the different design process and the different characteristics of the traffic of vehicles and passengers, and thus also other critical safety aspects. The research procedure covers seven modules, which are shown in
Figure 2.
3.1. Module 1
Based on the literature review, it should be stated that the criteria for assessing the safety of bus stops should apply not only to the stop zone but also to its surroundings. These criteria should apply to both the bus stop infrastructure and the walk to the bus stop and its vicinity facilities. Besides, the assessment subject should also include issues regarding the manner and speed of movement of other road users in the bus stop’s vicinity. The formulated criteria should make it possible to comprehensively assess the level of safety of passengers using public transport, but at the same time cannot duplicate the same issues. The audit appraisal form should be prepared in an understandable way that allows simple answers—preferably YES/NO or a clearly defined short assessment scale. Simultaneously, the criteria should be formulated so that the form can be filled in by a person with basic knowledge of the point transport infrastructure and safety aspects in public transport.
3.2. Module 2
Failure to meet the individual criteria defined above may have different consequences for road users. For this reason, it is necessary to prioritise them, reflecting the magnitude of the effects related to the failure to meet a given safety requirement (criterion). In the proposed approach, three levels of assigned priorities were distinguished, the characteristics of which are presented in
Table 1.
3.3. Module 3
Selection of reference lines allows arranging criteria and giving them meaning, taking into account the features of the specific environment of an investigated city. The selection of reference bus lines, the stops of which will set the standard for the assessment, should be preceded by:
Analysis of the current bus network—model lines should: (a) cross the city centre—bus stops as a showcase of the city; (b) have start and end stops on the outskirts of the city; (c) connect the vital points constituting the main traffic generators in the city; (d) the reference lines should run radially across the city.
Analysis of bus stops serving bus lines—if possible, the reference lines should be those connections that do not stop at the same bus stops.
When selecting the reference bus lines, fast lines deserve special attention if they operate in a given agglomeration. They usually meet most of the conditions defined for the reference bus lines. They combine essential traffic generators in the city and the city centre with large housing estates on the agglomeration’s outskirts. Simultaneously, due to their quick movement between important traffic generators, they are more often chosen by residents, which affects a large number of people at the bus stops that serve them. For this reason, these bus stops should meet high safety standards along the line route.
3.4. Module 4
Bus stops serving selected reference lines are subject to a detailed assessment by the prepared audit form. Its fulfilment requires an audit of the bus stop infrastructure and observation of the stop’s surroundings, taking into account, e.g., the infrastructure adjacent to the bus stop and the nature of user traffic around bus stops. On this basis, primary data are collected, which constitute the basis for further analytical proceedings. Each bus stop serving bus traffic on reference lines in both directions should be assessed.
3.5. Module 5
Statistical analysis is carried out on the results obtained for individual safety assessment criteria based on the primary data collected from the bus stops serving the reference lines. The analysis aims to assess the level of compliance by a given criterion with the required safety conditions, but also to estimate for each criterion:
3.6. Module 6
For the audit process and determining guidelines for improving bus stops’ safety, it is necessary to define a pattern of qualifying criteria according to the fulfilment of their requirements. The created template will allow determining which assessed criteria constitute the binding standard for bus stops in a given city (high level of fulfilment among the assessed bus stops) and which solutions should be the subject of rapid implementation to increase safety in the bus stop zone. For the analysed evaluation method, the proposed classification pattern was presented in
Table 2.
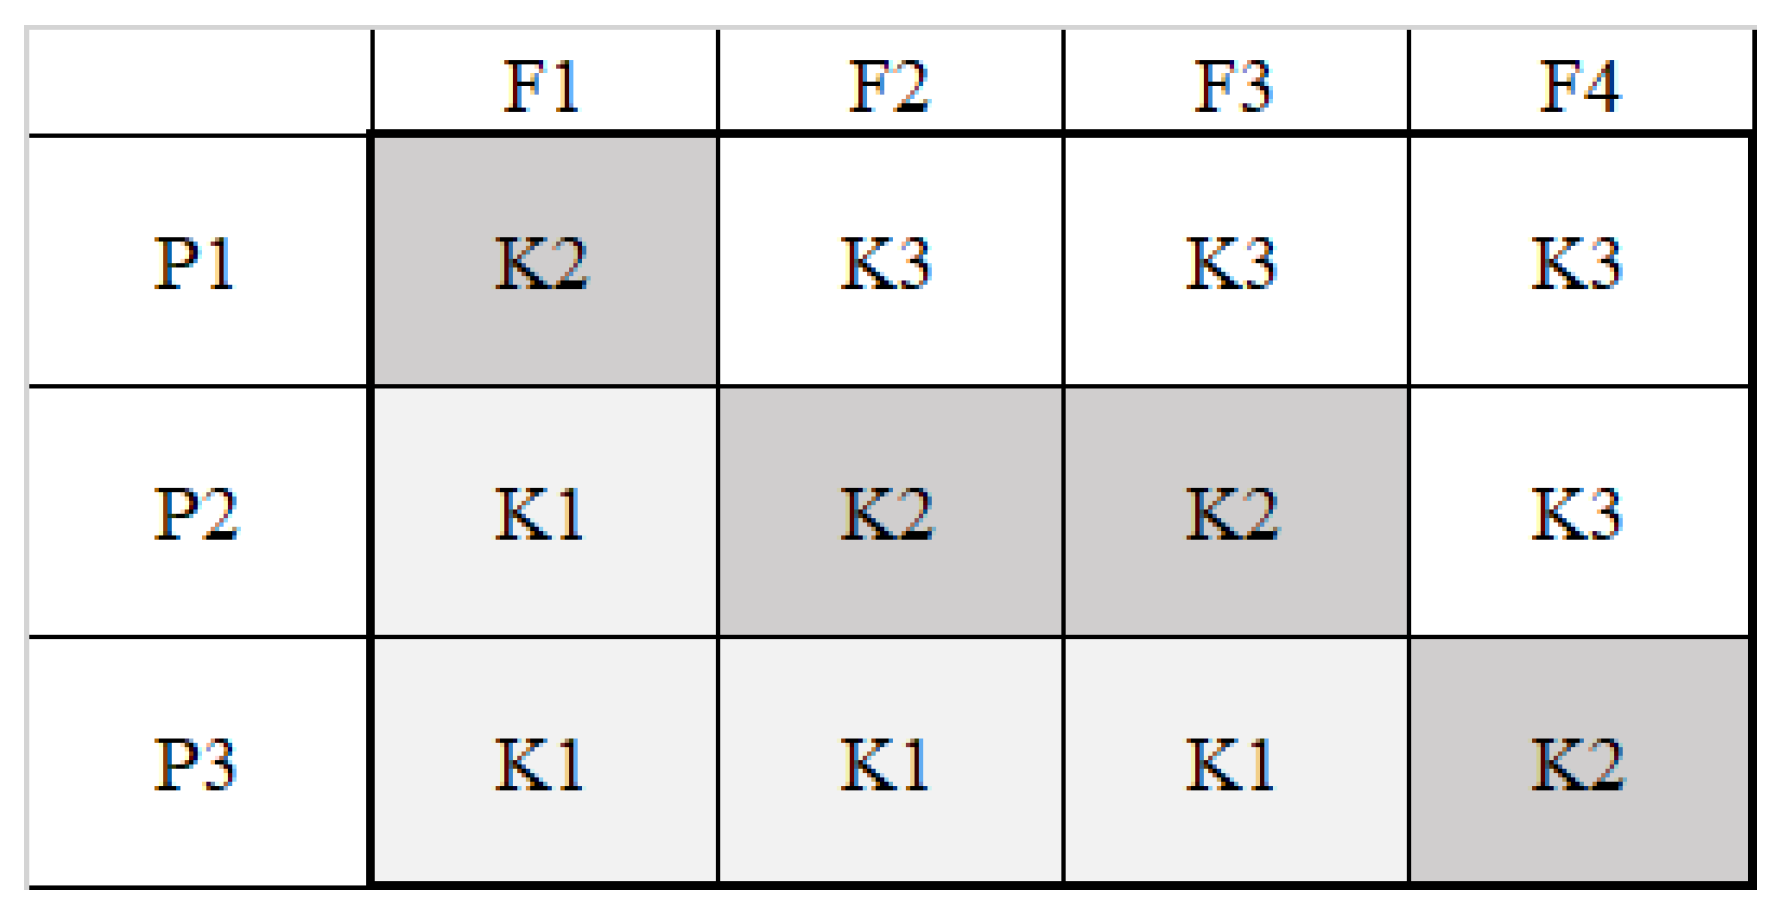
The prepared pattern of meeting the criteria, combined with the prioritisation carried out in module 2, allows for formulation of a matrix of safety assessment criteria for decision-making regarding auditing bus stops. In the matrix shown in
Figure 3, three classes of criteria have been distinguished. They define the guidelines for meeting the safety requirements assigned to stops in a given city. The distinguished division allows taking into account both the safety priority given to individual criteria within module 2, but also the safety standard in accordance with the guidelines of the transport organizer in a given city.
The characteristics of individual classes, along with guidelines for the required decisions and actions, were presented in
Table 3.
The assignment of safety assessment criteria to individual classes is carried out based on the results obtained for the bus stops serving the reference lines.
3.7. Module 7
As part of the last module of the research work, the evaluation of the remaining group of bus stops selected for further analysis is carried out. For this purpose, the bus stops indicated for the audit are identified. Then, the auditing process is carried out under the form constituting Annex 1 to this paper. The collected data are subjected to a detailed analysis considering the adopted model of the decision matrix formulated in Module 6.
The analysis of the results should be two-dimensional. In the first area, the assessment should concern individual bus stops but consider the fulfilment of the criteria in a division according to the decision matrix. Through this method, the current safety of the exploited point infrastructure in the city is assessed. Based on this analysis, guidelines for improving the assessed bus stops are also developed under the guidelines presented in
Table 3. The second assessment area is to verify the correctness of assigning criteria to individual classes based on model lines. Comparing the global score obtained by all bus stops within a given criterion will allow for verification of the guidelines adopted at the beginning regarding the design of bus stop zones in the city.
4. Results
The proposed assessment method was verified on the example of the bus stop infrastructure in Wroclaw. The analytical procedure was carried out by the methodology presented in
Figure 2. To maintain the clarity of the presented results, they were presented under the modules characterized in point 2.
4.1. Module 1—Formulating Criteria for Assessing the Safety of Bus Stops
Based on the literature review presented in
Section 1 and the guidelines defined for the standards of bus stops in selected cities of London [
39], and in Poland: Poznan [
40] and Warsaw [
41], criteria were determined for the safety assessment of the proposed approach. In total, 35 criteria were indicated that concerned the evaluation of both the bus stop zone and its vicinity (including the access routes to the bus stop). These criteria have been presented in an audit form attached as Annex 1 to the article. Criteria with numbers C1–C25 were assessed 0/1, answering YES/NO. However, the C26–C35 criteria could be assessed by partial points. Therefore, the bus stops in these criteria could score 0/0.5/1.
4.2. Module 2—Prioritization of Criteria
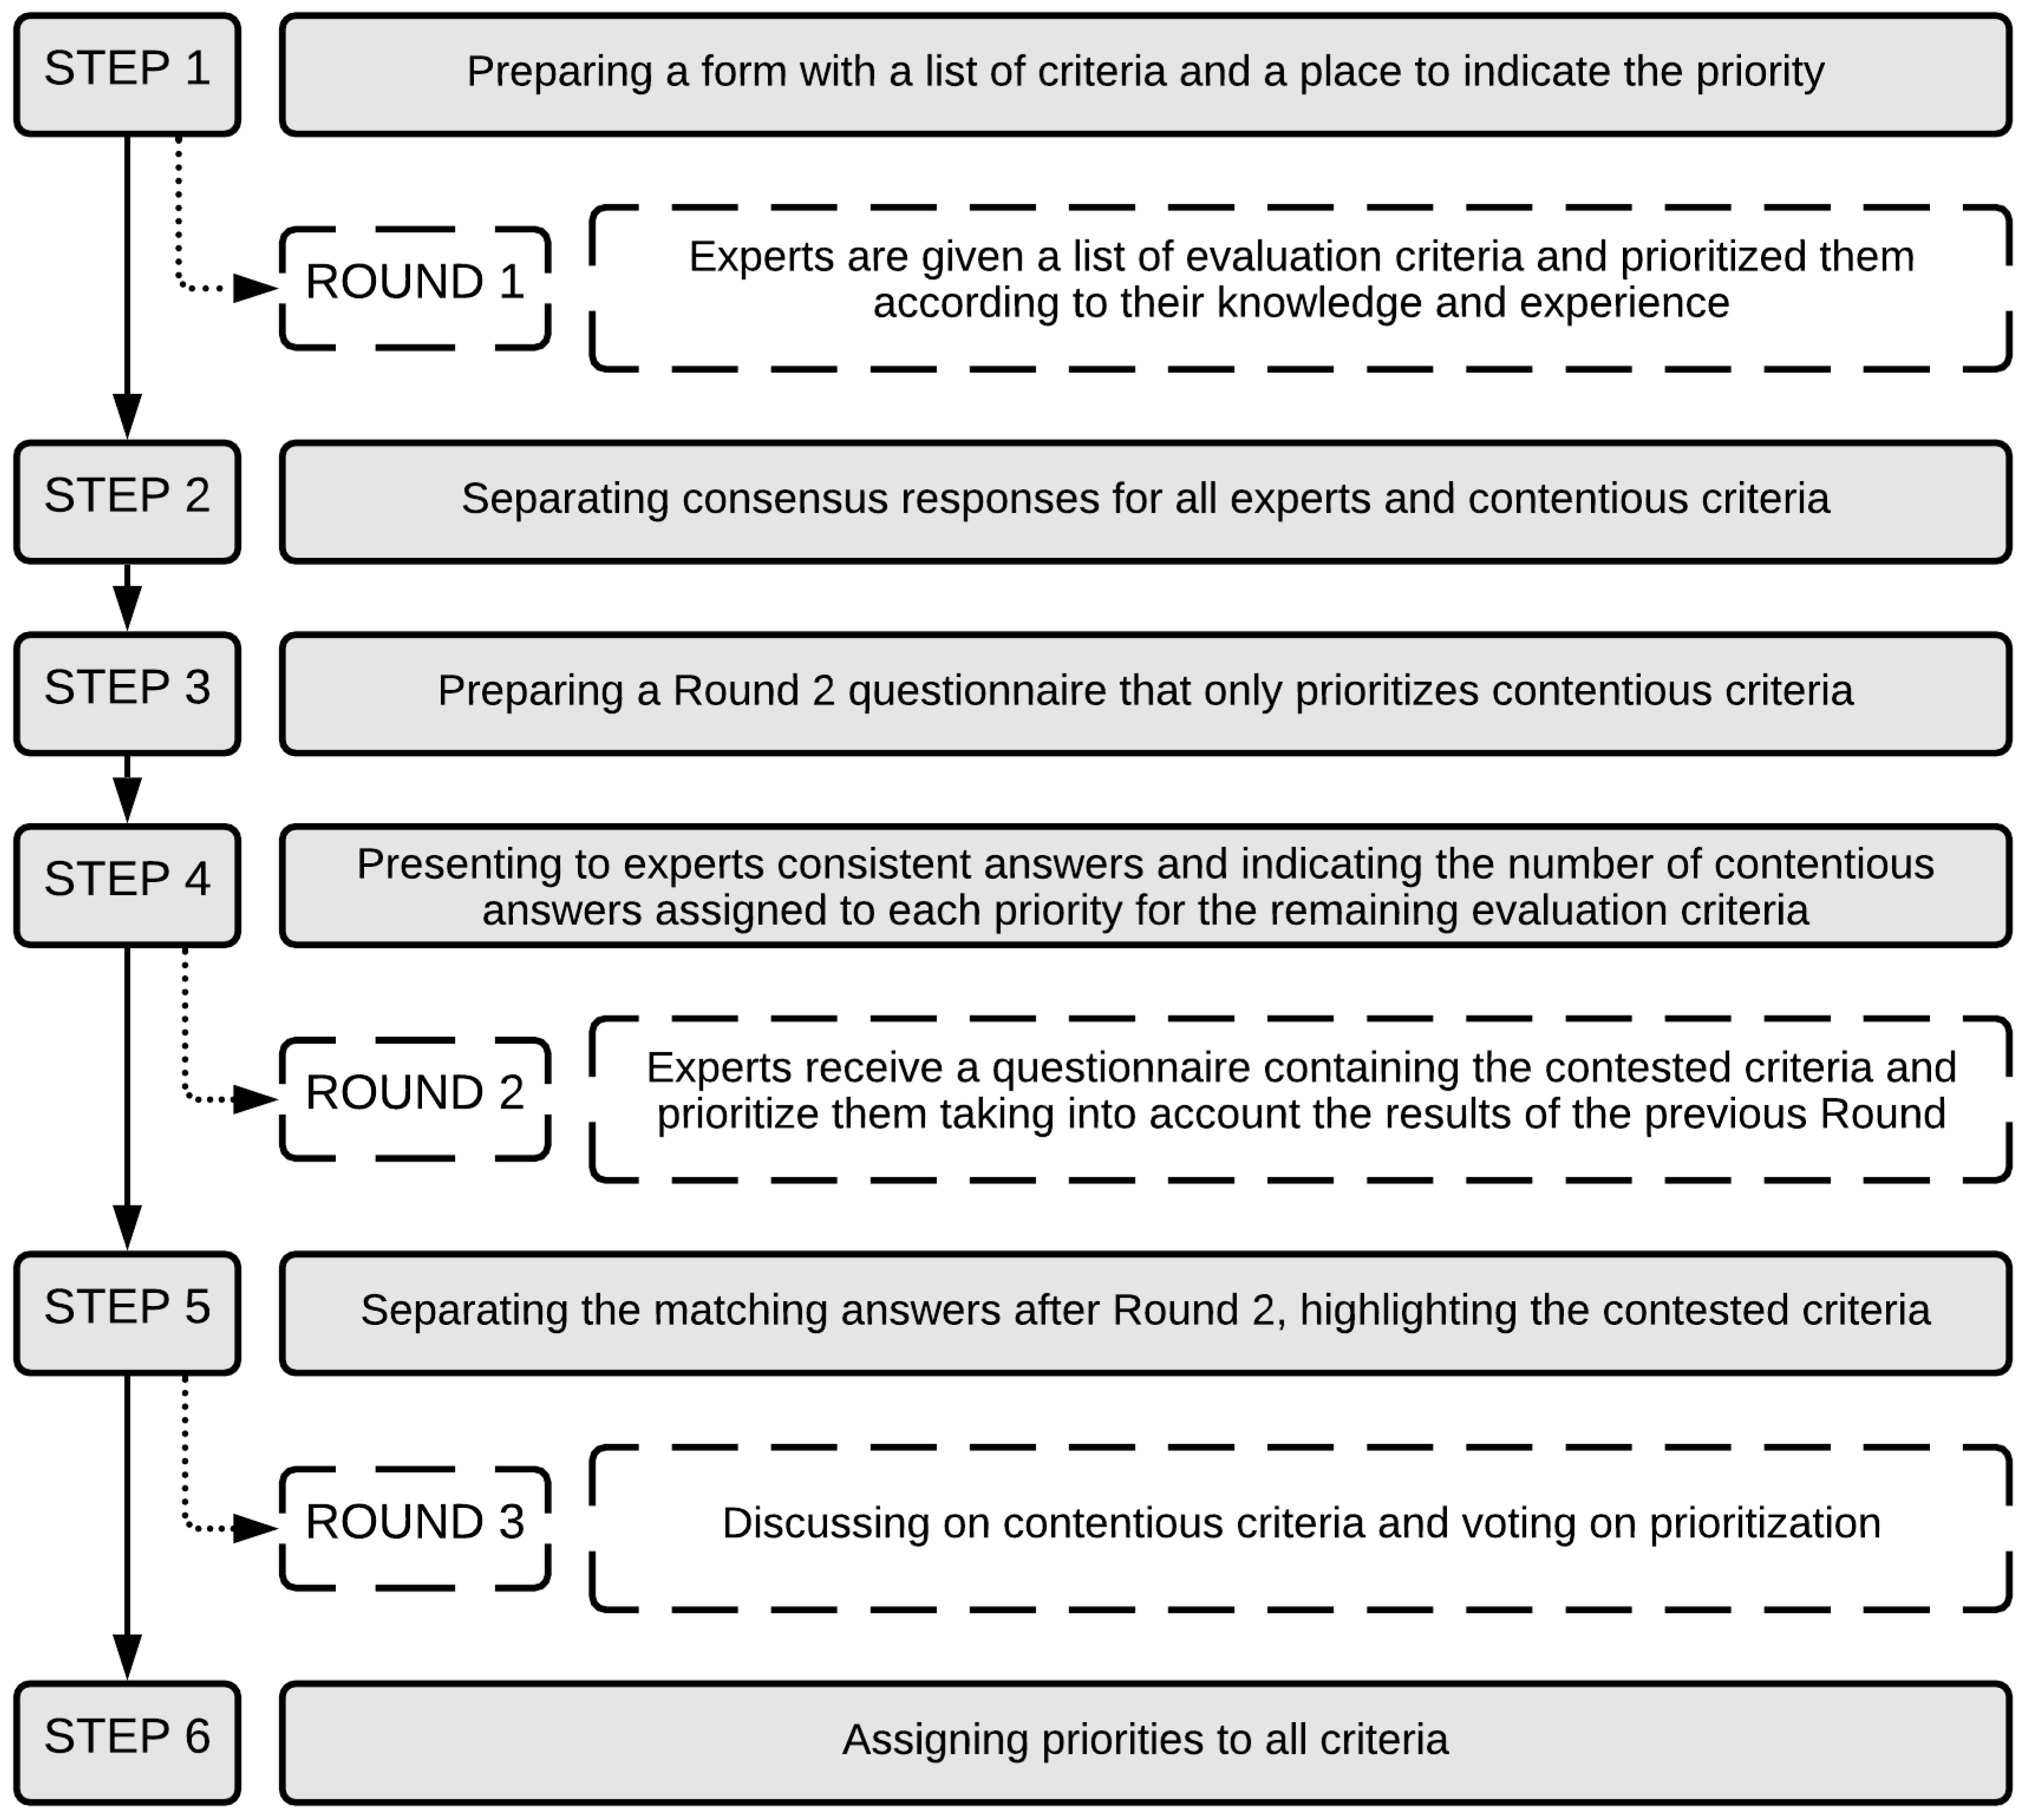
To prioritise the formulated evaluation criteria, a team of four experts was appointed, consisting of representatives of the university, city hall (transport organiser), the entity managing the bus stops, and the carrier providing public transport services. The inference was carried out using the Delphi method, which was carried out in six steps. The process of giving opinions included three rounds, leading to prioritisation. The research procedure is shown in
Figure 4.
As a result of the inference, three groups of criteria were distinguished, with different consequences of not complying with them (vide
Table 1). The results of the classification were presented in
Table 4.
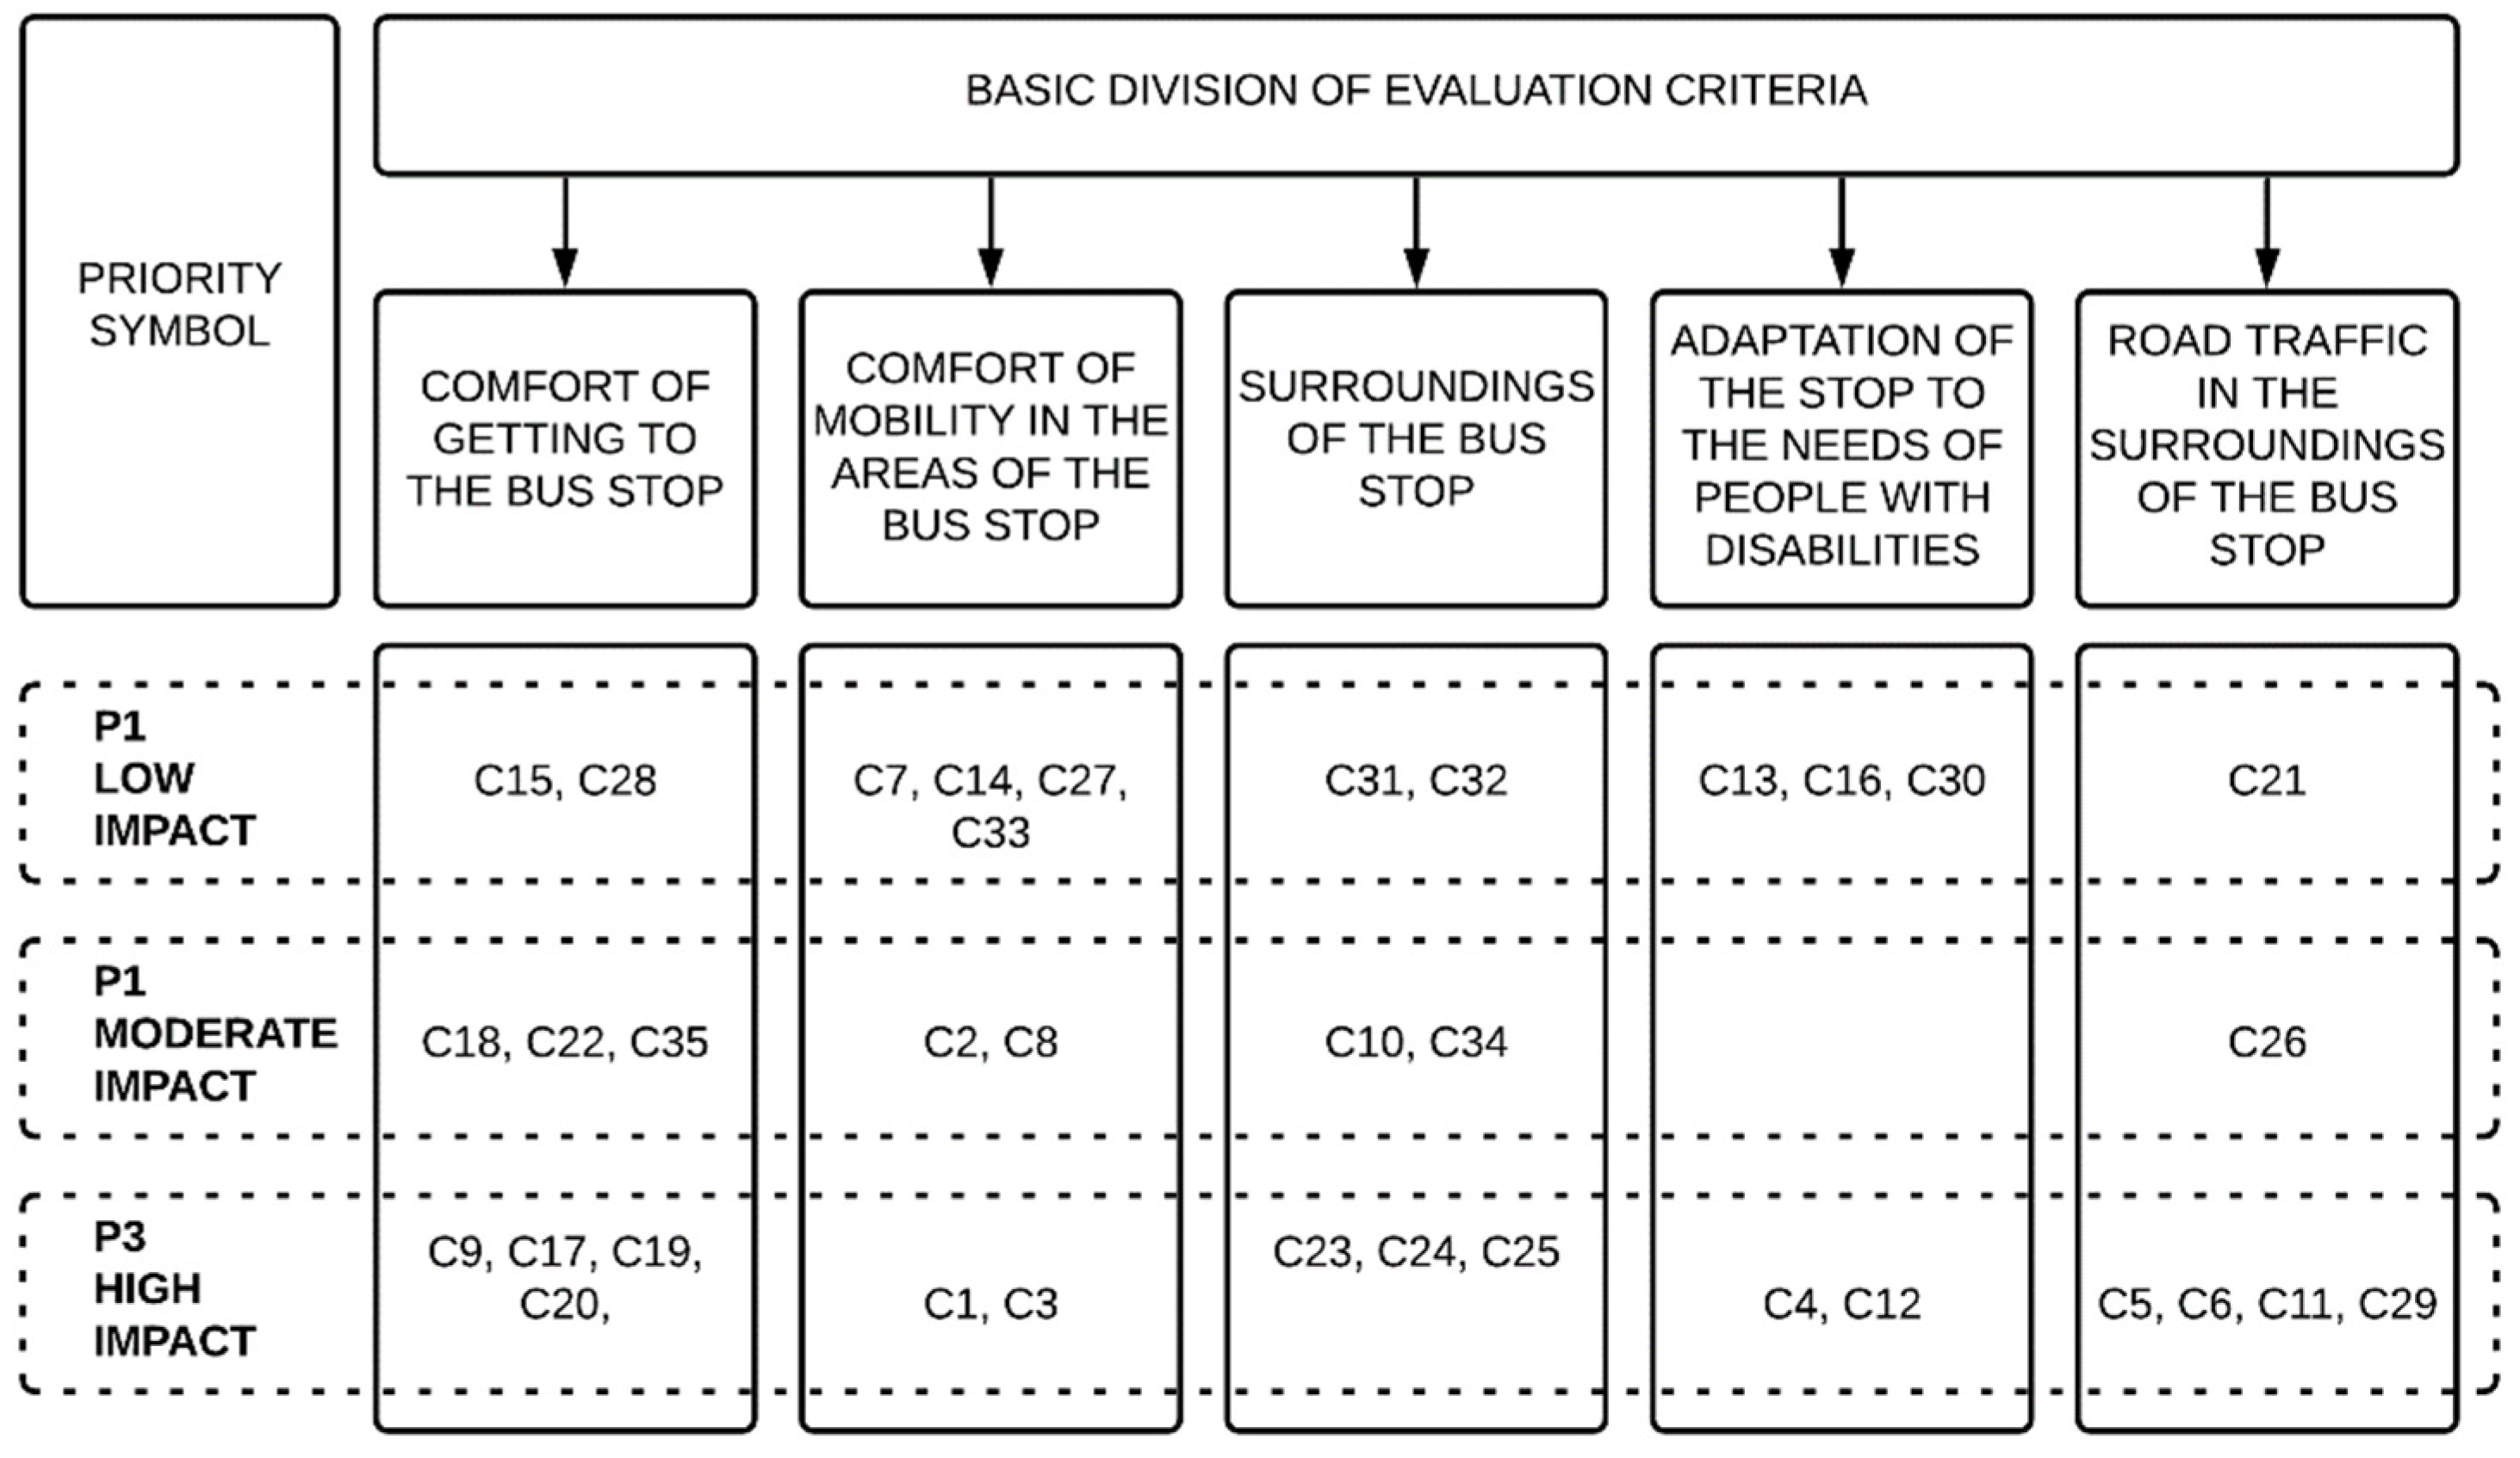
Moreover, the proposed evaluation criteria have been classified into five groups that define them. This division is presented in
Figure 5. The division was made on the basis of the following groups:
comfort of getting to the bus stop—all these evaluation criteria cover elements on the way to the bus stop or in its immediate vicinity;
comfort of mobility in the area of the bus stop—a group including criteria related to the dimensions of the stop platform and its infrastructure (including its condition);
surroundings of the bus stop—this group includes evaluation criteria related directly to the surroundings of the bus stop, including, inter alia, elements of the accompanying infrastructure as well as their technical condition;
adaptation of the stop to the needs of people with disabilities—a group that includes all assessment criteria that directly translate into facilitating the use of bus stops by people with disabilities;
road traffic in the surroundings of the bus stop—a group of evaluation factors relating to parameters related to road traffic and its organization.
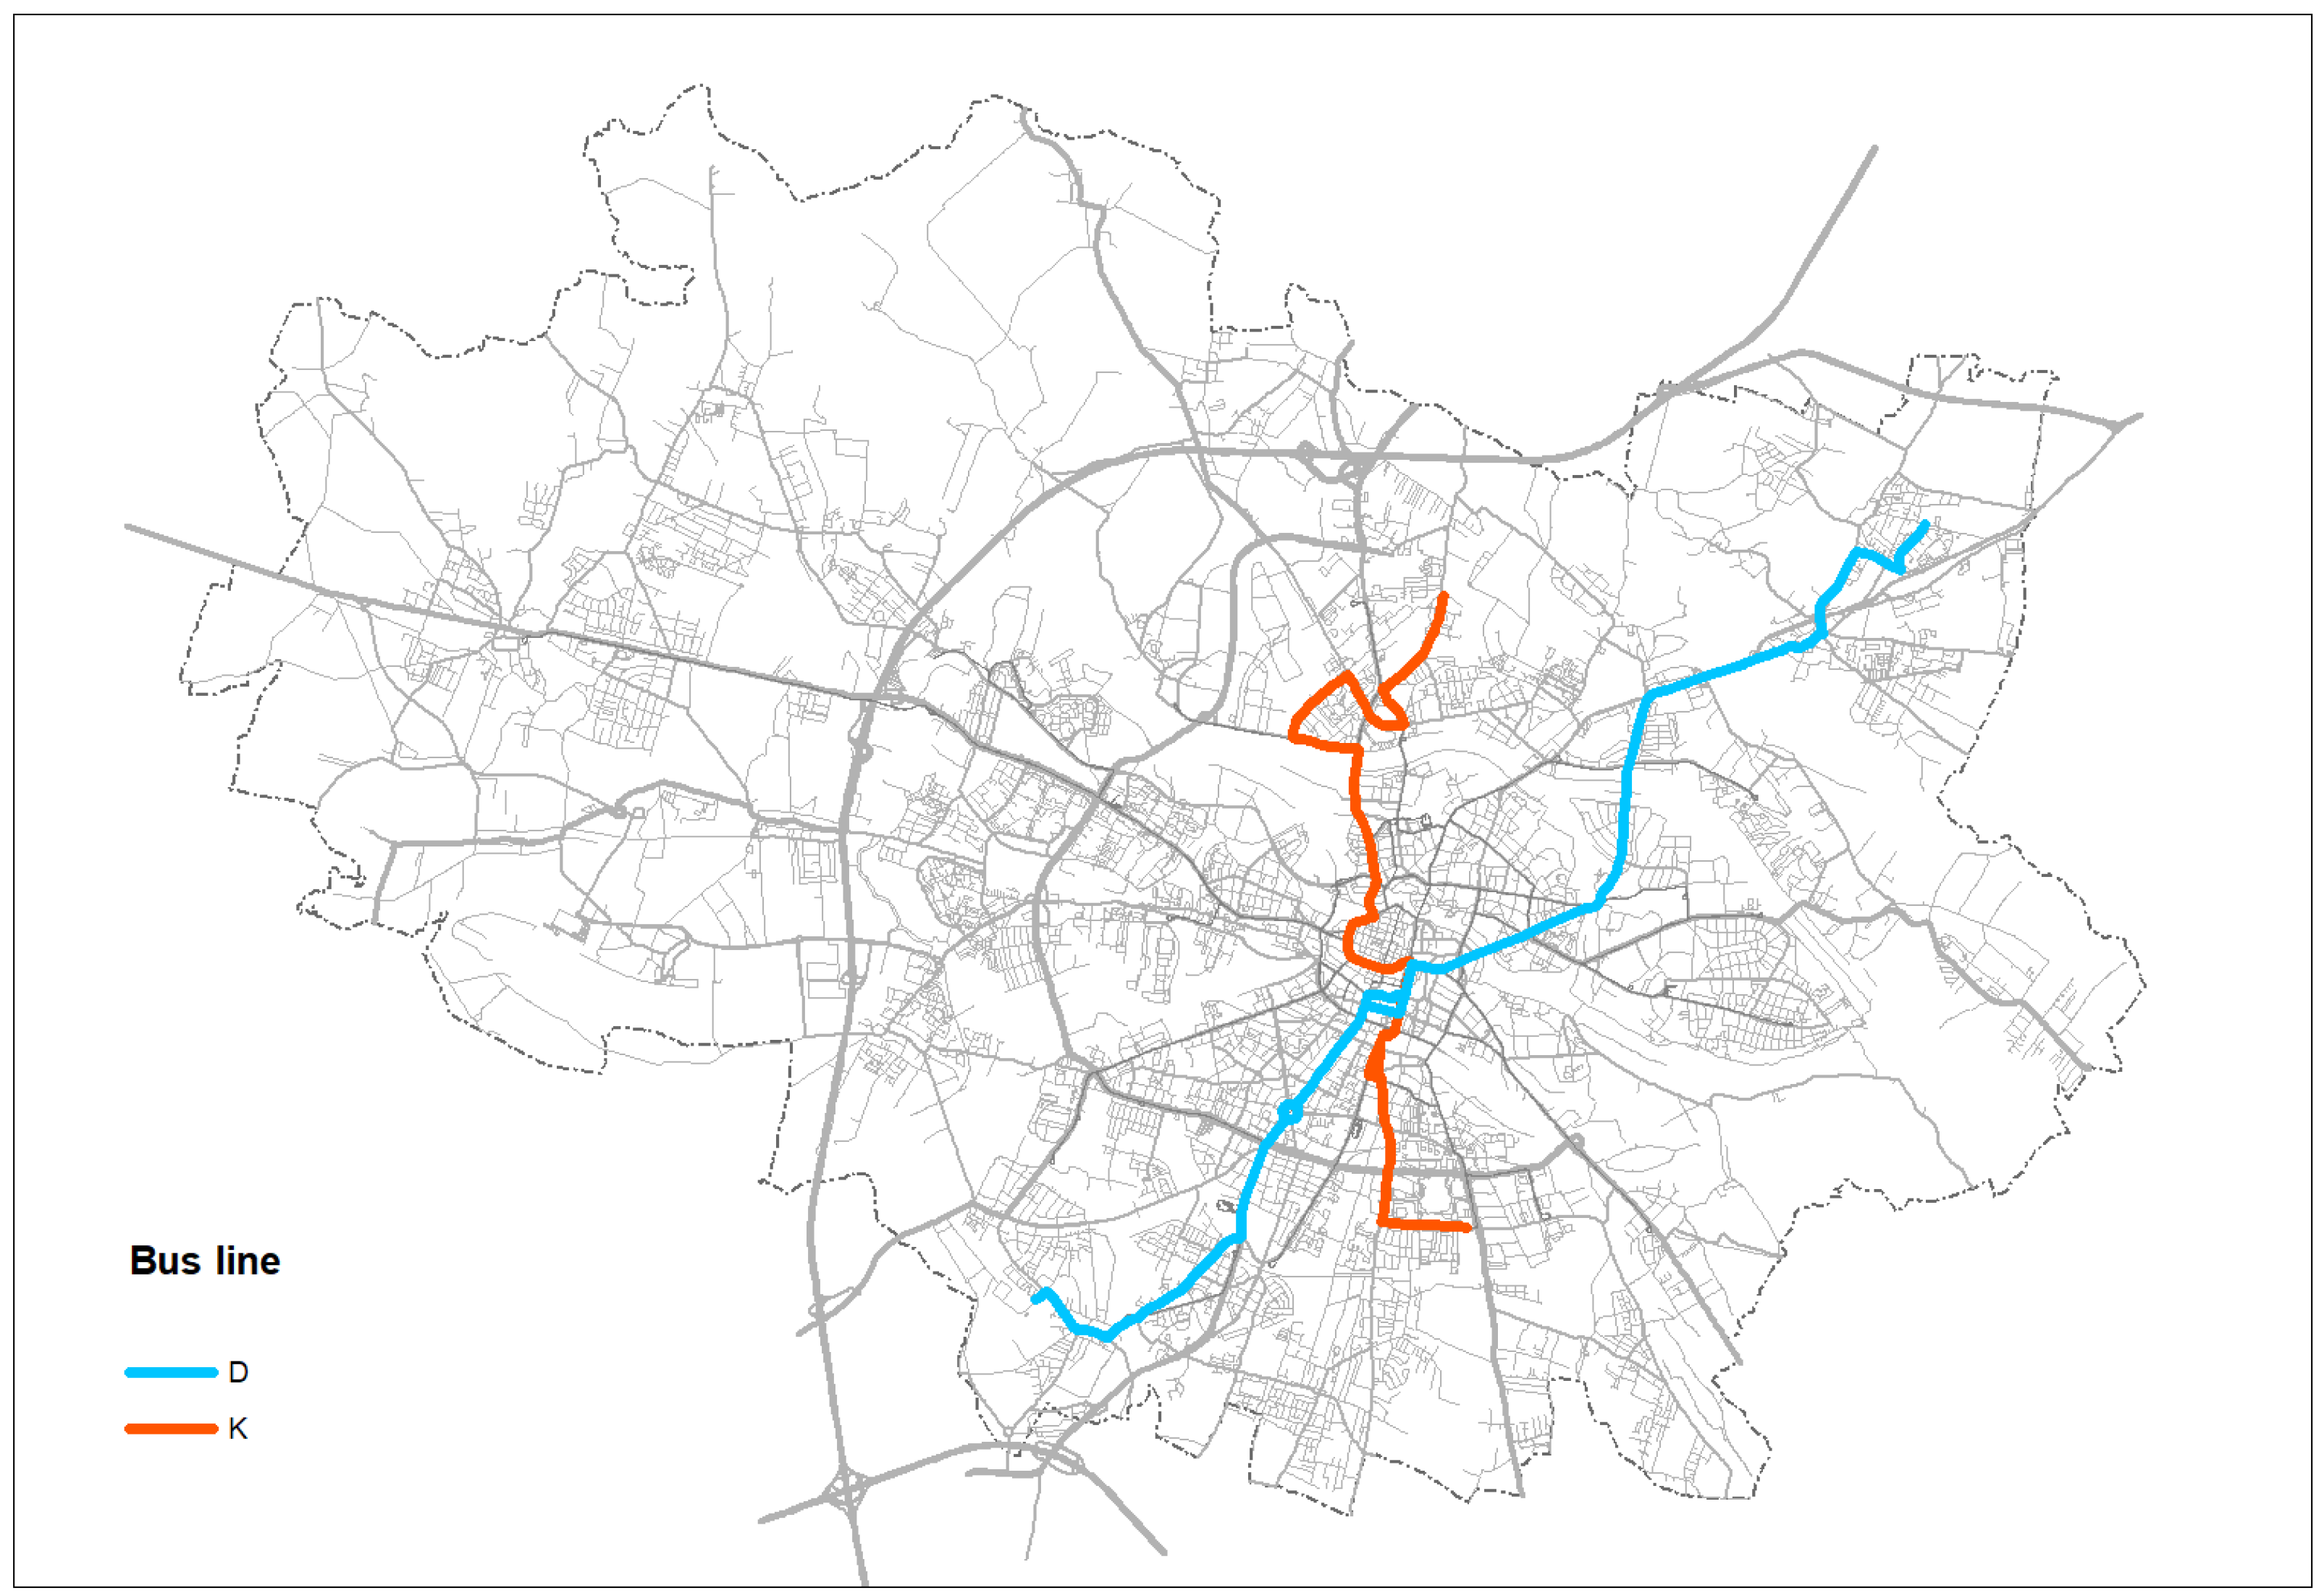
4.3. Module 3—Selection of Reference Bus Lines
Two fast lines, K and D, which meet the developed method requirements, were selected as the reference lines. The characteristics of both lines are presented in
Table 5. And routes of the reference lines are shown in
Figure 6.
It should be noted that only one of the bus stops (and only in one direction) on both routes serves both reference bus lines simultaneously. For this reason, it should be considered that the selection meets all the formal requirements set out in the model.
4.4. Module 4—Primary Data Collection and Module and 5—Analysis of the Results for Reference Bus Lines
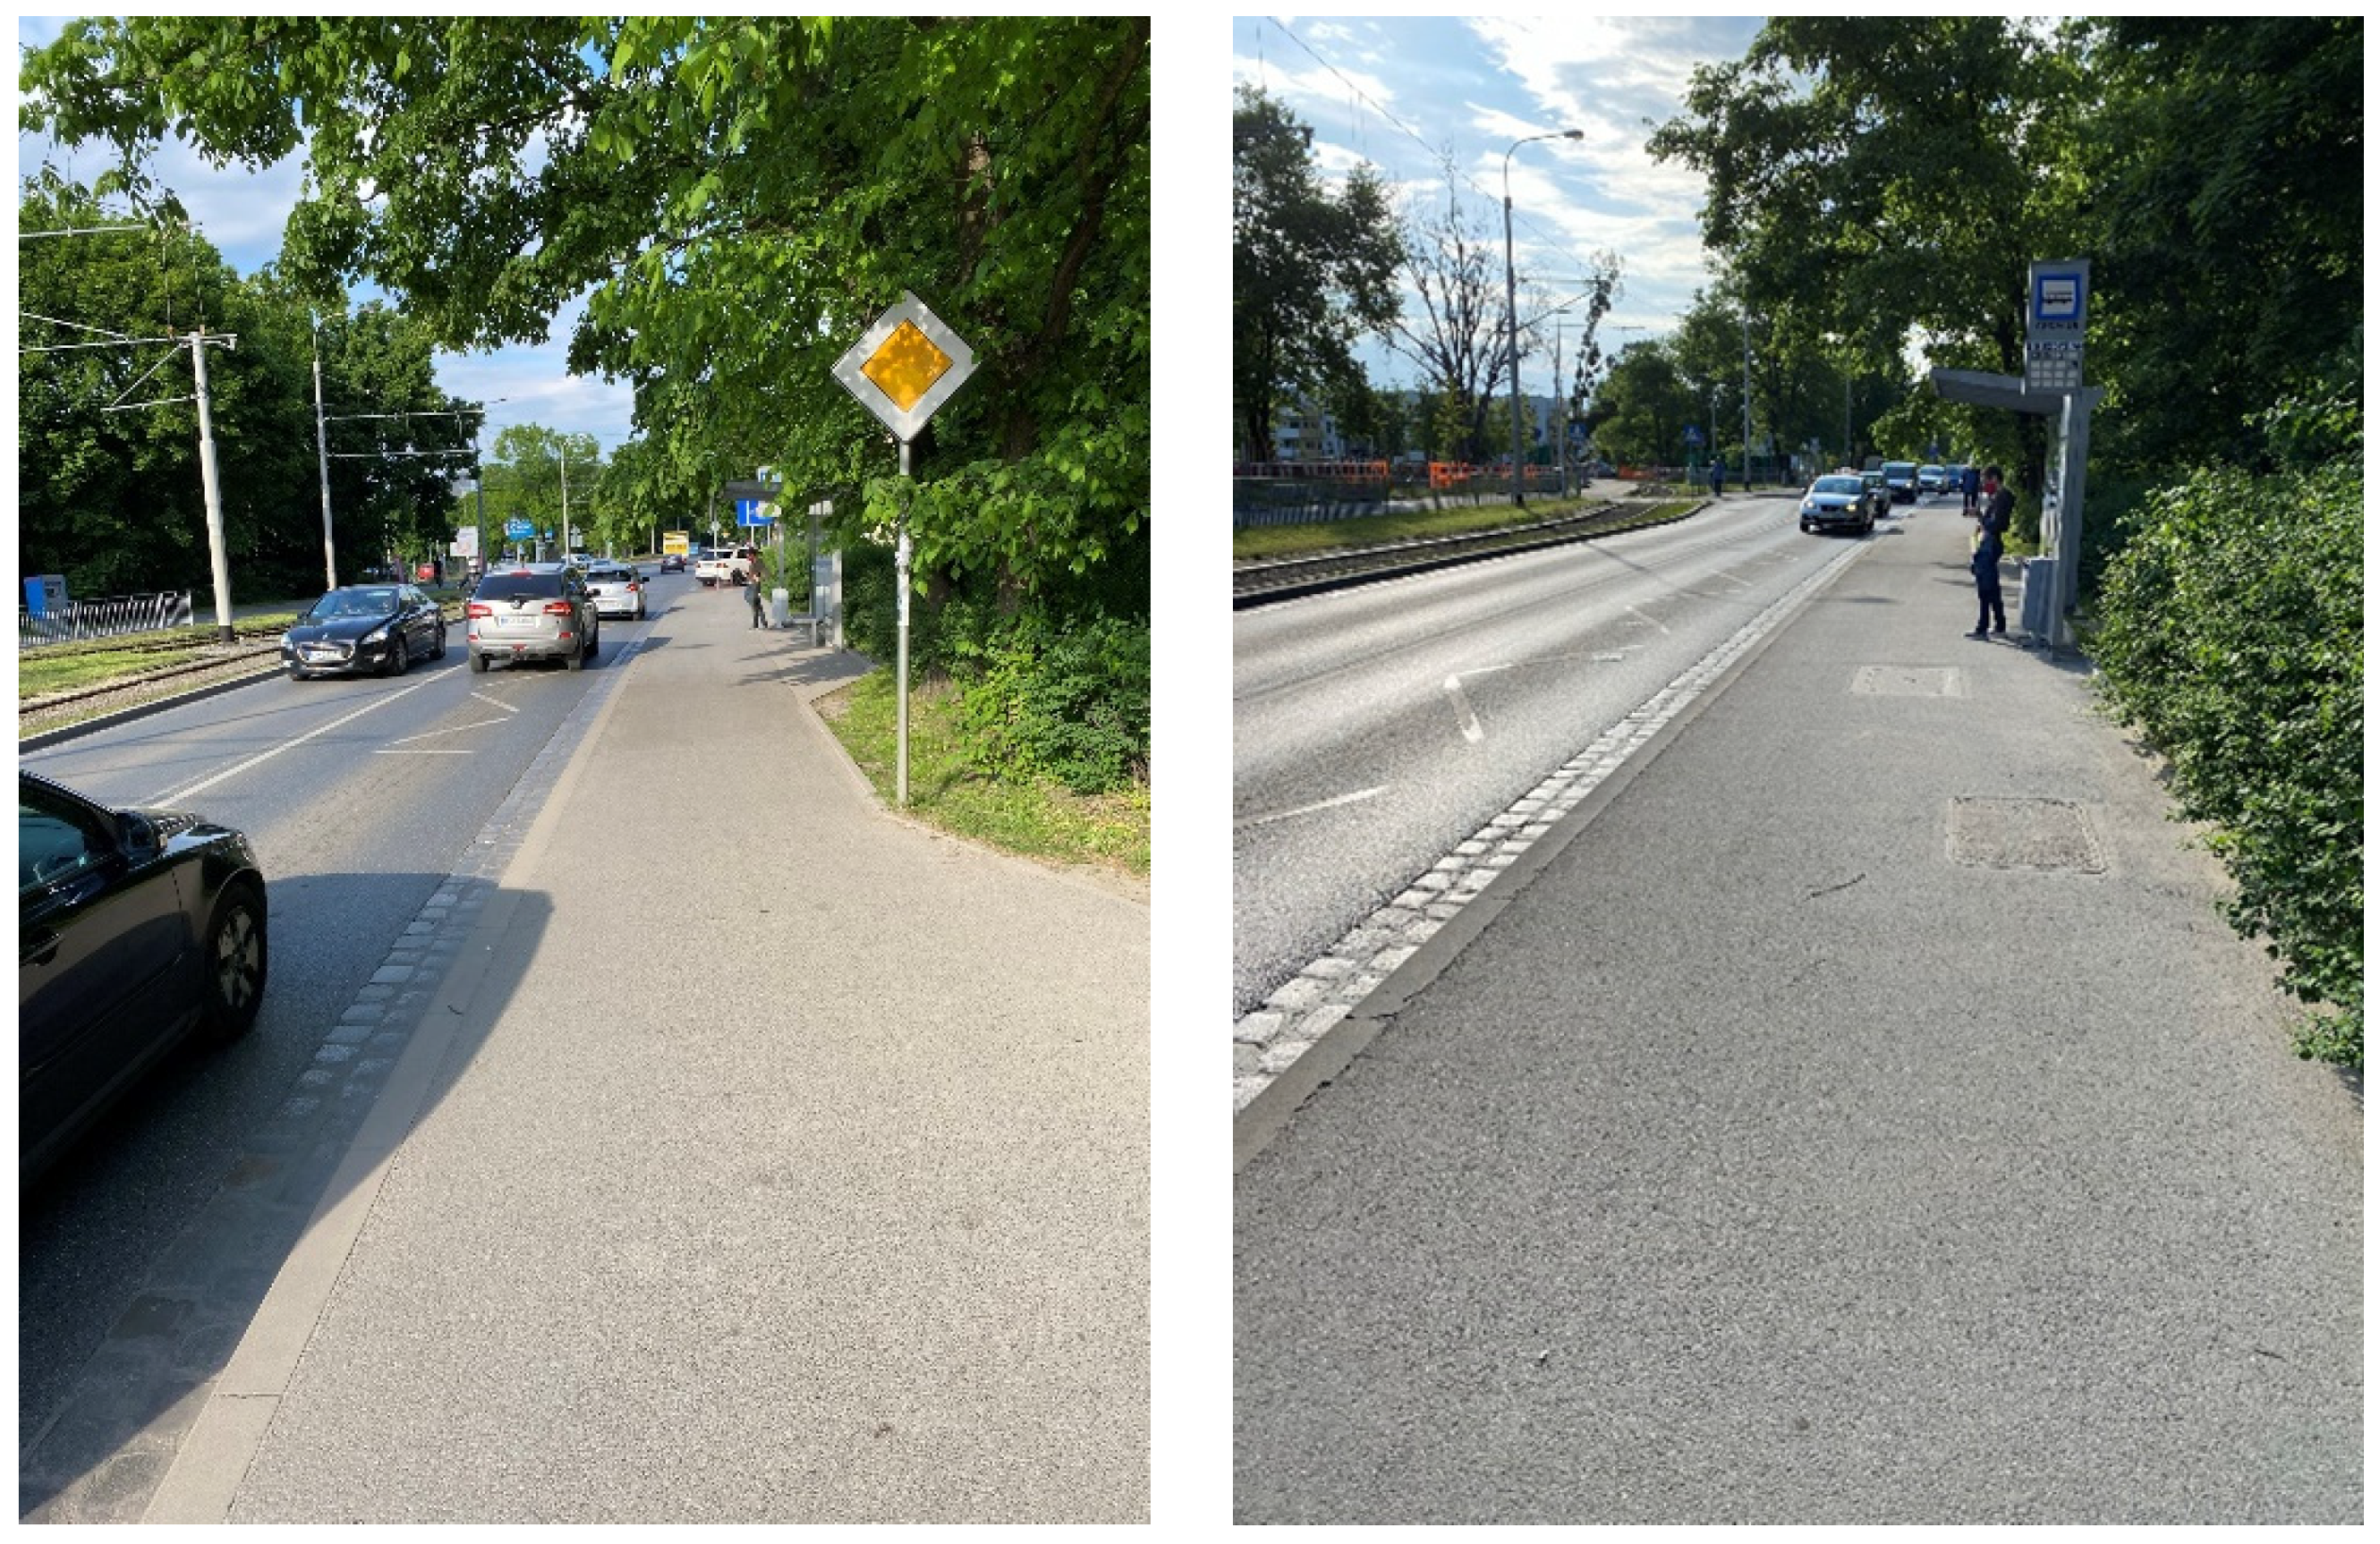
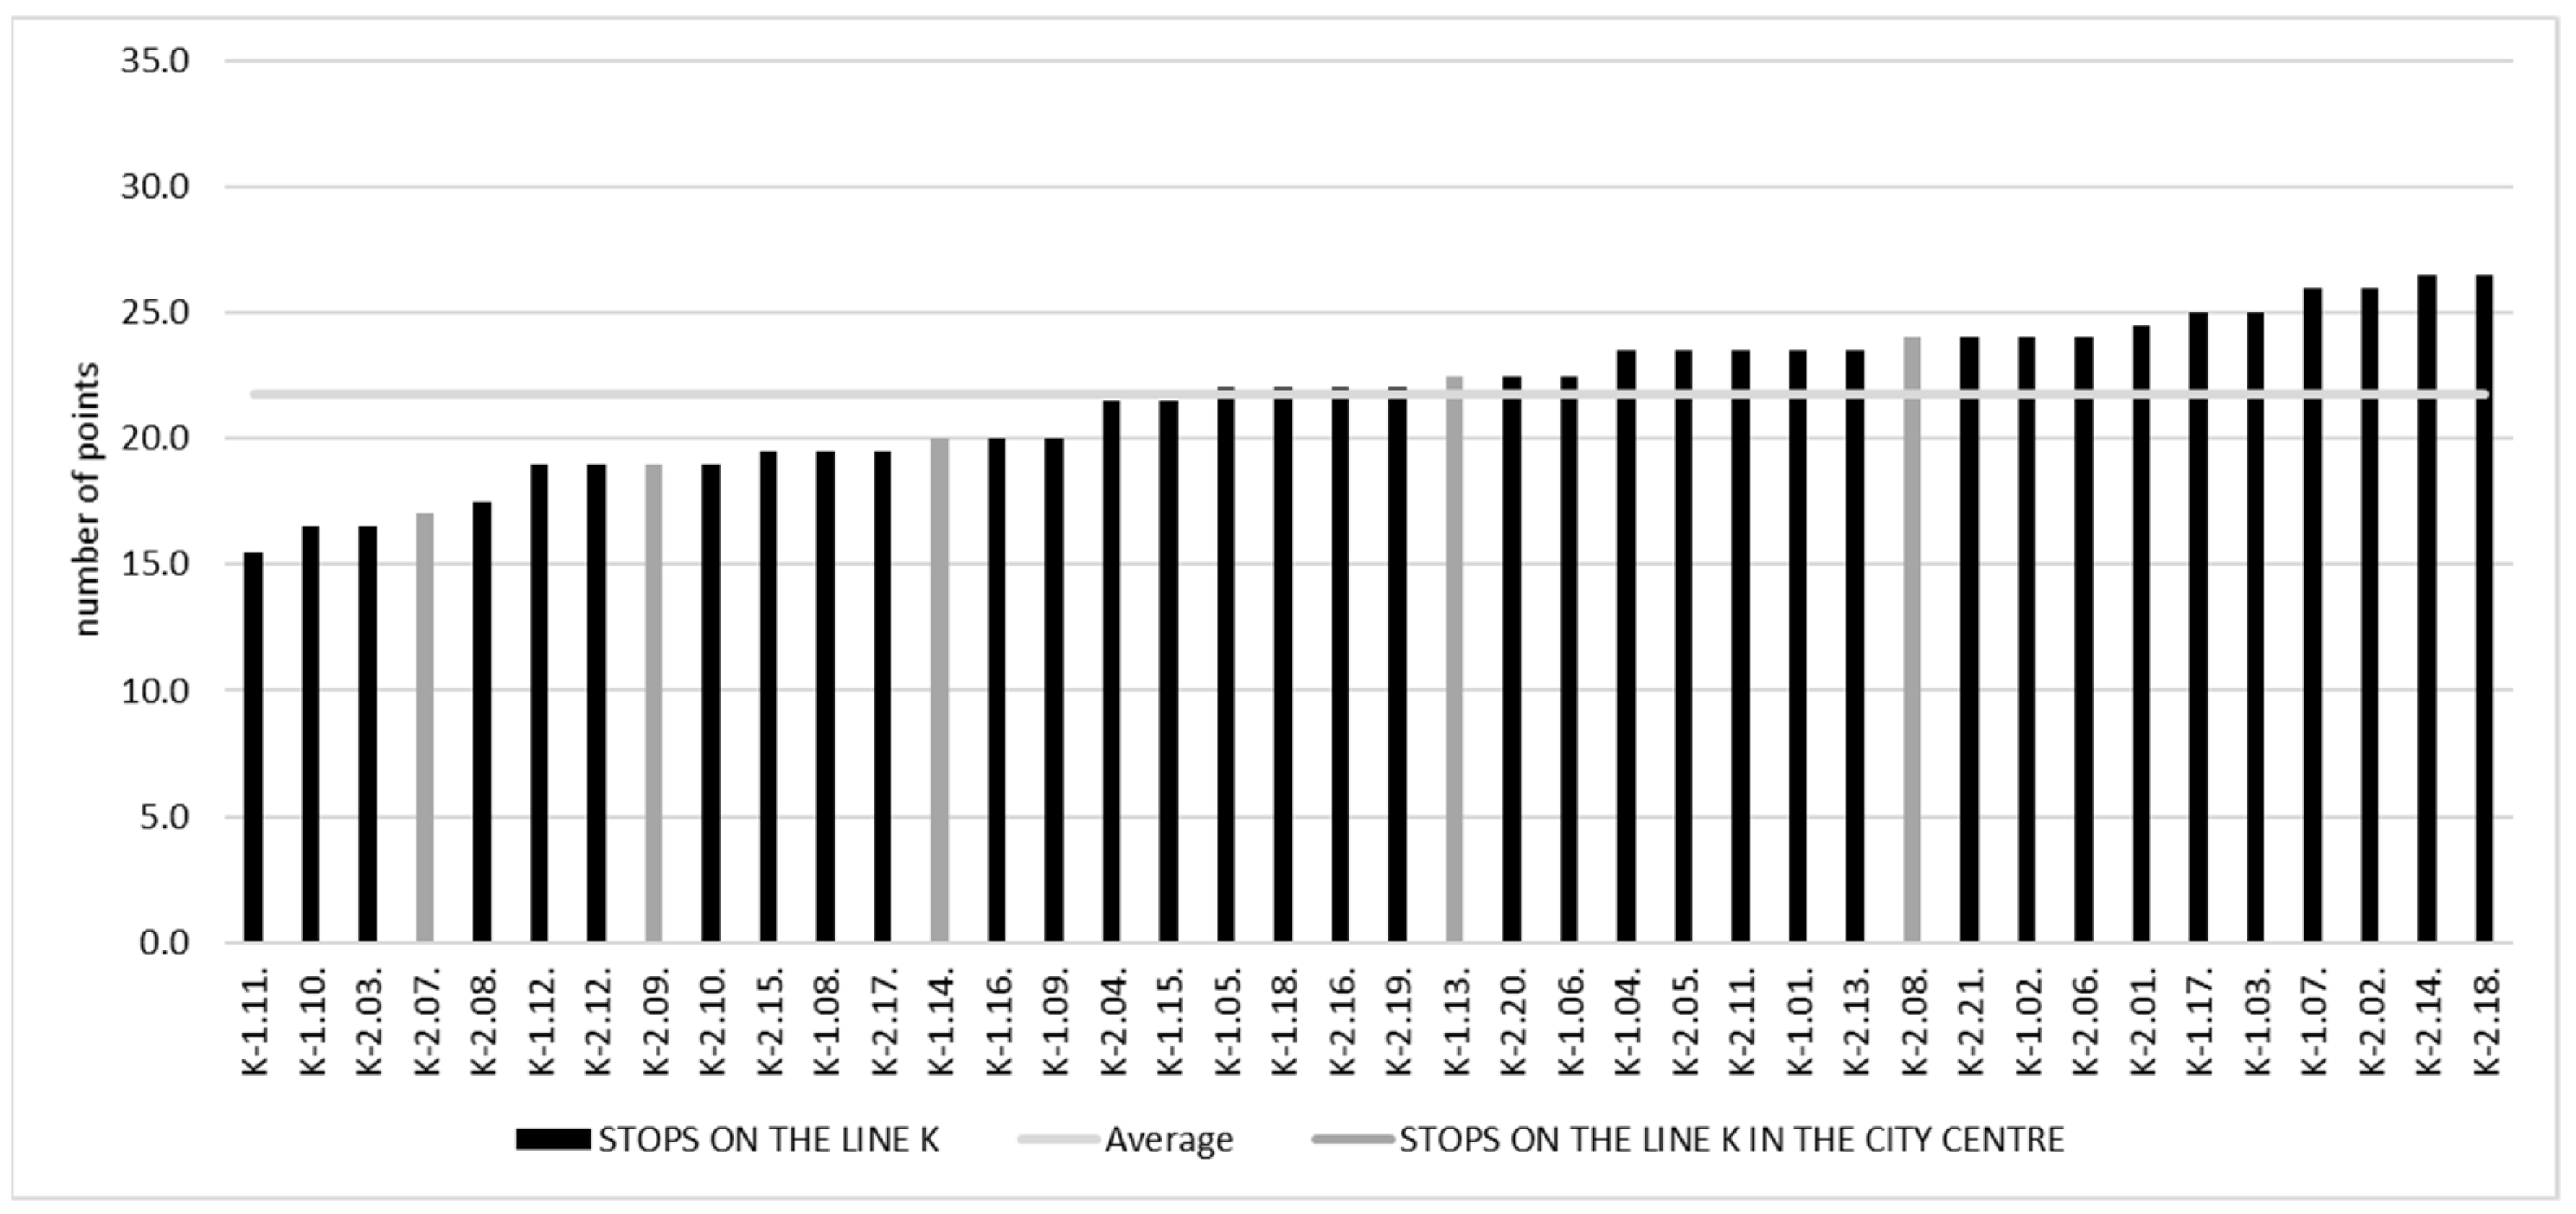
The stops on the reference lines were audited in early December 2020. In total, 85 bus stops were assessed. The research was carried out during rush hours to determine the traffic intensity in the vicinity of the bus stop and traffic users’ behaviour. The audit was also repeated in the evening hours, due to which it was possible to assess the state of lighting and visibility after dusk. The audit results show an extensive range of ratings obtained by individual bus stops on each of the assessed lines. In the article, the numbering of bus stops uses a three-level numbering system: X-A.B., where X is the symbol of the line; A is the direction of travel (takes values 1 or 2); B is the order number of the bus stop on the fixed route in the specified direction of travel. Based on the evaluation criteria, the same evaluation of all identified bus stops was made. To present the evaluation example, the Klecina bus stop was selected, served by the D line (D-1.04)—
Figure 7. It is a bus stop located along the road, through which a pedestrian and bicycle route runs. The bus stop Klecina scored a total of 26 points out of 45 possible points. As a part of the assessment, the bus stop did not meet the requirements for the following criteria: C8, C9, C12, C13, C16, C18, C19, C28, C29, C34, and C35, and did not reach the maximum possible number of points for the criteria: C26, C27, and C30.
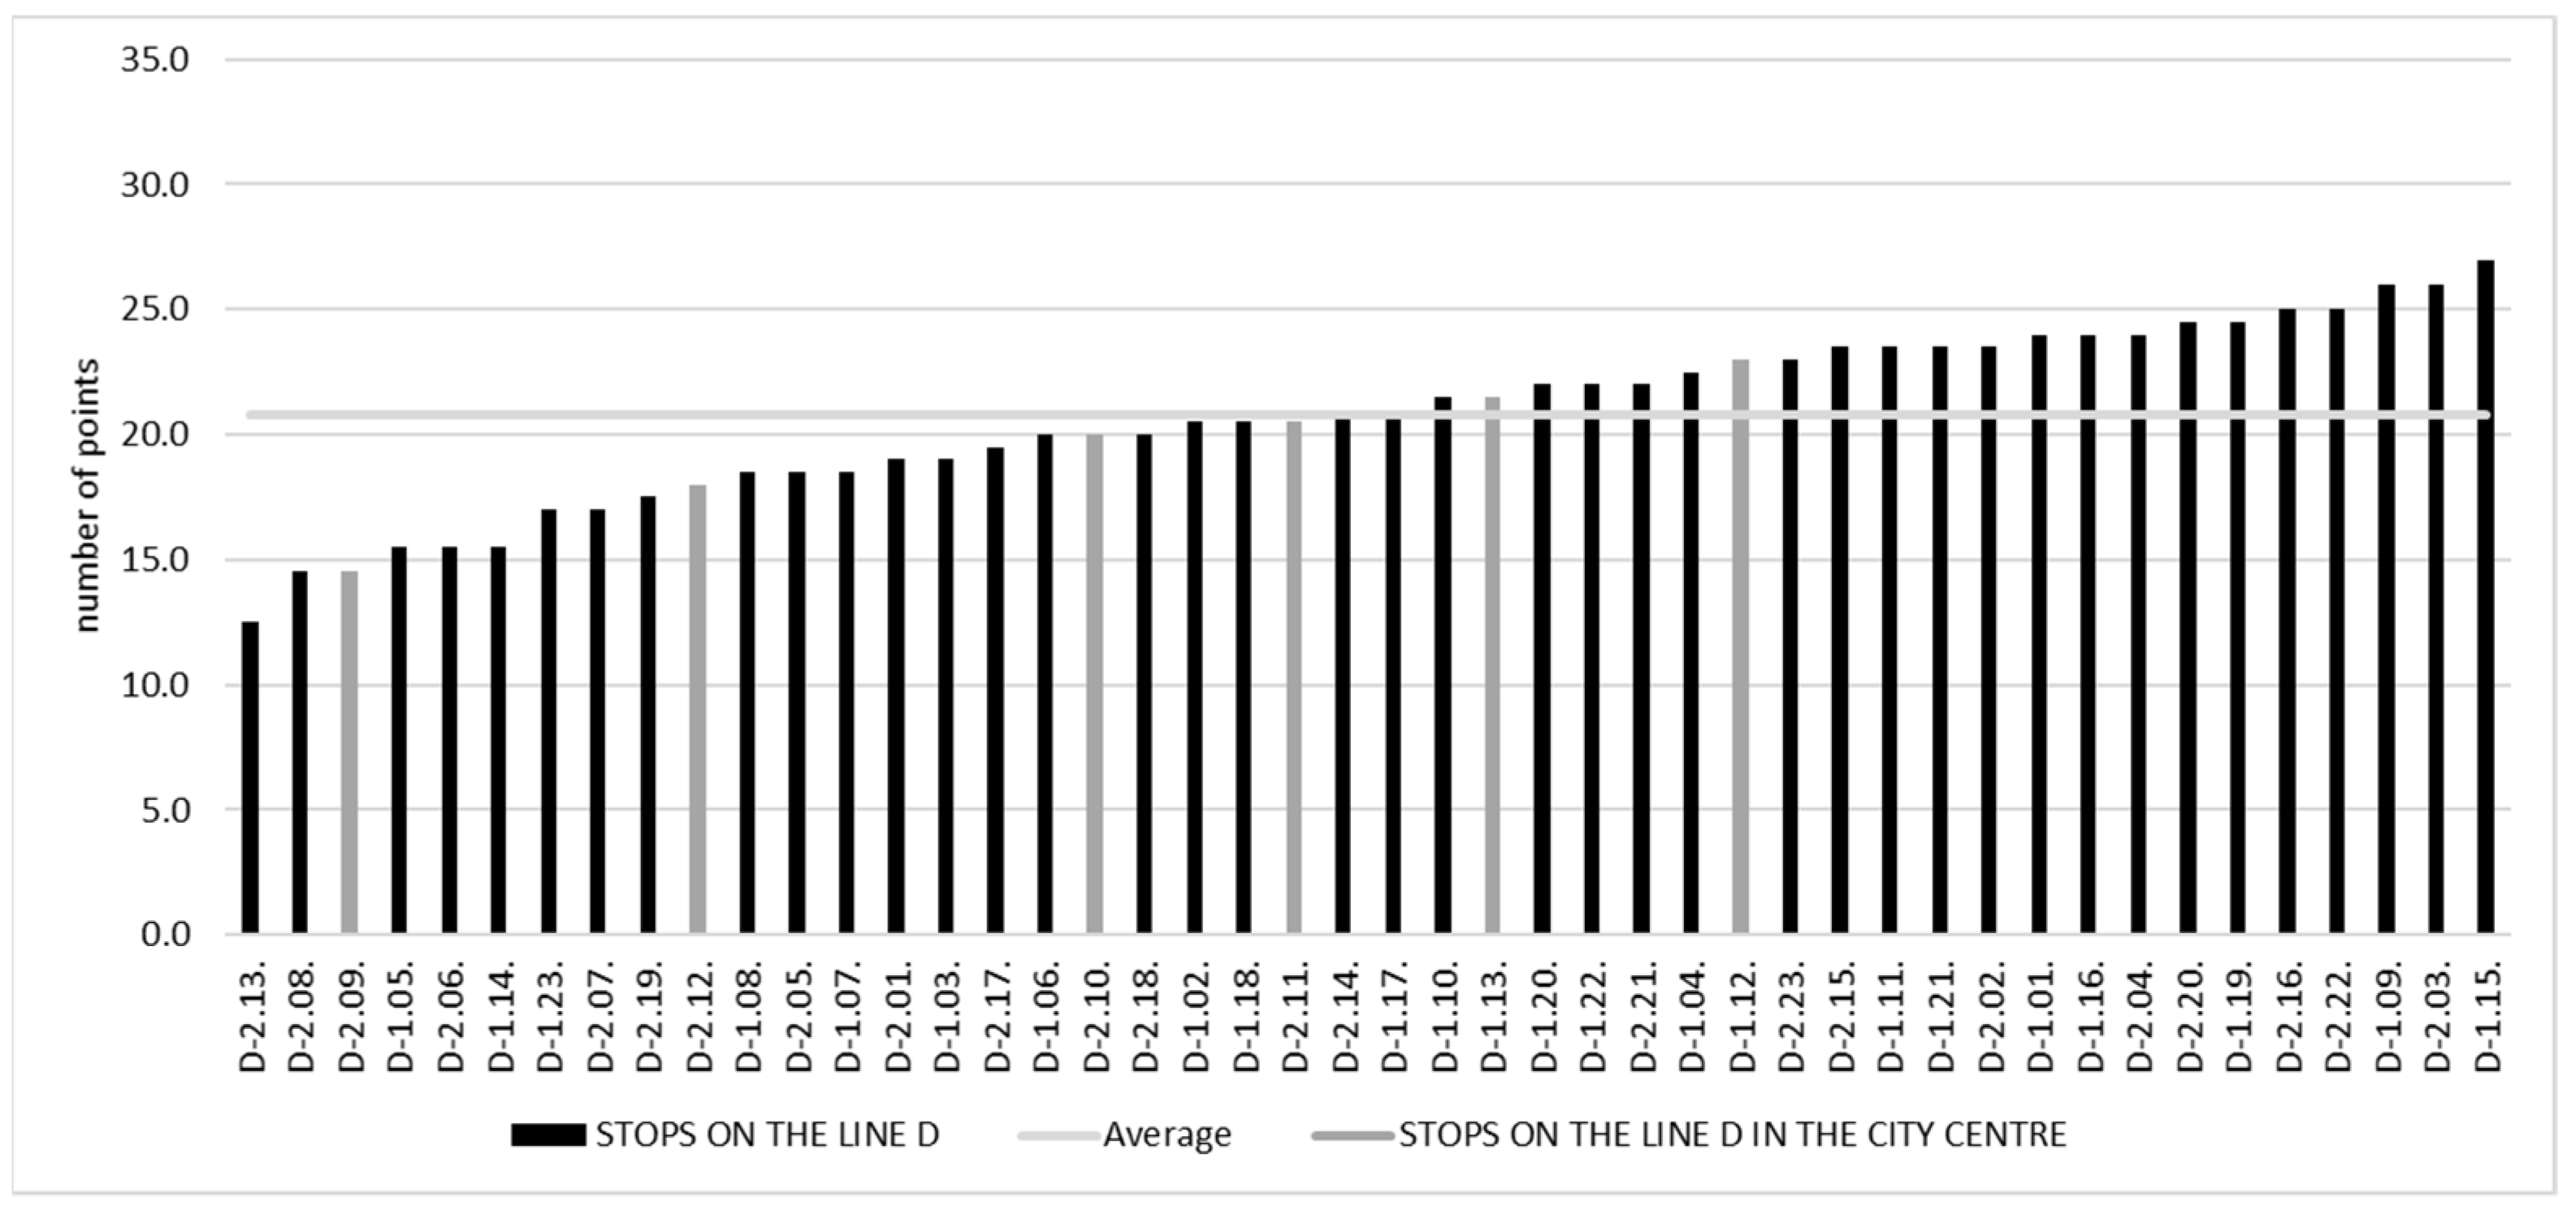
Results of global assessments for individual bus stops are shown in
Figure 8 for line D and in
Figure 9 for line K.
The analysis of the obtained results shows that the bus stops on each reference line meet the assessed criteria in a diversified manner. The difference between the highest and the lowest score obtained for the D line is 12.5 points versus 27 points, and for the K line—15.5 points versus 26.5 points. Therefore, it can be concluded that the bus stops’ safety level is differentiated along the entire route served by both reference lines. The existing diversification of the safety level at individual bus stops allows the classification of the assessment criteria. If all bus stops were characterised by a similar level of fulfilment of individual criteria, their classification in the matrix would be minimal. Simultaneously, the registered differentiated safety level confirms the necessity of classifying the criteria, which should determine the required actions to improve current solutions.
Table 6 presents selected parameters relating to the assessed bus stops on the reference lines. A comparative analysis of the results obtained on both lines shows that the obtained scores are similar. The average bus stop ratings for both lines differ by only 3%. However, in the case of line D, there is a more significant standard deviation for the obtained ratings of individual bus stops. On the other hand, the difference between the lowest scores in both lines is 3, however, the highest scores differ by only 0.5. This means that, while the best-rated bus stops are on a comparable level, the lowest-rated bus stop on line K is safer by 3 out of 35 points compared to the lowest rated bus stop on line D. It is also worth emphasising that, for both assessed reference lines, more than half of the bus stops were placed above average.
The reference lines were selected, among others, due to the serving bus stops located in the city centre. Bus stops in this location should meet the highest safety standards due to the many passengers and the fact that they are the city’s showcase for tourists. However, it should be noted that, on both reference lines, most of the bus stops in the city centre were rated below the average for a given line. Only two of the seven bus stops on line D located in the city centre were placed above average. A similar situation occurs for line K (two stops out of five situated in the city centre). It should also be noted that the third lowest-rated bus stop on line D and the fourth on line K are in the city centre. These results of the analysis already indicate that, in the case of the examined city, it is necessary to take measures to increase the safety of bus stops in the city centre.
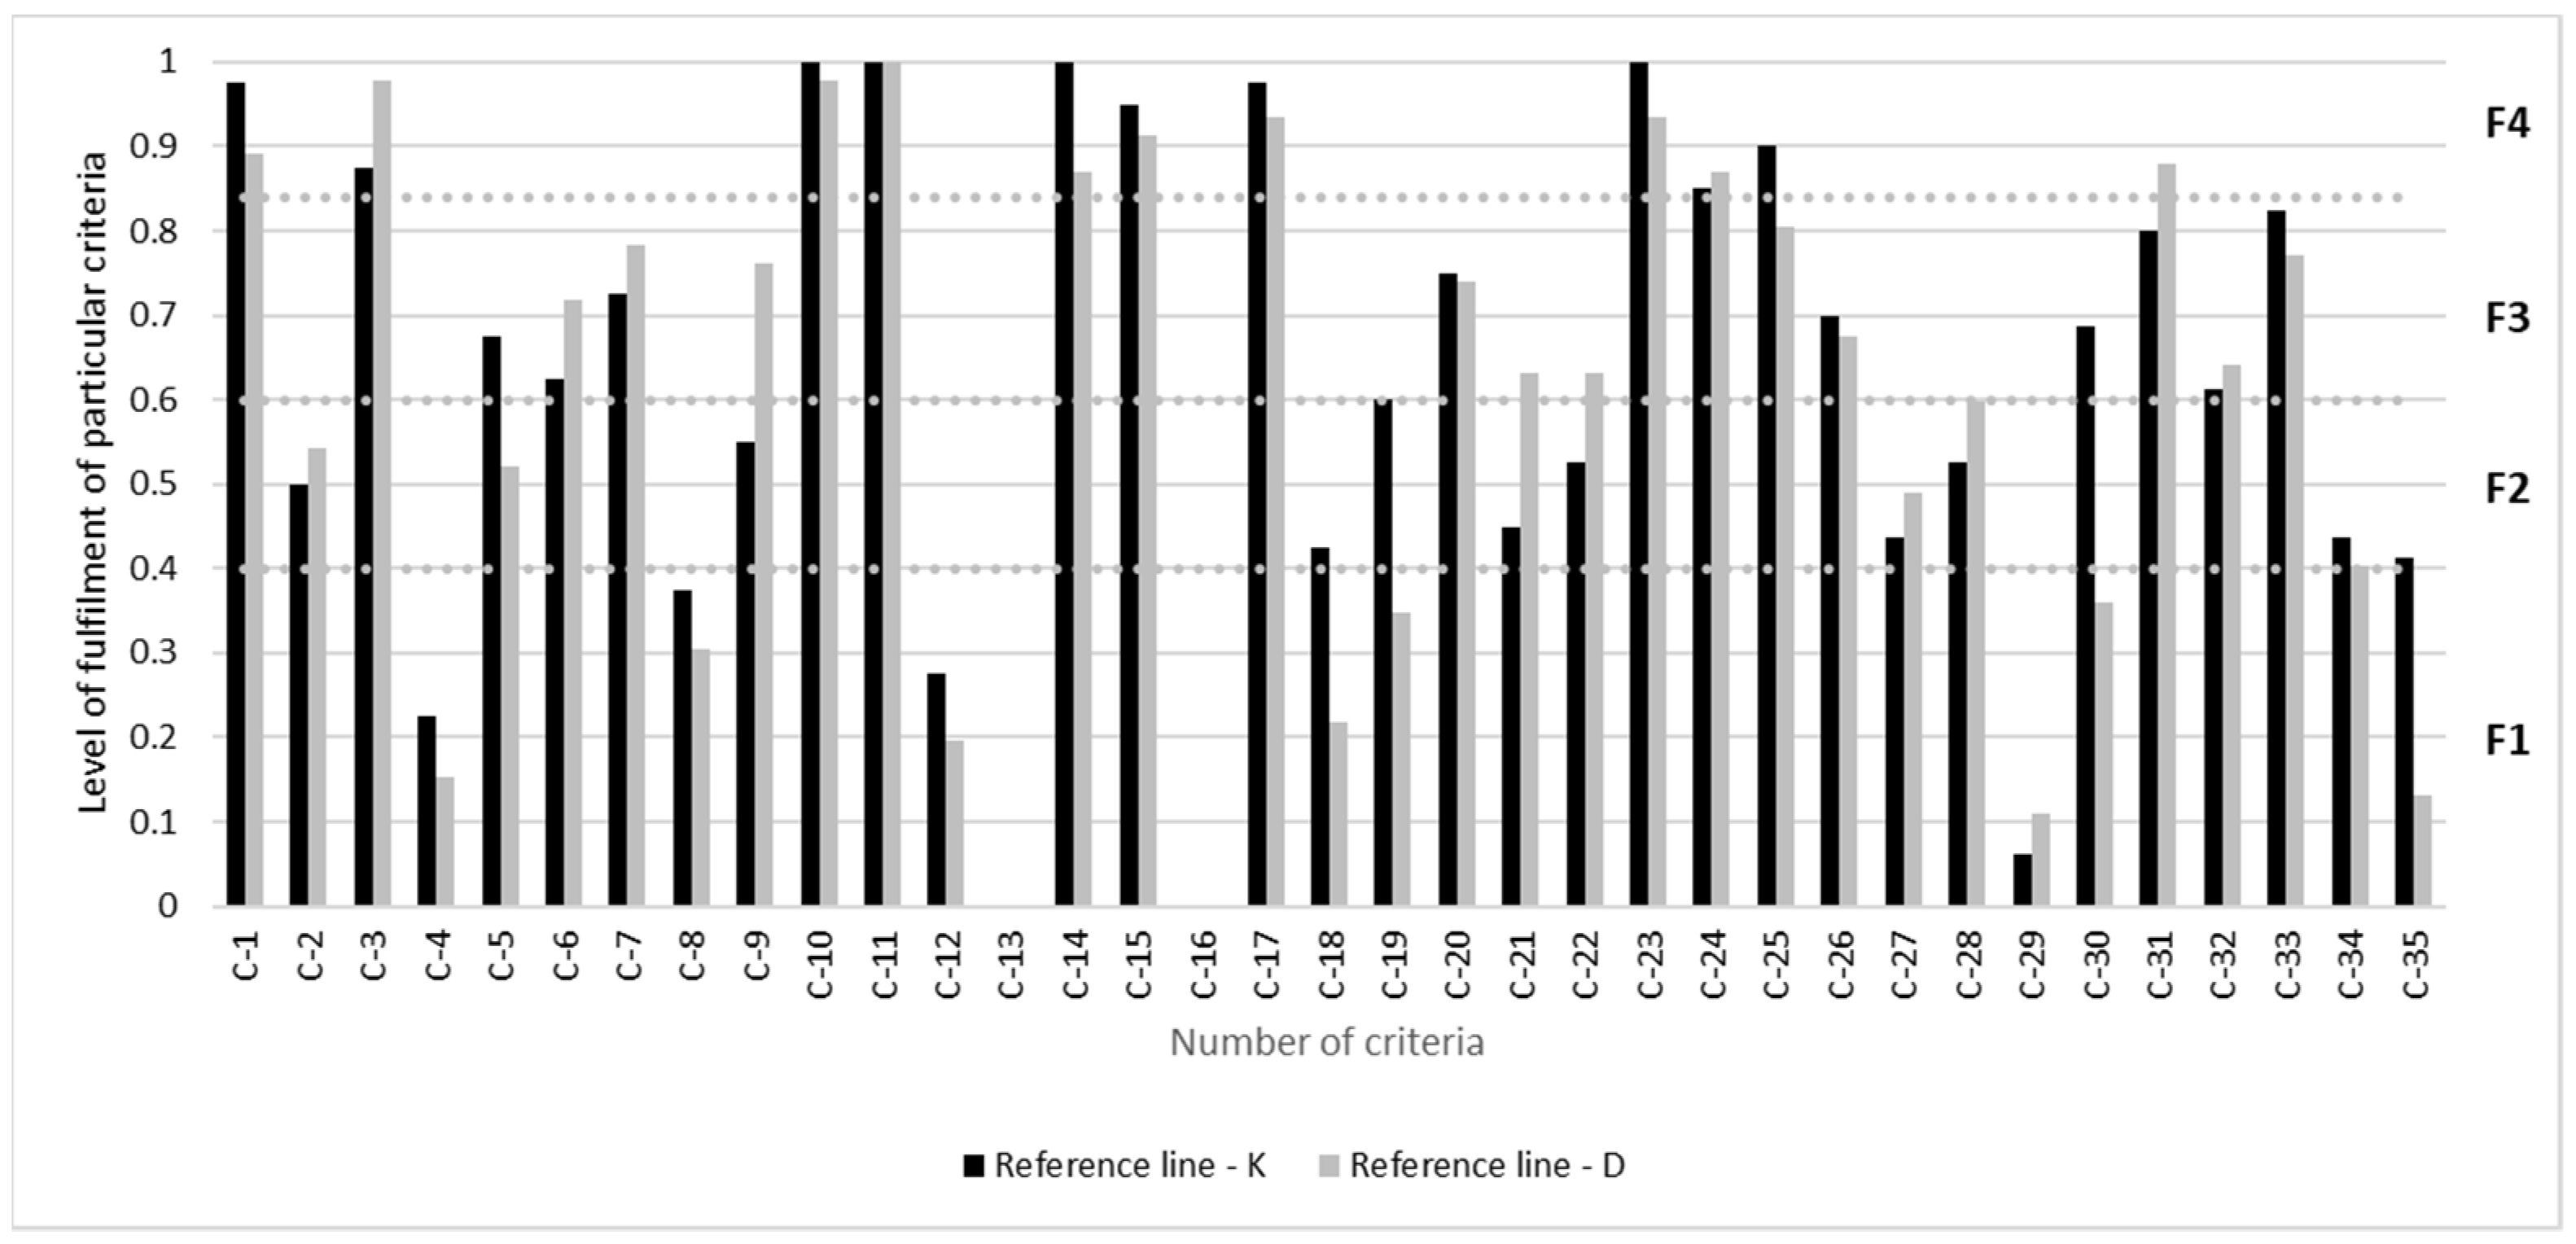
When comparing both reference lines, it is also worth paying attention to the level of fulfilment of particular criteria by the bus stops serving them.
Figure 10 shows these levels divided into both lines.
The level of fulfilment of particular criteria by the bus stops serving both reference lines is mostly comparable. The average difference in meeting the individual criteria is 0.091. The most considerable differences in meeting the criterion were noted for:
C30: Curb elevation height relative to the rolling stock served—(0.33);
C35: The method of separating the area directly adjacent to the bus stop—(0.28);
C19: The presence of traffic lights at a pedestrian crossing or the height elevation of a pedestrian crossing—(0.25).
The same or very similar fulfilment level (up to 4% difference) was noted for the criteria C10, C11, C13, C15, C16, C20, C 24, C26, C32, and C34. For 71% (25 out of 35) of the criteria, the difference in filling on both lines did not exceed 10%, and for 37% (13 out of 35) it did not exceed 5%. Therefore, it can be assumed that the inference concerning the classification of individual criteria based on the reference lines is correct.
4.5. Module 6—Development of the Decision Model
On the basis of the analyses performed for the bus stops on the reference lines, the criteria were divided into the selected groups under the limits adopted in
Table 2.
Table 7 shows the number of criteria assigned to each group based on the reference lines’ bus stops analysis.
Based on the above qualification results and the priorities assigned to individual bus stops, all criteria were set to the distinguished fields of the decision matrix. The results of the division are shown in
Figure 11.
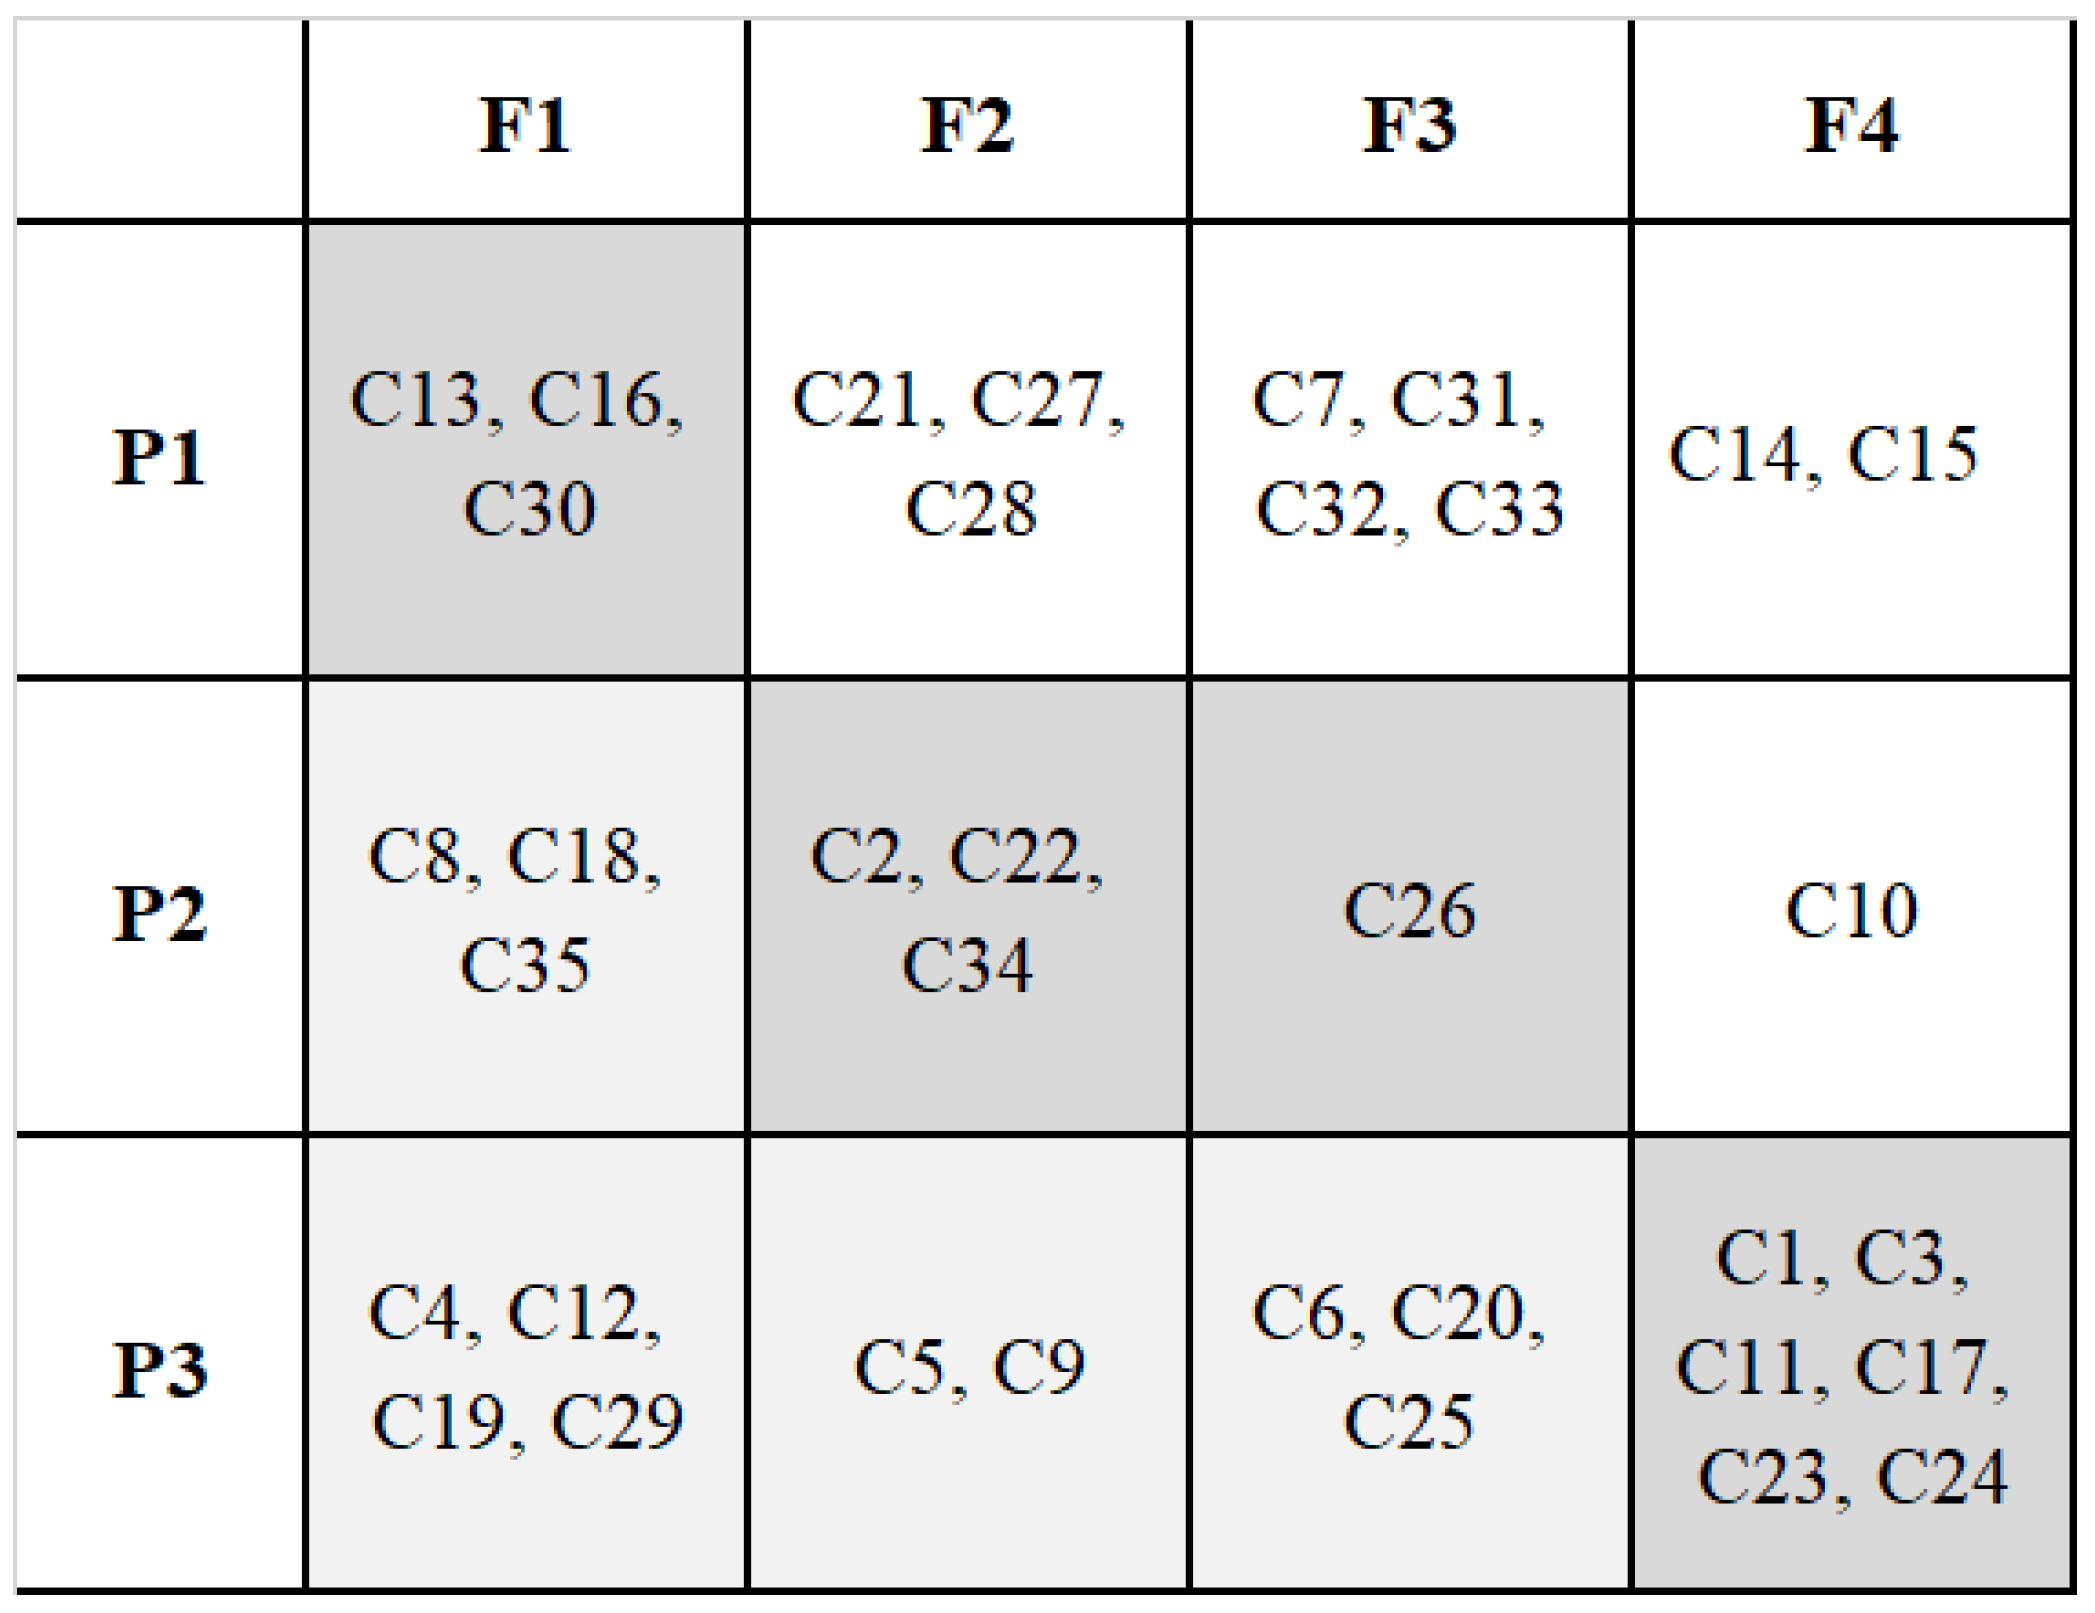
Accordingly, the ‘critical criteria’ class includes 12 criteria, the ‘relevant criteria’ class consists of 13 criteria, and the ‘to be monitored criteria’ class includes 10 criteria. The detailed assignment of the distinguished criteria to each of the classes is presented in
Table 8.
The division of the evaluation criteria into the classes presented above will be taken into account in the analysis of all bus stops assessed in module 7.
4.6. Module 7—Application and Verification of Model
The developed assessment method was verified based on analyses, the scope of which covered all bus stops serving the fast lines in the studied city. These bus stops are usually very busy due to the connection of essential traffic generators in the city. For this reason, they should be characterised by a high level of safety, in particular in relation to the criteria of class: critical, but also the class: relevant.
In addition to the selected two reference lines (D, K), bus traffic in the city is served by three more fast lines with symbols: A, C, and N. A brief description of these lines is presented in
Table 9.
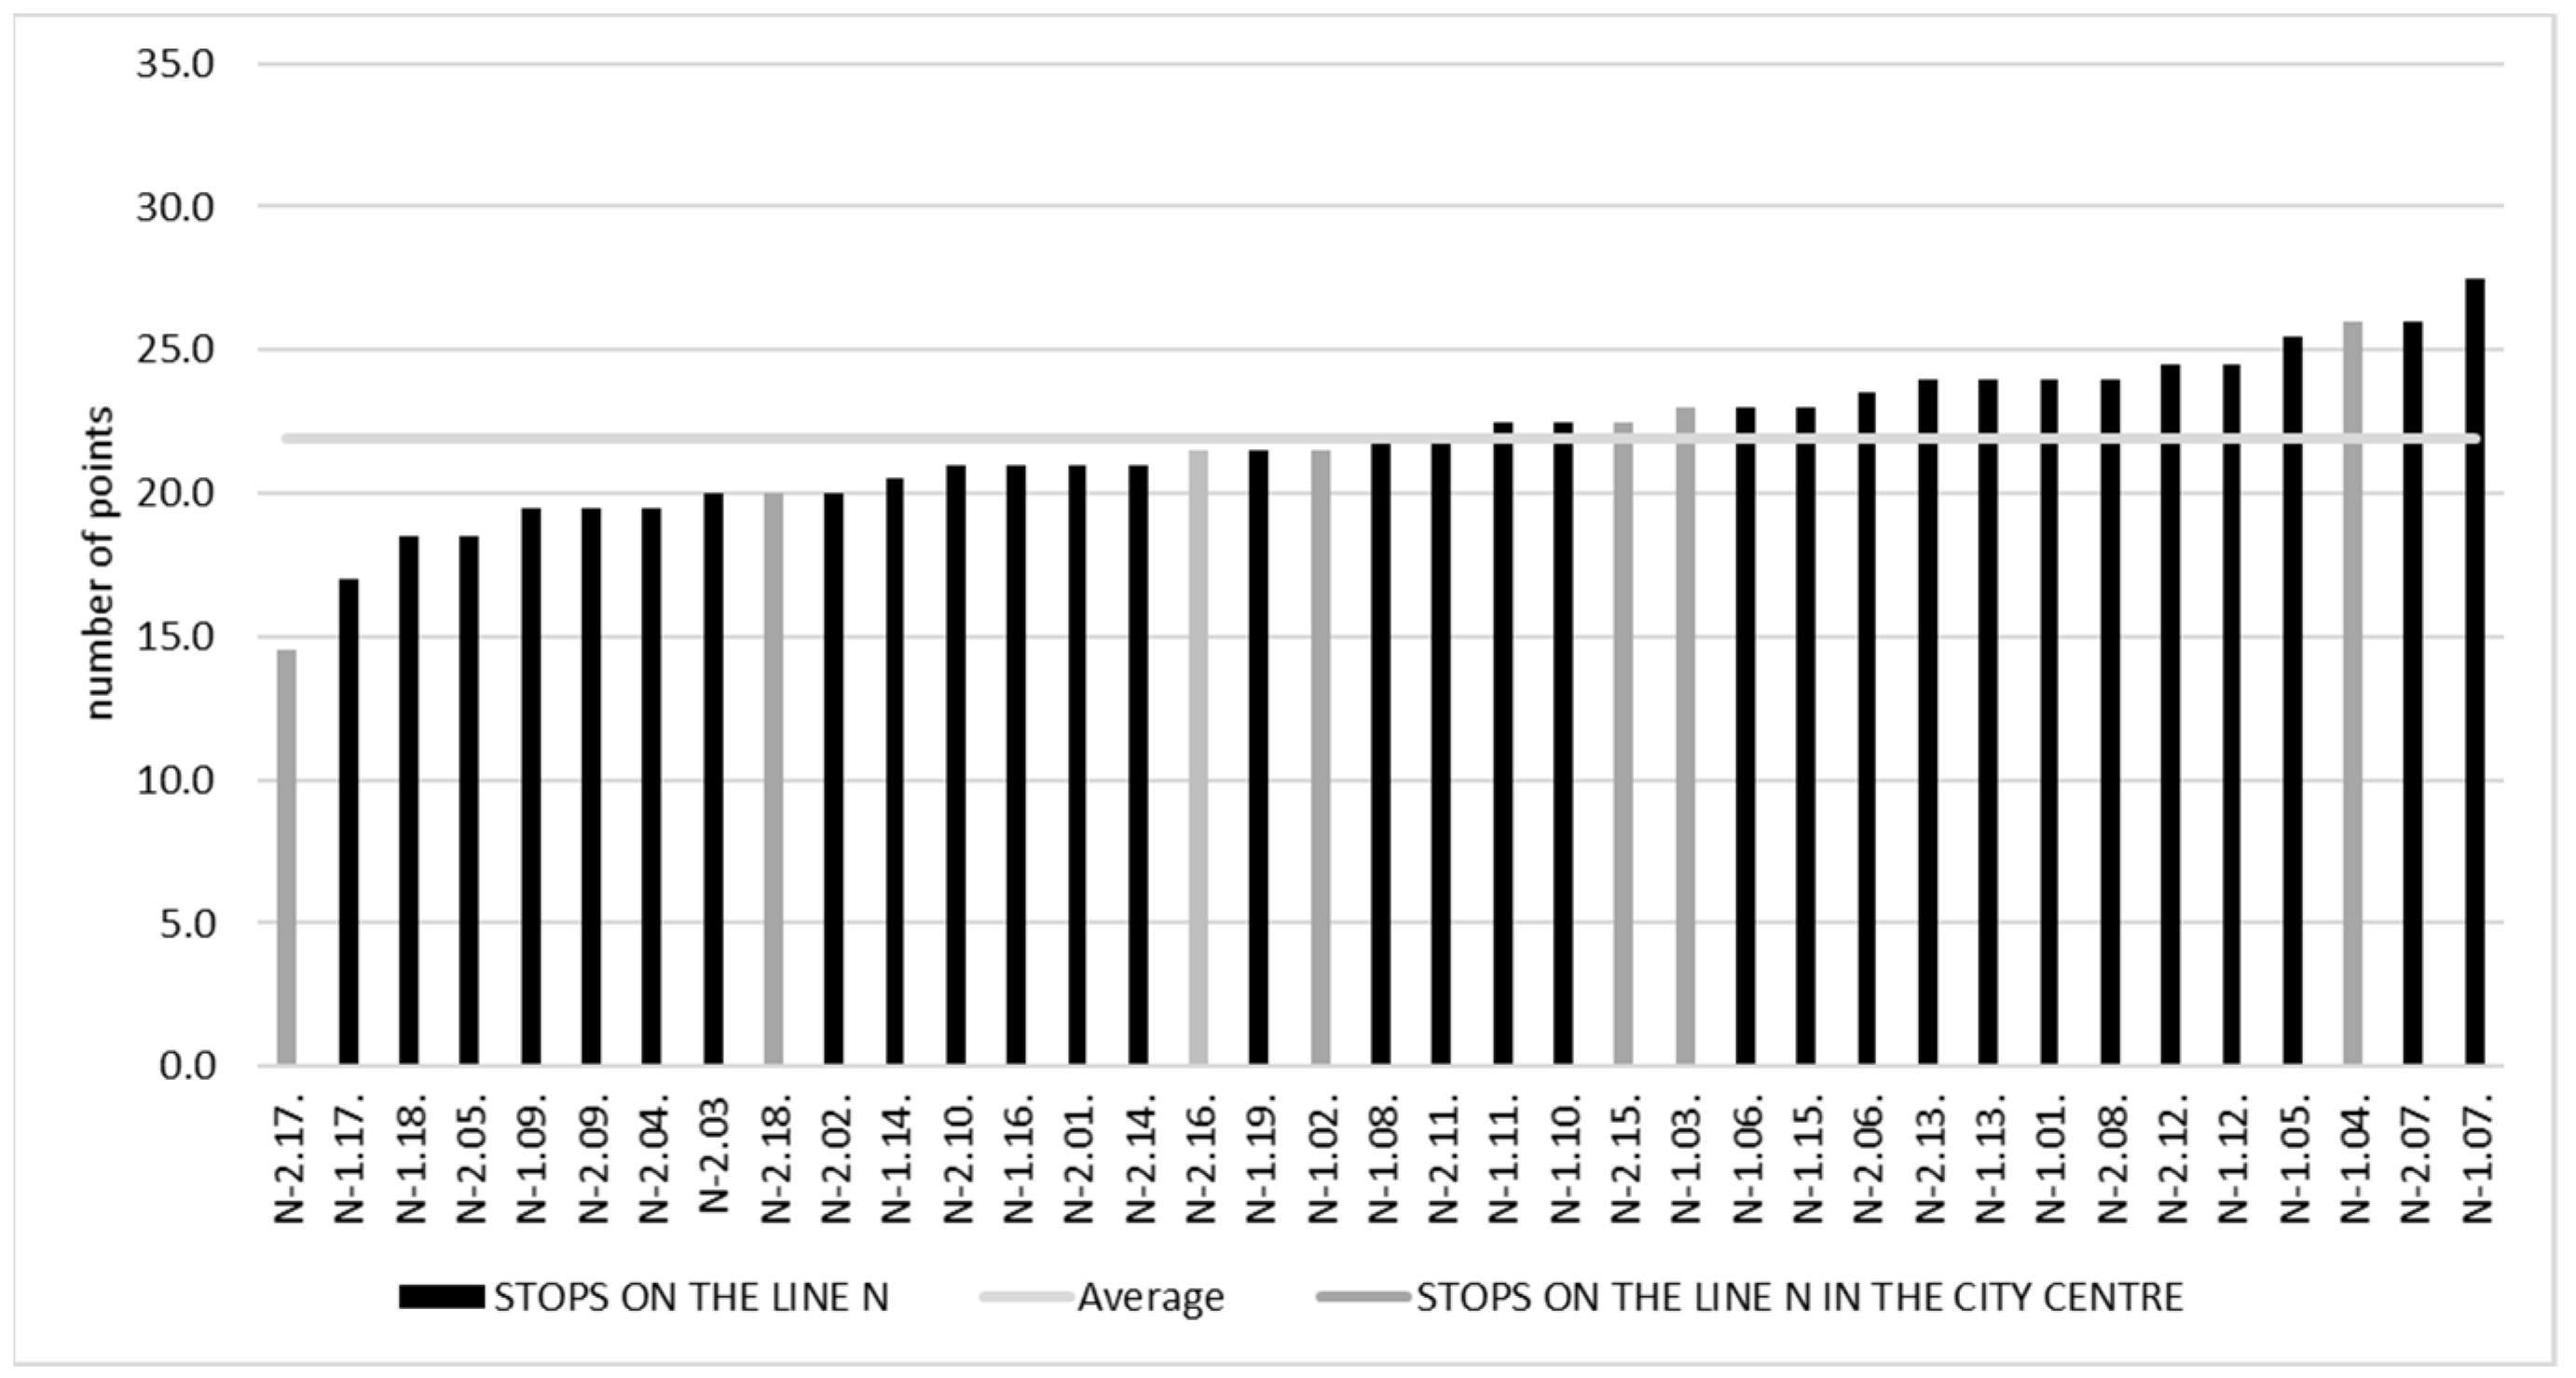
The performed assessment included 80 bus stops, among which 20 bus stops were serving more than one line, including ten duplicates with reference lines. In addition, in the assessed cases, a large discrepancy in individual bus stops’ safety on the assessed lines can be observed. The ratings of the bus stops for individual lines are shown in
Figure 12,
Figure 13 and
Figure 14.
Table 10 summarises the most crucial assessment parameters for each line.
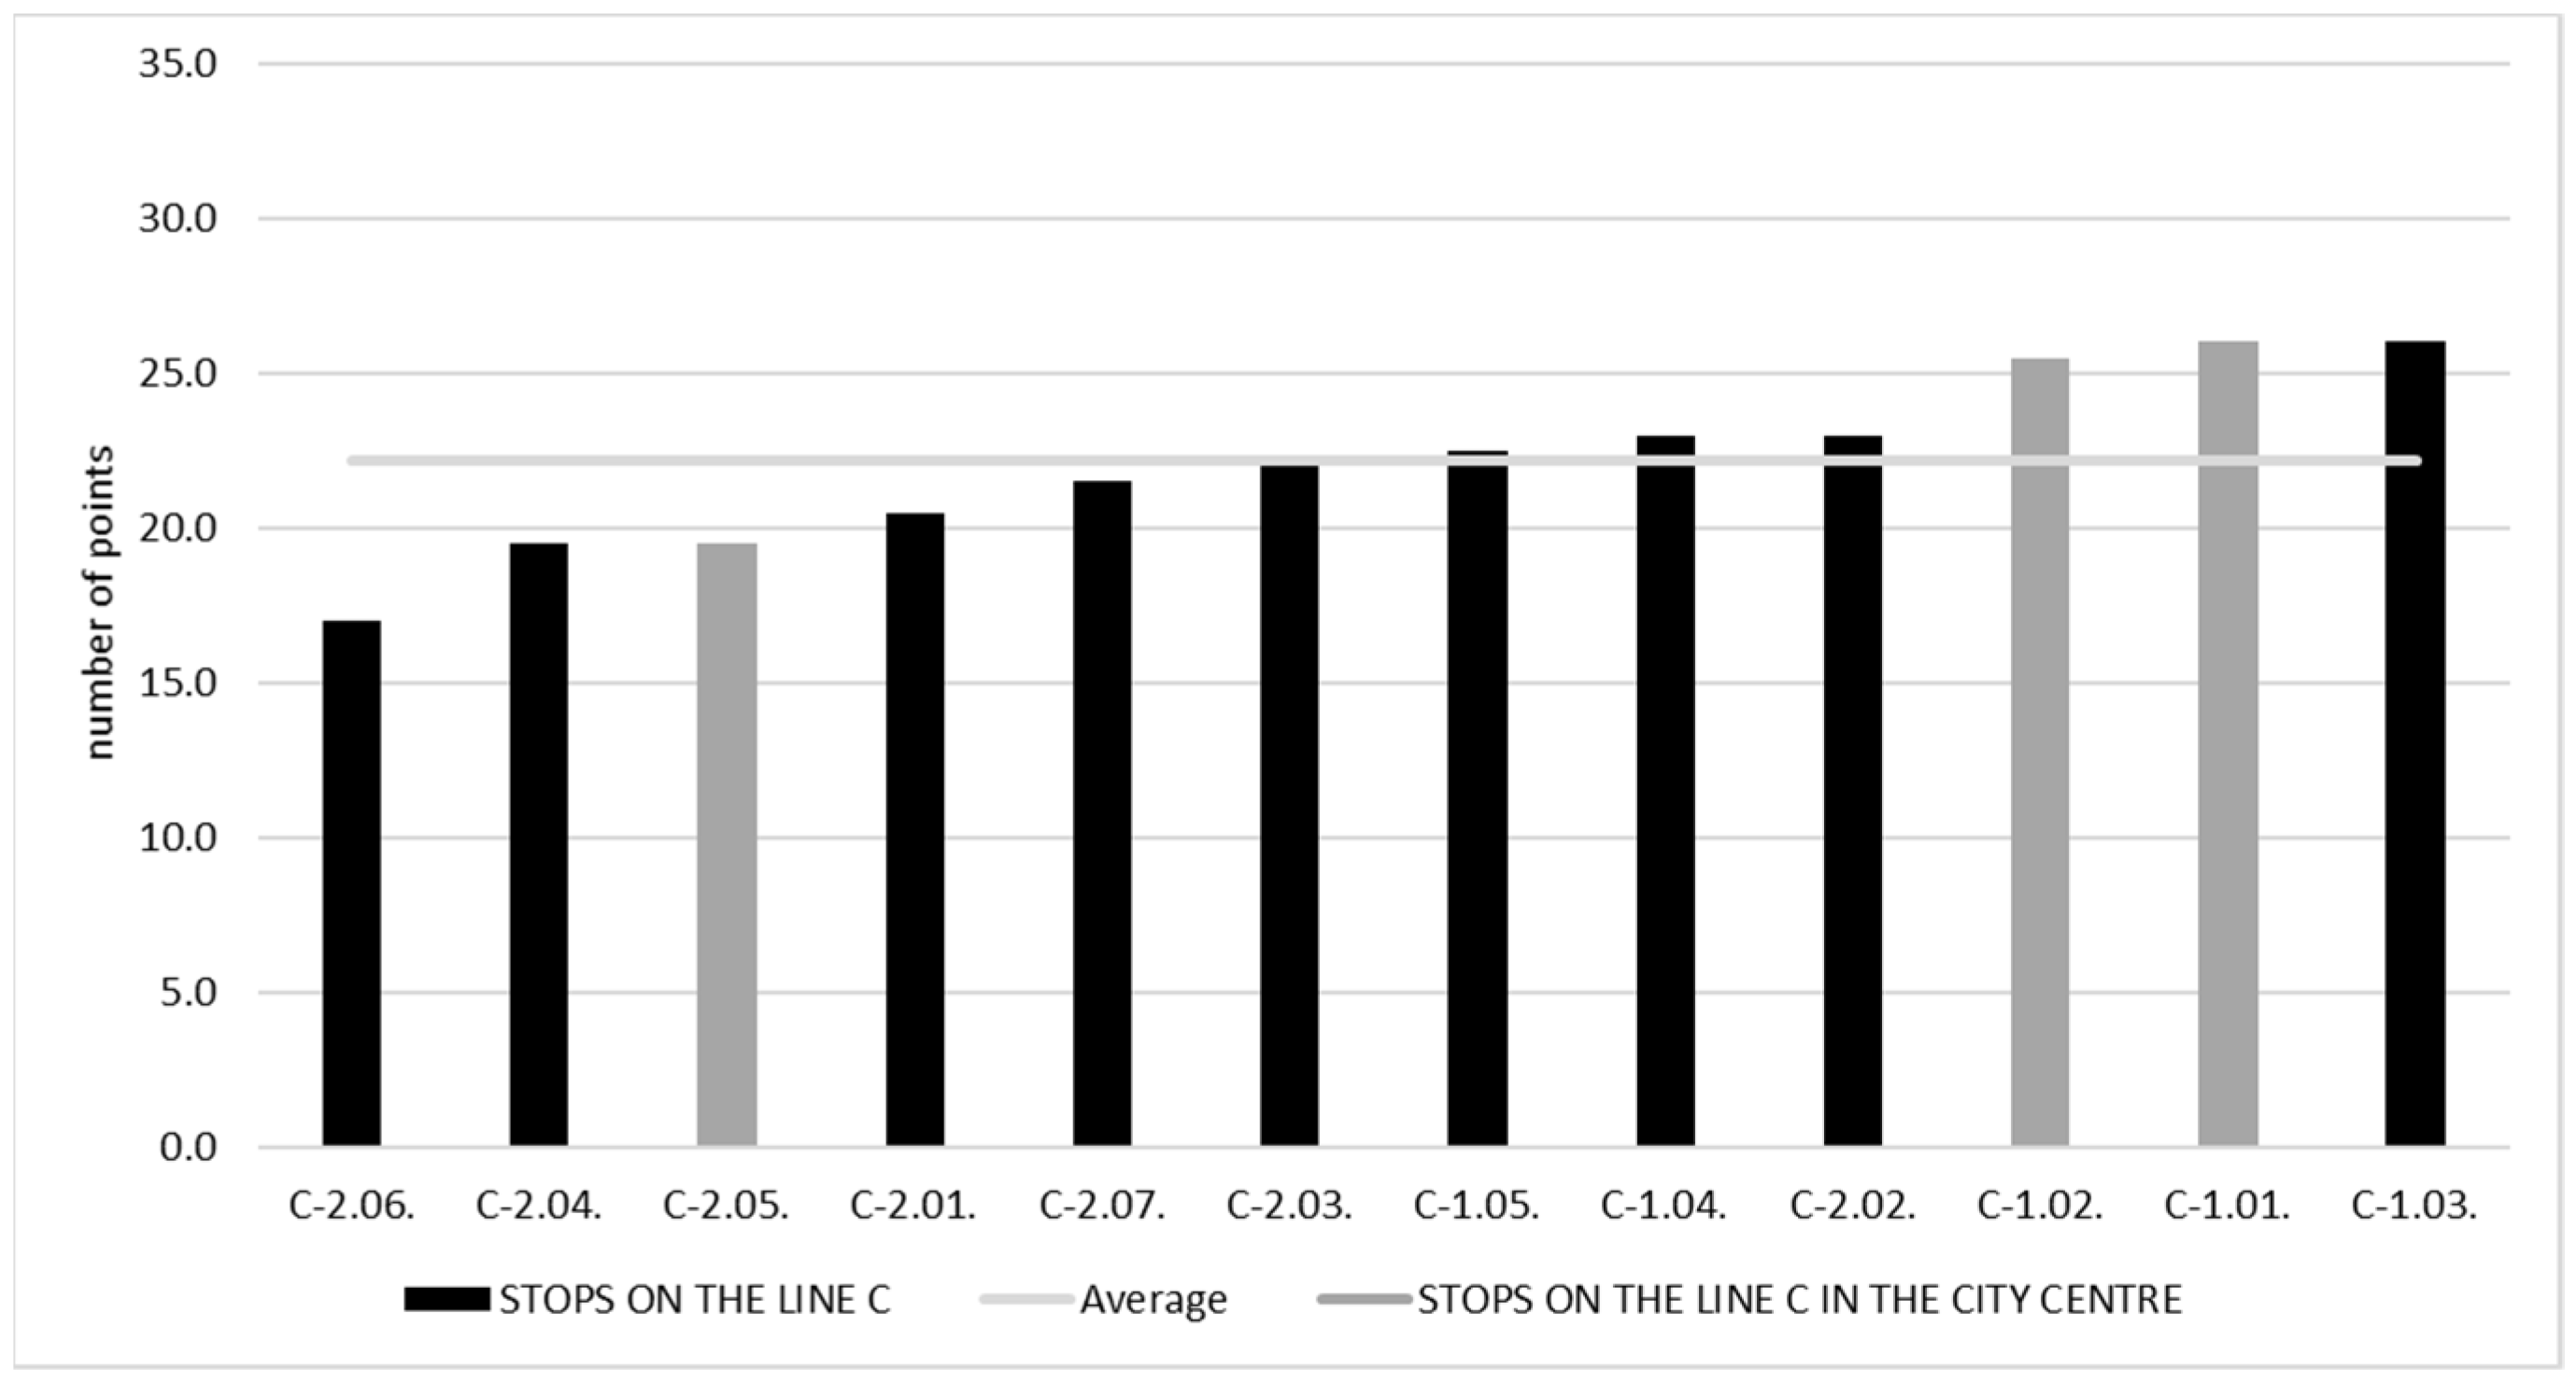
The shortest of the assessed lines is line C, which is served only by 12 bus stops along the road or in the bay (island bus stops were not taken into account in the study, additionally, during the research, some of the bus stops serving the line were under renovation due to the construction of a new tram line). However, this line’s worst-rated stop is rated 2.5 better than the other two fast lines. It is the opposite of the best-rated bus stops. In the case of line C, the highest-rated bus stop obtained 1.5 points less than bus stops on the other lines.
Bus stops on line A and line N obtained very similar results. The best and the worst-rated bus stops obtained precisely the same score. There is little difference in the average rating of all bus stops. However, it is worth noting that the scores obtained by both lines are similar to the values obtained by the bus stops for the reference K line. The differences between the best and the worst-rated bus stops on both these lines differ only by 1 point from the K line results. On the other hand, the average rating of all bus stops and the standard deviation is comparable.
Particularly noteworthy is that, in the case of reference lines, the share of bus stops in the city centre, which received an above-average rating, was minor (two bus stops for each line). More than half of the bus stops located in the city centre achieved above-average scores in the remaining fast lines. This improves the global safety assessment of interchange points in the city centre.
The performed assessment also functions to determine the level of fulfilment of critical and relevant criteria by the bus stops. Concerning the deficiencies in these bus stop parameters, it is necessary to take immediate or quick improvement actions. The levels of fulfilment of these criteria by all bus stops on the assessed fast lines are presented in
Table 11 and
Table 12.
Low fulfilment of the key criteria indicates the need to take immediate measures to improve the inhabitants’ safety and quality of life. The results obtained in the evaluation process for this group of criteria are very worrying. As one can read from
Table 11, as many as 7 out of 12 critical criteria are not met to a satisfactory level by the assessed fast lines. Criteria C29 and C35 were rated the worst. For this reason, in the first place, in the vicinity of bus stops serving all three lines, it is necessary to immediately introduce speed limits for moving vehicles and appropriate separation of the area directly adjacent to the bus stop. However, in other cases, quick action is required to increase bus stops’ safety level in these critical areas. For the line A, this applies primarily to the C4, C5, and C12 criteria. Line C stops need to be improved for ‘2 m wide strip along the edge of the bus stop without infrastructure obstacles’ and ‘Pedestrian crossing in the bus stop’s close vicinity (up to 10 m)’.
Among the critical criteria, the criterion regarding the presence of advertisements in the area of bus stops that distract drivers from the road was rated the best (C25). The lighting of the road to the bus stop (C9) can also be positively assessed, at least in relation to lines C and A. In the case of line N, the bus stops already require improvement actions in this area. It should also be noted that the highest level of meeting the critical criteria was achieved for bus stops on the line A (the highest share of meeting the largest number of criteria).
The assessment of the essential criteria was much better. In the case of as many as 6 out of 13 assessed criteria, more than 84% of all stops assessed on given lines met the criteria. In the case of only two criteria, the level of fulfilment did not exceed 40%. Concerning the criterion ‘The presence of a waiting area for people with limited mobility’ and ‘no stairs or high curbs in the bus stop area’, measures should be taken to improve the current bus stop infrastructure. Action is also required regarding ‘Bordering on the immediate vicinity of the bus stop area’.
The level of fulfilment of the required criteria was also assessed. Their fulfilment level is important from the point of view of the future development of point infrastructure and the response to changing trends in its design. The number of stops meeting these requirements at a given level is presented in
Table 13.
The fulfilment of the to be monitored criteria is also at a different level. Still, the assessment results are much better than in the case of the critical criteria. For 4 out of 10 criteria, fulfilment on all assessed lines exceeded the level of 60%. In the case of only two criteria, the fulfilment level was below 40% on the selected lines. Therefore, it can be assumed that, in this case, only actions to improve ‘Free possibility of joining the traffic during rush hour by the bus’ and ‘The LoS (Level of Service) in the area of the bus stop when changing passengers at the rush hour’ in the longer term, would be economically justified at the assessed bus stops.
5. Discussion
Following the approach described by [
8], when preparing the proposed method of assessing bus stops’ safety, the authors did not use traffic crash data or traffic conflict data, but focused on infrastructure elements of bus stops and the vicinity of bus stops, which may affect the occurrence of dangerous events that threaten human life and health. However, unlike studies such as [
2,
8,
23], the aim of the authors was not only to determine the level or index of safety for individual bus stops. The main focus was on developing an appraisal procedure which, based on the appraisal criteria, prioritizes the necessary work to improve the safety and quality of residents’ life. As a result, this method can be used not only to audit the current bus stop infrastructure, but also to indicate guidelines for new designed solutions.
The performed safety assessment should be universal in the case of selected safety requirements, and, at the same time, meet the criteria defined and applicable in a given city. For this reason, the categorisation of the evaluation criteria takes into account two stages of the procedure:
grouping the criteria according to the potential consequences of not complying with them—ensuring the universalism of the method;
grouping the criteria according to their fulfilment by a group of reference bus stops—ensuring the individualisation of the assessment carried out, taking into account the specificity of a given city.
In the conducted research, the researchers decided to use the Delphi method at the first stage of grouping the criteria to maintain the possible objectivity of the classification procedure. Thanks to the creation of an expert group composed of representatives of the public transport system stakeholders and a representative of science, the grouping carried out procedures while taking into account the interests (point of view) of various participants. Most of the evaluation criteria were unequivocally qualified already in the second round of evaluation. Lighting criteria have become an important point of expert discussion. Lighting is an important element of the infrastructure influencing the safety of road users, which is confirmed by studies published in the literature [
42,
43]. It is emphasized that lighting performs various functions, such as protection (safe movement in the dark, better visibility) and orientation (facilitates orientation in the city space, facilitates movement) [
44]. In the proposed approach, there are three criteria connected to lighting: C8, C9, and C10. The C9 criterion did not raise any doubts and in the first round it was included in the P3 (high impact) group by all experts. However, in the case of the C8 and C10 criteria, the experts had divergent opinions and it was only in the third round that their qualification to group P2 (moderate impact) was finally established.
It should also be noted that the introduction of safety priorities as part of the first classification allows for distinguishing those criteria, the fulfilment of which is crucial from the point of view of reducing the risk of adverse events resulting in injuries and fatalities. The criteria belonging to the P3 group are the basis for distinguishing critical criteria (K1), the fulfilment of which becomes crucial when assessing the bus stop infrastructure. However, the introduction of an additional classification, taking into account the level of fulfilment of the criterion by bus stops on the reference line, allows taking into account the safety requirements considered important by the transport organizer in the assessment procedure.
The introduction of the method of the three-stage classification system of evaluation criteria increases the flexibility of its application in any city. The key issue of the conducted procedure is to distinguish those criteria that have a significant impact on the health and life of traffic users. The qualification procedure carried out in the described studies, based on a panel of experts, resulted in a universal division of criteria. As a result, it can be adopted by other evaluation teams that decide to use the proposed method. At the same time, through the implementation of modules 3-6, the results obtained in the evaluation procedure will take into account the specificity of designing bus stops in a given city and the safety standards applicable there. The only limitation in implementing this solution for another city is the type of bus stop for which the methodology was developed.
As part of the discussion, it is also worth noting that two criteria from the ‘relevant’ group were not met by any of the assessed bus stops. These criteria are: C13 (The presence of a waiting area for people with limited mobility) and C16 (Presence of a DIP board with the ability to read aloud). These criteria have been recognized by experts as important from the safety point of view, however, these solutions are not used in the assessed city. Persons managing the bus stops infrastructure should consider the systematic implementation of these solutions in order to meet the standards currently in force in Europe and to ensure adequate travel comfort also for people with disabilities.
From the point of view of the bus stop zones’ safety, critical criteria play a special role. Their fulfilment by the vast majority of bus stops in each city should become a priority for those responsible for managing the public transport infrastructure. However, the assessment carried out in the city shows that their fulfilment level by the current bus stop infrastructure is at the lowest level in the analysed group of three classes of evaluation criteria.
Table 14 presents the share of meeting these criteria by bus stops on the assessed fast lines. As part of the discussion, however, an additional analysis is justified comparing the fulfilment level on each of the assessed lines separately, taking into account not only the assessed lines, but also the reference lines. The summary of the obtained results is presented in
Table 14.
The analysis of the data presented in
Table 14 shows a significant differentiation in the fulfilment of individual critical criteria on the assessed lines. In some cases, such as C9, the differentiation of the filling ranges from 49% to 100%. This indicates the necessity to take actions aimed at developing and implementing a standard for designing bus stops, leading to the bus stops meeting the required criteria, which is critical from the safety of public transport users point of view. This standard should apply in particular to bus stops serving fast lines.
The highest padding for all assessed lines was achieved for the C25 criterion (Advertised in the area of the stop that distracts drivers). The lowest fulfilment of this criterion, at the level of 80%, was recorded at the bus stops of line D. However, in the case of the remaining lines, 90% or more of the bus stops of a given line met this criterion. The worst level of filling was noted for the criterion C29, which concerned the assessment of ‘The permissible speed of vehicles in the vicinity of the bus stop’. It should be noted, however, that this is a requirement that can be relatively quickly implemented in the solutions assessed—it does not require high investment outlays and interfering with the bus stop infrastructure.
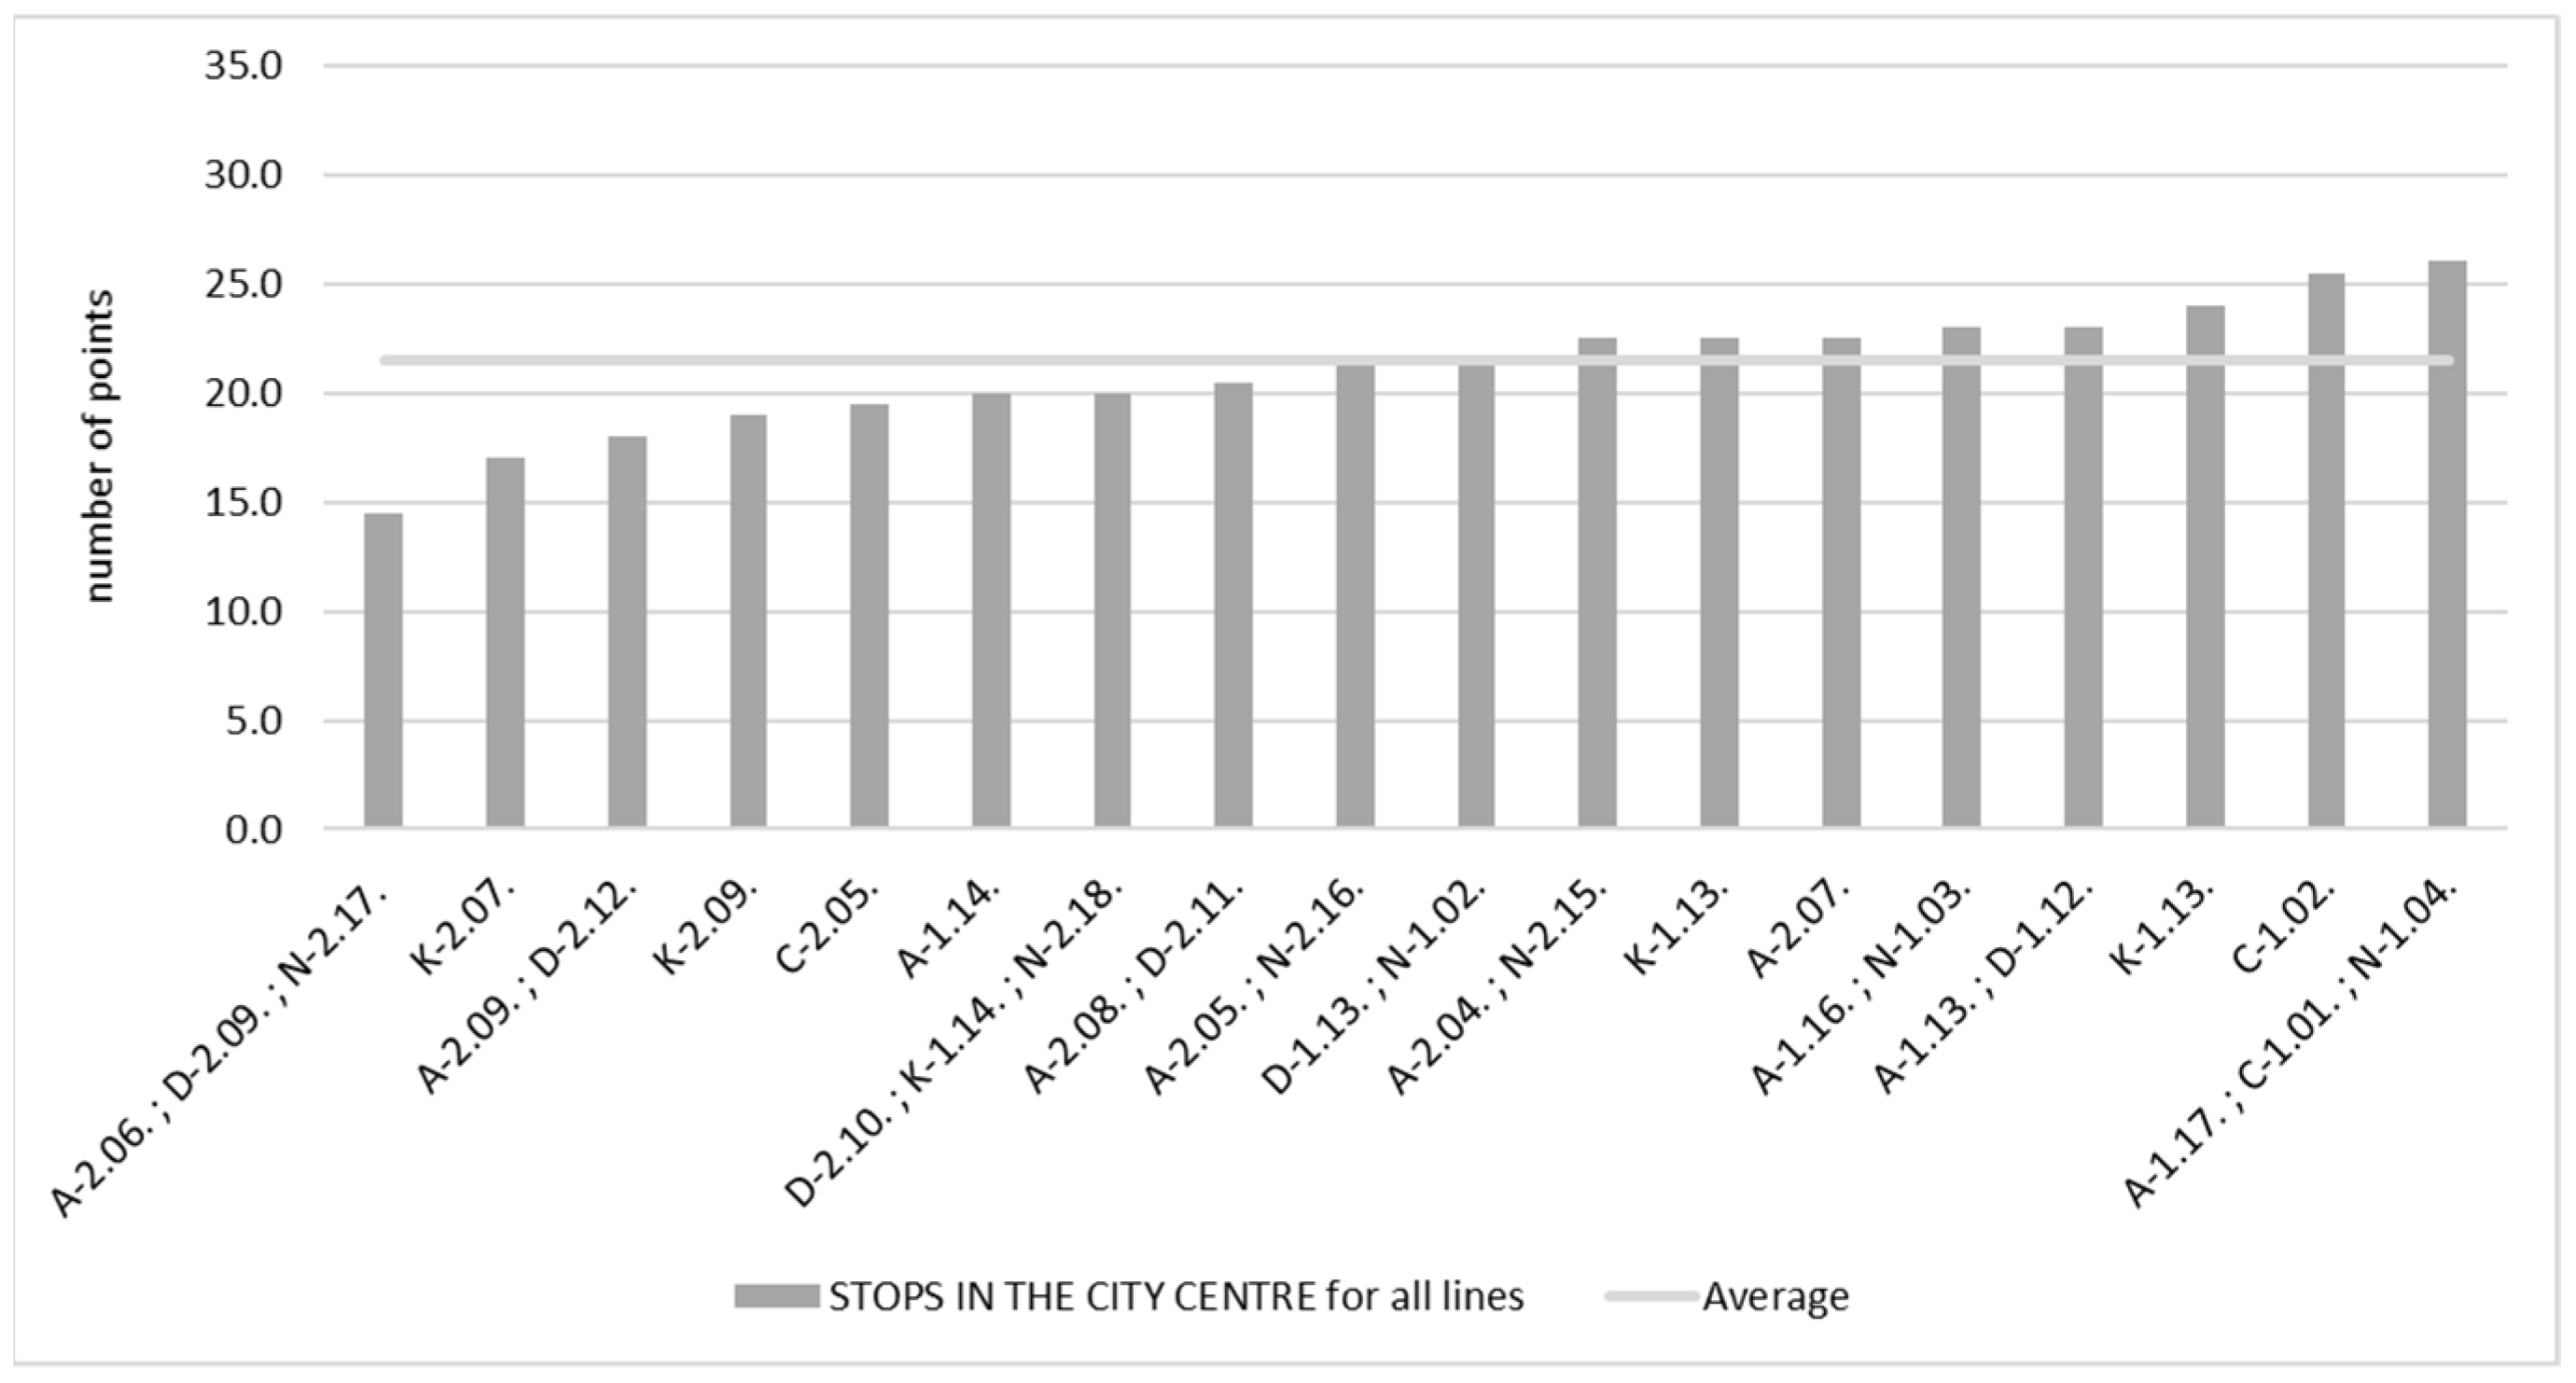
The results of bus stops located in the city centre evaluation are also worth emphasizing. All rated lines have stopping points in the city centre, as their task is to connect important traffic generators in the city. Bus stops in the city centre are its showpiece and are characterized by high passenger traffic, as they are the main transfer points. For this reason, they should be characterized by the highest level of safety.
Figure 15 shows the ratings obtained by the bus stops located in the centre versus the average rating of all rated bus stops on the five lines.
As shown in the figure above, out of 18 bus stops located in the city centre, 10 were rated below the average for all rated bus stops. This situation is particularly undesirable due to the fact that some of these bus stops are major interchanges that handle large passenger exchange traffic. For this reason, they should meet high safety standards. It should also be noted that two bus stops located in the city centre did not receive even half of the possible number of points (score below 17.5 points). In addition, a detailed analysis showed that the lost points were mostly related to the criteria belonging to the critical group (in the case of a bus stop serving lines A (2.06), D (2.09), and N (2.17), as many as seven high-impact criteria were not met, and in the case of bus stop serving line K (2.07), five high-impact criteria were not met). Such a situation requires an immediate response from the city authorities and the organization responsible for managing the bus stop infrastructure. From the point of view of the public transport users’ safety, such shortages cannot be allowed, especially in areas with such high traffic intensity as bus stops serving the city centre.
6. Conclusions
The article presents a proposed method of assessing the safety of bus stops based on the analysis of factors influencing safety. The method takes into account only the criteria relating directly to the bus stop zone; however, the authors are aware that there are also other factors determining the safety of passengers. One of such factors may be the location of the bus stop, which determines the specificity of traffic flow in the stop area and its intensity (proximity to intersections, location in the centre or on the outskirts of the city). However, this evaluation criterion was not taken into account in the presented method. The proposed approach assumes the need to standardize safety requirements, which should be met by all bus stops located in the bay or along the road in a given city, regardless of their location.
This method consists of seven modules of the procedure, which are described in detail in the article. The proposed method has been implemented to evaluate the bus stops serving fast lines in the selected city. A total of 151 bus stops located in the bay or along the road were rated. The conducted implementation allowed for the verification of the correctness of the adopted procedure and the usefulness of the obtained results.
The obtained results of the evaluation of bus stops and the fulfilment of individual criteria should constitute the basis for the created schedules of the required ongoing work related to the improvement of the safety of public transport passengers, but also the creation of long-term plans related to the improvement of the quality of life of residents and adapting to the changing safety requirements and passengers’ expectations.
The purpose of the described method is to audit the current bus stop infrastructure and to prioritize the work carried out to increase the safety and quality of life of residents and tourists using public transport in the city. For this reason, the obtained evaluation results of bus stops and the individual criteria fulfilment should constitute the basis for the created schedules of the required ongoing work related to the improvement of the safety of public transport passengers, but also the creation of long-term plans related to the improvement of the bus stop infrastructure and its adaptation to the changing safety requirements and passenger expectations.
This method has been developed in such a way that the auditing and data collection process can be carried out by people without extensive experience in the field of bus stop infrastructure management. For this reason, a simple structure of the completed form has been adopted (
Appendix A). For the purposes of analysing the collected data, the authors also created a spreadsheet that converts the input primary data as part of the initial analysis. Thanks to this approach, the proposed solution is practical and can be quickly implemented by both the organizer of public transport and the authority responsible for managing the bus stop infrastructure in a given city. The published implementation of the developed method may also serve as good practice for other cities that would be interested in implementing this method in their improvement activities.
The presented method is dedicated to bus stops located in the bay or along the road. It does not apply to island stops due to the different critical safety aspects. Therefore, its main limitation is the lack of full universality when assessing bus stop infrastructure. However, the specific safety aspects of both types of these bus stops justify the need for two separate dedicated assessment tools. For this reason, as part of further research, the authors plan to similarly develop an assessment method for island bus stops. The proposed method is used not only to assess the current state of stops, but also to assess the fulfilment of criteria that give priority to future work related to increasing safety. However, it is also justified to develop a tool focused solely on the assessment of the current level of safety. In this case, the criteria qualified for individual classes should be given appropriate weighting, which will reflect their importance for ensuring safety. Analyses in this area will also be the subject of further research undertaken by the authors.
The development of the proposed method for the purposes of designing safe bus stops should be focused on the aspects related to the sustainable development of a city. Increasing the safety and comfort of travelling by public transport will translate into increased interest in this form of travel by the inhabitants of a given agglomeration. For this reason, their adaptation to the safety requirements of various groups of passengers should be examined. The proposed model takes into account the basic criteria for assessing the safety of using the bus stop by people with disabilities. However, there is potential for further development of the method in terms of sustainable urban transport development.


