Article

Addition of Activated Carbon into a Cattle Diet to Mitigate GHG Emissions and Improve Production

1
Faculty of Health Engineering and Sciences, University of Southern Queensland, Toowoomba 4350, Australia
2
School of Agricultural Engineering and Animal Production, Diali University, Diali 32001, Iraq
3
Centre of Research and Innovation, University of Southern Queensland, Toowoomba 4350, Australia
4
School of Health and Life Sciences, Federation University, Ballarat 3353, Australia
*
Author to whom correspondence should be addressed.
Sustainability 2021, 13(15), 8254; https://doi.org/10.3390/su13158254
Submission received: 24 May 2021 / Revised: 8 July 2021 / Accepted: 13 July 2021 / Published: 23 July 2021
(This article belongs to the Special Issue Renewable Power and Energy Systems for People, the Planet, and Profit)

Abstract

:
Globally, the most problematic greenhouse gas (GHG) emissions of ruminant livestock is methane (CH4), with a global warming potential 25 times that of carbon dioxide. This work considers the emissions and production effects of powdered activated carbon (PAC) at 0.5% by dry matter (DM) on methanogenic rumen flora as the major source of dairy cattle enteric methane emissions. In total, 180 dairy cattle located in Brymaroo, Queensland (QLD), Australia, were studied in a three-cycle repeated measures ANOVA format with a 4 week primary interval. Emissions eructated during milking and in faecal deposits were measured, and in addition, 16S rRNA gene sequencing was performed to determine the collective populations of prokaryotic bacteria and archaea as well methanogenic communities for each treatment. Moreover, 0.5% PAC addition reduced CH4 emissions by 30–40% and CO2 emissions by 10%, while improving daily milk production by 3.43%, milk protein by 2.63% and milk fat by 6.32%, on average for the herd (p < 0.001 in all cases). rRNA gene sequencing showed populations of methanogenic flora decreased by 30% on average with a corresponding increase in the nonmethanogenic species. We strongly advocate further on-farm trials with the dietary addition of PAC in ruminant diets to mitigate emissions while maintaining or improving productivity.

1. Introduction

Methane produced by ruminants is a known contributor to greenhouse gas effects and global warming [1]. Ruminant methane emissions account for more than 50% of greenhouse gas (GHG) released by milk production, and this percentage can increase to around 80% in grassland fed scenarios [2]. In ruminants, cellulosic feed materials are digested in the rumen by microbial fermentation that generates approximately 80% of the methane, while the remainder is derived from the decomposition of manure [3]. These percentages are heavily influenced by dairy breed, food digestibility, feed types and animal housing, ranging from 60–100% for enteric methane and between 0–40% for decomposition of manure [4].
Farm livestock produces an enormous amount of manure that directly impacts agricultural land, soil, water and air quality by manure contamination, GHG emissions, nutrient leaching and odours [5,6]. This manure is beneficial to soils as an organic fertilizer, can reduce the amount of chemical fertilizer applied and can also mitigate fertilizer runoff into waterways [7,8].
Elevated pathogens and pathogen indicator levels in manure have received considerable public attention because of their associated public and animal health risks [8,9,10]. The supply of antimicrobials to livestock can also influence the levels of resistant bacteria in faeces, and their use as feed ingredients in livestock diets can also vary the level of resistance in faecal microbiota. For these practical reasons, which collectively have a serious impact on agriculture, manure management in dairy farms and agricultural land is becoming more important. Logically, we hypothesized that the microbial complexity of dairy cattle manure should change with various on-farm manure treatment processes and required investigation.
Supplementing cattle diets with various biochars has been investigated as an alternative method of improving soil fertility, available phosphorus and improvement of soil acidity, with reports that feeding biochar to goats decreases the input of chemical fertilisers to soil and improves soil properties through the subsequent deposition of the goat manure [11,12,13]. Other uses of biochar include feeding sheep biochar for mitigation of toxicoses by absorption as in [14,15,16], or feeding goats to improve nutrient digestibility [17,18,19] and similarly with cattle [20,21]. However, there is a lack of information on the assessment and efficacy of powdered activated carbon (PAC) on the mitigation of GHG emissions during milking and performance of dairy cattle. Therefore, the objective of this study is to determine the effect powdered activated carbon (PAC) at 0.5% dry matter (DM) of diet on the enteric methane (CH4) emissions and performance of dairy cattle when incorporated into a concentrate pellet.

2. Materials and Methods

2.1. Measure Animal Responses on Farm

2.1.1. Location and Animals

In this research, the dairy cattle productivity and gas emissions measurements were taken from a commercial dairy farm that is using a traditional milking system, located in Brymaroo, Queensland, Australia. The farm facilities use natural ventilation generally with some forced ventilation used in the milking shed area. A herd of 180 dairy cattle were free to forage during the day and had open air shelters available as required at night with free access to drinking water.

2.1.2. Powdered Activated Carbon (PAC)

In this paper, a high-activity microporous and adsorption capacity of powdered activated carbon (PAC) was used. PAC was purchased from Activated Carbon Technologies Pty Ltd., Victoria, Australia. PAC was made under specific pyrolysis conditions at 1000 °C with one hour holding time in the oven. The apparent density of PAC was between 0.35–0.45 g/mL. The moisture of PAC was 5%. PAC contained 5% of ash and iodine. The surface area of PAC was >1000 m2/g. The total pore volume of PAC was >0.35 mL/g. Particle size specifications were 100 Mesh American Standard Test Series (ASTM) passing 99%.

2.1.3. Experimental Design

All dairy cattle were fed a diet of pellets (Table 1). The daily cattle consumption was 6 kg of pellets diet feed and 40 kg of barley hay. Pellet diet feed (with and without PAC) was provided by Ridley Agriproducts Pty Ltd. PAC was added at 0.5%/dry matter (DM) of feed. Animal productivity and gas emissions (CO2 and CH4) of the dairy cattle were initially monitored without any PAC addition for four weeks to get baseline data. After that, PAC was added to their feed for six weeks, and animal productivity and gas emissions were monitored for the last 4 weeks of each 6 week interval, i.e., after a 2 week adaptation period to allow animals to adjust to their assigned experimental diets. Similarly, the first 2 weeks of the subsequent 6 week intervals were used to adapt animals to their dietary changes with and without PAC addition. The purpose of this repeated series of feeding was to obtain accurate measurements and statistical validation.

2.1.4. Measuring GHG Emissions before, during and after Milking Dairy Cattle

The GHG measurements (CO2 and CH4) were conducted on a weekly basis at the dairy cattle farm using a portable diffuse flux meter with an LI-GHG detector (see Figure 1). The instrument contains a collecting chamber, a personal digital assistant (PDA), a backpack and a robust container for shipping and transportation. The collecting chamber of the instrument was installed in the ventilation hatch of the milking area to cover all the GHG emissions areas. The approach used to measure emissions is an adaption of the polyethylene Tunnel method employed for sheep by Lockyer et al. [22]. The milking shed is covered on 3 sides to minimize effects of prevailing winds and uses forced ventilation to ensure consistent airflow and environment within the shed. Milking is conducted in the early morning, and little variation was observed in wind speed, which was observed during the collection time of 5–6 a.m. over the interval.
Before field measurements were conducted, the CO2 flux meter was calibrated using 0% and 4% CO2 standard gases. The analytical error associated with a single measurement was about ± 5%, and the reproducibility was about ± 10% for the range of 100–10,000 g m−2 day−1. In addition to the standard calibration performed at 1% or 10,000 ppm for CH4, the fluxmeter was further calibrated using a more representative GHG levels with a 5L Tedlar bag of inert N2 and a similar vessel with a 100 ppm concentration of CH4, with average results within ±1% over a 5 min sample period (i.e., average of 300 single point measurements over this period).
The GHG measurements were divided into three stages. The first stage measured the GHG 15 min before milking. In the second stage, GHG measurements were throughout the milking of around 180 dairy cattle. The third stage was the GHG measurements when the milking of the dairy cattle was finished and after the dairy cattle left the milking area. This farm experiment continued for 22 weeks. The usual time of starting experiments was 5:30 am. The dairy cattle productivity data (milk quality and quantity) were taken from the farm record. The GHG measurements were performed with and without PAC supplements. Our emissions monitoring has been made available in conjunction with an ongoing Landcare Australia community project with animal ethics approval. (“Use of Non-Invasive Techniques to Estimate GHG Emissions on Working Farms” CA2020/01/1338, 20 January 2020–24 May 2022).

2.2. Measuring GHG Emissions from the Manure

2.2.1. Measurement of CO2 and CH4 Emissions

GHG emissions (CO2 and CH4) from manure on the ground of the barn were measured by using a portable diffuse flux meter with the LI-CO2 and TLD-CH4 detectors. Gas emissions from the manure of the dairy cattle had been monitored for four weeks before PAC supplementation. After that, GHG emissions were measured with PAC supplementation for four weeks. GHG emissions were then measured for another four weeks without PAC supplementation. In the last four weeks, the PAC supplementation was examined. After each stage of measurements, the ground of the barn was cleaned completely before two weeks to obtain accurate data. The portable diffuse flux meter was located in the same area in the ground of the barn, and the period of measurement was 15 min every week. In the last stage, the collected data were transferred using a computerized instrument part.

2.2.2. Manure Collection

In this research, fresh manure samples were collected from the milking area for 4 cattle, using their unique dairy cattle ID tags. Five subsamples of each faeces pad were collected to represent a single faecal pad for each cow. Faecal materials were placed in a small food grade polyethylene bags after removing the air before sealing. All the manure samples were kept in a chilled thermally insulated container. After that, the manure samples with and without PAC supplements were sent to the laboratory in the University of Queensland (Gatton, QLD, Australia) for manure chemical components testing.

2.2.3. Archaeal and Bacterial 16S rRNA Gene Sequencing

Five grams (g) of each faecal subsample collected as per Section 2.2.2 from cattle diets with and without PAC (n = 4 in both cases) were analysed. All the manure samples were kept in a chilled thermally insulated container and sent to the Federation University in Ballarat, Victoria (VIC), Australia for DNA extraction. DNA was extracted using a Power Soil kit (Qiagen, USA), following the manufacturing conditions and quality of the DNA assessed using nanodrop technology. Extracted DNA was processed at the Australian Genome Research Facility Ltd. (Brisbane, QLD, Australia) for microbial community identification, using the Illumina MiSeq platform, target 341F, 300 bp, Forward Primer CCTAYGGGRBGCASCAG.
Reverse Primer GGACTACNNGGGTATCTAAT were used for PCR-amplification. Illumina paired-ends reads were assembled by aligning the forward and reverse reads using PEAR (version 0.9.5). Primers were identified and trimmed. Trimmed sequences were processed using quantitative insights into microbial ecology (QIIME 1.8.4), USEARCH (version 8.0.1623) and UPARSE software. Using USEARCH tools, sequences were quality filtered full-length duplicate sequences were removed and sorted by abundance. Singletons or unique reads in the data set were discarded. Sequences were clustered, and chimeric sequences were filtered using the “rdp_gold” database as a reference. To obtain the number of reads in each OTU, reads were mapped back to OTUs with a minimum identity of 97%. Taxonomy was assigned using QIIME.

2.2.4. Microbiome Beta and Alpha Diversity Analysis

For α-diversity indexes both rarefaction and nonfiltering of the abundance table were performed using R studio. Measurements of alpha diversity were computed using the “Phyloseq” R package, and the computed indices were compared for significance differences post-PAC treatment using independent 2-group Mann–Whitney U Test = wilcox.test test using the ggrub package. For the rarefaction method, the set.seed (123) was used to initialize repeatable random subsampling [23,24,25].
For beta diversity, the Aitchison distance method was used with a centred log-ratio transformation approach as described by Gloor et al. [26] for compositional datasets. Prior to transformation the dataset was filtered to only contain OTU that were detected at least 1 in 2 of the 8 samples. ps4 ← core (ps, detection = 1, prevalence = 2/n samples (ps)). Using this method to calculate ordination scores (eigenvalues), a redundancy analysis performed and plotted. To generate a distance matrix, the Euclidean method was selected, and the Adonis function from the Vegan R package was used to compute a PERMANOVA for identification of significant clustering based on treatment using p < 0.05. The betadisper function from the Vegan R package was used to test for homogeneity.

2.3. Statistical Analysis

The Statistical Package for the Social Sciences (SPSS-version 23) software was used to analyse the experimental data as in [27] and involved the analysis of variance (ANOVA). Statistical means of milk production, GHG emissions, Archaeal and bacterial relative abundance were compared using Duncan’s test at 5% levels of probability. Statistical analyses were graphically assessed by means of residual plots, and normalisation of the data was not required. Linear regression analyses were used to describe the relationships between GHG emissions and times of measurement (before, during and after milking). The cofactors were intervals of milking and PAC rates used. Analytical values are reported in this study as the mean ± standard deviation (SD).

3. Experimental Results

3.1. The Effect of PAC on Dairy Milk Production

Figure 2 shows the effect of PAC at 0.5% by DM of diet on milk production quantity and quality for a working dairy farm. These results combine the milk production from 180 dairy cattle located in Brymaroo, QLD and Australia. Figure 2a presents the daily milk production before and after adding 0.5% of PAC to their pellet diet. Although not significant (p = 0.171), this addition improved the daily milk production by 3.43% on average for the herd. Figure 2b compares the percentage of milk protein with and without PAC. Supplementation with PAC significantly increased milk protein (p < 0.05) by 2.63%, and milk fat was significantly increased (p < 0.001) by an average of 6.32% as shown in Figure 2b.

3.2. Measuring Total GHG Emissions before, during and after Milking

3.2.1. Methane Emissions (CH4)

CH4 emissions were measured over four weeks (first test is called term one). CH4 emissions were affected by all two factors: PAC concentrations and terms, as shown in Figure 3a–c. CH4 measurements were taken under the same circumstances and conditions. Figure 3a,c presents the effect of two percentages of PAC concentrations on the CH4 emissions before, during and after milking processes in the dairy cattle farm. PAC concentration contributed to reducing the CH4 emissions during milking from 25.03 to 16.55 ppm (8.48 ppm reduction or 33.8%) when it was added into the feed with 0.5%.
Figure 3b,c shows the effect of the interaction between two factors: PAC concentrations and terms. Before milking, the ambient CH4 emissions were varied slightly going from 3.84 to 4.59 ppm for the various terms. Importantly, CH4 emissions during milking in term one also declined significantly (p < 0.001) by adding 0.5% of PAC from 29.25 to 15.97 ppm, respectively. In term two, CH4 emissions were also reduced significantly (p < 0.001) from 20.81 to 17.13 ppm by adding 0.5% PAC. The difference between terms one and two was 9.6 ppm. Besides that, CH4 emissions declined significantly (p < 0.001) after milking dairy cattle in both terms (one and two). In term one, CH4 production reduced from 6.10 to 4.95 ppm by adding PAC. In term two, CH4 dropped from 7.05 to 4.24 ppm by adding PAC (Figure 3b,c).

3.2.2. CO2 Emissions

In the in vivo experiment, on-farm measurement of CO2 emissions before, during and after milking dairy cattle were measured for the two terms. The PAC slightly reduced the amount of CO2 before, during and after milking of dairy cattle as shown in Figure 4a,b. The amount of CO2 before milking was 463 and 452 ppm at 0% and 0.5% PAC, respectively, as shown in Figure 4a. The amount of CO2 during milking was 563 and 548 ppm at 0% and 0.5% of PAC, respectively, as shown in Figure 4a. The amount of CO2 after milking was 472 and 470 ppm at 0% and 0.5% PAC, respectively, as shown in Figure 4a.
Figure 4b shows the effect of interaction between PAC and terms (1 and 2) (before, during and after milking) on the CO2 emissions from dairy cattle on the farm. Before milking, in term one, the CO2 emissions increased slightly from 444 to 451 ppm at 0% and 0.5% of PAC, respectively, while they were reduced significantly (p < 0.05) in term two, in which it was 484 and 452 ppm at 0% PAC and 0.5% PAC, respectively. CO2 emissions during milking in term one increased slightly with the addition of 0.5% of PAC, from 440 to 451 ppm, while in term two, CO2 emissions were reduced slightly from 683 to 646 ppm by adding 0% and 0.5% of PAC, respectively. At the same time, CO2 emissions increased after milking dairy cattle in term one. In term one, CO2 production rose from 444 to 451 ppm by adding 0% and 0.5% of PAC, respectively, whereas, in term two, CO2 did not affect production when 0.5% was added to the diet of dairy cattle, as shown in Figure 4b.

3.3. Measuring Total GHG Emissions and Chemical Compounds in Dairy Cattle’s Manure

3.3.1. CH4 Emissions

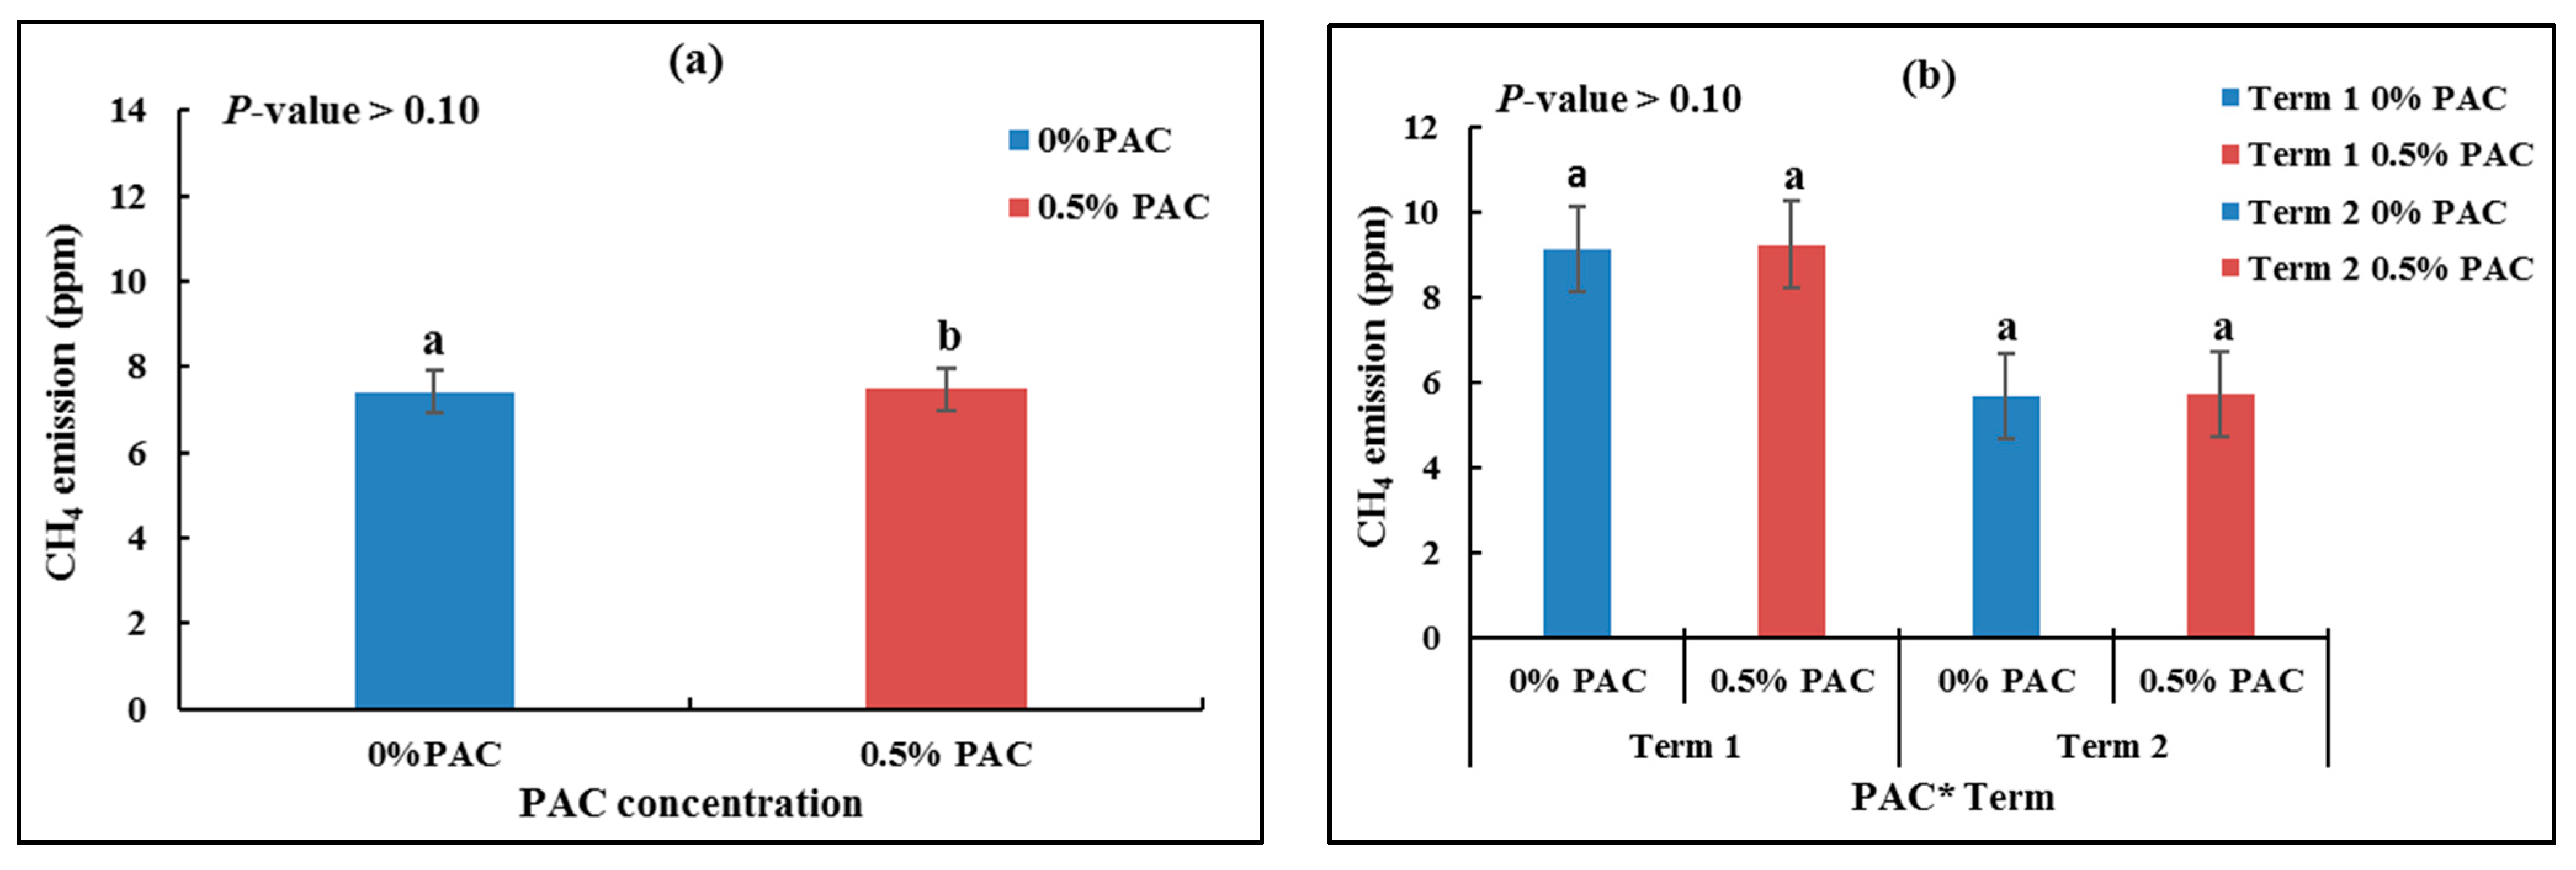
We also tested the dairy cattle manure to investigate how the addition of PAC in the diet affected the GHG emissions and other parameters. GHG emissions were measured before and after the addition of PAC in the dietary pellets. Figure 5a shows the overall results of CH4 emissions from manure with and without PAC. Although there was a slight increase in the manure CH4 emissions, from 7.42 to 7.49 ppm with the addition of 0.5% PAC, this was barely significant (p < 0.10). In this study, three manure test sites in the common area were studied to give an indication of any changes in manure emissions. In order to evaluate if this slight change is real or otherwise, a comparison of samples from specific cattle with and without treatment would be required.
Figure 5b presents the interaction between PAC and term on CH4 emissions from dairy cattle manure before and after the cattle were fed PAC. CH4 emissions in term one with and without PAC did not change. They were 9.14 and 9.2 ppm at 0% and 0.5% of PAC, respectively, for term one, while there was no effect in term two. Therefore, it can be concluded that the PAC had not reduced CH4 from the manure of dairy cattle.

3.3.2. CO2 Emissions

CO2 emissions were affected by PAC concentrations over time and terms, as shown in Figure 6a,b. Figure 6a presents the effect of two percentages of PAC concentrations on the CO2 emissions from manure before and after being fed PAC. The presence of 0.5% PAC in the diet significantly reduced (p < 0.001) the CO2 emissions from 1631 to 1464 ppm. Figure 6b shows the interaction effect of the PAC and terms to estimate the PAC behaviour. In term one, the CO2 emissions dropped (approximately 9.8% reduction) from 1461 to 1318 ppm at 0% and 0.5% PAC, respectively. Similar results showed in term two and the effect of PAC was clear, as shown in Figure 6b. CO2 emissions were reduced from 1789 to 1609 ppm. The effect of PAC has had a similar trend in terms one and two as shown in Figure 6b.

3.4. The Effect of PAC on the Bacterial and Archaeal Microbial in Dairy Cattle’s Manure

3.4.1. Microbial Community Analysis

Herein, 16S rRNA Gene Sequencing was performed by next generation sequencing to determine the collective population of prokaryotic bacteria and Archaea to characterize the specific methanogenic communities in dairy cattle manure from cattle fed one of two pelleted diets: either a basic diet or an equivalent diet supplemented with 0.5% PAC. By the use of an array of specific primer pairs, the next generation sequencing captured a diverse range of bacteria in both manure groups. The sequencing and classification of microbiota following quality control methods resulted in an abundance table of 1379 taxa. The average library size was 27,419.625 sequences with the lowest library size being 7814 sequences, the largest library size being 53750.
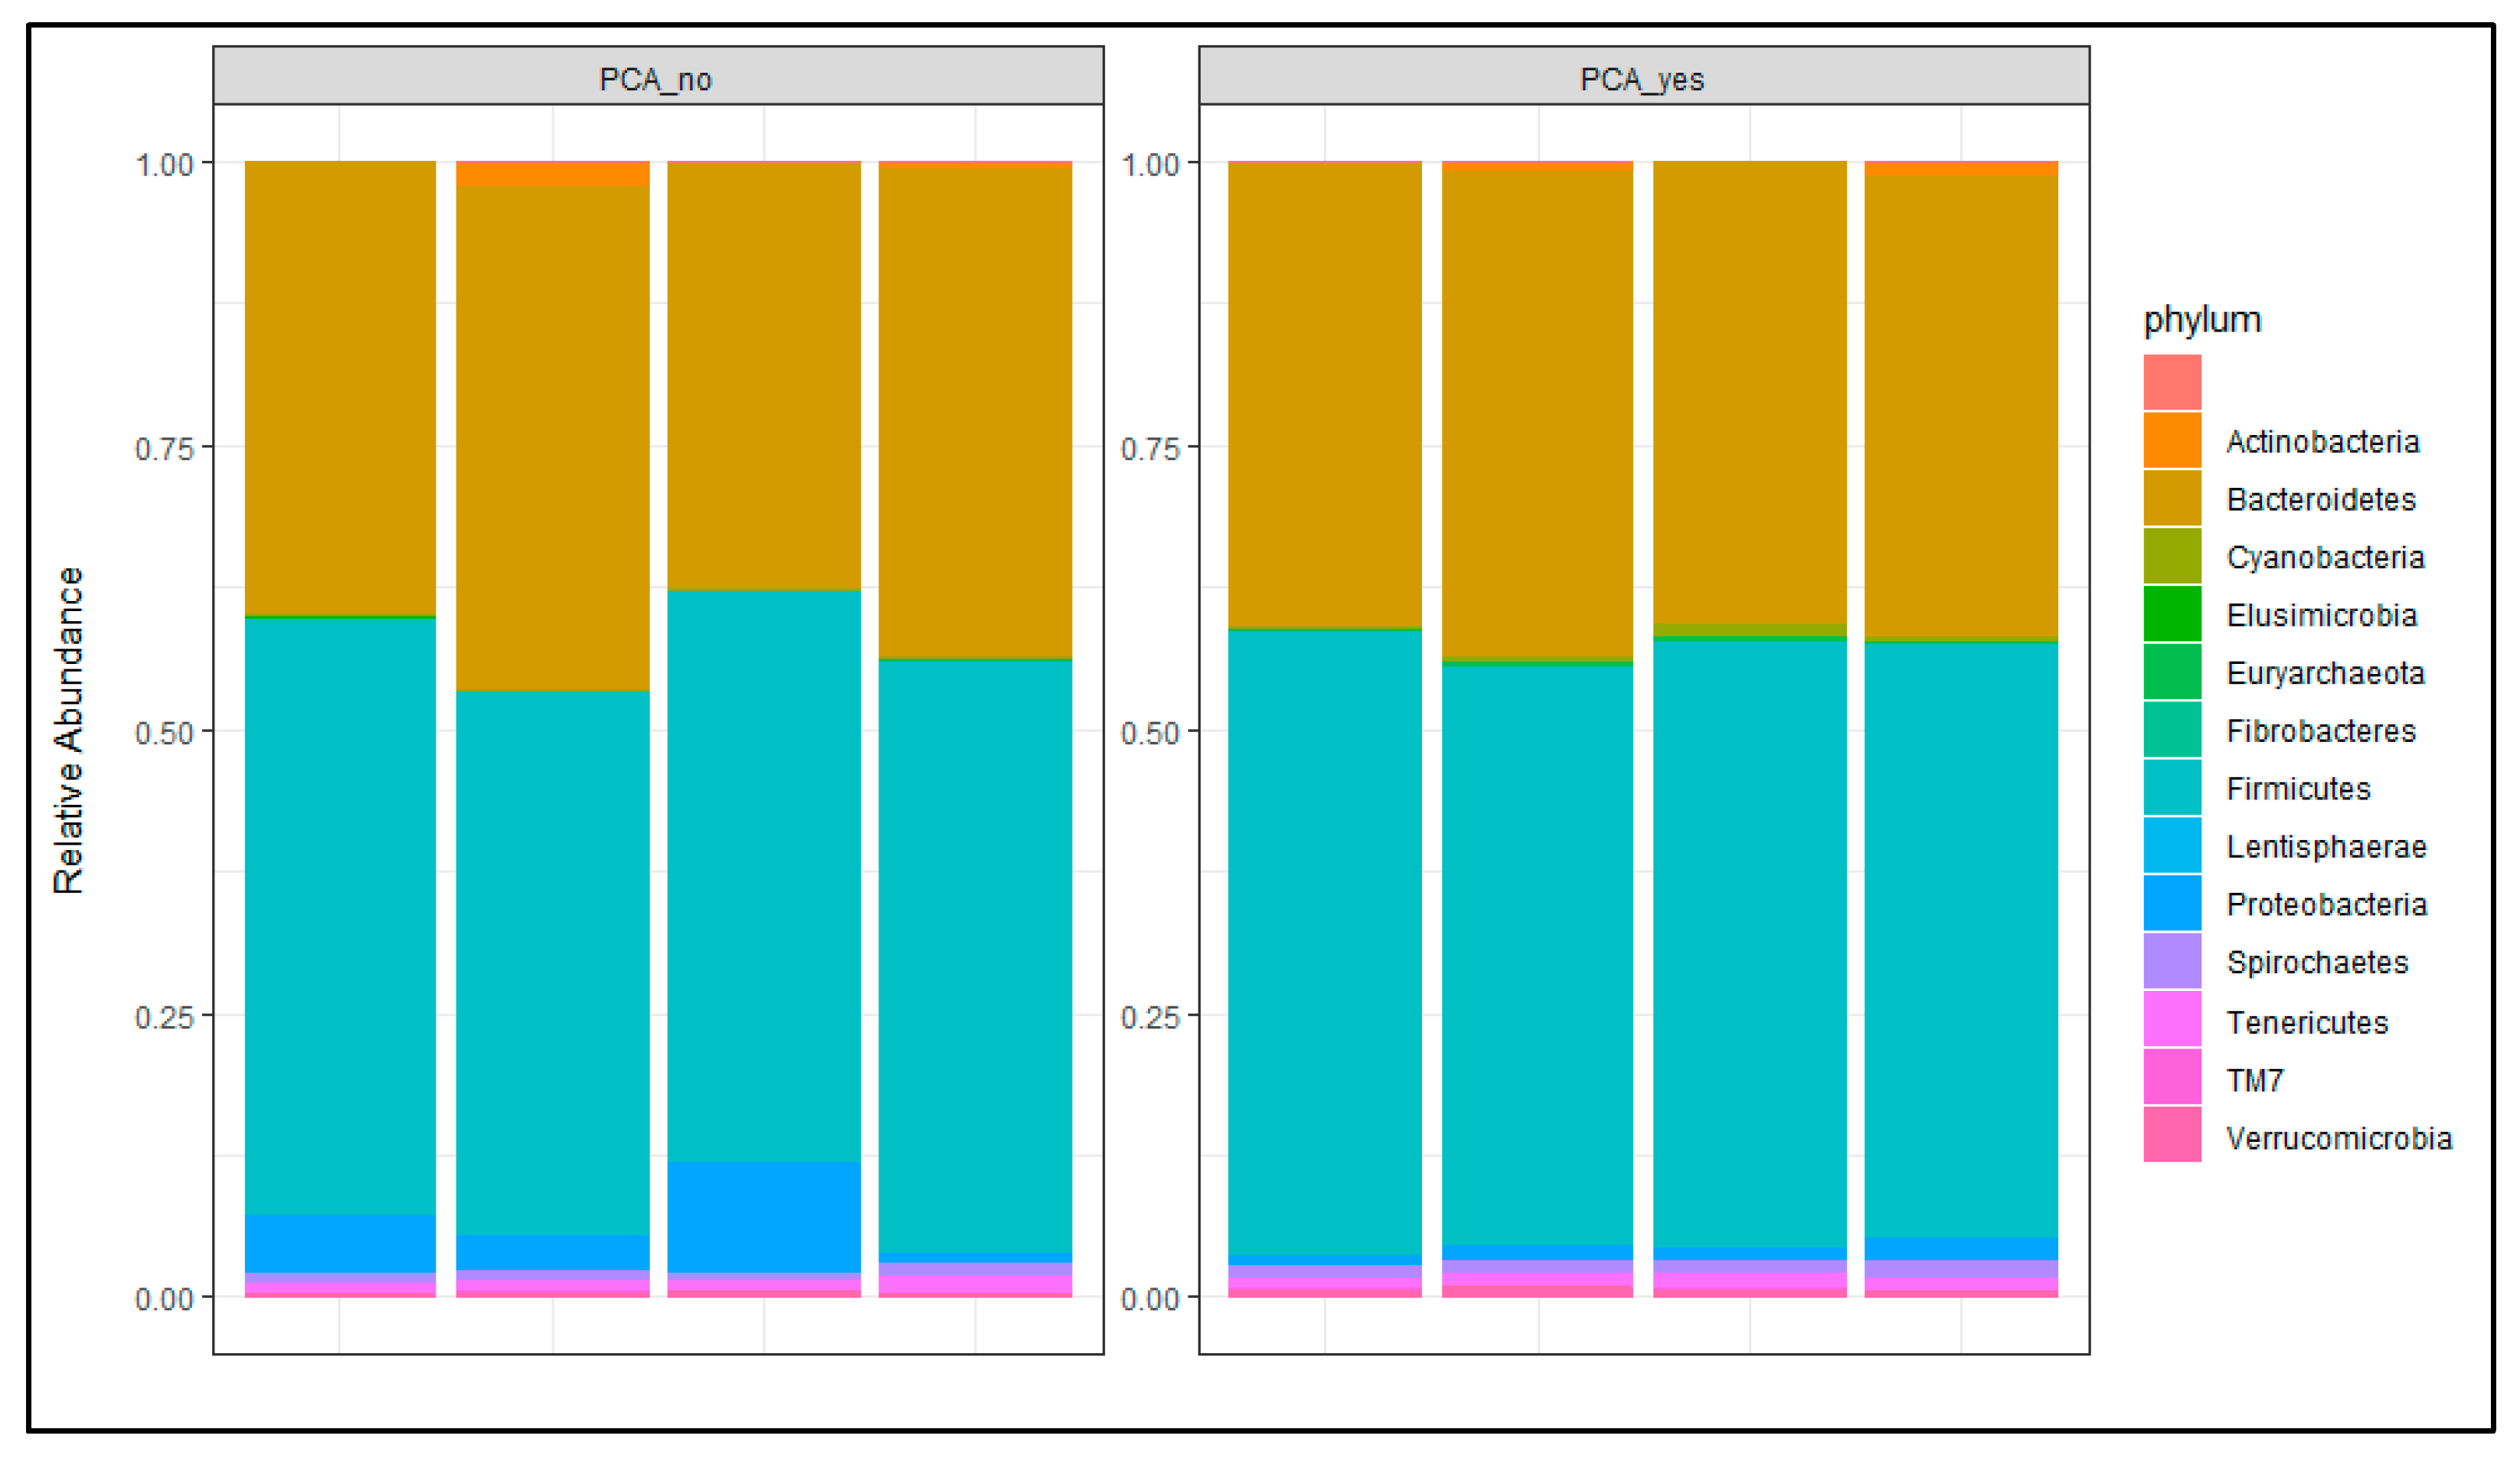
The vast majority of bacteria in the manure samples (over 90%) belonged to two phyla: Bacteroidetes and Firmicutes Figure 7. However, whether or not the diet was supplemented with PAC, there were no significant changes in the percentages representing Bacteroidetes and Firmicutes populations 53–51% and 42–41%, respectively; Figure 8a,b.
By contrast, there were also very small percentages of members from other phylums including Protoeobacteria, Spirochaetes, Tenericutes, Verrucomicrobia, Actinobacteria and Archeobacteria (ranging overall from 0% to 5%). Since there were no significant changes with the two major phyla (Bacteroidetes and Firmicutes), we removed them from the graph to allow better-quality comparison of changes within the minor phyla due to PAC supplementation (Figure 9a,b).
There were no significant changes in the levels of some of the minor phyla; specifically, TM7, Actinobacteria and “other” groups (remaining at 1%, 9% and 1%, respectively). Among the other minor phyla, there were some significant changes after PAC supplementation (Figure 9a,b). There was a significant decrease in the proportion of Proteobacteria (from 57% to 23%). All other phyla groups showed significant increases: Spirochaetes (from 11% to 21%); Cyanobacteria (from 3% to 9%); Verrucomicrobia (from 4% to 11%); Tenericutes (from 13% to 18%); Elusimicrobia (from 0 to 1%); and Fibrobacteres (from 1% to 2%) (Figure 9a,b).
Specifically, for the members of the phylum Euroarchaeota within the Kingdom Archeae, which harbors the methanogen bacteria, there was a significant increase, when the diet was supplemented with PAC (from 1% to 4%). Figure 10a shows the methanogen species in dairy cattle manure with no PAC supplementation. The majority of archaea were members of the genera Methanobrevibacter (83%) and genera of the family Methanocorpusculaceae (42%) with very low levels of Methanosphaera (3%) and vadin CA11-related genera of the family Methanomassiliicoccaceae (2%). By contrast, there was a significant change within the methanogenic community in the manure from dairy cattle supplemented with 0.5% PAC Figure 10b. There was a significant decrease in the proportion of members of the genera Methanobrevibacter (from 83% to 51%) with a concurrent significant increase in genera of the family Methanocorpuscuralceae (from 12% to 42%). The percentages of the other two minor genera also showed a minor increase, although their proportion remained low Methanosphaera (an increase from 3 to 4%) and members of Methanomassiliicoccacea (from 2% to 3%).
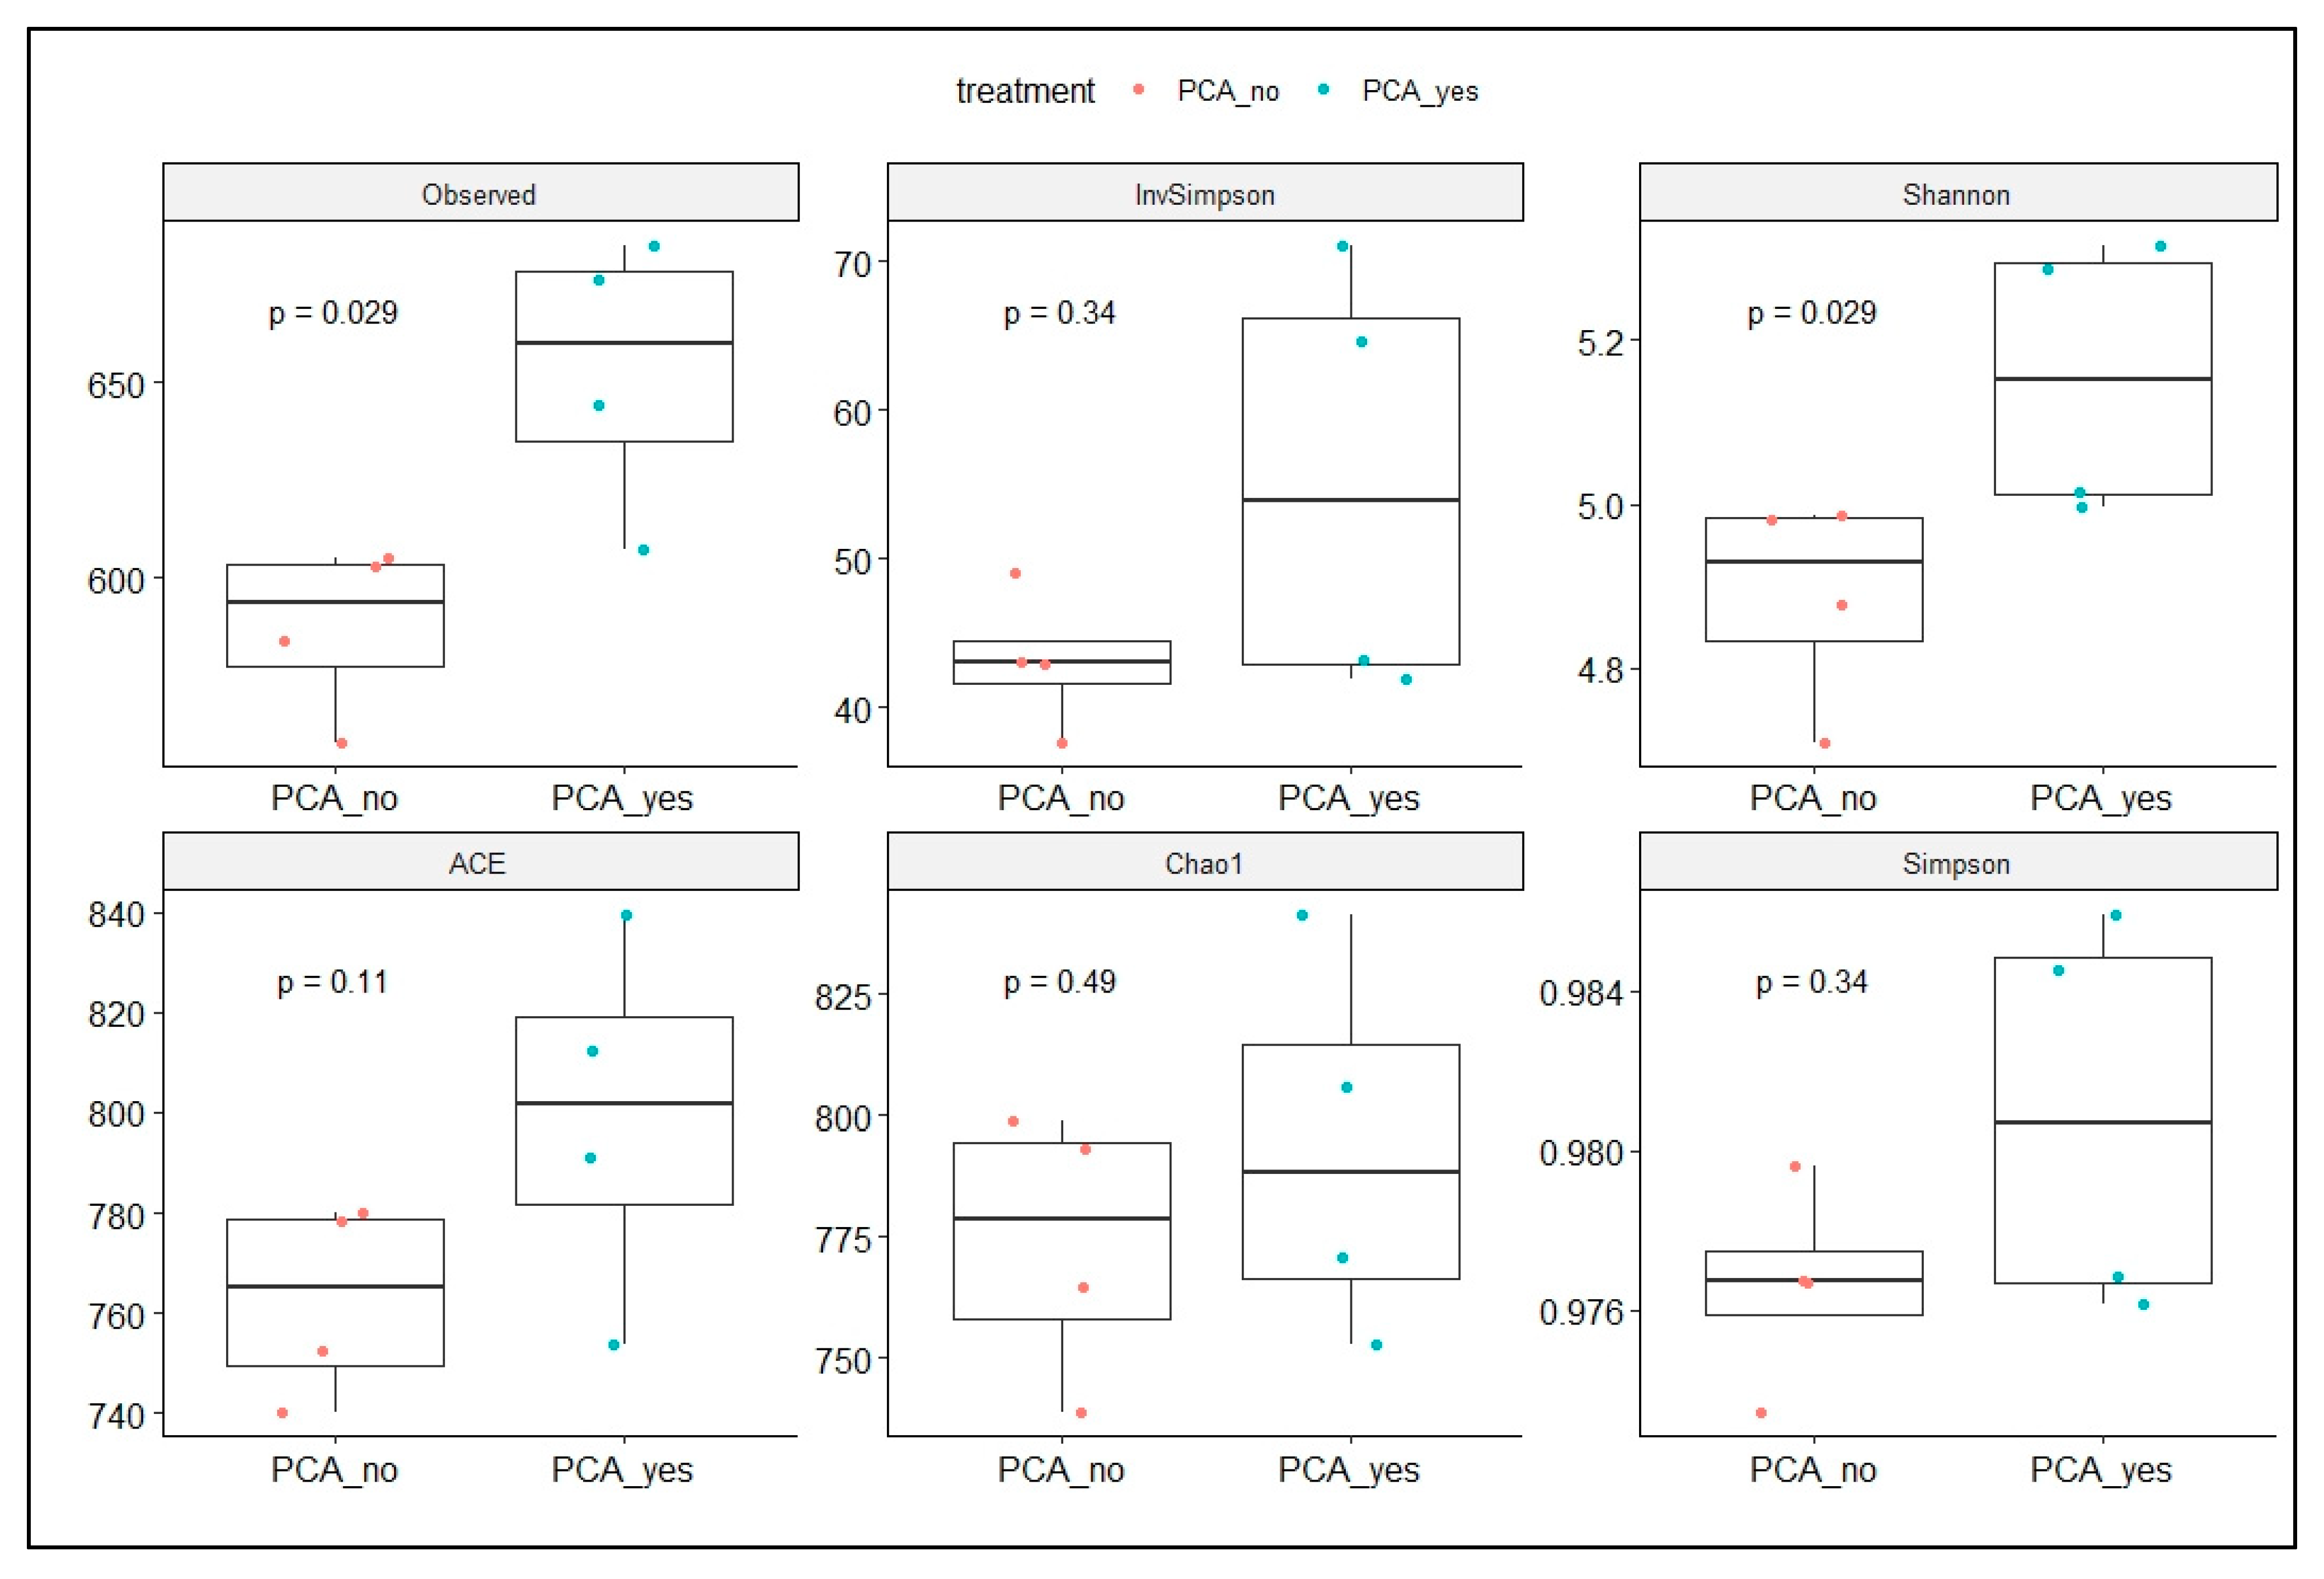
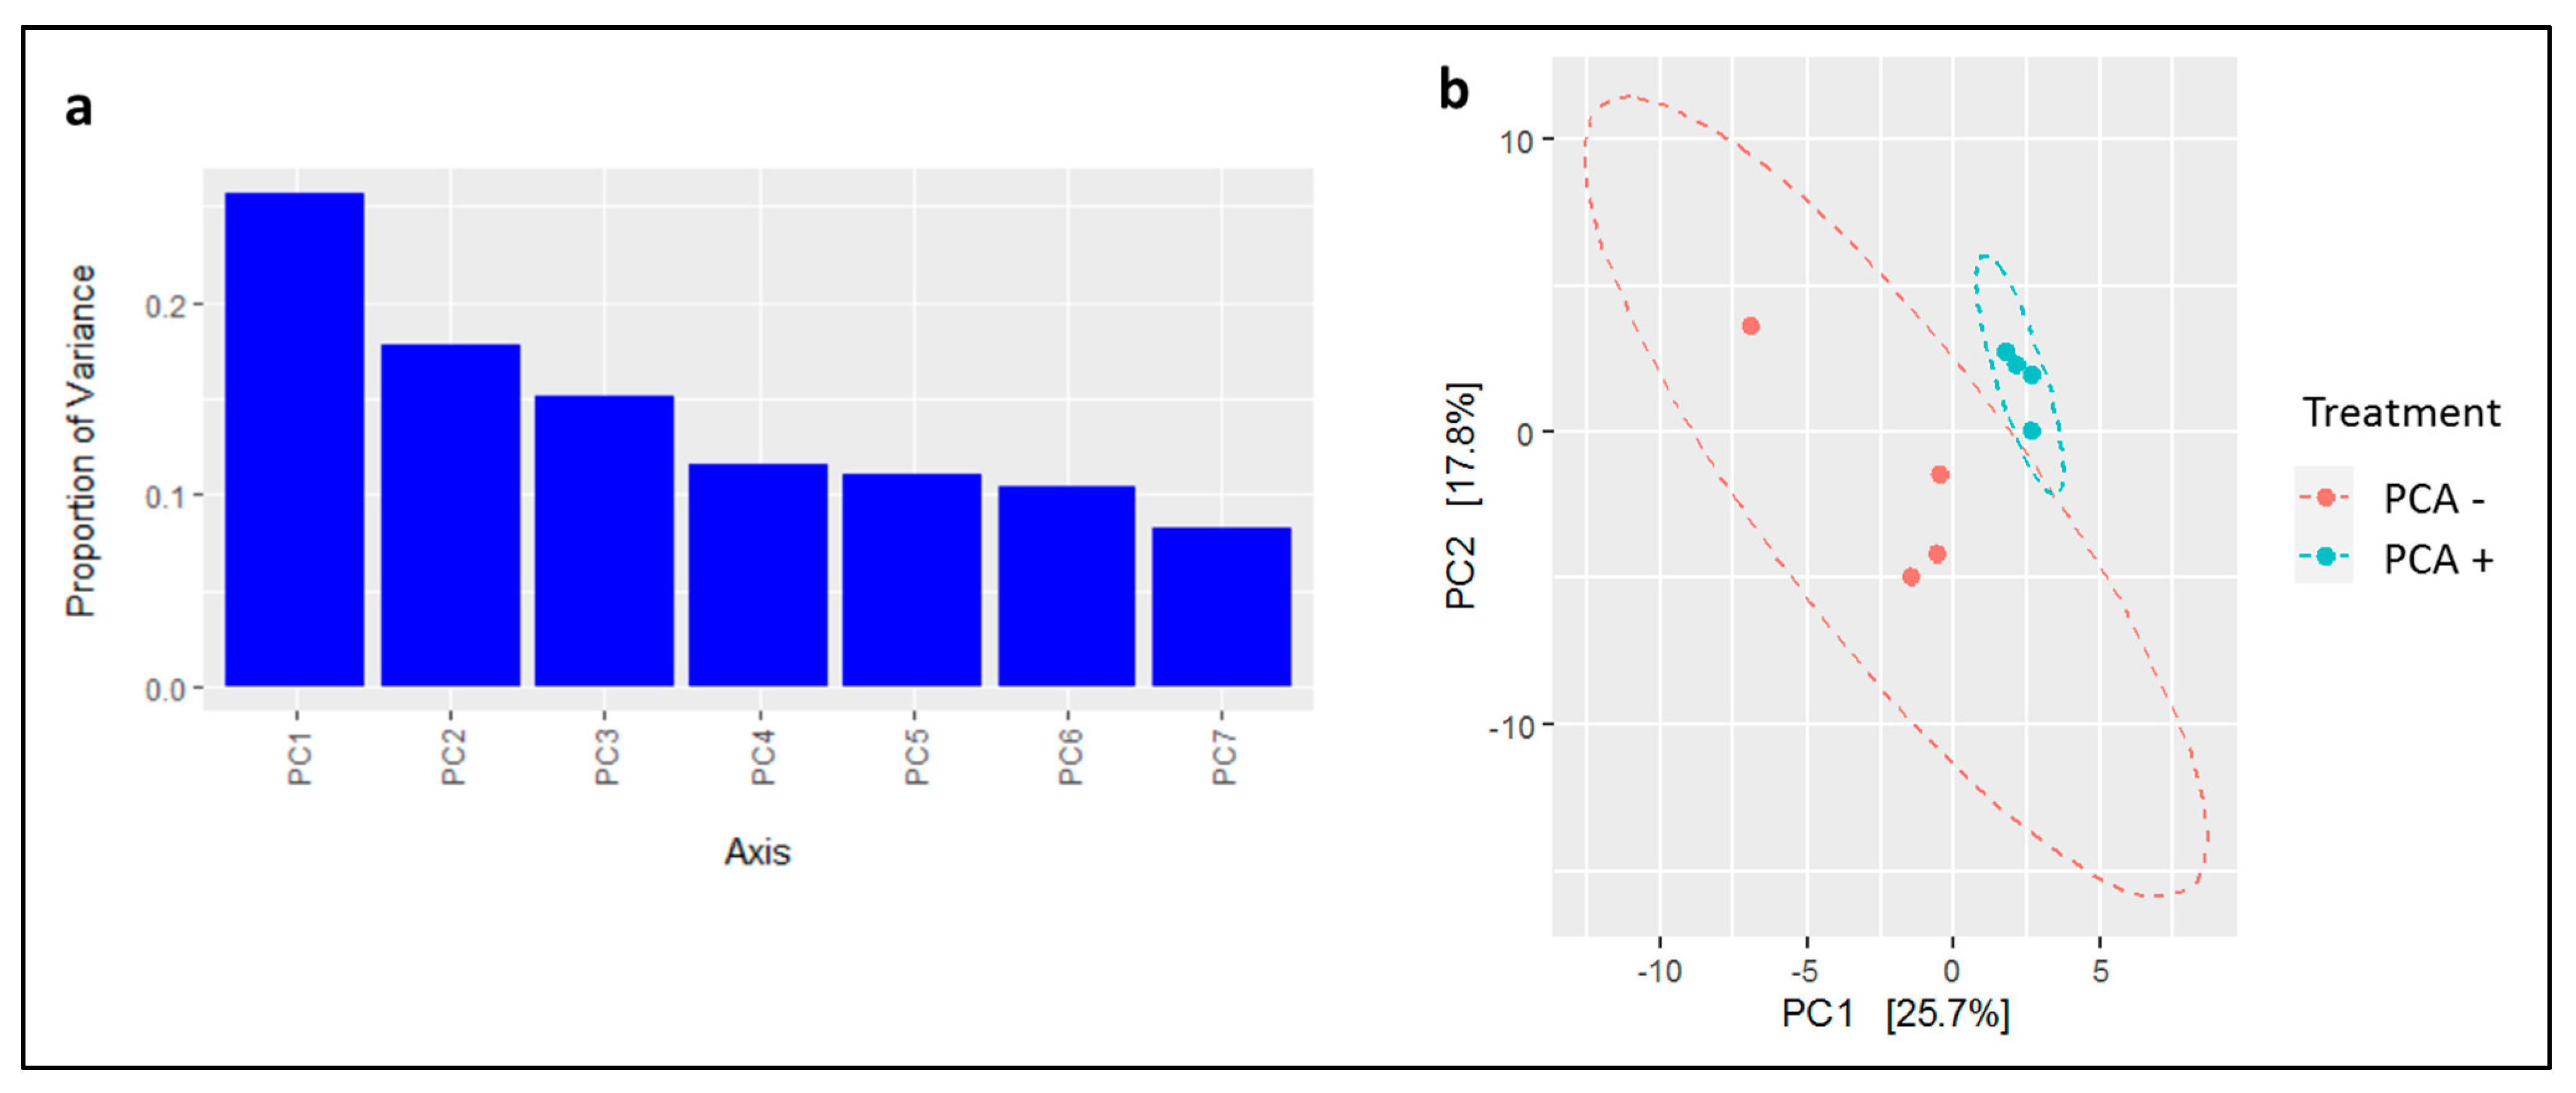
Faecal samples (n = 4) from randomly selected animals pre- and post-PCA supplementation were tested for changes in alpha and beta diversity. For alpha diversity, using both the rarefaction Figure 11 and nonrarefaction approaches, there was an increase in the different methods used to measure species richness. Rarefaction resulted in a reduced sample size of 7776 sequences in each sample for comparison. Significance increases in alpha diversity using the methods of Observed and Shannon index were identified Figure 11. PAC supplementation was also shown to result in a difference in overall microbiota composition between the two groups. Filtering of the dataset resulted in a reduced number of taxa (n = 773). Redundancy analysis identified that 26% of the variation between the two datasets could be explained by the first component of Figure 12a. Ordination analysis resulted in the unsupervised clustering into treatment groups, as shown in Figure 12b, with a PERMANOVA indicating that treatment had a significant effect on microbiota composition (r2 = 0.22, p = 0.035).

3.4.2. Chemical Compounds of Manure

Manure samples were collected to evaluate the effect of PAC on chemical compounds of manure as shown in Table 2. Dry matter (DM) is significantly increased (p < 0.001) by adding 0.5% PAC. The percentages of DM were 88.56% and 89.11% at 0% and 0.5% PAC, respectively, in the dairy cattle manure. Organic matter also was increased (p < 0.02) by 0.92% at 0.5% PAC in the dairy cattle manure, while Ash was reduced by 0.93% at 0.5% PAC. The percentage of curd protein (CP) significantly dropped (p < 0.001) in the dairy cattle manure. The percentages of CP were 13.11% and 10.37% at 0% and 0.5% PAC, respectively. Neutral detergent fibre (NDF) and lignin did not affect by adding PAC to the dairy cattle diet while acid detergent fibre (ADF) was significantly increased (p < 0.001). ADF levels were 26.56% and 28.34% at 0% and 0.5% PAC, respectively, as per Table 2.

4. Discussion

4.1. Milking Production and GHG Emissions

To meet the growing demand for dairy products such as milk, methods of increasing milk production for herds are investigated. This study is focused on an important topic: whether the addition of 0.5% PAC could reduce GHG emission without impairing milk quantity and quality. Other reports using in vitro PAC have also investigated the beneficial effects of biochar on GHG emissions [21,28,29,30,31]. As far as we know, this is the first study showing the beneficial effects of PAC on dairy products and the reduction of GHG emissions in the dairy farm. The reduction of GHG emissions by adding Biochar (PAC) to the diet corroborates our earlier findings in an in vitro experimental incubation with rumen fluid and different varieties of PAC substrates, including the form used in this work [28,29,32].
Our findings showed that adding 0.5% PAC did not greatly affect dairy milk yield (3.43%), although it significantly improves both the protein and fat concentrations in the milk. These improvements in milk quality could be reflected in the effect of PAC in altering rumen fermentation and biohydrogenation. Our reports show that the addition of the PAC to the diet of cattle also had a significant effect on milk fat and protein.
There was a significant reduction in both carbon dioxide (CO2) and methane (CH4) emissions eructated from the dairy farm cattle when their pellet diet was supplemented with 0.5% PAC, compared to the control treatment (containing no PAC). Methane (CH4) and carbon dioxide (CO2) are two major greenhouse gases released by ruminants such as dairy cows. CH4 is considered an important indicator of farming productivity because it is related to the conversion of feed in the production of livestock [32,33,34], whereby the higher the levels of CH4 emitted, the greater the loss of energy. Enteric CH4 emissions are produced by microbial fermentation of feed components, with CH4 produced predominantly in the rumen (87%) and to a lesser extent (13%) in the large intestines [35,36].
Our results were consistent with those of Xie et al. [37], who found that adding 0.6% of biochar (Rice husk) to cattle diet reduced CH4 emissions by 22%. Further research and development of novel technologies to better understand the efficacy of PAC on GHG emissions in dairy cattle farms are still required, such as increasing the levels of PAC in the pellets.
Several studies have also revealed that the addition of biochar to soil can effectively reduce GHG and CH4 emissions from the soil, presumed to be due to macropores in biochar [37,38,39,40]. However, conflicting results found that when PAC that was coapplied with manure to a basic soil, it did not reduce GHG emissions [41]. This conundrum may be related to the differences in the structures of the biochar substrates.

4.2. Microbial Community

The study also focused on comparisons of methanogen diversity and bacterial populations in pre- and post-treatment (postdiet supplemented with 0.5% PAC) in dairy cattle manure, allowing at least 14 days for the rumen microbial community to adapt to the new diet. Results showed that despite a small subset of samples analysed that PAC supplementation causes a significant increase in species richness and abundance (Alpha diversity) and resulted in a different microbiota composition (Beta diversity).
The microbiota of an animal’s intestinal tract plays important roles in the animal’s overall health, productivity and well-being. Using rDNA bacterial tag-encoded FLX amplicon pyrosequencing analysis, Devore [42], revealed that dairy cows displayed a high diversity of bacterial species and genera in their faeces, including Clostridium, Bacteroides, Porpyhyromonas, Ruminococcus, Alistipes, Lachnospiraceae, Prevotella, Lachnospira, Enterococcus, Oscillospira, Cytophage, Anaerotruncus and Acidaminococcus spp. The general proportion of phyla determined in the manure with and without supplementation with PAC is similar to that reported in literature [43,44,45,46]. The microbiotia was dominated by members of the phyla Firmicutes, with 53% of the OTUs belonging to this taxonomic group. Bacteroidetes was the second dominant phylum, representing 41% of the OTUs and Proteobacteria (5% of the OTUs). Firmicutes and Bacteroidetes were also reported as the predominant phyla, with 25 most common genera accounted for over 85% of the faecal bacterial populations. Our results differ slightly to those reported by Tobita et al. [47],who measured higher levels of Firmicutes (81.3%), lower levels of Bacteroidetes (14.4%), Actinobacteria (2.5%) and Proteobacteria (1.4%). Bhatt and Maheshwari [48] recently reported supporting evidence to the above reports and also extended the knowledge of faecal flora by reporting the additional presence of a few fungal sp., (Aspergillus and Trichoderma), about 100 species of protozoa and 2 yeast species, members of the manure population that we did not investigate.
None of these reports specifically investigated members of the phylum Euryarchaeota, containing important methanogenic bacteria. Our results specifically investigated the presence of members of the Phylum Euryarchaeota, explicitly four groupings of methanogenic bacteria responsible for production of the GHG methane.
Rumen methanogens are divided into three functional groups, the hydrogenotrophs (Methanobrevibacter, Methanomicrobium and Methanobacterium spp) which are the most common consisting of 95% of the dung methanogens and convert hydrogen and/or formate to CH4; the methylotrophs (Methanosphaera spp and members of the order Methanomassiliicoccales) which produce CH4 from methyl compounds such as methanol and methylamines; and the acetoclastic methanogens (such as Methanosarcina), which can utilise acetate to produce CH4 in addition to the hydrogenotrophic and methylotrophic pathway and usually are 6.5% of dung methanogens.
Members of the archaea phylum representing all three of these groups were detected in the faeces from the control diet as well as the diet supplemented with 0.5% PAC. However, they represented only a minor proportion of the bacterial flora in the fresh cow faeces. Furthermore, within the methanogenic archaeal OTUs, there was a significant decrease in the relative abundance of Methanobrevibacter (from 83% to 51%) with a concurrent three-fold increase in genus Methanocorpusculum in the family Methanocorpuscuralceae (from 12% to 42%). The percentages of the other two minor genera also showed minor increases, although their proportion remained low; Methanosphaera (increased from 3% to 4%) and members of the vadin CA11 genera in Methanomassiliicoccacea (from 2% to 3%).
The identified genera are identical and proportional to that reported by who reported Methanomicrobiales (81.7%), Methanobacteriales (11.8%) and Methanosarcinales at (6.5%) in fresh dung samples using mcrA sequencing (which detects the methyl coenzyme M reductase gene unique to methanogens).
We also detected members of the vadin CA11 genera (order Thermoplasmatales) in pre- and post-diet faeces. In our analyses, members of the vadin CA11 genus cluster, increased 50% from 2% to 3% in the PAC-supplemented diet. Members of the vadin CA11 are a novel group of rumen archaeal sequences with no closely related cultivable isolates, which have been implicated in the reduction of methane emissions) [49]. CA11 members were also detected by Zhou et al. [50] using archaeal 16S rRNA in rumen fluid and also identified by Kumar et al. [51] in the dairy cattle rumen but contributed to <1% of abundance.
Godon et al. [52] reported that higher levels of hydrogenotrophic methanogens (93.5%) and acetoclastic methanogens were 6.5%. Within Methanomicrobiales, 81.7% were of the genus Methanocorpusculum, and 6.5% of total clones were related to acetoclastic lineages belonging to Methanosarcinales.
The methanogen community of fresh dung should reflect the same trend as observed in a typical cattle rumen such as the greater abundance of hydrogenotrophic methanogens than the acetoclastic methanogens. The results of the present study corroborate earlier observations reported by wherein the fresh dung mcrA library 93.5% clones belonged to the hydrogenotrophic methanogens, while the acetoclastic methanogens representing merely 6.5% of the total cloneacetoclastic methanogens normally make up only a small percentage of total methanogen community in cattle rumen [53].
The reduction in both methanogen species, Thermoplasmata and Methanomicrobia, and an increase in the Methanosphaera in post-treatment PAC supplementation, compared to the control, suggests that the presence of PAC has affected the growth and function of the archaea members. Further research on the effect of PAC on the microbial community both within the rumen and in faecal samples is necessary.
The positive effect of Biochar on methanogen communities has been well documented in other environments [54,55]. Biochar supplementation in rice paddies had little effect on bacterial diversity but significantly changed the archaeal community structure [56]. The abundances of methanogenic archaea in the paddy were decreased by biochar application, while the methanotroph abundances were increased after biochar was applied, although the differences were not significant due to the large variations in a given treatment. This showed that biochar addition decreased CH4 emissions, which may be due to decreased methanogenic archaea abundance; hence, CH4 could be utilized by Methanotrophs. Liu et al. [57] reported that methanogenic archaea were not inhibited by biochar amendments, but there was a decreased ratio of methanogenic to methanotrophic microorganisms in paddy soils.
We highly recommend further investigations for using PAC at higher concentrations in the diet of dairy cattle because the results of our pilot trial show significant changes to the methanogenic population. Higher concentrations of PAC within the diet have the potential to further mitigate GHG such as CH4 emissions. They may also further increase milk fat and protein production, which, although increased in our trial, did not meet a statistically significant change.

5. Conclusions

Feed supplementation with powdered activated carbon (PAC) is a promising method for reducing GHG and CH4 emissions and increasing milk quality and quantity of dairy cattle. Two supplementation levels (0% and 0.5%) were tested, with PAC being incorporated into a pelleted compound feed. When pelleted feed was supplemented with PAC, milk production increased by 3.34% on average for the herd. The PAC supplementation had a significant increase (p < 0.05) in milk protein by 2.63%. Milk fat was significantly increased (p < 0.001) to an average of 6.32%.
The PAC supplementation had a significant increase (p < 0.05) in milk protein by 0.03%/cow. Milk fat was significantly increased (p < 0.001) to an average of 0.06%. PAC supplementation reduced CH4 emissions significantly (p < 0.001) before during and after milking of dairy cattle. The PAC slightly reduced the amount of CO2 before, during and after milking of dairy cattle. The PAC did not reduce CH4 emissions from the dairy cattle manure, while it had significantly reduced (p < 0.001) the CO2 emissions. There was a significant decrease (p < 0.001) in the proportion of Proteobacteria and the genera Methanobrevibacter. However, the genera of the family Methanocorpuscuralceae was significantly increased by PAC addition. PAC did not affect Methanosphaera and Methanomassiliicoccacea. The incorporation of PAC into pelleted feed used in this study appears to be an effective way to introduce a low-emissions feed product into the Australian dairy industry.

Author Contributions

Conceptualization: M.A.-A., L.B. and K.H.; Methodology: L.B., K.H., S.P. and M.A-A.; Validation: M.A.-A.; Formal analysis: S.P., M.A.-A., K.H.; Investigation: M.A.-A., L.B., S.P.; Resources: L.B., K.H. and S.P.; Data curation: S.P., M.A.-A. and K.H.; Writing—original draft preparation: M.A.-A. and K.H.; Writing—review and editing: L.B., S.P. and K.H.; Visualization: M.A.-A. and L.B.; Supervision: L.B., S.P. and K.H.; project administration: L.B., K.H. and S.P.; All authors have read and agreed to the published version of the manuscript.

Funding

This research received no external funding.

Institutional Review Board Statement

Queensland Department of Agriculture and Fisheries (“Use of Non-Invasive Techniques to Estimate GHG Emissions on Working Farms” CA2020/01/1338, 20 January 2020–24 May 2022).

Informed Consent Statement

Not applicable.

Data Availability Statement

Not applicable.

Acknowledgments

This study was supported, in part, by a grant from the republic of Iraq ministry of higher education and scientific research, and the Australian Commonwealth Government through the Research Training Program (RTP) Fund.

Conflicts of Interest

The authors declare no conflict of interest.

References

  1. Eggleston, H.; Buendia, L.; Miwa, K.; Ngara, T.; Tanabe, K. 2006 IPCC Guidelines for National Greenhouse Gas Inventories; Institute for Global Environmental Strategies: Kanagawa, Japan, 2006. [Google Scholar]
  2. Bellarby, J.; Tirado, R.; Leip, A.; Weiss, F.; Lesschen, J.P.; Smith, P. Livestock greenhouse gas emissions and mitigation potential in Europe. Glob. Chang. Biol. 2012, 19, 3–18. [Google Scholar] [CrossRef]
  3. Vergé, X.; De Kimpe, C.; Desjardins, R. Agricultural production, greenhouse gas emissions and mitigation potential. Agric. For. Meteorol. 2007, 142, 255–269. [Google Scholar] [CrossRef]
  4. Rotz, C.A.; Montes, F.; Chianese, D.S. The carbon footprint of dairy production systems through partial life cycle assessment. J. Dairy Sci. 2010, 93, 1266–1282. [Google Scholar] [CrossRef] [PubMed]
  5. Larney, F.J.; Hao, X. A review of composting as a management alternative for beef cattle feedlot manure in southern Alberta, Canada. Bioresour. Technol. 2007, 98, 3221–3227. [Google Scholar] [CrossRef]
  6. Holman, D.B.; Hao, X.; Topp, E.; Yang, H.E.; Alexander, T.W. Effect of Co-Composting Cattle Manure with Construction and Demolition Waste on the Archaeal, Bacterial, and Fungal Microbiota, and on Antimicrobial Resistance Determinants. PLoS ONE 2016, 11, e0157539. [Google Scholar] [CrossRef] [Green Version]
  7. Pandey, P.K.; Biswas, S.; Vaddella, V.K.; Soupir, M.L. Escherichia coli persistence kinetics in dairy manure at moderate, mesophilic, and thermophilic temperatures under aerobic and anaerobic environments. Bioprocess Biosyst. Eng. 2015, 38, 457–467. [Google Scholar] [CrossRef]
  8. Pandey, P.; Chiu, C.; Miao, M.; Wang, Y.; Settles, M.; Del Rio, N.S.; Castillo, A.; Souza, A.; Pereira, R.; Jeannotte, R. 16S rRNA analysis of diversity of manure microbial community in dairy farm environment. PLoS ONE 2018, 13, e0190126. [Google Scholar] [CrossRef] [PubMed]
  9. Zhang, H.; Huang, T.; Chen, S. Ignored sediment fungal populations in water supply reservoirs are revealed by quantitative PCR and 454 pyrosequencing. BMC Microbiol. 2015, 15, 1–11. [Google Scholar] [CrossRef] [Green Version]
  10. Zaheer, R.; Cook, S.; Klima, C.; Stanford, K.; Alexander, T.; Topp, E.; Read, R.; Mcallister, T. Effect of subtherapeutic vs. therapeutic administration of macrolides on antimicrobial resistance in Mannheimia haemolytica and enterococci isolated from beef cattle. Front. Microbiol. 2013, 4, 133. [Google Scholar] [CrossRef] [Green Version]
  11. Vahjen, W.; Pietruszyńska, D.; Starke, I.C.; Zentek, J. High dietary zinc supplementation increases the occurrence of tetracycline and sulfonamide resistance genes in the intestine of weaned pigs. Gut Pathog. 2015, 7, 23. [Google Scholar] [CrossRef] [Green Version]
  12. Joseph, S.; Pow, D.; Dawson, K.; Mitchell, D.R.; Rawal, A.; Hook, J.; Taherymoosavi, S.; Van Zwieten, L.; Rust, J.; Donne, S.; et al. Feeding Biochar to Cows: An Innovative Solution for Improving Soil Fertility and Farm Productivity. Pedosphere 2015, 25, 666–679. [Google Scholar] [CrossRef]
  13. Winders, T.M.; Jolly-Breithaupt, M.L.; Wilson, H.C.; MacDonald, J.C.; Erickson, G.E.; Watson, A.K. Evaluation of the effects of biochar on diet digestibility and methane production from growing and finishing steers. Transl. Anim. Sci. 2019, 3, 775–783. [Google Scholar] [CrossRef] [Green Version]
  14. McHenry, M.P. Carbon-based stock feed additives: A research methodology that explores ecologically delivered C biosequestration, alongside live weights, feed use efficiency, soil nutrient retention, and perennial fodder plantations. J. Sci. Food Agric. 2010, 90, 183–187. [Google Scholar] [CrossRef] [PubMed] [Green Version]
  15. Banner, R.E.; Rogosic, J.; Burritt, E.A.; Provenza, F.D. Supplemental barley and charcoaI increase intake of sagebrush by lambs. J. Range Manag. 2000, 53, 415–420. [Google Scholar] [CrossRef]
  16. Knutson, H.J.; Carr, M.A.; Branham, L.A.; Scott, C.B.; Callaway, T.R. Effects of activated charcoal on binding E. coli O157:H7 and Salmonella typhimurium in sheep. Small Rumin. Res. 2006, 65, 101–105. [Google Scholar] [CrossRef]
  17. Rogosic, J.; Pfister, J.A.; Provenza, F.D.; Grbesa, D. The effect of activated charcoal and number of species offered on intake of Mediterranean shrubs by sheep and goats. Appl. Anim. Behav. Sci. 2006, 101, 305–317. [Google Scholar] [CrossRef]
  18. Al-Kindi, A.; Schiborra, A.; Buerkert, A.; Schlecht, E. Effects of quebracho tannin extract and activated charcoal on nutrient digestibility, digesta passage and faeces composition in goats. J. Anim. Physiol. Anim. Nutr. 2017, 101, 576–588. [Google Scholar] [CrossRef]
  19. Poage, G.W.; Scott, C.B.; Bisson, M.G.; Hartmann, S.F. Activated Charcoal Attenuates Bitterweed Toxicosis in Sheep. J. Range Manag. Arch. 2000, 53, 73–78. [Google Scholar] [CrossRef]
  20. Bisson, M.G.; Scott, C.B.; Taylor, C.A. Activated Charcoal and Experience Affect Intake of Juniper by Goats. J. Range Manag. Arch. 2001, 54, 274–278. [Google Scholar] [CrossRef]
  21. Leng, R.A.; Preston, T.R.; Inthapanya, S. Biochar reduces enteric methane and improves growth and feed conversion in local yellow cattle fed cassava root chips and fresh cassava foliage. Livest. Res. Rural. Dev. 2012, 24, 11. [Google Scholar]
  22. Lockyer, D.; Jarvis, S. The measurement of methane losses from grazing animals. Environ. Pollut. 1995, 90, 383–390. [Google Scholar] [CrossRef]
  23. McMurdie, P.J.; Holmes, S. Phyloseq: An R Package for Reproducible Interactive Analysis and Graphics of Microbiome Census Data. PLoS ONE 2013, 8, e61217. [Google Scholar] [CrossRef] [Green Version]
  24. Oksanen, J.; Blanchet, F.G.; Kindt, R.; Legendre, P.; Minchin, P.R.; O’Hara, R.B.; Simpson, G.L.; Solymos, P.; Stevens, M.H.H.; Wagner, H. Community ecology package. R Package Version 2018, 2, 2–5. [Google Scholar]
  25. Chatonnet, F.; Pignarre, A.; Sérandour, A.A.; Caron, G.; Avner, S.; Robert, N.; Kassambara, A.; Laurent, A.; Bizot, M.; Agirre, X.; et al. The hydroxymethylome of multiple myeloma identifies FAM72D as a 1q21 marker linked to proliferation. Haematologica 2020, 105, 774–783. [Google Scholar] [CrossRef] [PubMed] [Green Version]
  26. Gloor, G.B.; Macklaim, J.M.; Pawlowsky-Glahn, V.; Egozcue, J.J. Microbiome Datasets Are Compositional: And This Is Not Optional. Front. Microbiol. 2017, 8, 2224. [Google Scholar] [CrossRef] [Green Version]
  27. Swan, A.R.; Sandilands, M. Introduction to geological data analysis. In International Journal of Rock Mechanics and Mining Sciences and Geomechanics Abstracts; Elsevier: Amsterdam, The Netherlands, 1995; p. 387A. [Google Scholar]
  28. Saleem, A.M.; Ribeiro, G.O., Jr.; Yang, W.Z.; Ran, T.; Beauchemin, K.A.; McGeough, E.J.; Ominski, K.H.; Okine, E.K.; McAllister, T.A. Effect of engineered biocarbon on rumen fermentation, microbial protein synthesis, and methane production in an artificial rumen (RUSITEC) fed a high forage diet1. J. Anim. Sci. 2018, 96, 3121–3130. [Google Scholar] [CrossRef] [Green Version]
  29. Hansen, H.H.; Storm, I.M.L.D.; Sell, A.M. Effect of biochar on in vitro rumen methane production. Acta Agric. Scand. Sect. A Anim. Sci. 2012, 62, 305–309. [Google Scholar] [CrossRef]
  30. Cabeza, I.; Waterhouse, T.; Sohi, S.; Rooke, J. Effect of biochar produced from different biomass sources and at different process temperatures on methane production and ammonia concentrations in vitro. Anim. Feed. Sci. Technol. 2018, 237, 1–7. [Google Scholar] [CrossRef]
  31. Leng, R.A.; Inthapanya, S.; Preston, T.R. Methane production is reduced in an in vitro incubation when the rumen fluid is taken from cattle that previously received biochar in their diet. Gas 2012, 1050, 1367. [Google Scholar]
  32. McFarlane, Z.D.; Myer, P.R.; Cope, E.R.; Evans, N.D.; Bone, T.C.; Biss, B.E.; Mulliniks, J.T. Effect of Biochar Type and Size on in Vitro Rumen Fermentation of Orchard Grass Hay. Agric. Sci. 2017, 08, 316–325. [Google Scholar] [CrossRef] [Green Version]
  33. Baumann, E.; Chouinard, P.Y.; Lebeuf, Y.; Rico, D.E.; Gervais, R. Effect of lipid supplementation on milk odd- and branched-chain fatty acids in dairy cows. J. Dairy Sci. 2016, 99, 6311–6323. [Google Scholar] [CrossRef] [PubMed]
  34. Hill, J.; McSweeney, C.; Wright, A.D.G.; Bishop-Hurley, G.; Kalantar-Zadeh, K. Measuring Methane Production from Ruminants. Trends Biotechnol. 2016, 34, 26–35. [Google Scholar] [CrossRef] [PubMed]
  35. Kempton, T.; Murray, R.; Leng, R. Methane Production and Digestibility Measurements in the Grey Kangaroo and Sheep. Aust. J. Biol. Sci. 1976, 29, 209–214. [Google Scholar] [CrossRef] [Green Version]
  36. Torrent, J.; Johnson, D.E.; Kujawa, M.A. Co-product fiber digestibility: Kinetic and in vivo assessment. J. Anim. Sci. 1994, 72, 790–795. [Google Scholar] [CrossRef]
  37. Xie, Z.; Xu, Y.; Liu, G.; Liu, Q.; Zhu, J.; Tu, C.; Amonette, J.E.; Cadisch, G.; Yong, J.W.; Hu, S. Impact of biochar application on nitrogen nutrition of rice, greenhouse-gas emissions and soil organic carbon dynamics in two paddy soils of China. Plant Soil 2013, 370, 527–540. [Google Scholar] [CrossRef]
  38. Martin, S.L.; Clarke, M.L.; Othman, M.; Ramsden, S.J.; West, H.M. Biochar-mediated reductions in greenhouse gas emissions from soil amended with anaerobic digestates. Biomass Bioenergy 2015, 79, 39–49. [Google Scholar] [CrossRef]
  39. Lai, W.Y.; Lai, C.M.; Ke, G.R.; Chung, R.S.; Chen, C.T.; Cheng, C.H.; Pai, C.W.; Chen, S.Y.; Chen, C.C. The effects of woodchip biochar application on crop yield, carbon sequestration and greenhouse gas emissions from soils planted with rice or leaf beet. J. Taiwan Inst. Chem. Eng. 2013, 44, 1039–1044. [Google Scholar] [CrossRef]
  40. Wang, J.; Pan, X.; Liu, Y.; Zhang, X.; Xiong, Z. Effects of biochar amendment in two soils on greenhouse gas emissions and crop production. Plant Soil 2012, 360, 287–298. [Google Scholar] [CrossRef]
  41. Angst, T.E.; Six, J.; Reay, D.S.; Sohi, S.P. Impact of pine chip biochar on trace greenhouse gas emissions and soil nutrient dynamics in an annual ryegrass system in California. Agric. Ecosyst. Environ. 2014, 191, 17–26. [Google Scholar] [CrossRef]
  42. DeVore, D.W. In-vitro digestibility and gas production of by-product feedstuffs and the effects of monesin on in-vitro digestibility and gas production. Master’s Thesis, Missouri State University, Springfield, MO, USA, 2018. [Google Scholar]
  43. Dowd, S.E.; Callaway, T.R.; Wolcott, R.D.; Sun, Y.; McKeehan, T.; Hagevoort, R.G.; Edrington, T.S. Evaluation of the bacterial diversity in the feces of cattle using 16S rDNA bacterial tag-encoded FLX amplicon pyrosequencing (bTEFAP). BMC Microbiol. 2008, 8, 125. [Google Scholar] [CrossRef] [Green Version]
  44. Durso, L.M.; Harhay, G.P.; Smith, T.P.; Bono, J.L.; DeSantis, T.Z.; Clawson, M.L. Bacterial Community Analysis of Beef Cattle Feedlots Reveals That Pen Surface Is Distinct from Feces. Foodborne Pathog. Dis. 2011, 8, 647–649. [Google Scholar] [CrossRef] [Green Version]
  45. Callaway, T.R.; Dowd, S.E.; Edrington, T.S.; Anderson, R.C.; Krueger, N.; Bauer, N.; Kononoff, P.J.; Nisbet, D.J. Evaluation of bacterial diversity in the rumen and feces of cattle fed different levels of dried distillers grains plus solubles using bacterial tag-encoded FLX amplicon pyrosequencing. J. Anim. Sci. 2010, 88, 3977–3983. [Google Scholar] [CrossRef] [Green Version]
  46. Gomez-Arango, L.F.; Barrett, H.L.; McIntyre, H.D.; Callaway, L.K.; Morrison, M.; Nitert, M.D. Connections Between the Gut Microbiome and Metabolic Hormones in Early Pregnancy in Overweight and Obese Women. Diabetes 2016, 65, 2214–2223. [Google Scholar] [CrossRef] [Green Version]
  47. Tobita, T.; Manzari, M.T.; Ozutsumi, O.; Ueda, K.; Uzuoka, R.; Iai, S. Benchmark Centrifuge Tests and Analyses of Liquefaction-Induced Lateral Spreading during Earthquake; Taylor and Francis: London, UK, 2014. [Google Scholar]
  48. Bhatt, K.; Maheshwari, D.K. Decoding multifarious role of cow dung bacteria in mobilization of zinc fractions along with growth promotion of C. annuum L. Sci. Rep. 2019, 9, 1–10. [Google Scholar] [CrossRef]
  49. Poulsen, M.M.; Vestergaard, P.F.; Clasen, B.F.; Radko, Y.; Christensen, L.P.; Stødkilde-Jørgensen, H.; Møller, N.; Jessen, N.; Pedersen, S.B.; Jørgensen, J.O.L. High-Dose Resveratrol Supplementation in Obese Men: An Investigator-Initiated, Randomized, Placebo-Controlled Clinical Trial of Substrate Metabolism, Insulin Sensitivity, and Body Composition. Diabetes 2013, 62, 1186–1195. [Google Scholar] [CrossRef] [Green Version]
  50. Zhou, J.; Park, C.Y.; Theesfeld, C.L.; Wong, A.K.; Yuan, Y.; Scheckel, C.; Fak, J.J.; Funk, J.; Yao, K.; Tajima, Y.; et al. Whole-genome deep-learning analysis identifies contribution of noncoding mutations to autism risk. Nat. Genet. 2019, 51, 973–980. [Google Scholar] [CrossRef] [Green Version]
  51. Kumar, S.; Indugu, N.; Vecchiarelli, B.; Pitta, D.W. Associative patterns among anaerobic fungi, methanogenic archaea, and bacterial communities in response to changes in diet and age in the rumen of dairy cows. Front. Microbiol. 2015, 6, 781. [Google Scholar] [CrossRef] [Green Version]
  52. Godon, J.J.; Zumstein, E.; Dabert, P.; Habouzit, F.; Moletta, R. Molecular microbial diversity of an anaerobic digestor as determined by small-subunit rDNA sequence analysis. Appl. Environ. Microbiol. 1997, 63, 2802–2813. [Google Scholar] [CrossRef] [Green Version]
  53. Singh, K.; Pandya, P.; Parnerkar, S.; Tripathi, A.; Rank, D.; Kothari, R.; Joshi, C. Molecular Identification of Methanogenic Archaea From Surti Buffaloes (Bubalus Bubalis), Reveals More Hydrogenotrophic Methanogens Phylotypes. Braz. J. Microbiol. 2011, 42, 132–139. [Google Scholar] [CrossRef] [Green Version]
  54. Singh, K.; Tripathi, A.; Pandya, P.; Parnerkar, S.; Rank, D.; Kothari, R.; Joshi, C. Methanogen diversity in the rumen of Indian Surti buffalo (Bubalus bubalis), assessed by 16S rDNA analysis. Res. Veter. Sci. 2012, 92, 451–455. [Google Scholar] [CrossRef]
  55. Zhang, M.; Li, J.; Wang, Y.; Yang, C. Impacts of different biochar types on the anaerobic digestion of sewage sludge. RSC Adv. 2019, 9, 42375–42386. [Google Scholar] [CrossRef] [Green Version]
  56. Huang, Y.; Wang, C.; Lin, C.; Zhang, Y.; Chen, X.; Tang, L.; Liu, C.; Chen, Q.; Onwuka, M.I.; Song, T. Methane and Nitrous Oxide Flux after Biochar Application in Subtropical Acidic Paddy Soils under Tobacco-Rice Rotation. Sci. Rep. 2019, 9, 17277. [Google Scholar] [CrossRef] [PubMed] [Green Version]
  57. Liu, R.; Wu, D.; Feng, X.; Müllen, K. Nitrogen-Doped Ordered Mesoporous Graphitic Arrays with High Electrocatalytic Activity for Oxygen Reduction. Angew. Chem. 2010, 122, 2619–2623. [Google Scholar] [CrossRef]
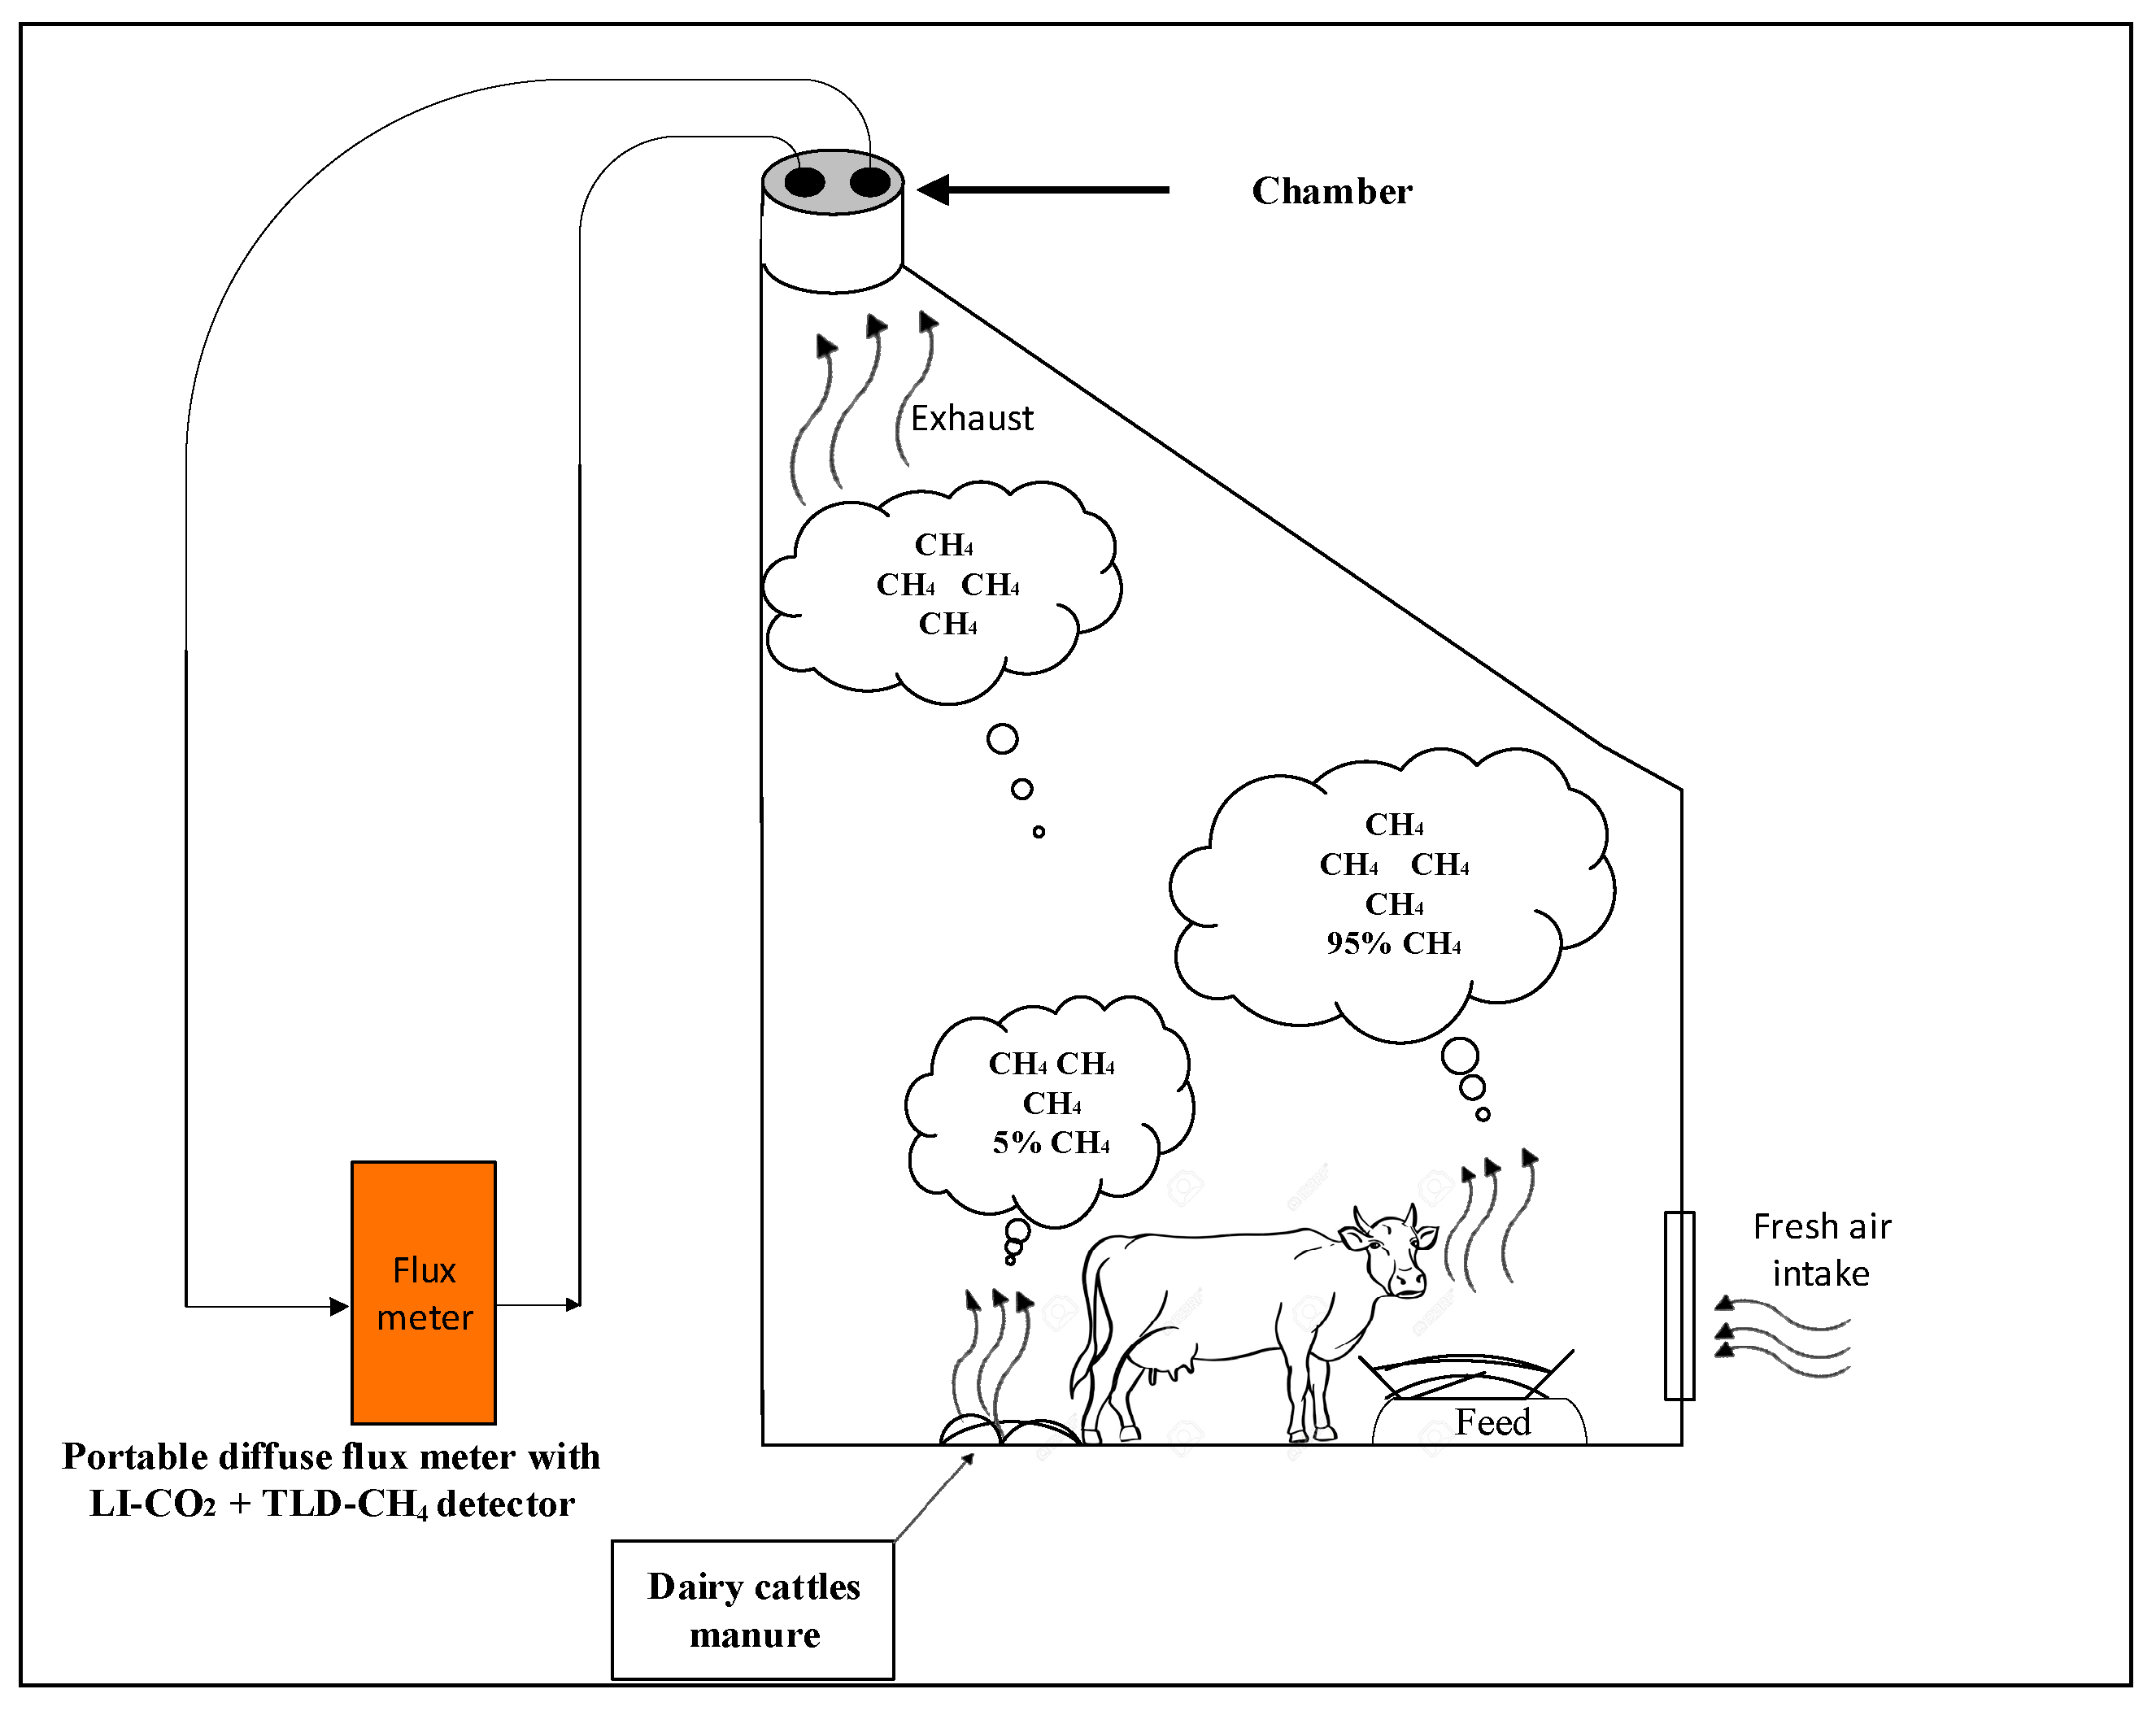
Figure 1. Measuring GHG emissions from milking area by flux meter with the LI-CO2 and TLD-CH4 detector.
Sustainability 13 08254 g001
Figure 2. (a) Effect of PAC on daily milk production (kg), (b) milk protein and fat (%).
Sustainability 13 08254 g002
Figure 3. (a) Effect of PAC concentrations on the CH4 emissions and (b) effect of interaction between PAC, period and terms on the CH4 emissions. Polynomial (Poly), Term one: First test (four weeks); Term two: Second test (four weeks). (c) Overall effect of PAC concentrations on the CH4 emissions before, during and after milking.
Sustainability 13 08254 g003aSustainability 13 08254 g003b
Figure 4. (a) Effect of PAC concentrations on the CO2 emissions and (b) effect of interaction between PAC, period and terms on the CO2 emissions. Polynormial (Poly), Term one: First test (four weeks); Term two: Second test (four weeks).
Sustainability 13 08254 g004
Figure 5. (a) Effect of PAC concentrations on the CH4 emissions from manure and (b) Effect of interaction between PAC and terms on the CH4 emissions from manure. Term one: First test (four weeks), Term two: Second test (four weeks). (*) means the interactions between PAC and Term.
Sustainability 13 08254 g005
Figure 6. (a) Effect of PAC concentrations on the CO2 emissions and (b) Effect of interaction between PAC and terms on the CO2 emissions, from the manure dairy cattle manure. Term one: First test (four weeks); Term two: Second test (four weeks). (*) means the interactions between PAC and Term.
Sustainability 13 08254 g006
Figure 7. Sequencing and classification of microbiota with and without PAC additions.
Sustainability 13 08254 g007
Figure 8. (a) Average pre of microbial community and (b) average post of microbial community.
Sustainability 13 08254 g008
Figure 9. (a) Average pre-PAC of microbial community (minor phyla) and (b) aAverage postPAC of microbial community (minor phyla).
Sustainability 13 08254 g009
Figure 10. (a) Methanogen Species in the control diet (no PAC) and (b) methanogen Species in a diet supplemented with 0.5% PAC.
Sustainability 13 08254 g010
Figure 11. Alpha diversity calculations on a rarefaction dataset (7814 sequences per sample).
Sustainability 13 08254 g011
Figure 12. Overall microbiota composition difference between treatments (a) with and (b) without PAC addition.
Sustainability 13 08254 g012
Table 1. Ingredient dairy cattle diet.
IngredientAs FedDry Matter at 89%
Total Crude Protein (minimum)16.0%18.0%
Crude Protein (minimum)13.1%14.7%
Equivalent Crude Protein (maximum)2.9%3.2%
Urea (maximum)1.0%1.1%
Crude Fibre (maximum)12.0%13.5%
Crude Fat (minimum)1.5%1.7%
Calcium (minimum)1.0%1.1%
Phosphorus (minimum)0.5%0.56%
Magnesium (minimum)0.4%0.45%
Salt (maximum added)0.5%0.56%
Copper (added)45 mg/kg50 mg/kg
Zinc (added)150 mg/kg170 mg/kg
Table 2. Effect of PAC on the chemical compound of dairy cattle’s manure.
Items0% PAC0.5% PACp-Value
Dry matter88.5689.110.001
Organic matter77.778.620.02
Ash22.321.370.02
Curd protein13.1110.370.001
NDF%43.1543.060.10
ADF%26.5628.340.001
Lignin%9.638.990.1
Publisher’s Note: MDPI stays neutral with regard to jurisdictional claims in published maps and institutional affiliations.