
D-distance Risk Factor for Transmission Line Maintenance Management and Cost Analysis


Abstract
:1. Introduction
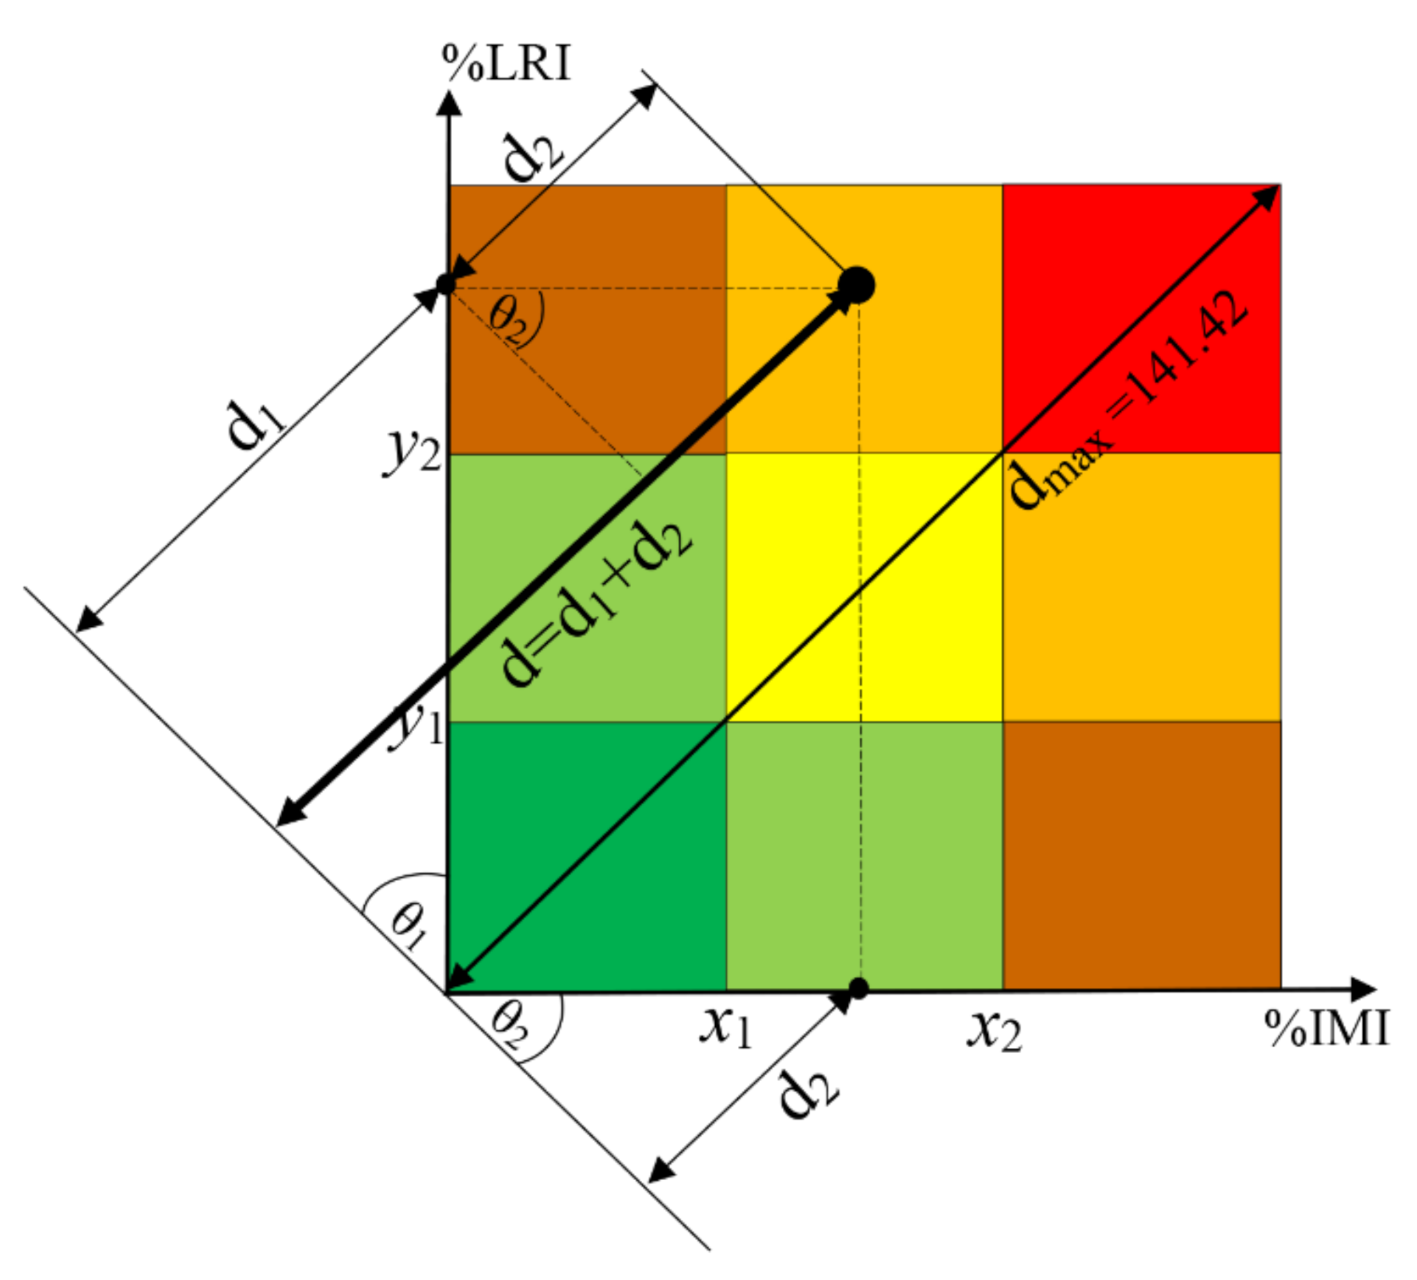
2. D-distance Risk Factor
3. Condition Assessment

4. Importance Assessment

| Criteria | Score Sm from 0 to 4 | %Wm | ||||
|---|---|---|---|---|---|---|
| Very Low (0) | Low (1) | Moderate (2) | High (3) | Very High (4) | ||
| percentage line loading (MVA) | 0–20 | 21–30 | 31–40 | 41–50 | >50 | 14 |
| system usage | no tie line | radial line | tie line/rapid load shedding/generator connected | 11 | ||
| voltage level (kV) | ≤115 | 230 | 500/300 DC | 5 | ||
| contingency analysis | non | N-2 | N-1 | 10 | ||
| statistically failure (event/year) | 0 | 1–5 | 6–10 | >10 | 6 | |
| age (years) | 10–0 | 20–11 | 25–21 | 30–26 | >30 | 32 |
| public image | normal province | industrial estate/big province/tourist/business area | 7 | |||
| pollution (>20% of total length) | rice field/ agricultural area | plant burn/firing | bird droppings | coastal area/ industrial estate | 5 | |
| human impact | normal line | compact line | 10 | |||
5. Cost Analysis
6. Results and Discussion
6.1. Risk Analysis
6.2. Cost Analysis
7. Conclusions
Author Contributions
Funding
Institutional Review Board Statement
Informed Consent Statement
Data Availability Statement
Acknowledgments
Conflicts of Interest
References
- Guo, Y.; Chen, R.; Shi, J.; Wan, J.; Yi, H.; Zhong, J. Determination of the power transmission line ageing failure probability due to the impact of forest fire. IET Gener. Transm. Distrib. 2018, 12, 3812–3819. [Google Scholar] [CrossRef]
- Teh, J. Uncertainty analysis of transmission line end-of-life failure model for bulk electric system reliability studies. IEEE Trans. Reliab. 2018, 67, 1261–1268. [Google Scholar] [CrossRef]
- Teh, J.; Lai, C.M.; Cheng, Y.H. Impact of the real-time thermal loading on the bulk electric system reliability. IEEE Trans. Reliab. 2017, 66, 1110–1119. [Google Scholar] [CrossRef]
- Montanari, G.C.; Seri, P.; Dissado, L.A. Aging mechanisms of polymeric materials under DC electrical stress: A new approach and similarities to mechanical aging. IEEE Trans. Dielectr. Electr. Insul. 2019, 26, 634–641. [Google Scholar] [CrossRef]
- Cigre: WG C1.16. Transmission Asset Risk Management. Cigre Technical Brochures. Reference: 422; Paris, France, 2010.
- Khuntia, S.R.; Rueda, J.L.; Bouwman, S.; Van der Meijden, M.A.M.M. A literature survey on asset management in electrical power [transmission and distribution] system. Int. Trans. Electr. Energy Syst. 2016, 26, 2123–2133. [Google Scholar] [CrossRef] [Green Version]
- Heo, J.H.; Kim, M.K.; Kim, D.; Lyu, J.K.; Kang, Y.C.; Park, J.K. Priority index of overhead transmission lines for reliability centered approach. J. Electr. Eng. Technol. 2014, 9, 1248–1257. [Google Scholar] [CrossRef] [Green Version]
- Liu, Y.; Xv, J.; Yuan, H.; Lv, J.; Ma, Z. Health assessment and prediction of overhead line based on health index. IEEE Trans. Ind. Electron. 2019, 66, 5546–5557. [Google Scholar] [CrossRef]
- Khoddam, M.; Sadeh, J.; Pourmohamadiyan, P. Performance evaluation of circuit breaker electrical contact based on dynamic resistance signature and using health index. IEEE Trans. Compon. Pack. Manuf. Technol. 2016, 6, 1505–1512. [Google Scholar] [CrossRef]
- Hashim, R.; Usman, F.; Baharuddin, I.N.Z. Determining health index of transmission line asset using condition-based method. Resources 2019, 8, 80. [Google Scholar] [CrossRef] [Green Version]
- Chojnacki, A.L. Assessment of the risk of damage to 110 kV overhead lines due to wind. Energies 2021, 14, 556. [Google Scholar] [CrossRef]
- Chen, W.; Zhou, W.; Zhou, E.; Xiang, Z.; Zhou, W.; Lu, J. Wildfire Risk Assessment of Transmission-Line Corridors Based on Naïve Bayes Network and Remote Sensing Data. Sensors 2021, 21, 634. [Google Scholar] [CrossRef]
- Teh, J.; Lai, C.-M. Risk-based management of transmission lines enhanced with the dynamic thermal rating system. IEEE Access 2019, 7, 76562–76572. [Google Scholar] [CrossRef]
- Lijuan, C.; Li, L.; Yan, P.; Wenjin, C.; Hongyang, H.; Tiantian, W.; Xiaohui, X. Distribution network operational risk assessment and early warning considering multi-risk factors. IET Gener. Transm. Distrib. 2020, 14, 3139–3149. [Google Scholar]
- Lei, G.; Qiwei, Q.; Jian, L.; Yu, Z.; Linglei, J. Power transmission risk assessment considering component condition. J. Mod. Power Syst. Clean Energy 2014, 2, 50–58. [Google Scholar]
- Zhang, D.; Li, W.; Xiong, X. Overhead line preventive maintenance strategy based on condition monitoring and system reliability assessment. IEEE Trans. Power Syst. 2014, 29, 1839–1846. [Google Scholar] [CrossRef]
- Piana, E.A.; Bignucolo, F.; Donini, A.; Spezie, R. Maintenance of a high-voltage overhead transmission line: Sustainability and noise impact assessment. Sustainability 2018, 10, 491. [Google Scholar] [CrossRef] [Green Version]
- Zhong, J.; Li, W.; Wang, C.; Yu, J.; Xu, R. Determining optimal inspection intervals in maintenance considering equipment aging failures. IEEE Trans. Power Syst. 2017, 32, 1474–1482. [Google Scholar] [CrossRef]
- Adami, J.; Silveira, P.; Martinez, M.; Perez, R.; Dallbello, A.C. New approach to improve high-voltage transmission line reliability. IEEE Trans. Power Deliv. 2009, 24, 1515–1520. [Google Scholar] [CrossRef]
- Heydt, G.T. A probabilistic cost/benefit analysis of transmission and distribution asset expansion projects. IEEE Trans. Power Syst. 2017, 32, 4151–4152. [Google Scholar] [CrossRef]
- Lima, R.M.; Osis, R.; Queiroz, A.R.D.; Santos, A.H.M. Least-cost path analysis and multi-criteria assessment for routing electricity transmission lines. IET Gener. Transm. Distrib. 2016, 10, 4222–4230. [Google Scholar] [CrossRef]
- Gharakheili, M.A.; Fotuhi-Firuzabad, M.; Dehghanian, P. A new multiattribute decision making support tool for identifying critical components in power transmission systems. IEEE Syst. J. 2018, 12, 316–327. [Google Scholar] [CrossRef]
- Eskom Power Series. The Planning, Design and Construction of Overhead Power Lines; Eskom: Johannesburg, South Africa, 2005; Volume 1. [Google Scholar]
- Eskom Power Series. The Fundamentals and Practice of Overhead Line Maintenance; Eskom: Johannesburg, South Africa, 2005; Volume 2. [Google Scholar]
- Cigre: WG B2.03. Guide for the assessment of old cap & pin and long-rod transmission line insulators made of porcelain or glass: What to check and when to replace? Cigre Technical Brochure. Reference: 306; Paris, France, 2006.
- Chen, C.; Jia, Z.; Ye, W.; Guan, Z.; Li, Y. Condition assessment strategies of composite insulator based on statistic methods. IEEE Trans. Dielectr. Electr. Insul. 2016, 23, 3231–3241. [Google Scholar] [CrossRef]
- Tzimas, A.; Silva, E.D.; Rowland, S.M.; Boumecid, B.; Queen, M.; Michel, M. Asset management frameworks for outdoor composite insulators. IEEE Trans. Dielectr. Electr. Insul. 2012, 19, 2044–2054. [Google Scholar] [CrossRef]
- Suwanasri, T. Program development for condition and importance evaluation of transmission line. Final Research Report, 2018.
- Montanari, G.C.; Hebner, R.; Morshuis, P.; Seri, P. An approach to insulation condition monitoring and life assessment in emerging electrical environments. IEEE Trans. Power Deliv. 2019, 34, 1357–1364. [Google Scholar] [CrossRef]
- Moradkhani, A.; Haghifam, M.R.; Mohammadzadeh, M. Failure rate modelling of electric distribution overhead lines considering preventive maintenance. IET Gener. Transm. Distrib. 2014, 8, 1028–1038. [Google Scholar] [CrossRef]
- Narayanan, V.J.; Sivakumar, M.; Karpagavani, K.; Chandrasekar, S. Prediction of flashover and pollution severity of high voltage transmission line insulators using wavelet transform and fuzzy C-means approach. J. Electr. Eng. Technol. 2014, 9, 1677–1685. [Google Scholar] [CrossRef]
- Saaty, T.L.; Vargas, L.G. Models, Methods, Concept and Applications of the Analytic Hierarchy Process, 2nd ed.; Springer: New York, NY, USA, 2012. [Google Scholar]
- Tanaka, H.; Tsukao, S.; Yamashita, D.; Niimura, T.; Yokoyama, R. Multiple criteria assessment of substation conditions by pair-wise comparison of analytic hierarchy process. IEEE Trans. Power Deliv. 2010, 25, 3017–3023. [Google Scholar] [CrossRef]
- Leccesea, F.; Salvadoria, G.; Roccaa, M.; Burattib, C.; Bellonib, E. A method to assess lighting quality in educational rooms using analytic hierarchy process. Build. Environ. 2020, 168, 106501. [Google Scholar] [CrossRef]
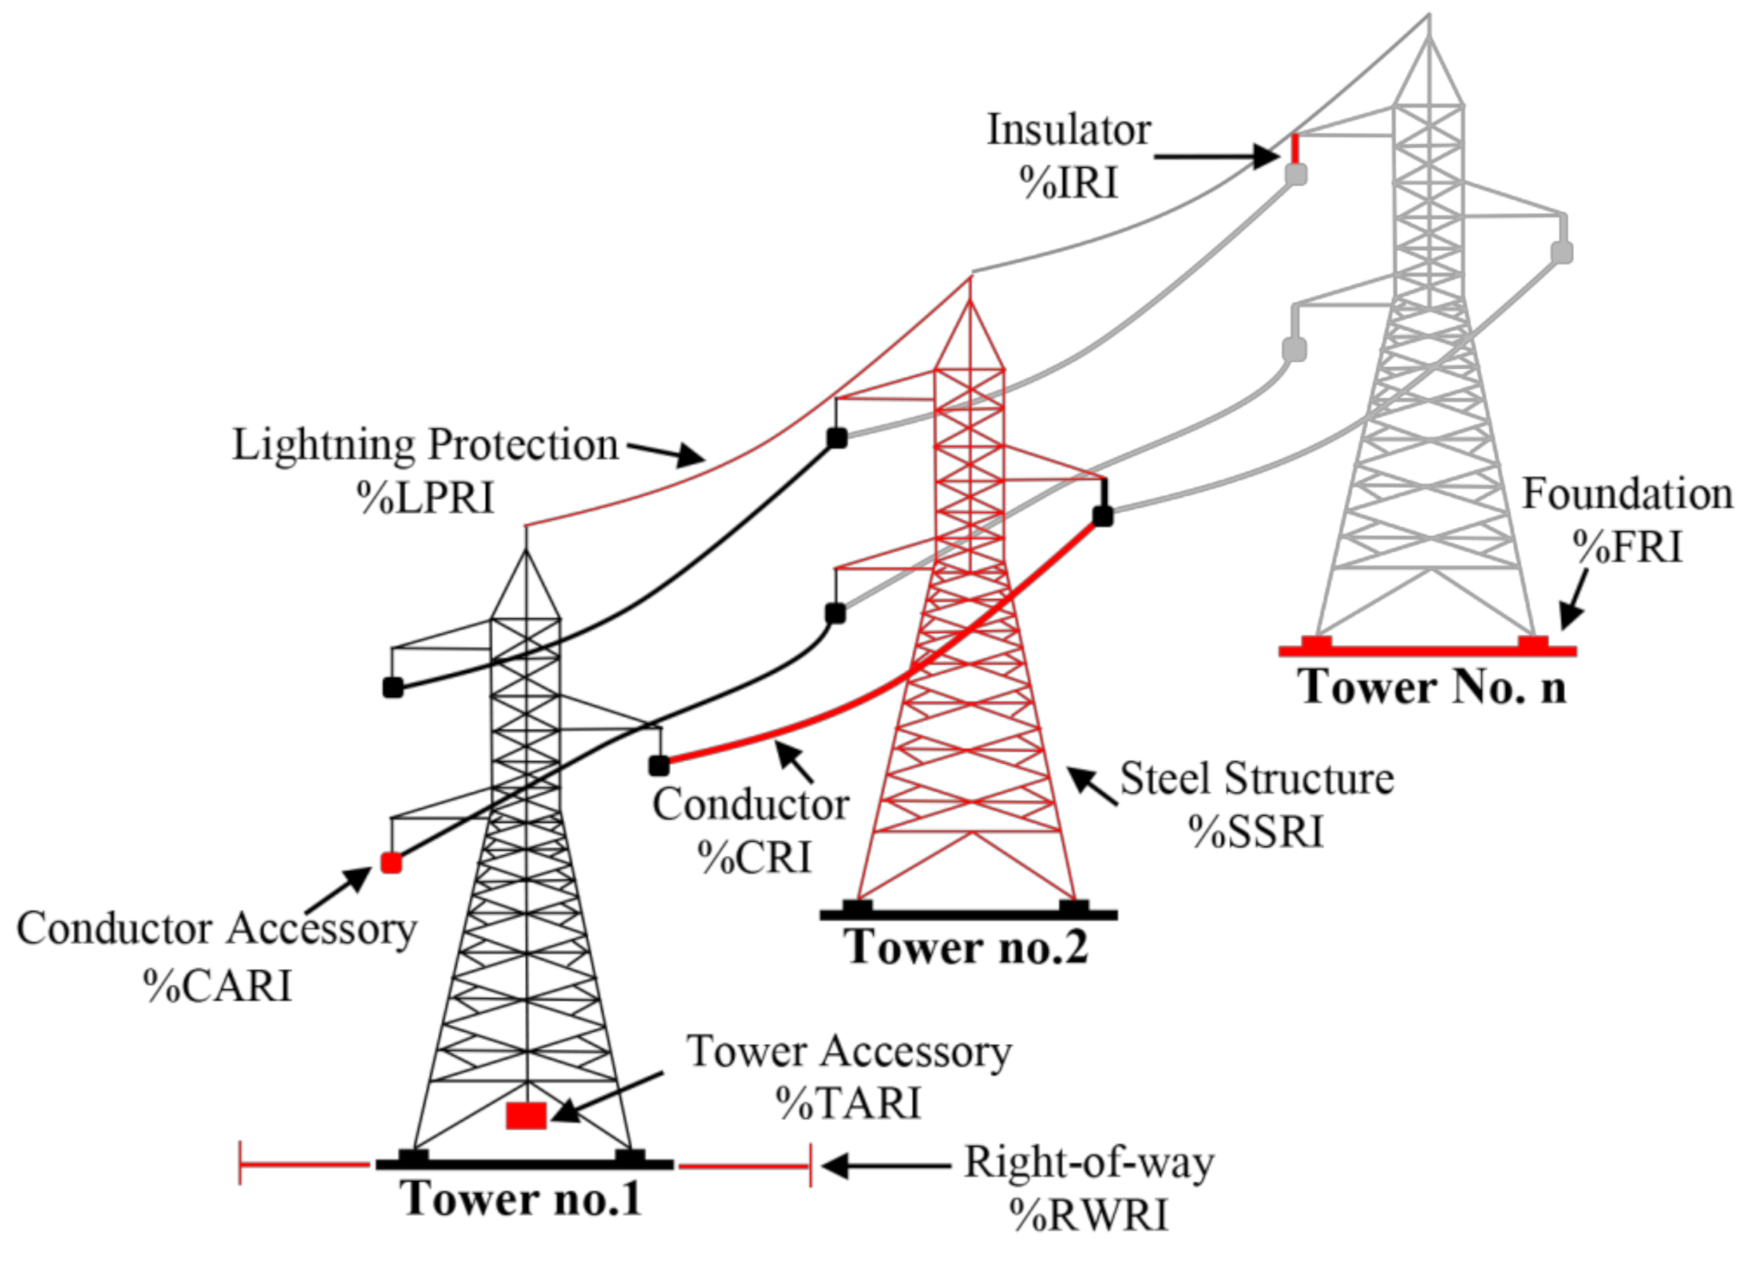

| Group | Component | %LRI | Sub-Component |
|---|---|---|---|
| 1 | conductor | %CRI | conductor |
| 2 | conductor accessory | %CARI | joint, compression dead end, damper, spacer, parallel glove clamp (PGC) |
| 3 | insulator | %IRI | insulator |
| 4 | steel structure | %SSRI | steel structure, anchor and guy |
| 5 | foundation | %FRI | concrete foundation, grillage foundation, stub |
| 6 | lightning protection | %LPRI | overhead/optical ground wire and fittings, marker ball, grounding system |
| 7 | tower accessory | %TARI | danger sign, tower number sign, phase plate |
| 8 | right-of-way | %RWRI | right-of-way |
| Testing Method | %Wi | %Si | %Wi × %Si | %CRI |
|---|---|---|---|---|
| visual inspection | 25 | 5 | 125 | 75% |
| loss of zinc | 25 | 3 | 75 | |
| loss of tensile strength | 25 | 4 | 100 | |
| torsional ductility | 25 | 3 | 75 |
| Tower | Component | %RIj | %Wj | %TRI#1 |
|---|---|---|---|---|
| Tower#1 | conductor | %CRI = 75% | 25.31 | 63.45% |
| conductor accessory | %CARI = 40% | 2.91 | ||
| insulator | %IRI = 24.62% | 10.48 | ||
| steel structure | %SSRI = 80% | 15.48 | ||
| foundation | %FRI = 90% | 19.06 | ||
| lightning protection | %LPRI = 18.82% | 16.89 | ||
| tower accessory | %TARI = 40% | 3.10 | ||
| right-of-way | %RWRI = 100% | 6.77 |
| Line | Component | %RIavg,l | Wl | %LRI |
|---|---|---|---|---|
| 115 kV TL#1 | conductor | %CRIavg = 62.89% | 25.31 | 63.45% |
| conductor accessory | %CARIavg = 40% | 2.91 | ||
| insulator | %IRIavg = 24.62% | 10.48 | ||
| steel structure | %SSRIavg = 77.86% | 15.48 | ||
| foundation | %FRIavg = 96.99% | 19.06 | ||
| lightning protection | %LPRIavg = 39.59% | 16.89 | ||
| tower accessory | %TARIavg = 31.07 | 3.10 | ||
| right-of-way | %RWRIavg = 94.17 | 6.77 |
| Importance Criteria | Data | Sm | %Wm | Sm × Wm | %IMI |
|---|---|---|---|---|---|
| loading percentage system usage | 58.6 | 2 | 14 | 28 | 67.75% |
| tie line | 4 | 11 | 44 | ||
| voltage level | 115 kV | 1 | 5 | 5 | |
| contingency analysis | non | 0 | 10 | 0 | |
| failure record | 6 event/year | 3 | 6 | 18 | |
| age | 31 years | 4 | 32 | 128 | |
| social aspects | big province | 4 | 7 | 28 | |
| pollution | plant burn/firing | 2 | 5 | 10 | |
| human impact | normal line | 1 | 10 | 10 |
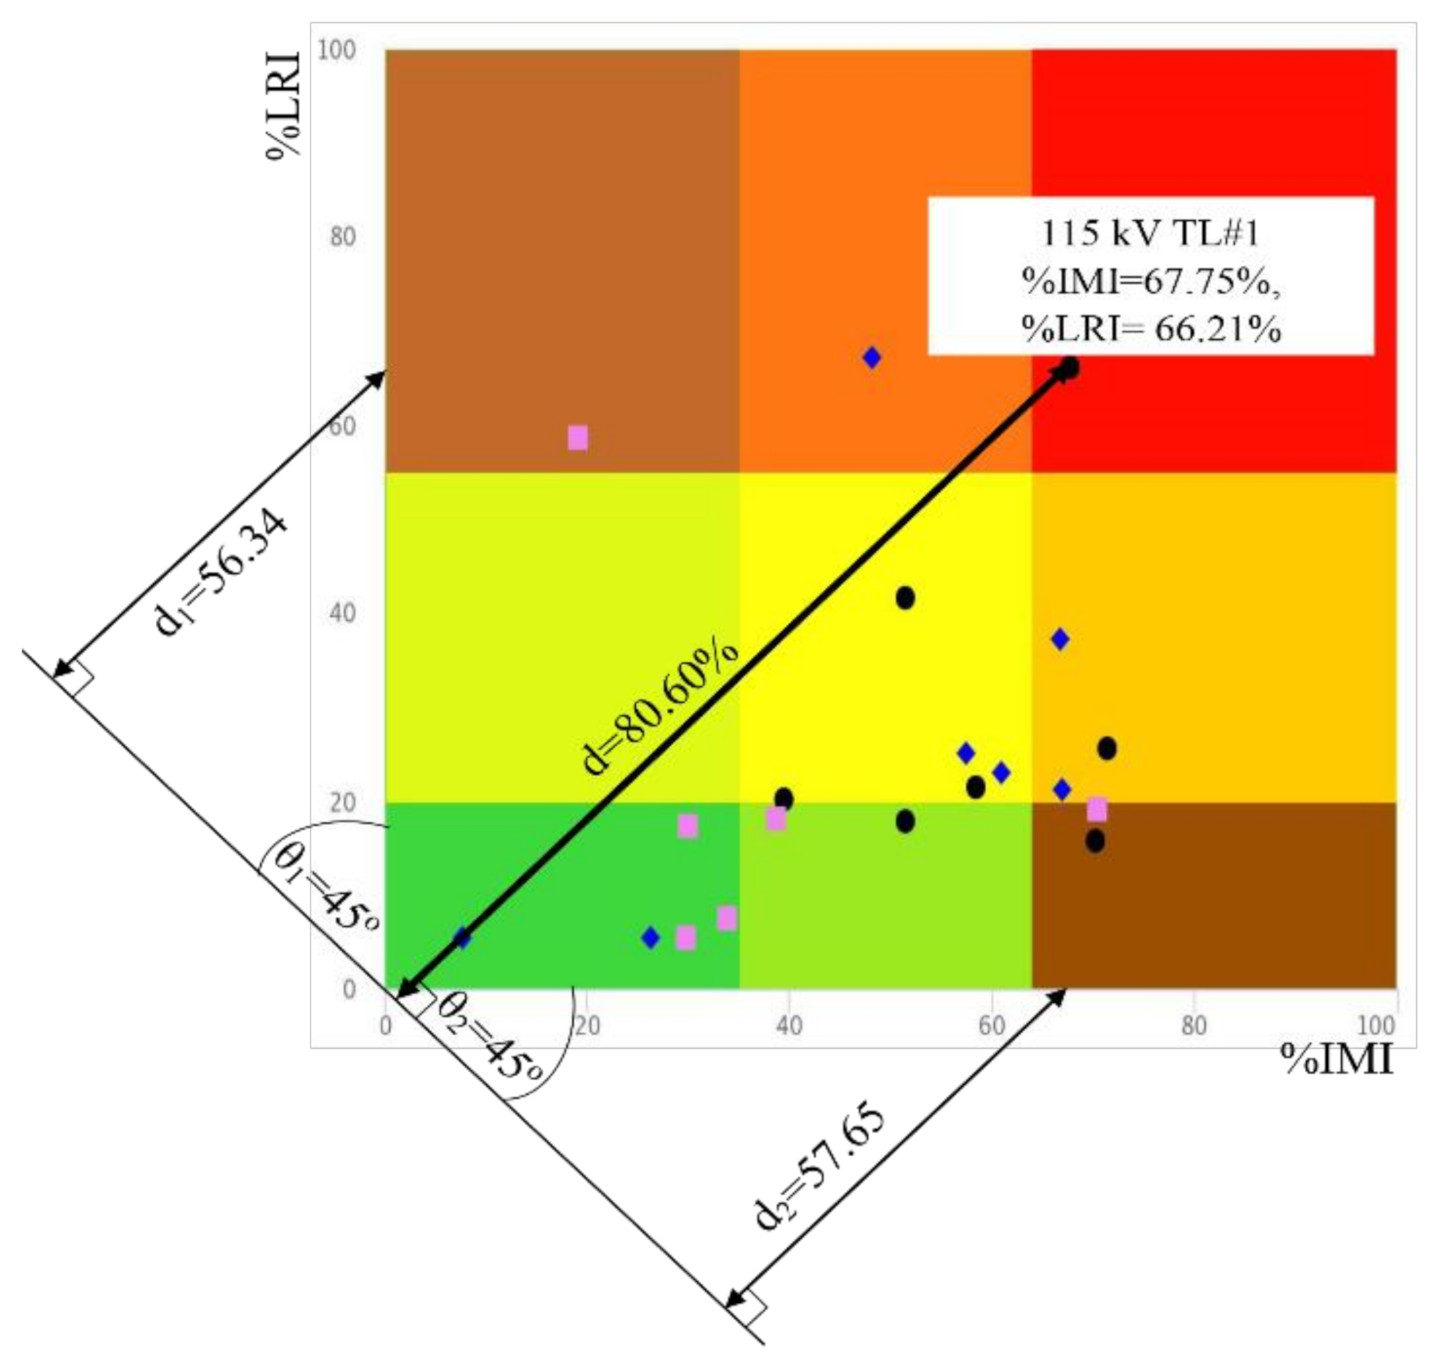
| HVTL’s Name | Age (y) | %LRI | %IMI | %D-distance |
|---|---|---|---|---|
| 115 kV TL#1 | 51 | 66.21 | 67.75 | 80.60 |
| 115 kV TL#2 | 28 | 20.06 | 39.50 | 35.84 |
| 115 kV TL#3 | 30 | 17.92 | 51.50 | 41.77 |
| 115 kV TL#4 | 32 | 15.78 | 70.25 | 51.76 |
| 115 kV TL#5 | 50 | 41.52 | 51.50 | 55.97 |
| 115 kV TL#6 | 30 | 21.44 | 58.50 | 48.10 |
| 115 kV TL#7 | 39 | 25.64 | 71.50 | 58.45 |
| 230 kV TL#8 | 55 | 37.17 | 66.75 | 62.53 |
| 230 kV TL#9 | 21 | 5.46 | 26.25 | 19.08 |
| 230 kV TL#10 | 35 | 25.01 | 57.50 | 49.65 |
| 230 kV TL#11 | 30 | 21.06 | 67.00 | 52.98 |
| 230 kV TL#12 | 43 | 67.18 | 48.25 | 69.45 |
| 230 kV TL#13 | 2 | 5.46 | 7.75 | 7.95 |
| 230 kV TL#14 | 26 | 22.94 | 61.00 | 50.51 |
| 500 kV TL#15 | 20 | 7.51 | 33.75 | 24.83 |
| 500 kV TL#16 | 28 | 58.59 | 19.10 | 46.74 |
| 500 kV TL#17 | 19 | 19.10 | 70.50 | 53.91 |
| 500 kV TL#18 | 36 | 18.12 | 38.75 | 34.22 |
| 500 kV TL#19 | 13 | 5.49 | 29.75 | 21.20 |
| 500 kV TL#20 | 26 | 17.25 | 30.00 | 28.43 |
| %D-distance | Risk | Requirements | Suggested Action |
|---|---|---|---|
| >80.1 | very high | 1st priority | urgent action |
| 60.1–80 | high | 2nd priority | short-term planning |
| 30.1–60 | medium | 3rd priority | medium-term planning |
| 0–30 | low | 4th priority | long-term planning |
| Group | 115 kV | 230 kV | 500 kV | |||
|---|---|---|---|---|---|---|
| EQC | MC | EQC | MC | EQC | MC | |
| conductor | 508 | 43 | 900 | 50 | 1500 | 100 |
| conductor accessory | 65.5 | 35 | 67.5 | 40 | 120 | 70 |
| insulator | 50.18 | 130 | 72 | 150 | 100 | 200 |
| steel structure | 1600 | 100 | 1800 | 114 | 2600 | 2300 |
| foundation | 600 | 95 | 750 | 100 | 1000 | 200 |
| lightning protection | 130 | 35 | 150 | 40 | 300 | 100 |
| tower accessory | 4.8 | 4.8 | 5 | 5 | 10 | 10 |
| right-of-way | 15 | 15 | 18 | 18 | 25 | 25 |
| sum | 2973.48 | 457.8 | 3762.5 | 517 | 5655 | 3005 |
| total maintenance cost (EQC + MC) | 3431.28 | 4279.5 | 8660 | |||
| HVTL Information | 115 kV | 230 kV | 500 kV | |||
| investment of new line (THB/km) ACSR conductor, double circuit | 3508.28 2 × 795 MCM | 4285.06 2 × 1272 MCM | 10,949.71 4 × 1272 MCM | |||
| inflation rate: IR (%) | 3 | 3 | 3 | |||
| demand of sale: DS (MW) | 100 | 100 | 100 | |||
| down time: DT (hrs) | 3 | 4 | 5 | |||
| electricity rate: ER (THB/kWh) | 2.977 | 2.513 | 2.479 | |||
| loss of penalty fee: LPF (THB/kW) | 0.5 | 0.7 | 0.9 | |||
| %D | Age | Line | kV | RPC | AMC | LSC | LRC | TC |
|---|---|---|---|---|---|---|---|---|
| 7.95 | 2 | #13 | 230 | 299.05 | 41.09 | 79.90 | 5.56 | 425.61 |
| 19.08 | 21 | #9 | 230 | 717.86 | 98.64 | 191.79 | 13.36 | 1021.65 |
| 21.20 | 13 | #19 | 500 | 1199.05 | 637.16 | 262.82 | 19.08 | 2118.11 |
| 24.83 | 20 | #15 | 500 | 1403.88 | 746.01 | 307.71 | 22.34 | 2479.95 |
| 28.43 | 26 | #20 | 500 | 1607.70 | 854.31 | 352.39 | 25.59 | 2839.98 |
| 34.22 | 36 | #18 | 500 | 1935.02 | 1028.25 | 424.13 | 30.80 | 3418.19 |
| 35.84 | 28 | #2 | 115 | 1065.59 | 164.06 | 320.06 | 17.92 | 1567.62 |
| 41.77 | 30 | #3 | 115 | 1241.99 | 191.22 | 373.04 | 20.88 | 1827.13 |
| 46.74 | 28 | #16 | 500 | 2643.43 | 1404.69 | 579.404 | 42.07 | 4669.59 |
| 48.10 | 30 | #6 | 115 | 1430.21 | 220.20 | 432.89 | 24.05 | 2107.34 |
| 49.65 | 35 | #10 | 230 | 1867.90 | 256.67 | 499.03 | 34.75 | 2658.34 |
| 50.51 | 26 | #14 | 230 | 1900.27 | 261.11 | 507.68 | 35.35 | 2704.42 |
| 51.76 | 32 | #4 | 115 | 1539.16 | 236.97 | 462.30 | 25.88 | 2264.31 |
| 52.98 | 30 | #11 | 230 | 1993.54 | 273.93 | 532.60 | 37.09 | 2837.16 |
| 53.91 | 19 | #17 | 500 | 3048.67 | 1620.03 | 668.23 | 48.52 | 5385.44 |
| 55.97 | 50 | #5 | 115 | 1664.22 | 256.23 | 499.86 | 27.98 | 2448.29 |
| 58.45 | 39 | #7 | 115 | 1737.93 | 267.57 | 522.00 | 29.22 | 2556.73 |
| 62.53 | 55 | #8 | 230 | 2352.58 | 323.27 | 628.52 | 43.77 | 3348.14 |
| 69.45 | 43 | #12 | 230 | 2613.15 | 359.07 | 698.14 | 48.62 | 3718.98 |
| 80.60 | 51 | #1 | 115 | 2396.68 | 368.99 | 719.85 | 40.30 | 3525.83 |
Publisher’s Note: MDPI stays neutral with regard to jurisdictional claims in published maps and institutional affiliations. |
© 2021 by the authors. Licensee MDPI, Basel, Switzerland. This article is an open access article distributed under the terms and conditions of the Creative Commons Attribution (CC BY) license (https://creativecommons.org/licenses/by/4.0/).
Share and Cite
Luejai, W.; Suwanasri, T.; Suwanasri, C. D-distance Risk Factor for Transmission Line Maintenance Management and Cost Analysis. Sustainability 2021, 13, 8208. https://doi.org/10.3390/su13158208
Luejai W, Suwanasri T, Suwanasri C. D-distance Risk Factor for Transmission Line Maintenance Management and Cost Analysis. Sustainability. 2021; 13(15):8208. https://doi.org/10.3390/su13158208
Chicago/Turabian StyleLuejai, Waraporn, Thanapong Suwanasri, and Cattareeya Suwanasri. 2021. "D-distance Risk Factor for Transmission Line Maintenance Management and Cost Analysis" Sustainability 13, no. 15: 8208. https://doi.org/10.3390/su13158208
APA StyleLuejai, W., Suwanasri, T., & Suwanasri, C. (2021). D-distance Risk Factor for Transmission Line Maintenance Management and Cost Analysis. Sustainability, 13(15), 8208. https://doi.org/10.3390/su13158208