
Surface Activity of Humic Acid and Its Sub-Fractions from Forest Soil

 ,
, 
Abstract
:1. Introduction
2. Materials and Methods
2.1. Isolation and Purification of HA and Its Sub-Fractions
2.2. Surface Tension Measurements
2.3. DLS and Zeta Potential Methodology
2.4. Gaussian Distribution Model
3. Results
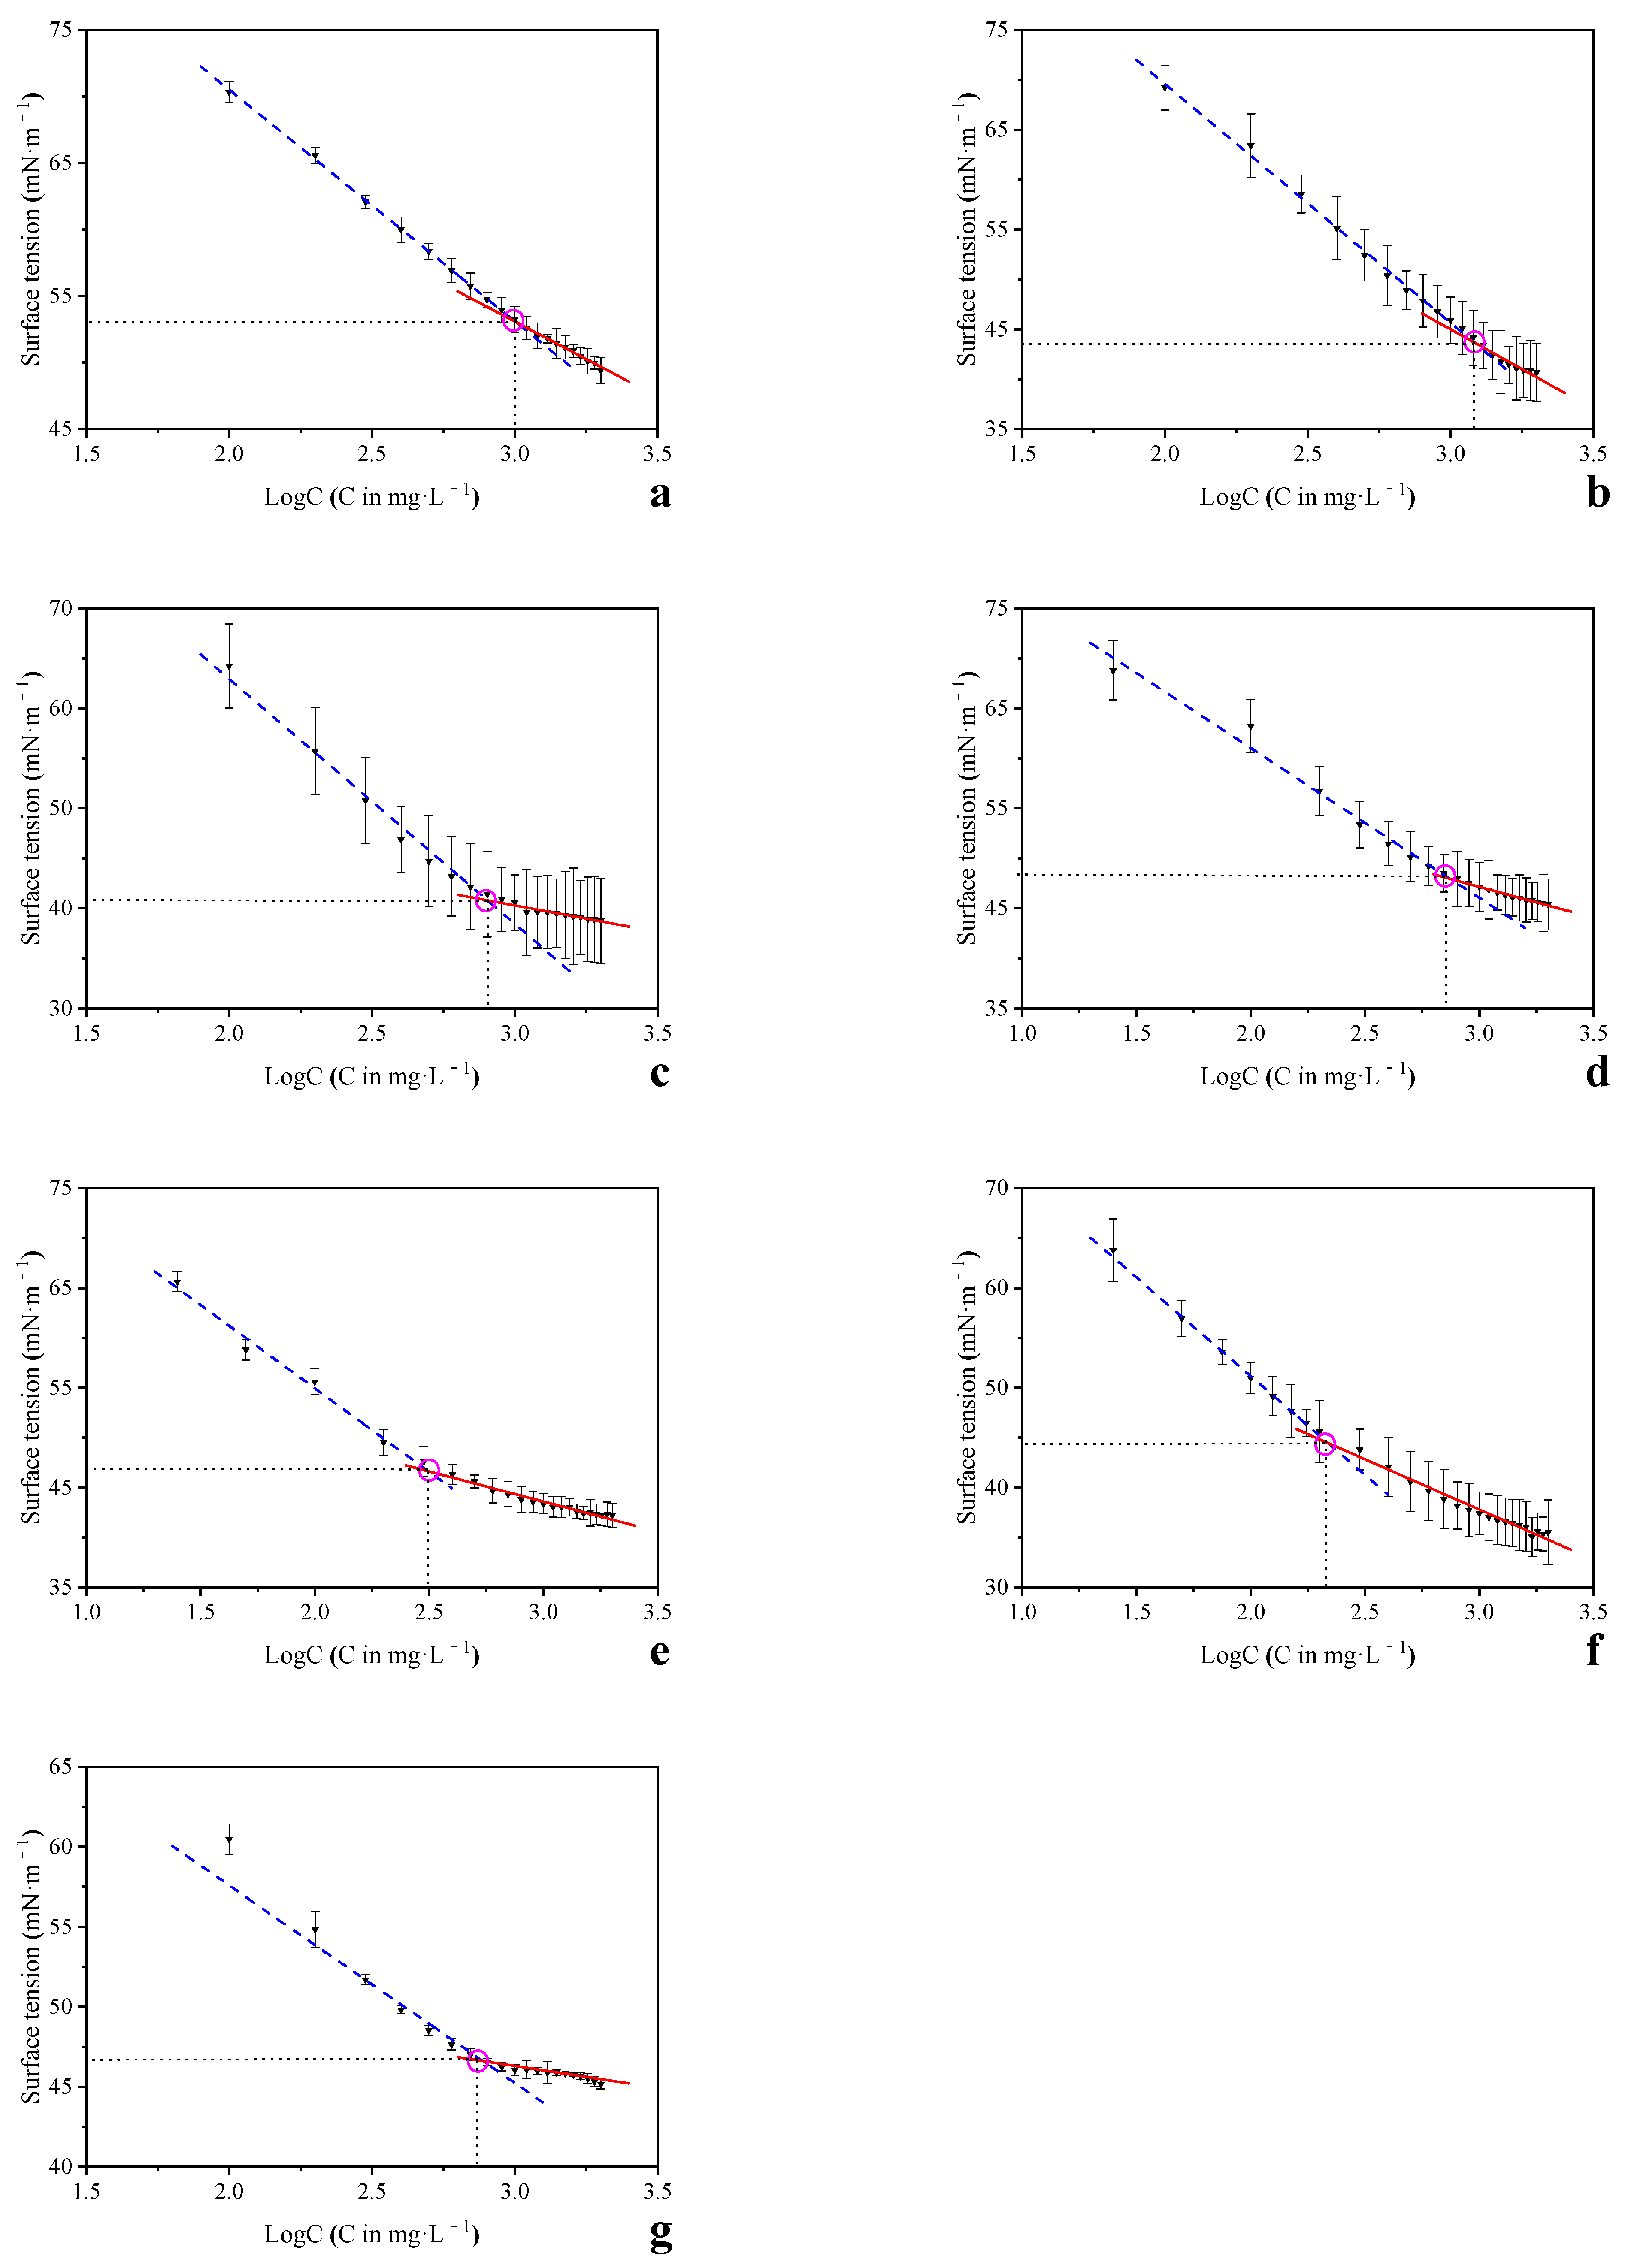
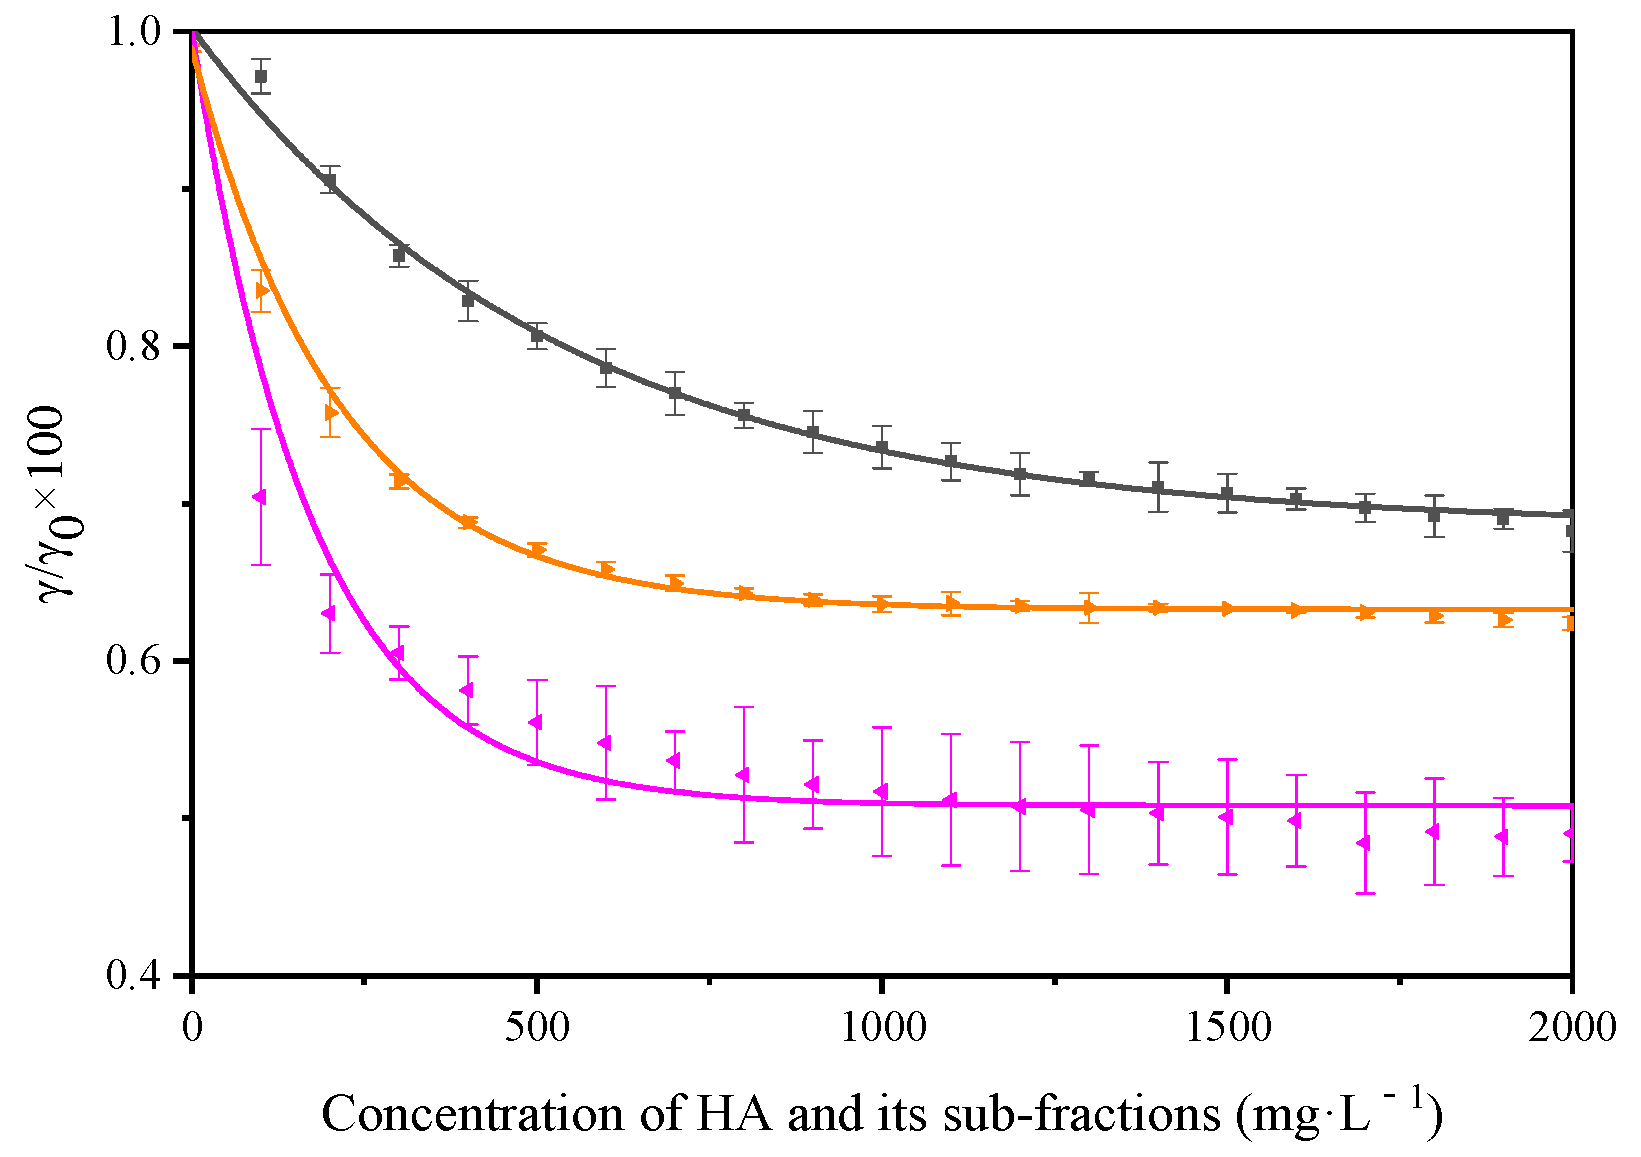
3.1. Surfactant Properties of Humic Acid and Its Sub-Fractions
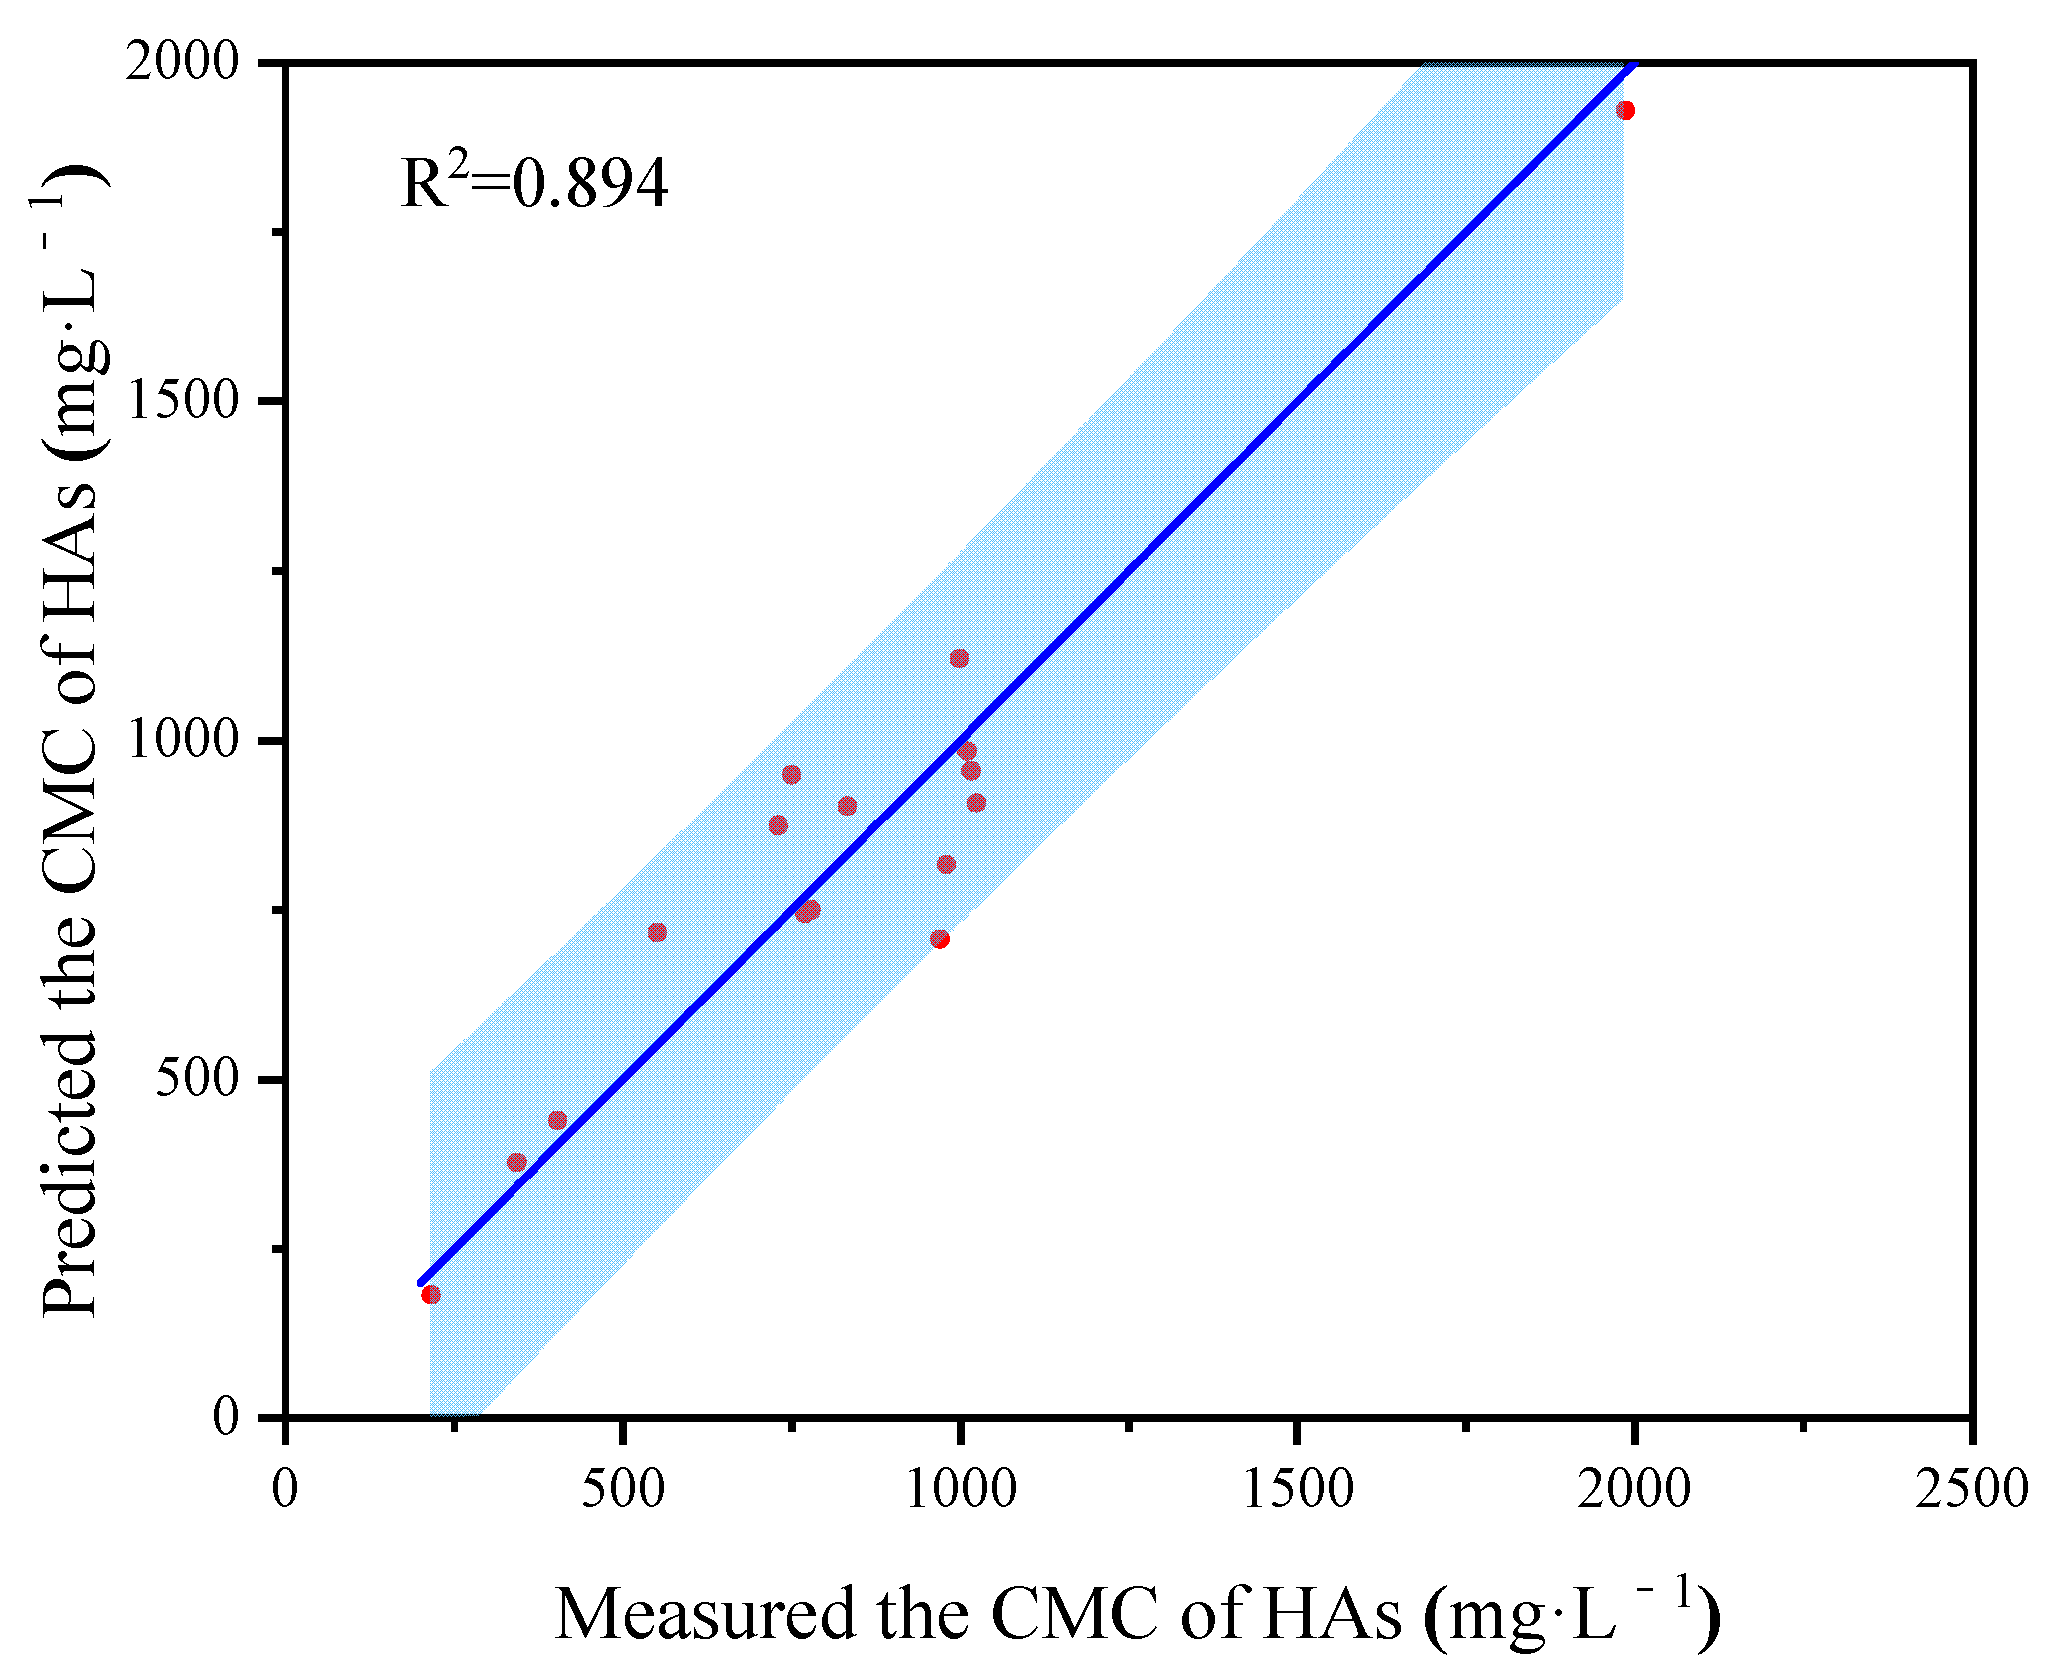
3.2. The CMC of HA and Its Sub-Fractions
3.3. HA Sub-Fractions Zeta Potential and Size Characteristic
4. Conclusions
Supplementary Materials
Author Contributions
Funding
Institutional Review Board Statement
Informed Consent Statement
Data Availability Statement
Conflicts of Interest
References
- Bai, Y.; Wu, F.; Xing, B.; Meng, W.; Shi, G.; Ma, Y.; Giesy, J.P. Isolation and characterization of Chinese standard fulvic acid sub-fractions separated from forest soil by stepwise elution with pyrophosphate buffer. Sci. Rep. 2015, 5, 8723. [Google Scholar] [CrossRef] [PubMed] [Green Version]
- Li, T.; Song, F.; Zhang, J.; Liu, S.; Xing, B.; Bai, Y. Pyrolysis characteristics of soil humic substances using TG-FTIR-MS combined with kinetic models. Sci. Total Environ. 2020, 698, 134237. [Google Scholar] [CrossRef]
- Salati, S.; Papa, G.; Adani, F. Perspective on the use of humic acids from biomass as natural surfactants for industrial applications. Biotechnol. Adv. 2011, 29, 913–922. [Google Scholar] [CrossRef] [PubMed]
- Guetzloff, T.F.; Rice, J.A. Does humic acid form a micelle? Sci. Total Environ. 1994, 152, 31–35. [Google Scholar] [CrossRef]
- Quadri, G.; Chen, X.; Jawitz, J.W.; Tambone, F.; Genevini, P.; Faoro, F.; Adani, F. Biobased surfactant-like molecules from organic wastes: The effect of waste composition and composting process on surfactant properties and on the ability to solubilize tetrachloroethene (PCE). Environ. Sci. Technol. 2008, 42, 2618–2623. [Google Scholar] [CrossRef]
- Kerner, M.; Hohenberg, H.; Ertl, S.; Reckermann, M.; Spitzy, A. Self-organization of dissolved organic matter to micelle-like microparticles in river water. Nature 2003, 422, 150–154. [Google Scholar] [CrossRef]
- Quagliotto, P.; Montoneri, E.; Tambone, F.; Adani, F.; Gobetto, R.; Viscardi, G. Chemicals from wastes: Compost-derived humic acid-like matter as surfactant. Environ. Sci. Technol. 2006, 40, 1686–1692. [Google Scholar] [CrossRef] [PubMed]
- Sierra, M.; Rauen, T.; Tormen, L.; Debacher, N.; Soriano-Sierra, E. Evidence from surface tension and fluorescence data of a pyrene-assisted micelle-like assemblage of humic substances. Water Res. 2005, 39, 3811–3818. [Google Scholar] [CrossRef]
- Ying, G. Fate, behavior and effects of surfactants and their degradation products in the environment. Environ. Int. 2006, 32, 417–431. [Google Scholar] [CrossRef]
- Savarino, P.; Montoneri, E.; Biasizzo, M.; Quagliotto, P.; Viscardi, G.; Boffa, V. Upgrading biomass wastes in chemical technology. Humic acid-like matter isolated from compost as chemical auxiliary for textile dyeing. J. Chem. Technol. Biotechnol. 2007, 82, 939–948. [Google Scholar] [CrossRef]
- Schwitzguébel, J.-P.; Aubert, S.; Grosse, W.; Laturnus, F. Sulphonated Aromatic Pollutants: Limits of Microbial Degradability and Potential of Phytoremediation. Environ. Sci. Pollut. Res. Int. 2002, 9, 62–72. [Google Scholar] [CrossRef]
- Garcıa, M.; Ribosa, I.; Guindulain, T.; Sanchez-Leal, J.; Vives-Rego, J. Fate and effect of monoalkyl quaternary ammonium surfactants in the aquatic environment. Environ. Pollut. 2001, 111, 169–175. [Google Scholar] [CrossRef]
- Diodovich, C.; Ferrario, D.; Casati, B.; Malerba, I.; Marafante, E.; Parent-Massin, D.; Gribaldo, L. Sensitivity of human cord blood cells to tetrachloroethylene: Cellular and molecular endpoints. Arch. Toxicol. 2005, 79, 508–514. [Google Scholar] [CrossRef]
- Moran, M.J.; Zogorski, J.S.; Squillace, P.J. Chlorinated solvents in groundwater of the United States. Environ. Sci. Technol. 2007, 41, 74–81. [Google Scholar] [CrossRef]
- Holmberg, K. Natural surfactants. Curr. Opin. Colloid Interface Sci. 2001, 6, 148–159. [Google Scholar] [CrossRef]
- Diallo, M.S.; Abriola, L.M.; Weber, W.J. Solubilization of nonaqueous phase liquid hydrocarbons in micellar solutions of dodecyl alcohol ethoxylates. Environ. Sci. Technol. 1994, 28, 1829–1837. [Google Scholar] [CrossRef]
- Das, P.; Mukherjee, S.; Sen, R. Improved bioavailability and biodegradation of a model polyaromatic hydrocarbon by a biosurfactant producing bacterium of marine origin. Chemosphere 2008, 72, 1229–1234. [Google Scholar] [CrossRef]
- Ke, L.; Bao, W.; Chen, L.; Wong, Y.S.; Tam, N. Effects of humic acid on solubility and biodegradation of polycyclic aromatic hydrocarbons in liquid media and mangrove sediment slurries. Chemosphere 2009, 76, 1102–1108. [Google Scholar] [CrossRef]
- Urdiales, C.; Sandoval, M.P.; Escudey, M.; Pizarro, C.; Knicker, H.; Reyes-Bozo, L.; Antilén, M. Surfactant properties of humic acids extracted from volcanic soils and their applicability in mineral flotation processes. J. Environ. Manag. 2018, 227, 117–123. [Google Scholar] [CrossRef]
- Kawahigashi, M.; Fujitake, N. Surface-active properties of particle size fractions in two humic acids. Soil Sci. Plant Nutr. 1998, 44, 497–505. [Google Scholar] [CrossRef]
- Rosen, M.J.; Kunjappu, J.T. Surfactants and Interfacial Phenomena; John Wiley & Sons: Hoboken, NJ, USA, 2012. [Google Scholar]
- Song, F.; Wu, F.; Feng, W.; Liu, S.; He, J.; Li, T.; Zhang, J.; Wu, A.; Amarasiriwardena, D.; Xing, B. Depth-dependent variations of dissolved organic matter composition and humification in a plateau lake using fluorescence spectroscopy. Chemosphere 2019, 225, 507–516. [Google Scholar] [CrossRef]
- Song, F.; Wu, F.; Guo, F.; Wang, H.; Feng, W.; Zhou, M.; Deng, Y.; Bai, Y.; Xing, B.; Giesy, J.P. Interactions between stepwise-eluted sub-fractions of fulvic acids and protons revealed by fluorescence titration combined with EEM-PARAFAC. Sci. Total Environ. 2017, 605, 58–65. [Google Scholar] [CrossRef]
- Zhang, J.; Song, F.; Li, T.; Xie, K.; Yao, H.; Xing, B.; Li, Z.; Bai, Y. Simulated photo-degradation of dissolved organic matter in lakes revealed by three-dimensional excitation-emission matrix with regional integration and parallel factor analysis. J. Environ. Sci. 2020, 90, 310–320. [Google Scholar] [CrossRef]
- Myers, J.L.; Well, A.; Lorch, R.F. Research Design and Statistical Analysis; Routledge: London, UK, 2010. [Google Scholar]
- Aiken, L.S.; West, S.G.; Pitts, S.C.; Baraldi, A.N.; Wurpts, I.C. Multiple linear regression. In Handbook of Psychology; John Wiley & Sons: Hoboken, NJ, USA, 2012. [Google Scholar]
- Qian, X. Statistical Analysis and Evaluation of the Advanced Biomass and Natural Gas Co-Combustion Performance. Ph.D. Thesis, Morgan State University, Baltimore, MD, USA, 2019. [Google Scholar]
- Uyanık, G.K.; Güler, N. A study on multiple linear regression analysis. Procedia Soc. Behav. Sci. 2013, 106, 234–240. [Google Scholar] [CrossRef] [Green Version]
- Liang, Y.; Britt, D.W.; McLean, J.E.; Sorensen, D.L.; Sims, R.C. Humic acid effect on pyrene degradation: Finding an optimal range for pyrene solubility and mineralization enhancement. Appl. Microbiol. Biotechnol. 2007, 74, 1368–1375. [Google Scholar] [CrossRef] [PubMed]
- Adani, F.; Tambone, F.; Davoli, E.; Scaglia, B. Surfactant properties and tetrachloroethene (PCE) solubilisation ability of humic acid-like substances extracted from maize plant and from organic wastes: A comparative study. Chemosphere 2010, 78, 1017–1022. [Google Scholar] [CrossRef] [PubMed]
- Allahbakhsh, A.; Bahramian, A.R. Self-assembly of graphene quantum dots into hydrogels and cryogels: Dynamic light scattering, UV–Vis spectroscopy and structural investigations. J. Mol. Liq. 2018, 265, 172–180. [Google Scholar] [CrossRef]
- Esfahani, M.R.; Stretz, H.A.; Wells, M.J. Abiotic reversible self-assembly of fulvic and humic acid aggregates in low electrolytic conductivity solutions by dynamic light scattering and zeta potential investigation. Sci. Total Environ. 2015, 537, 81–92. [Google Scholar] [CrossRef]
- Braun, J.; Renggli, K.; Razumovitch, J.; Vebert, C. Dynamic light scattering in supramolecular materials chemistry. In Supramolecular Chemistry; John Wiley & Sons: Hoboken, NJ, USA, 2012. [Google Scholar]
- Palmer, N.E.; von Wandruszka, R. Dynamic light scattering measurements of particle size development in aqueous humic materials. Anal. Bioanal. Chem. 2001, 371, 951–954. [Google Scholar] [CrossRef]
- Pinheiro, J.; Mota, A.; d’Oliveira, J.; Martinho, J. Dynamic properties of humic matter by dynamic light scattering and voltammetry. Anal. Chim. Acta 1996, 329, 15–24. [Google Scholar] [CrossRef]
- Baalousha, M.; Motelica-Heino, M.; Le Coustumer, P. Conformation and size of humic substances: Effects of major cation concentration and type, pH, salinity, and residence time. Colloids Surf. A Physicochem. Eng. Asp. 2006, 272, 48–55. [Google Scholar] [CrossRef]
- Liu, F.; Wei, X.; Xie, R.; Wang, Y.; Li, W.; Li, Z.; Li, P.; Zong, Z. Characterization of oxygen-containing species in methanolysis products of the extraction residue from Xianfeng lignite with negative-ion electrospray ionization Fourier transform ion cyclotron resonance mass spectrometry. Energy Fuels 2014, 28, 5596–5605. [Google Scholar] [CrossRef]
- Liu, S.S.; Zhu, Y.R.; Liu, L.Z.; He, Z.Q.; Giesy, J.P.; Bai, Y.C.; Sun, F.H.; Wu, F.C. Cation-induced coagulation of aquatic plant-derived dissolved organic matter: Investigation by EEM-PARAFAC and FT-IR spectroscopy. Environ. Pollut. 2018, 234, 726–734. [Google Scholar] [CrossRef] [PubMed]
- Song, F.; Wang, X.; Li, T.; Zhang, J.; Bai, Y.; Xing, B.; Giesy, J.P.; Wu, F. Spectroscopic analyses combined with Gaussian and Coats-Redfern models to investigate the characteristics and pyrolysis kinetics of sugarcane residue-derived biochars. J. Clean. Prod. 2019, 237, 117855. [Google Scholar] [CrossRef]
- Zhao, J.; Guo, Q.; Huang, W.; Zhang, T.; Wang, J.; Zhang, Y.; Huang, L.; Tang, Y. Shape Tuning and Size Prediction of Millimeter-Scale Calcium-Alginate Capsules with Aqueous Core. Polymers 2020, 12, 688. [Google Scholar] [CrossRef] [Green Version]
- Instruments, M. Zetasizer Nano Series User Manual-MAN0317 Issue 1.0; Malvern Instruments Ltd.: Worcestershire, UK, 2003. [Google Scholar]
- Fei, G.; Shuai, Q.A.; Lei, X.A.; Yb, A.; Bx, C. Thermal degradation features of soil humic acid sub-fractions in pyrolytic treatment and their relation to molecular signatures. Sci. Total Environ. 2020, 749, 142318. [Google Scholar] [CrossRef]
- Montoneri, E.; Boffa, V.; Quagliotto, P.; Mendichi, R.; Chierotti, M.; Roberto, G.; Medana, C. Humic acid-like matter isolated from green urban wastes. Part I: Structure and surfactant properties. Bioresources 2008, 3, 123–141. [Google Scholar] [CrossRef]
- Savarino, P.; Montoneri, E.; Musso, G.; Boffa, V. Biosurfactants from urban wastes for detergent formulation: Surface activity and washing performance. J. Surfactants Deterg. 2010, 13, 59. [Google Scholar] [CrossRef]
- Chilom, G.; Bruns, A.S.; Rice, J.A. Aggregation of humic acid in solution: Contributions of different fractions. Org. Geochem. 2009, 40, 455–460. [Google Scholar] [CrossRef]
- Lippold, H.; Gottschalch, U.; Kupsch, H. Joint influence of surfactants and humic matter on PAH solubility. Are mixed micelles formed? Chemosphere 2008, 70, 1979–1986. [Google Scholar] [CrossRef]
- Hattori, K. Chemical and biological studies on environmental humic acidsI. Composition of elemental and functional groups of humic acids. Soil Sci. Plant Nutr. 1988, 35, 383–392. [Google Scholar] [CrossRef]
- Dai, J.Y.; Ran, W.; Xing, B.S.; Gu, M.; Wang, L.S. Characterization of fulvic acid fractions obtained by sequential extractions with pH buffers, water, and ethanol from paddy soils. Geoderma 2006, 135, 284–295. [Google Scholar] [CrossRef]
- Qian, X.; Lee, S.; Soto, A.-M.; Chen, G. Regression model to predict the higher heating value of poultry waste from proximate analysis. Resources 2018, 7, 39. [Google Scholar] [CrossRef] [Green Version]
- Jovanović, U.D.; Marković, M.M.; Cupać, S.B.; Tomić, Z.P. Soil humic acid aggregation by dynamic light scattering and laser Doppler electrophoresis. J. Plant Nutr. Soil Sci. 2013, 176, 674–679. [Google Scholar] [CrossRef]
- Klučáková, M.; Věžníková, K. Micro-organization of humic acids in aqueous solutions. J. Mol. Struct. 2017, 1144, 33–40. [Google Scholar] [CrossRef]
- Baigorri, R.; Fuentes, M.; González-Gaitano, G.; García-Mina, J.M. Analysis of molecular aggregation in humic substances in solution. Colloids Surf. A Physicochem. Eng. Asp. 2007, 302, 301–306. [Google Scholar] [CrossRef]

 peak1;
  peak2;
  peak3;
  peak4).
peak1; peak2; peak3; peak4).
peak4).
peak1; peak2; peak3; peak4).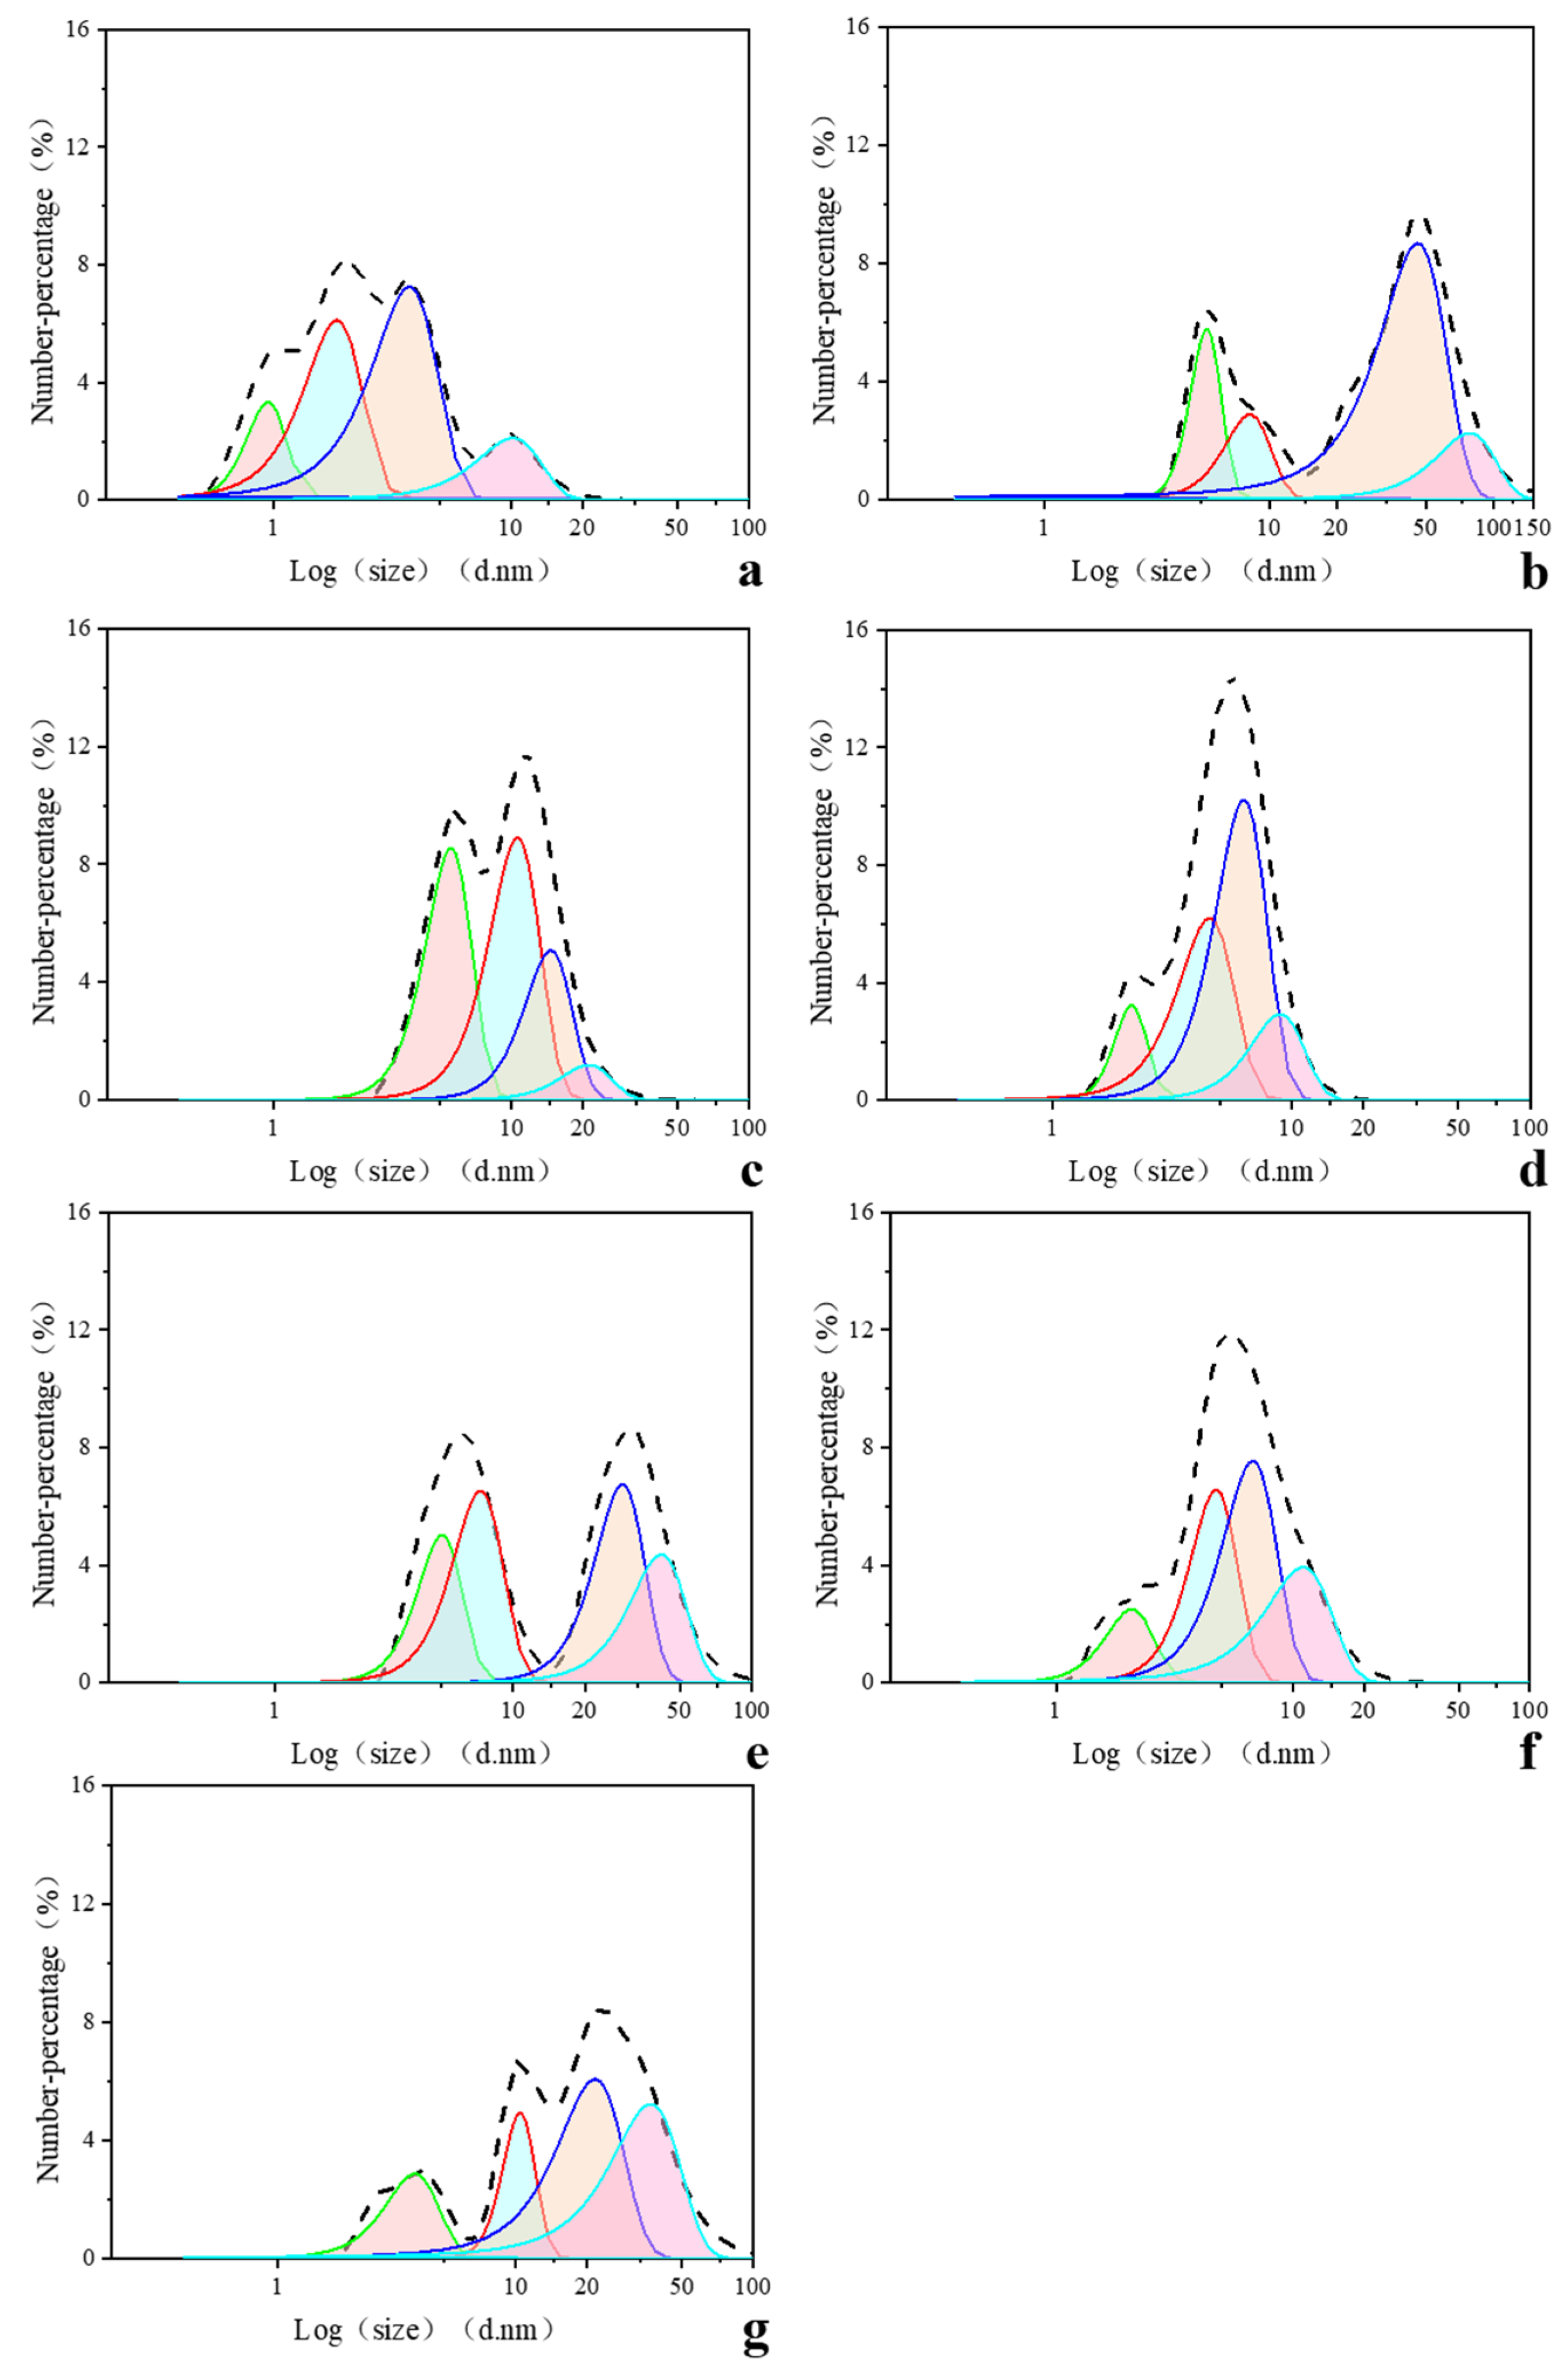

| Source | C (g·kg−1) | H (g·kg−1) | N (g·kg−1) | O (g·kg−1) | Alkyl C (%) | O-Alkyl C (%) | Aromatic C (%) | Carbonyl C (%) | HB/HI | CMC b (mg·L−1) | CMC c(mg·L−1) | References |
|---|---|---|---|---|---|---|---|---|---|---|---|---|
| Food wastes + green wastes (1/v/v) (15 d composted) | 599 | 66.6 | 59.9 | 270.0 | 45.2 | 21.1 | 21.6 | 12.1 | 2.01 | 403 | 497 | Quagliotto, et al. [7] |
| Urban green wastes no composted | 579 | 60.7 | 45.5 | 231.3 | 49.5 | 21.6 | 14.2 | 14.6 | 1.76 | 970 | 906 | Montoneri, et al. [43] |
| Green wastes (start of aerobic digestion) | 650 | 58.5 | 45.5 | 247.0 | 48.9 | 25.1 | 16.1 | 9.9 | 1.86 | 770 | 625 | Savarino, et al. [44] |
| Green wastes (7 d digested) | 635 | 58.5 | 57.1 | 247.0 | 44.6 | 24.6 | 17.4 | 12 | 1.69 | 750 | 846 | Savarino, et al. [44] |
| Green wastes (60 d digested) | 604 | 50.8 | 42.3 | 302.0 | 43.5 | 26.6 | 19.3 | 10.5 | 1.69 | 730 | 892 | Savarino, et al. [44] |
| Food + green wastes (1/1-w/w) start of aerobic digestion | 645 | 54.3 | 51.6 | 245.0 | 55.1 | 23.2 | 11 | 10.4 | 1.97 | 999 | 1057 | Savarino, et al. [44] |
| Food + green wastes (1/1-w/w) 7 d digested | 627 | 62.7 | 53.3 | 257.0 | 53.8 | 24.4 | 12 | 8.8 | 1.98 | 1010 | 1005 | Savarino, et al. [44] |
| Food + green wastes (1/1-w/w) 60 d digested | 617 | 55.5 | 49.4 | 277.6 | 48.8 | 22.2 | 16.5 | 12.5 | 1.88 | 980 | 831 | Savarino, et al. [44] |
| Maize plant residues | 548 | 64 | 41 | 342.0 | 26.8 | 42.3 | 21.1 | 9.9 | 0.92 | 1986 | 1950 | Adani, et al. [30] |
| HA-1 a | 540.3 | 35.8 | 28.2 | 372.1 | 17.7 | 19.1 | 41.3 | 22.0 | 1.44 | 1016 | 977 | a |
| HA-2 a | 542.5 | 33.8 | 28.5 | 368.8 | 16.8 | 16.7 | 43.2 | 23.2 | 1.50 | 1024 | 910 | a |
| HA-3 a | 541.6 | 39.2 | 36.2 | 362.3 | 19.9 | 17.1 | 39.1 | 23.9 | 1.44 | 833 | 941 | a |
| HA-4 a | 567.2 | 52.9 | 42.7 | 307.3 | 25.6 | 22.1 | 31.9 | 20.4 | 1.35 | 779 | 741 | a |
| HA-5 a | 579.8 | 60.7 | 38.4 | 299.0 | 29.9 | 25.3 | 30.4 | 14.4 | 1.52 | 343 | 372 | a |
| HA-6 a | 593.8 | 66.0 | 39.9 | 286.5 | 30.0 | 23.9 | 30.4 | 15.7 | 1.52 | 216 | 136 | a |
| HA a | 570.1 | 52.1 | 36.4 | 303.6 | 23.39 | 21.5 | 34.0 | 21.2 | 1.34 | 551 | 671 | a |
| γ (mN m−1) | Δγ (mN m−1) | A (%) | R2 | |
|---|---|---|---|---|
| HA-1 | 49.6(65.6) a | 23.45 | 0.0019 | 0.995 |
| HA-2 | 40.0(63.4) a | 33.16 | 0.0018 | 0.995 |
| HA-3 | 39.1(55.7) a | 34.07 | 0.0035 | 0.998 |
| HA-4 | 46.2(56.7) a | 25.86 | 0.0040 | 0.992 |
| HA-5 | 43.2(49.5) a | 28.77 | 0.0075 | 0.980 |
| HA-6 | 36.8(45.6) a | 33.95 | 0.0057 | 0.973 |
| HA | 45.8(55.9) a | 25.80 | 0.0047 | 0.998 |
| Peak 1 (nm) | W (nm) | Percent (%) | Peak 2 (nm) | W (nm) | Percent (%) | Peak 3 (nm) | W (nm) | Percent (%) | Peak 4 (nm) | W (nm) | Percent (%) | |
|---|---|---|---|---|---|---|---|---|---|---|---|---|
| HA1 | 1.0 | 0.44 | 3.30 | 1.9 | 1.23 | 16.85 | 3.8 | 2.75 | 44.69 | 10.2 | 7.44 | 35.16 |
| HA2 | 5.3 | 1.97 | 2.46 | 8.2 | 4.58 | 2.85 | 45.9 | 36.16 | 67.73 | 78.1 | 55.46 | 26.96 |
| HA3 | 5.6 | 2.91 | 18.60 | 10.6 | 6.08 | 40.37 | 14.6 | 7.93 | 30.29 | 21.1 | 12.36 | 11.00 |
| HA4 | 2.1 | 0.80 | 3.51 | 4.5 | 18.91 | 24.08 | 6.3 | 3.67 | 50.87 | 9.0 | 5.43 | 21.55 |
| HA5 | 5.0 | 2.58 | 4.90 | 7.3 | 4.20 | 10.36 | 28.7 | 16.18 | 41.18 | 41.8 | 26.47 | 43.56 |
| HA6 | 2.1 | 1.15 | 3.43 | 4.8 | 2.58 | 20.22 | 6.8 | 4.21 | 37.82 | 11.0 | 8.25 | 38.54 |
| HA | 3.8 | 2.3 | 2.4 | 10.4 | 3.9 | 7.1 | 21.6 | 15.9 | 35.6 | 36.9 | 28.6 | 54.9 |
Publisher’s Note: MDPI stays neutral with regard to jurisdictional claims in published maps and institutional affiliations. |
© 2021 by the authors. Licensee MDPI, Basel, Switzerland. This article is an open access article distributed under the terms and conditions of the Creative Commons Attribution (CC BY) license (https://creativecommons.org/licenses/by/4.0/).
Share and Cite
Tian, S.; Tan, W.; Wang, X.; Li, T.; Song, F.; Huang, N.; Bai, Y. Surface Activity of Humic Acid and Its Sub-Fractions from Forest Soil. Sustainability 2021, 13, 8122. https://doi.org/10.3390/su13158122
Tian S, Tan W, Wang X, Li T, Song F, Huang N, Bai Y. Surface Activity of Humic Acid and Its Sub-Fractions from Forest Soil. Sustainability. 2021; 13(15):8122. https://doi.org/10.3390/su13158122
Chicago/Turabian StyleTian, Shijie, Weiqiang Tan, Xinyuan Wang, Tingting Li, Fanhao Song, Nannan Huang, and Yingchen Bai. 2021. "Surface Activity of Humic Acid and Its Sub-Fractions from Forest Soil" Sustainability 13, no. 15: 8122. https://doi.org/10.3390/su13158122
APA StyleTian, S., Tan, W., Wang, X., Li, T., Song, F., Huang, N., & Bai, Y. (2021). Surface Activity of Humic Acid and Its Sub-Fractions from Forest Soil. Sustainability, 13(15), 8122. https://doi.org/10.3390/su13158122