Article

Sustainable Firm Performance of Logistics Service Providers along Maritime Supply Chain

Dual Study, IU International University of Applied Sciences, 28359 Bremen, Germany
Sustainability 2021, 13(14), 8040; https://doi.org/10.3390/su13148040
Submission received: 30 May 2021 / Revised: 3 July 2021 / Accepted: 15 July 2021 / Published: 19 July 2021
(This article belongs to the Special Issue Sustainable Transportation and Regional Economic Development)

Abstract

:
As a result of globalization and the growing importance of environmental and social issues, scholars have started to update the scope of logistics management and capture its complexity using different theoretical perspectives. The output of logistics services also encompasses the so-called negative by-products, which have been increased in past decades and stress the need for a standardized, comprehensive and quantitative performance measurement. The reduction of the negative by-production, e.g., decarbonization in the transport industry, is commonly associated with a higher degree of logistics performance using different capabilities. Research aims of the study are twofold: to show the decisive components for sustainability performance of a logistics service provider (LSP) and to outline internal capabilities of LSPs as indicators of its sustainability-oriented firm performance. In the first step, firm performance is sampled using the lenses of sustainability. For this purpose, general and transport-related sustainability frameworks are summarized to identify how they differ in sustainability dimensions in order to help LSPs contribute to the 17 Sustainable Development Goals. In the second step, decisive and evidence-based capabilities as indicators of sustainability-oriented performance are outlined using mixed methods by reviewing the literature.

1. Introduction

The risk of growing protectionism reduced the global merchandise flows to 2.7% in 2020 before the pandemic [1]. The downgrading of estimations for GDP as a result of the outbreak of coronavirus and the escalation of the coronavirus outbreak outside of China further cut economic growth and plunged several countries into recession [2]. Very probably, the development of the global freight demand and maritime trade will be downgraded from the predicted tripling by 2050 previously estimated by the International Transport Forum [3] (pp. 36 and 38) if the recovery of demand does not occur in the nearest future.
Around 70% of global freight in t-km [3] (p. 36) or 80% of world merchandise trade by volume are travelled by sea [4] (p. 4). Being the key enabler of international trade, international shipping itself accounts for only 2% of CO2 emissions from fuel combustion, being regarded as the most energy-efficient way to move goods along maritime motorways. As shown in Figure 1, apart from moving the cargo from one maritime gate to another (shipping), maritime logistics encompasses other functions including maritime or inland terminal operation and integration, as well as freight forwarding on behalf of the shippers [5].
This paper considers maritime logistics as a value-added international supply chain management with ocean carriage and integrated inland or multi-mode ports in hinterland. As shown in Figure 1, seaports are transport terminals as well as the main nodes for freight flows along global maritime supply chains, linking waterborne and hinterland transport modes while also influencing the setting of supply chain performance and regional networks.
The latter ones are embedded into global maritime supply chains [6] and differently termed in the literature: clusters [7], hot spots by Pouder and St. John [8], industrial districts, or hub-and-spoke districts [9]. Such economically or economic-geographic studies on cluster or industrial districts underline the importance of proximity to such agglomerations, but do not suggest how a firm’s performance can be increased using the sustainability concept.
These regional networks serve as a platform for LSPs to engage in joint regional value creation systems from time to time, although they act as competitors in other businesses. This co-operational and competitive relation (known as co-opetition) is popular in daily business and research [10] and assumed by the author. LSPs and other actors in the port context are shown in Figure 2. All actors in the port context are handled under two premises: they act rationally with fixed preferences in order to maximize their own benefits and make their business more sustainable (homo oeconomicus). They do not have full information about all circumstances and aim to lower transaction costs and negative footprints locally and globally.
The reason for such a broad scope along the maritime supply chain is twofold. On one side, as a result of rapid containerization, globalization and modal separation of transshipments, seaports tended to consume more space during four phases of port growth models [12] (p. 130) and migrate to urban areas upon the port–urban [13] or port–city interface concept [14] or to secondary hinterlands far away from seaports upon the inland container terminal concept [15]. All concepts are accompanied with the relocation of traditional seaport functions (storage, warehousing) to the hinterland. The integration of maritime gateways with hinterland terminals become decisive for supply chain performance: Notteboom and Rodrigue [16] called the duality of the port and the hinterland as a new phase of the regionalization of ports. This integrated network of hinterland terminals around a maritime node is supposed to contribute to the responsiveness of maritime supply chains by using them as a buffer, either in the city area or the hinterland according to different port–city types [17] (p. 16).
At the same time, port–urban areas were first neglected and addressed gateways along global maritime chains in terms of their local negative footprint. Both advanced and less-developed countries became aware of the environmental and social problems that the development of ports poses. These issues are well documented as a new object of inquiry in economic geography [18] much earlier than the adoption of the United Nations Framework Convention on Climate Change in 1992. Despite this pioneering role of maritime gateways, the design of these gateways together with the supply chain stages still lacks in the sustainability of maritime logistics operations. Since the Brundtland Commission in 1987, the concept of sustainability is regarded as a development strategy to meet the needs of the present without compromising the needs of the future generations [19] (p. 43). It has been designed into a very broad concept at the macroeconomic level, but has been set as a top priority for the development of not only societies and countries but companies at the microeconomic level.

2. Aims and Research Concept

The paper has following research questions:
(1)
What are the decisive components for the sustainability performance of LSPs?
(2)
Which capabilities can be used as sustainability-oriented indicators?
For this purpose, seven general and logistics-related sustainability frameworks are summarized in Section 3 to identify how they differ in sustainability dimensions in order to help LSPs to contribute to the 17 Sustainable Development Goals.
Section 3 covers managerial principles through to giving a comparative overview of the existing frameworks on how to integrate sustainability concretely into business strategy with a special attention to logistics service. Section 3 captures different evidence-based actions on how to enhance performance which are interesting for both managerial and academia perspectives. In the second step in Section 4, the decisive sustainability performance components and capabilities as indicators of sustainability-oriented performance are outlined using a mixed methods review of the literature. A summary of the paper is provided in Section 5.
From the research point of view, the results support further theoretical grand- or middle-range thinking to fulfil theory-oriented empirical inquiries on outlined sustainability dimensions or outlined evidence-based capabilities that are valuable for enhancing business performance. Furthermore, the results help managers to elaborate or improve their sustainability strategy with regard to their strategic and operational decisions.

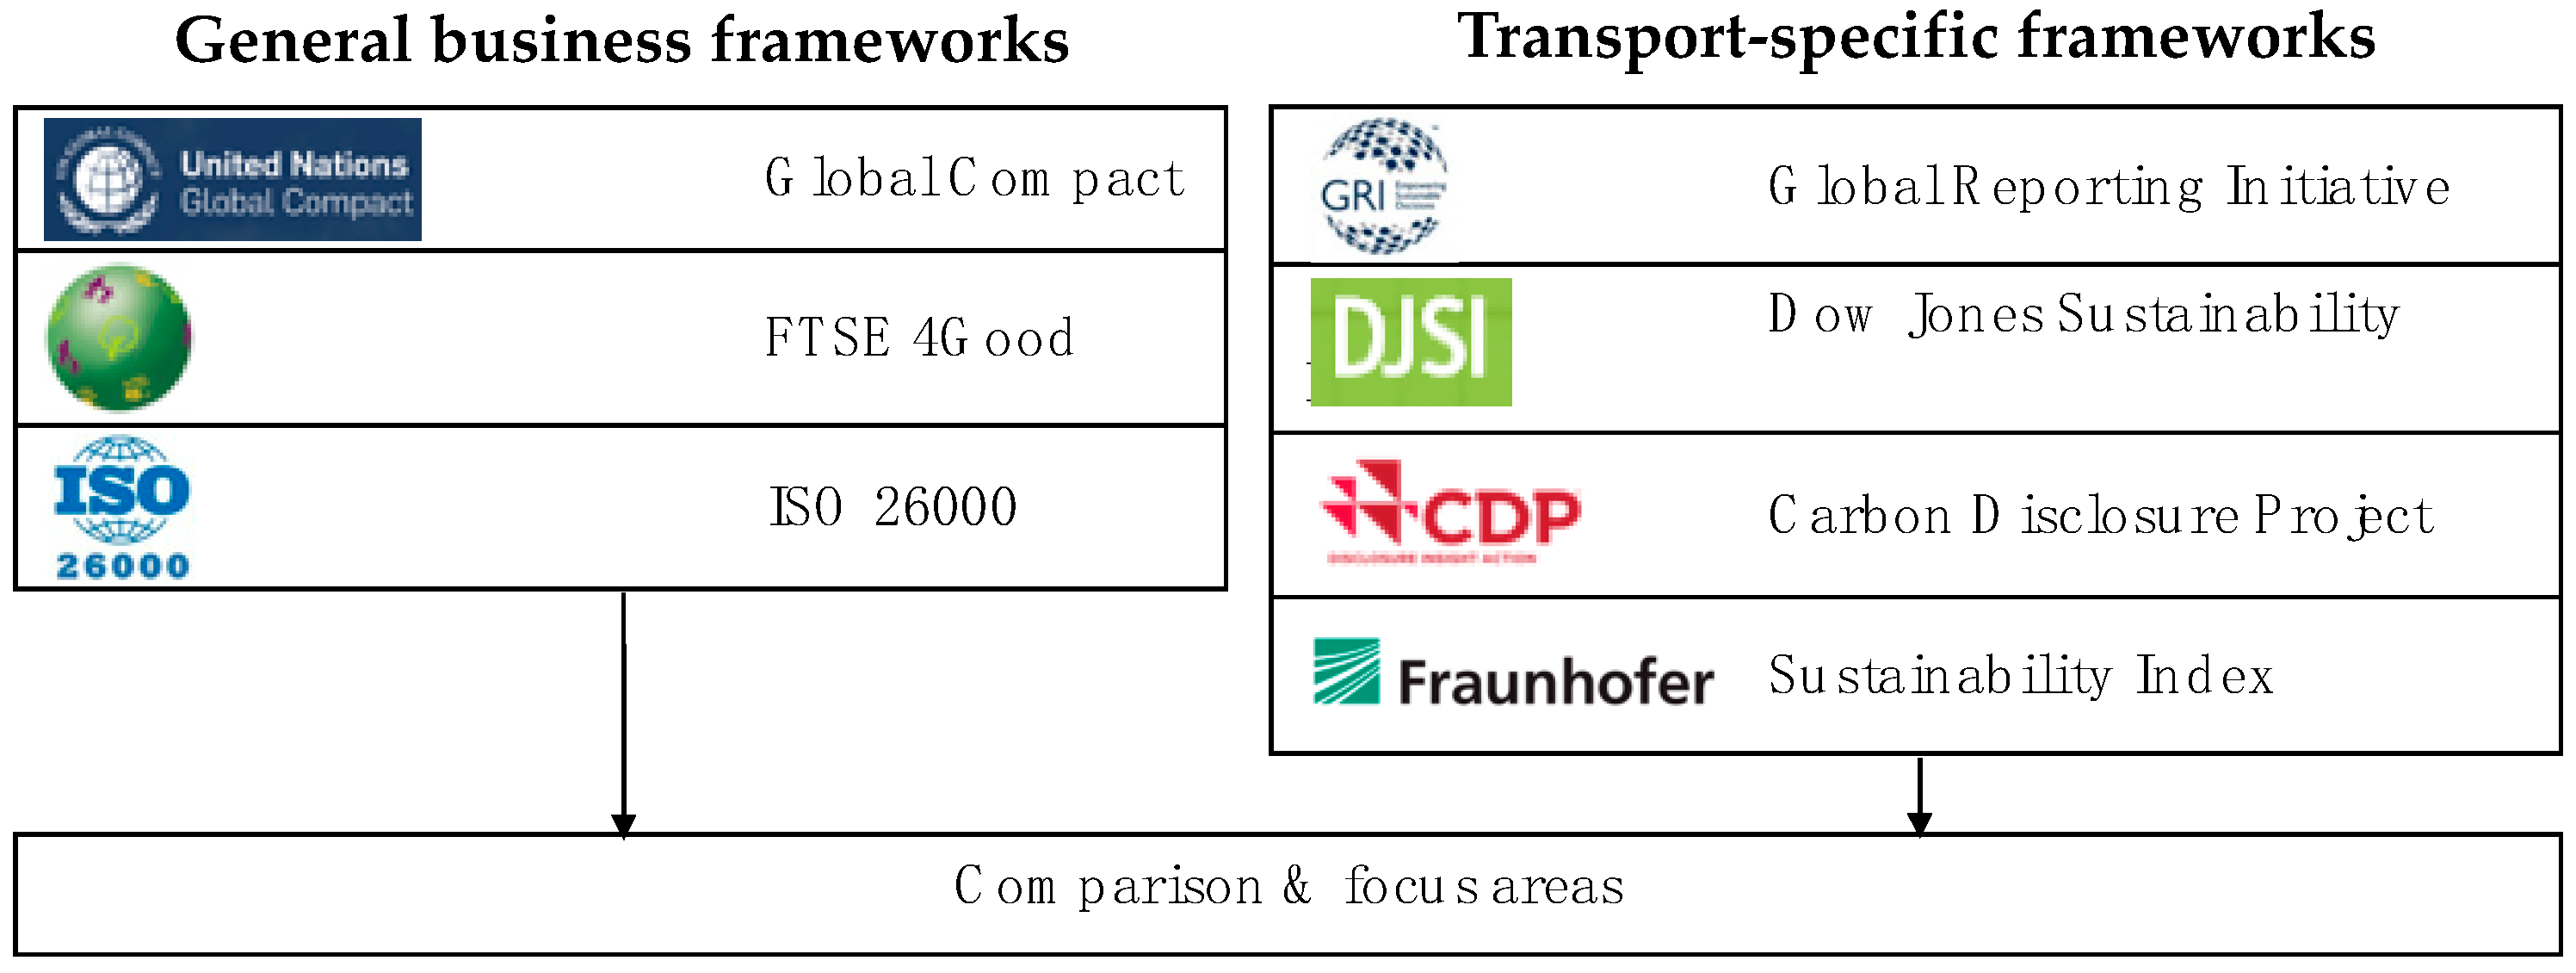
3. An Overview of Sustainability Frameworks

The emergence of the concept of sustainable development, or “sustainability”, is nearly impossible to locate chronologically. The first mentioning of the adjective “sustainable” in German goes back to the 18th century work “Sylvicultura Oeconomica” about the principles of sustainable forestry for future generations [20] (p. 105). The rapid economic growth, maritime trade, limited nature of resources and increased pollution problems in the 1970s in developed countries [21] let the political debate become more focused on environmental aspects and scientific debate within business studies—on environment-oriented approaches. Since the Our Common Future [19], the concept of sustainability was targeted in environmental and development policy. The latest specificity, in terms of context of sustainable development policy agenda, dates back to 2015 after the adoption of the 17 Sustainable Development Goals (SDGs). These 17 targets are to be achieved by the end of 2030 [22] (p. 6). In comparison to the specific Millennium Development Goals, adopted in 2000, concentrating on the poorest developing countries that are addressing the root causes of poverty and the universal need for development that works for all people, the SDGs are broad in scope and address the interconnected elements of sustainable development: economic growth, social inclusion and environmental protection [22]. As Figure 3 shows, 7 of the 17 SDGs are linked to sustainable transport in line with the analysis and policy recommendations from the United Nations (UN) [23].
The way an LSP considers sustainability can be assessed within a range of approaches for the sustainability reporting. Guidelines for those are presented in the following. Reporting initiatives offer approaches for environmental, social and governance ranking and measurement: those that offer general business indicators of sustainability are shown to the left of Figure 4; those that offer transport-specific indicators are displayed to the right. They will be compared to derive the focus areas for each sustainability dimension in the following.
Due to the approach of the Fraunhofer working group for supply chain services [24], monitoring the websites of 150 German LSPs for 13 criteria of the so-called sustainability index for LSPs were monitored. Although, these findings are not included into the further comparison of focus areas, they exemplify the best practices in the German market. That is why they are listed as the last transport-specific framework in Figure 4.
LSPs are focused by half of the presented sustainability frameworks and offer transport industry-specific indicators. The extent of coverage of the transport industry is different from framework to framework and will be outlined in the following for the remaining six frameworks, apart from the Fraunhofer Sustainability Index. The comparison is summarized in Figure 5.
Since 2000, the Global Compact, a UN initiative, offers a framework of ten principles for companies to adopt sustainable and socially responsible policies following 17 quantitative Sustainable Development Goals. According to this, a sustainable performance is one that ensures its business activities and does not impact negatively on people, society, the environment and the economy [25] (p. 15). For example, the transport-related SDG 12 “Responsible Consumption and Production” (cf. Figure 3) can be realized through four business actions: the adaptation of responsible circle business models, the narrowing of material and energy loops, a portfolio shift to the products with negligible resources and waste and reporting on sustainability of production and consumption across end-to-end operations [26] (p. 112). UN Global Compact suggests neither a hierarchy or preferences between the goals nor a transport-related set of indicators.
Transport industry-specific indicators are spread over eight sectors and 60 sub-sectors of the “one-to-many model” of the Financial Times Stock Exchange [27] (p. 13). This ensures that any company is not directly allocated to the subsector that mostly represents the nature of its business but to many activities within 60 sub-sectors in order to cover in- and outside the core area business activities, e.g., shipping, retail/wholesale, logistics and support. This complex approach does not allow to derive LSP-specific categories due to an unavailability of data about the Financial Times Stock Exchange (FTSE) model.
Published in 2010, the International Standard ISO 26000 guides companies on social responsibility in order to operate in the socially responsible manner [28] (p. 2). It is used by a large number of companies as a way of managing performance in this respect. The ISO 26000 cannot be used for certification but provides seven core subjects of social responsibility [29] (p. 13). Each core subject is further described with a range of issues covering economic and environmental dimensions of sustainability. The ISO 26000 does not have any transport-related indicators.
The oldest and the most widely used framework for sustainability is the Global Reporting Initiative (GRI) [30] (p. 6). The GRI disclosures cover 70% of the SDGs’ targets [30] (p. 7) and include the Logistics and Transportation Sector Supplement, which was developed by a multi-stakeholder working group of companies (including Deutsche Post, DB Schenker, FedEx, TNT, etc.), and research institutes in collaboration with the Logistics Corporate Citizenship Initiative of the World Economic Forum in 2006. This supplement [31] is applicable to all organizations within the logistics and transportation sector that use single or multiple transportation modes but are not transport infrastructure providers or public transport providers. The comparison of mode choices and the impact of these choices on the net sustainability remains challenging [30] (p. 5).
The next sustainability benchmark is the Dow Jones Sustainability Index (DJSI), created in 1999 for companies and investors who integrate sustainability considerations into their portfolios. It is weighted by means of different corporate economic, environmental and social performance criteria in relation to 34% and 27% to 39%, respectively, for transportation and transportation infrastructure as an industry [32] (p. 57). The DJSI is based on the Global Industry Classification Standard (GICS) and covers all 24 GICS industry groups. Unlike the GISC, the DJSJ considers transportation within two industries: airlines (AIR), transportation and transportation infrastructure (TRA).
In 2003, the Carbon Disclosure Project (CDP) was set as a non-profit charity organization in the United Kingdom to support companies (or cities) by disclosure of their environmental and natural resources impact by collecting data through questionnaires for twelve sectors [33]. For climate change, the transport services sector includes LSPs, using vehicles across the five modes (also called “technologies”): aviation, light and heavy duty vehicles, shipping and rail [33]. All six frameworks in Figure 5 are compared in terms of their extent of coverage of transport industry, actuality, mode orientation, linkages to each other in case of application, the application of greenhouse gas (GHG) protocols and sustainability dimensions.
Taking all six reporting initiatives together, four offer indicators for all three dimensions of sustainability for LSPs: GC, ISO 26000, GRI and DJSI. The ISO 26000 framework names many issues interconnected with the economic and environmental dimensions of sustainability for the presented seven core subjects. The CDP does not encompass any social dimension. The third dimension of sustainability of FTSE is called “governance”, but it is comparable with the economic dimension of other frameworks. The SDGs are directly named solely in the UN Global Compact framework. Considering the similarities and differences of the frameworks listed above and the number of mentions, focus areas for each dimension of sustainability are shown in Figure 6, sorted by number of mentions in descending order.
As shown in Figure 6, responsible political involvement or tax transparency are most frequently included into the economic dimension (90%) in the frameworks without SDGs. Climate-related risk, crisis management and customer relation management (also customer attractiveness) are listed in 60% of the initiatives. Anti-corruption acts as an indicator in two of five initiatives. The GRI assigns bribery and corruption to the social dimension of sustainability. To continue with the environmental sustainability, its indicators are led by efficient use of resources such as water, energy and land (100%), followed by climate change mitigation, adoption and protection or impacts on biodiversity (60% each). Social sustainability is measured through labour practices in all initiatives: health, safety, security, human capital development and talent attraction and retention. Human rights and customers are in the focus of 75% of initiatives in terms of their social sustainability.

4. Evidence-Based Actions on How to Enhance Performance

This section gives an overview of literature search, selection and analysis. At first, the performance components regarding different dimensions of sustainability and their focus areas (as it was shown in Section 2) are derived from qualitative and quantitative studies. Secondly, decisive, evidence-based capabilities for sustainability performance of LSPs will be outlined and enriched using (not evidence-based) proposals from the qualitative studies following the mixed methods convergent design.
Having used the pearl technique, two strings are built using operators “OR” and an asterisk (“*”) to broaden the search for “performance” and “logistics”, respectively:
  • perform* OR efficien* OR productiv* OR effective*
  • logist* OR suppl* OR transp*.
These strings were combined with the operator “AND” in order to narrow the search and identify only the publications which encompass any of the searching terms from each string. The searching terms of the “performance” string could be anywhere in a publication (e.g., title, main text) to broaden the search. The searching terms of the “logistics” string were limited to the abstract in order to narrow the search. The author selected only papers published between January 2015 and April 2018 and available at the State University Library of the University of Bremen except for the so-called “backfiles” offered by Emerald. Unfortunately, Emerald Insight does not allow filtering the field “type” in the advanced search and offers only two possibilities to narrow the search by selecting either the category “articles/chapters” or “case studies”. Altogether, 3648 matches were manually uploaded as an RIS-group file to Endnote.
The literature review has three steps as shown in the rhombuses of Figure 7: screening of titles and abstracts, full document screening of the remaining 166 articles and an in-depth review of 44 articles. In the second step, two articles’ summaries were included, so that 168 original articles were viewed. The in-depth review took place by coding with the software MAXQDA. The articles of the in-depth review are distributed in 17 peer-reviewed journals. Each literature review step considers five exclusion criteria, shown in the left of Figure 7. The geographical area is limited only for the empirical evidence so that it comes from at least one advanced economy following the classification of the International Monetary Fund [34].
The literature analysis follows one of three possible mixed methods designs: the results of the quantitative and the qualitative data analysis are combined, having placed equal weight on both forms of data. Following this convergent design qualitative and quantitative data are regarded as concurrent to each other and compared after analysis to assess in what ways the results converge and diverge.
In order to identify the evidence-based capabilities to enhance the sustainability performance, performance components were searched from the view of LSP and derived after the in-depth analysis of six quantitative and five qualitative studies: financial component, effectiveness (customer orientation), cost efficiency, new knowledge, alignment to environment, social equality, environmental responsibility and logistics service quality. The comparison of qualitative and quantitative studies shows a strong corroboration of results: the economic dimension of sustainability performance (customer orientation and financial indicators) is the most frequently addressed component of performance, followed by cost efficiency. Social and environmental components are underrepresented in qualitative and quantitative research designs. A clear link between performance components and sustainability dimensions was not given but assumed by the author. Logistics service quality is linked to all three facets of performance in terms of the consideration of customer preferences, including their expectations in terms of price, quality, environmental footprint or social responsibility of LSPs. Additionally, the ability to gain, apply and develop new knowledge is also connected to environmental performance (as responsiveness) or seen as the ability to enhance economic efficiency.
In the selected six quantitative studies [35,36,37,38,39,40] and five qualitative studies [41,42,43,44,45] as shown in Figure 8, different analysis techniques were used to investigate the effects on performance as dependent variables: structural equation modelling (SEM) in the half of the studies, linear modelling (e.g., regression analysis) and an analytical network process with a quality deployment function.
In order to collect the evidence-based capabilities necessary to enhance the sustainability performance components listed above, the understanding of the considered relationships between performance (as a dependent variable) and a range of independent variables is necessary. To do so, the notations of a path diagram to depict the structural equation models (SEM) were applied. For this purpose, five of six studies are compared in terms of underlining theoretical models in order to identify which assumed relationships are evidence-based confirmed. One of the studies of Lam and Dai [35] proposes a methodology of systematic metrics for the environmental sustainability of LSP in the context of green supply chain management without analyzing any effects of observed variables on performance.
In the remaining five quantitative studies [36,37,38,39,40], the most common data source was from LSPs, followed by logistics departments in the industry (251 answers). In addition, 187 shipping lines were focused on separately in one of the studies. The distribution is shown in Figure 8. Most of the data used to test the proposed effects on performance came from Europe.
In the following step, a range of evidence-based effects on performance, supported through the investigation of the primary data, will be triangulated with the proposed interrelations between LSP performance components and independent capabilities.
Five quantitative studies [36,37,38,39,40] confirmed positive effects of the capabilities on the components of performance as independent variables. These capabilities are shown in Figure 8. Thus, innovativeness, absorptive capacity, organizational resilience and compliance of supply chain (SC)-risks, level of the market- and firm-specific knowledge and customer interaction are evidence-based capabilities promoting performance. Knowing customers’ requirements and collecting necessary information about competitors are two capabilities that enhance market orientation as a performance component. The financial performance is positively influenced by resources sharing through SC-integration, IT-application and environmental collaboration in an SC. The only evidence for the positive effects on operational performance is given through the wide-defined capability of “operational skills” and LSP-related metrics. Following the mixed methods convergent research design, the insights of the qualitative studies are asterisked in Figure 9. The convergence in terms of performance components is high. The focus of qualitative studies is mainly on the interrelations between performance components or components’ metrics. Two qualitative studies concentrate on the capabilities “innovativeness” and “customer interaction”, as it is asterisked in Figure 9, so that only these two capabilities are corroborated in quantitative and qualitative studies. Noticeable points of interface between qualitative and quantitative studies are the components and performance metrics. The divergence of these intersection points occurs because quantitative studies mainly use metrics to test the effects of capabilities, whilst qualitative studies help to understand the interrelations between performance components.

5. Concluding Remarks

This paper addresses transport-related frameworks on sustainability and evidence-based capabilities as indicators of sustainability-oriented performance. These are helpful for managerial actions to enhance logistics performance along global maritime chains. Based upon the sustainability perspectives presented and discussed in the paper, a set of concluding remarks can be made:
  • Sustainability is considered in maritime logistics. However, there is less accordance in terms of what to focus on for LSPs if they address the outlined sustainability frameworks. Furthermore, all non-UN-frameworks lack in addressing and linking to SDGs. No sustainability framework offers a minimum list on which criteria for each sustainability dimension to focus on for LSPs.
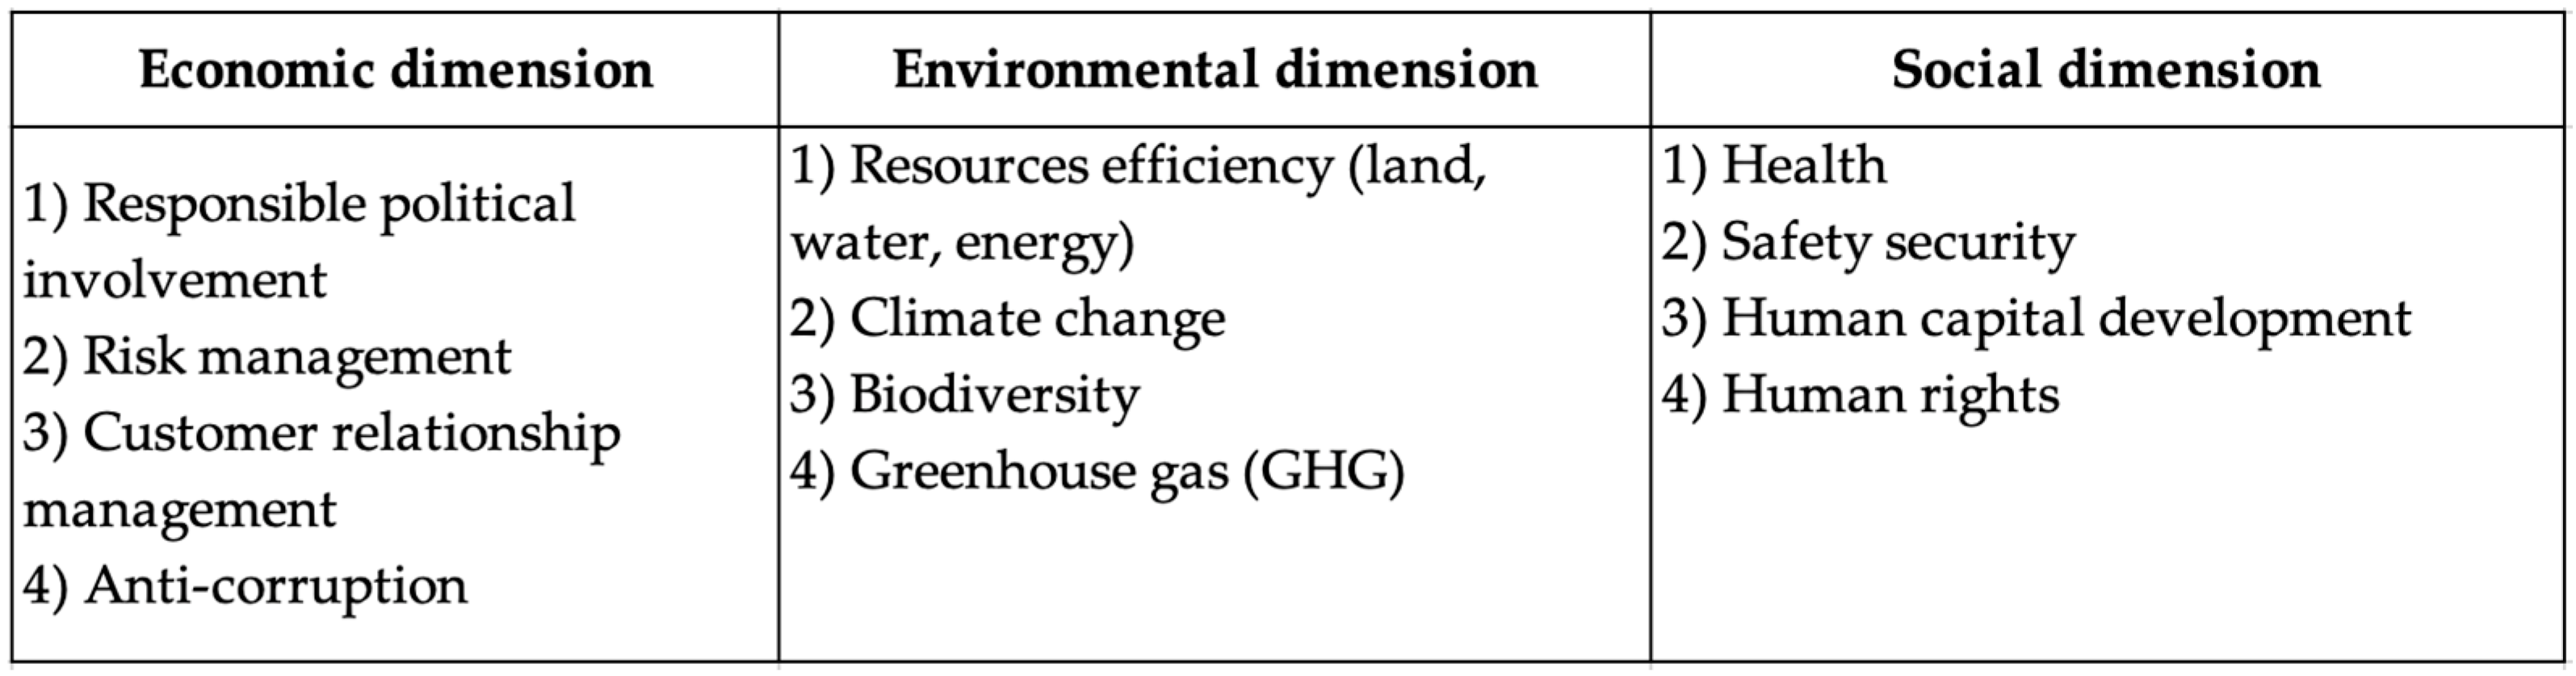
  • The positive influence of considering sustainability is confirmed in the selected quantitative studies showing the collected evidence to analyze the empirical data about LSP in advanced economies. The evidence-based influence of considering environmental and social dimensions of sustainability is underrepresented in qualitative and quantitative studies. The identified focus areas for each sustainability dimension in the literature differ from those of sustainability frameworks.
  • The convergence between quantitative and qualitative studies in terms of the identified components of performance is high. The points of interface of qualitative and quantitative studies are components of performance and the proposed metrics. Different aspects of the same topic (points of unexplained divergence) occur since quantitative studies test the effects of capabilities on performance, while qualitative studies track the relations between performance components.
The proposed capabilities for social and environmental sustainability are very heterogenous and therefore is encouraged to be considered in future research. An overview on the different metrics of decisive capabilities for sustainable-oriented performance may provide further insights into sustainable maritime logistics. Finally, the addressing of SDGs in the form of case studies, or risks assessments by non-consideration, are to be explored for global maritime supply chains.

Funding

Publication enabled by IU International University of Applied Sciences.

Institutional Review Board Statement

Not applicable.

Informed Consent Statement

Not applicable.

Conflicts of Interest

The author declares no conflict of interest.

References

  1. World Trade Organization. WTO Lowers Trade Forecast as Tensions Unsettle Global Economy. 2019. Available online: https://www.wto.org/english/news_e/pres19_e/pr840_e.htm (accessed on 23 June 2021).
  2. OECD. OECD Economic Outlook, Interim Report March 2020. Available online: https://www.oecd-ilibrary.org/economics/oecd-economic-outlook/volume-2019/issue-2_7969896b-en (accessed on 23 June 2021).
  3. International Transport Forum. ITF Transport Outlook 2019; OECD Publishing: Paris, France, 2019; Available online: https://www.itf-oecd.org/itf-transport-outlook-2019 (accessed on 23 June 2021).
  4. United Nations Conference on Transport and Development. Review of Maritime Transport 2019; United Nations: Geneva, Switzerland, 2019; Available online: https://unctad.org/en/PublicationsLibrary/rmt2019_en.pdf (accessed on 23 June 2021).
  5. Lee, E.-S.; Nam, H.-S.; Song, D.-W. Defining maritime logistics and its value. In Maritime Logistics: A Complete Guide to Effective Shipping and Port Management; Song, D.-M., Panayides, P.M., Eds.; Kogan Page: London, UK, 2012; pp. 9–21. [Google Scholar]
  6. Haasis, H.-D.; Elbert, R. Bringing regional networks back-into global supply chains: Strategies for logistics service providers as integrators of logistic clusters. In Global Logistics Management: Sustainability, Quality, Risks; Kersten, W., Blecker, T., Flämig, H., Eds.; Erich Schmidt: Berlin, Germany, 2008; pp. 21–31. [Google Scholar]
  7. Porter, M.E. The Competitive Advantage of Nations: With a New Introduction; Palgrave: Basingstoke, UK, 2007. [Google Scholar]
  8. Pouder, R.; St. John, C.H. Hot sports and blind spots: Geographical clusters of firms and innovation. Acad. Manag. Rev. 1996, 21, 1192–1225. [Google Scholar] [CrossRef]
  9. Markusen, A. Sticky Places in Slippery Space: A Typology of Industrial Districts. Econ. Geogr. 1996, 72, 293. [Google Scholar] [CrossRef]
  10. Brandenburger, A.M.; Nalebuff, B. The Rules of Coopetition. Harv. Bus. Rev. 2021, 99, 48–57. [Google Scholar]
  11. Dovbischuk, I.; Haasis, H.-D. Path dependency in the process of sustainable regional development of transport and logistics regions: Solutions for sea ports. In Dynamics and Sustainability in International Logistics and Supply Chain Management; Ivanov, D., Kopfer, H., Haasis, H.-D., Eds.; Springer: Göttingen, Germany, 2011; pp. 241–247. [Google Scholar]
  12. Bird, J. Seaports and Seaport Terminals; Hutchinson University Library: London, UK, 1971. [Google Scholar]
  13. Hayuth, Y. The Port-Urban Interface: An Area in Transition. Area 1982, 14, 219–224. [Google Scholar]
  14. Hoyle, B.S. Development dynamics at the port-city interface. In Revitalizing the Waterfront: International Dimensions of Dockland Development; Hoyle, B.S., Pinder, D.A., Husain, S.M., Eds.; Belhaven Press: London, UK, 1988; pp. 3–19. [Google Scholar]
  15. Hayuth, Y. Inland container terminal-function and rationale. Marit. Policy Manag. 1980, 7, 283–289. [Google Scholar] [CrossRef]
  16. Notteboom, T.E.; Rodrigue, J.-P. Port regionalization: Towards a new phase in port development. Marit. Policy Manag. 2005, 32, 297–313. [Google Scholar] [CrossRef]
  17. Merk, O. The Competitiveness of Global Port-Cities: Synthesis Report; OECD Regional Development Working Papers; OECD Publishing: Paris, France, 2013. [Google Scholar] [CrossRef]
  18. Hoyle, B.S.; Pinder, D.A. Cityport Industrialization and Regional Development: Spatial Analysis and Planning Strategies; Pergamon Press: Oxford, UK, 1981. [Google Scholar]
  19. World Commission on Environment and Development [Brundtland Commission]. Our Common Future; Oxford University Press: Oxford, UK, 1987. [Google Scholar]
  20. Carlowitz, H.C.V. Sylvicultura Oeconomica; TU Bergakademie: Freiberg, Germany, 1713. [Google Scholar]
  21. Meadows, D.H.; Meadows, D.L.; Randers, J.; Behrens, W.W., III. The Limits to Growth; Universe Books: New York, NY, USA, 1972. [Google Scholar]
  22. United Nations. Transforming Our World: The 2030 Agenda for Sustainable Development; Resolution Adopted by the General Assembly on 25 September 2015; Seventeenth Session; A/RES/70/1. 2015. Available online: https://sustainabledevelopment.un.org/content/documents/21252030%20Agenda%20for%20Sustainable%20Development%20web.pdf (accessed on 23 June 2021).
  23. High-Level Advisory Group on Sustainable Transport. Mobilizing Sustainable Transport for Development, United Nations. 2016. Available online: https://sustainabledevelopment.un.org/content/documents/2375Mobilizing%20Sustainable%20Transport.pdf (accessed on 23 June 2021).
  24. FRAUNHOFER Working Group for Supply Chain Services. Nachhaltigkeitsindex für Logistikdienstleister; Fraunhofer-Institut für Integrierte Schaltungen: Nürnberg, Germany, 2011. [Google Scholar]
  25. UN Global Compact. United Nations Global Compact Progress Report: Business Solutions to Sustainable Development. 2017. Available online: https://www.unglobalcompact.org/library/5431 (accessed on 23 June 2021).
  26. UN Global Compact. Blueprint for Business Leadership on the SDGs. 2017. Available online: https://www.unglobalcompact.org/library/5461 (accessed on 23 June 2021).
  27. Financial Times Stock Exchange. FTSE4Good 15 Year Anniversary Report. London Stock Exchange Group. 2017. Available online: https://content.ftserussell.com/sites/default/files/support_document/ftse4good_15_year_anniversary_report_april_2017.pdf (accessed on 23 June 2021).
  28. ISO. ISO 26000 and the International Integrated Reporting. Framework Briefing Summary. 2015. Available online: https://www.iso.org/files/live/sites/isoorg/files/store/en/PUB100402.pdf (accessed on 23 June 2021).
  29. International Organization of Standardization. ISO 26000: Guidance on Social Responsibility. Discovering ISO 26000. 2014. Available online: https://www.iso.org/files/live/sites/isoorg/files/store/en/PUB100258.pdf (accessed on 23 June 2021).
  30. Global Reporting Initiative. GRI Logistics and Transportation Sector Supplement; Pilot Version 1.0.; Global Reporting Initiative: Amsterdam, The Netherlands, 2006. [Google Scholar]
  31. Global Reporting Initiative. Enabling Smart Policy: The Role of GRI Standards. Global Reporting Initiative. 2016. Available online: https://www.globalreporting.org/resourcelibrary/Enabling%20Smart%20Policy_The%20role%20of%20GRI%20Standards_Web.pdf (accessed on 23 June 2021).
  32. ROBECO Sustainable Asset Management. RobecoSAM Corporate Sustainability Assessment 2017. Criterion Weights by Robeco SAM Industry. 2017. Available online: http://www.robecosam.com/images/RobecoSAM_Corporate_Sustainability_Assessment_Weightings_2017.pdf (accessed on 23 June 2021).
  33. CDP. List of CDP Activity Classification System (CDP-ACS). 2019. Available online: https://www.cdp.net/en/guidance/guidance-for-companies (accessed on 23 June 2021).
  34. International Monetary Fund. Country Composition of World Economic Outlook Groups. 2017. Available online: http://www.imf.org/external/pubs/ft/weo/2017/01/weodata/groups.htm (accessed on 23 June 2021).
  35. Lam, J.S.L.; Dai, J. Environmental sustainability of logistics service provider: An ANP-QFD approach. Int. J. Logist. Manag. 2015, 26, 313–333. [Google Scholar] [CrossRef]
  36. Bellingkrodt, S.; Wallenburg, C.M. The role of customer relations for innovativeness and customer satisfaction: A comparison of service industries. IJLM 2015, 26, 254–274. [Google Scholar] [CrossRef]
  37. Bühler, A.; Wallenburg, C.M.; Wieland, A. Accounting for external turbulence of logistics organizations via performance measurement systems. Supply Chain Manag. Int. J. 2016, 21, 694–708. [Google Scholar] [CrossRef] [Green Version]
  38. Laari, S.; Solakivi, S.; Töyli, J.; Ojala, L. Performance outcomes of environmental collaboration: Evidence from Finnish logistics service providers. Balt. J. Manag. 2016, 11, 430–451. [Google Scholar] [CrossRef]
  39. Lee, E.-S.; Song, D.-W. The effect of shipping knowledge and absorptive capacity on organizational innovation and logistics value. IJLM 2015, 26, 218–237. [Google Scholar] [CrossRef]
  40. Tseng, P.-H.; Liao, C.-H. Supply chain integration, information technology, market orientation and firm performance in container shipping firms. Int. J. Logist. Manag. 2015, 26, 82–106. [Google Scholar] [CrossRef]
  41. Kilibarda, M.; Nikolicic, S.; Andrejic, M. Measurement of logistics service quality in freight forwarding companies: A case study of the Serbian market. IJLM 2016, 27, 770–794. [Google Scholar] [CrossRef]
  42. Lam, J.S.L.; Dai, J. Developing supply chain security design of logistics service providers: An analytical network process-quality function deployment approach. Int. J. Phys. Distrib. Logist. Manag. 2015, 45, 674–690. [Google Scholar] [CrossRef]
  43. Tontini, G.; Söilen, K.S.; Zanchett, R. Nonlinear antecedents of customer satisfaction and loyalty in third-party logistics services (3PL). Asia Pac. J. Mark. Logist. 2017, 29, 1116–1135. [Google Scholar] [CrossRef]
  44. Wong, W.P.; Soh, K.L.; Le Chong, C.; Karia, N. Logistics firms performance: Efficiency and effectiveness perspectives. Int. J. Prod. Perform. Manag. 2015, 64, 686–701. [Google Scholar] [CrossRef]
  45. Yang, C.-C. Leveraging logistics learning capability to enable logistics service capabilities and performance for international distribution center operators in Taiwan. Int. J. Logist. Manag. 2016, 27, 284–308. [Google Scholar] [CrossRef]
Figure 1. Global maritime supply chains (own illustration).
Sustainability 13 08040 g001
Figure 2. Actors in the port context. Source: following [11] (p. 243).
Sustainability 13 08040 g002
Figure 3. SDGs related to transport (own illustration following [23] (p. 11)).
Sustainability 13 08040 g003
Figure 4. Reporting initiatives as sustainability frameworks (own illustration).
Sustainability 13 08040 g004
Figure 5. Sustainability reporting frameworks (own illustration). Note: − (no), + (yes).
Sustainability 13 08040 g005
Figure 6. Focus areas of sustainability dimensions (own illustration).
Sustainability 13 08040 g006
Figure 7. Literature selection (own illustration) * exclusion criteria.
Sustainability 13 08040 g007
Figure 8. Focused empirical data and selected studies (own illustration).
Sustainability 13 08040 g008
Figure 9. Performance components and capabilities (own illustration).
Sustainability 13 08040 g009
Publisher’s Note: MDPI stays neutral with regard to jurisdictional claims in published maps and institutional affiliations.

