1. Introduction
Cities are in close contact with the outside through various flows, such as information, human migration, logistics, and capital flows [
1]. Traditional urban interaction is dominated by tangible elements such as human migration and logistics, while information is comparatively less important. With the rapid development of information and communication technologies, society has marched into the information age. Information flow, due to its timely, convenient, and spatially unconstrained transmission, not only makes spatio-temporal interaction more flexible, frequent, and close [
2], but also plays an important role in facilitating the generation and movement of other types of flow, such as innovation, industry, economy, and talents [
3]. Through such close interaction, cities will gather together and become an indivisible and efficiently functioning spatial unit. Thus, information flow becomes increasingly important in urban interaction and regional integration promotion [
4]. Undoubtedly, studying urban information flows is the foundation for analyzing complex city interaction patterns and also the key to the comprehensive understanding of the urban spatial structures.
Researchers have carefully studied the spatial patterns of information flows [
5,
6,
7]. However, the mechanism of an information flow’s formation have not been explored. As a matter of fact, since cities are communicating with each other, information flows are consequently in an interactive state as well, so that the formation of flow in a certain region is not only impacted by its internal factors, but also factors from its surrounding regions. Hence, it is necessary to analyze this spillover effect of information flows. Studies have already proved that elements such as economy, technology, and knowledge display strong spillover effects, which can significantly promote coordinated development in a region [
8,
9,
10]. Compared to other elements, information has greater spreading and diffusion ability, which gives more reasons why its spillover effects and impacts cannot be ignored [
11].
Moreover, China has been making great efforts to promote urbanization and regional integration. Building coordinated urban agglomerations and developing sustainably is now the new demand. Therefore, to study information spillover effects at an urban agglomeration scale, which is the most important basis for achieving these goals, deserves remarkable attention.
To sum up, the aim of this study was to research on the spillover effects and influencing factors of urban information flow in urban agglomerations, so as to provide a theoretical basis for sustainable urban growth.
The structure of this paper is organized as follows.
Section 2 summarizes the related literature.
Section 3 describes the methodology.
Section 4 introduces the study area and data source.
Section 5 analyzes the empirical results to reveal the spillover effects and influencing factors of information flows.
Section 6 provides the discussion including policy implications.
Section 7 sets out the conclusions.
2. Literature Review
Existing studies on urban information flows have mainly focused on depicting the structural characteristics of urban information networks, which help to analyze hierarchical structures of urban systems. The information network can be formed by different carriers, such as mail records [
12], fixed-line telephone call durations [
13], Weibo followers [
14], Douban events [
15], the Baidu Search Index [
5,
7,
16], and so on. It can be found from these studies that the urban structural characteristics vary with different information flow carriers. Comparably, the Baidu Search Index is easier to access, meanwhile it has long time-series data and unified standards [
17]. Therefore, it has greater potential of application in scientific researches. Moreover, these studies have suggested that the structures of information networks and cities are correlated at a certain level, although they are not completely the same. The above studies can help us better understand urban information flows and attach greater importance to information construction and development. However, spillover effects and influencing factors of urban information flow have not been studied.
The key to analyzing the spillover effects of information flows is finding an appropriate quantification method. Scholars have proposed various methods based on their different perceptions of spillover. Capello [
18] and Yan and An [
19] considered spillover as the extent to which the development of a region is influenced by other regions and constructed a spillover index to measure development intensity of spillover effects, based on the correlation between the development situations of regions. Carlino and Defina [
20] and Gabauer and Gupta [
21] interpreted spillover as a region’s response to the change from another region. They first used the vector autoregressive model to simulate the urban development situation, and then analyzed the spillover effect through the generalized impulse response method. Although the above two methods are easy to implement, they ignore the spatial effects of spillover. Anselin [
22] took spatial dependence and heterogeneity into account from the perspective of spillover externalities and put forward the spatial econometric model to analyze spillover effects. This model measures the spillover effects by calculating the partial regression coefficient, i.e., the partial derivative of the response variable on the explanatory variable. This coefficient is then decomposed into direct and indirect effects, the latter of which is used to reflect the spillover effects. This spatial econometric model can not only quantify the spillover of flows, but also explore the potential factors affecting the flows to some extent, which may lead to further understandings of its nature. Therefore, this method has been widely used in studies of spillover effects. However, this model ignores the fact that flows are influenced by both their origin and destination characteristics at the same time, which is instead considered in the gravity model. Nevertheless, the gravity model assumes that all flows are mutually independent [
23,
24], which is, however, not applicable to the information flow with strong spatial dependence. To solve this problem, Lesage, the spatial econometrician, integrated the above two models and proposed the spatial econometric interaction model as a new method for analyzing the spillover effects of flows [
25]. This model has already been applied to spillover effects of regional migration [
26,
27] and logistics flows [
28] with reasonable results, but whether it is suitable for information flows has not yet been proved. Different from migration and logistics flows, the movement of information flows are not constrained by geographic space. Further research is thus needed to analyze the spillover effects of information flows using the spatial econometric interaction model.
The spillover effects show significant differences on different scales, such as at the prefectural level, provincial level, or urban agglomeration level [
29,
30,
31]. Urban agglomeration is a highly developed spatial form of integrated cities and is one of the most important carriers for global economic development [
32,
33,
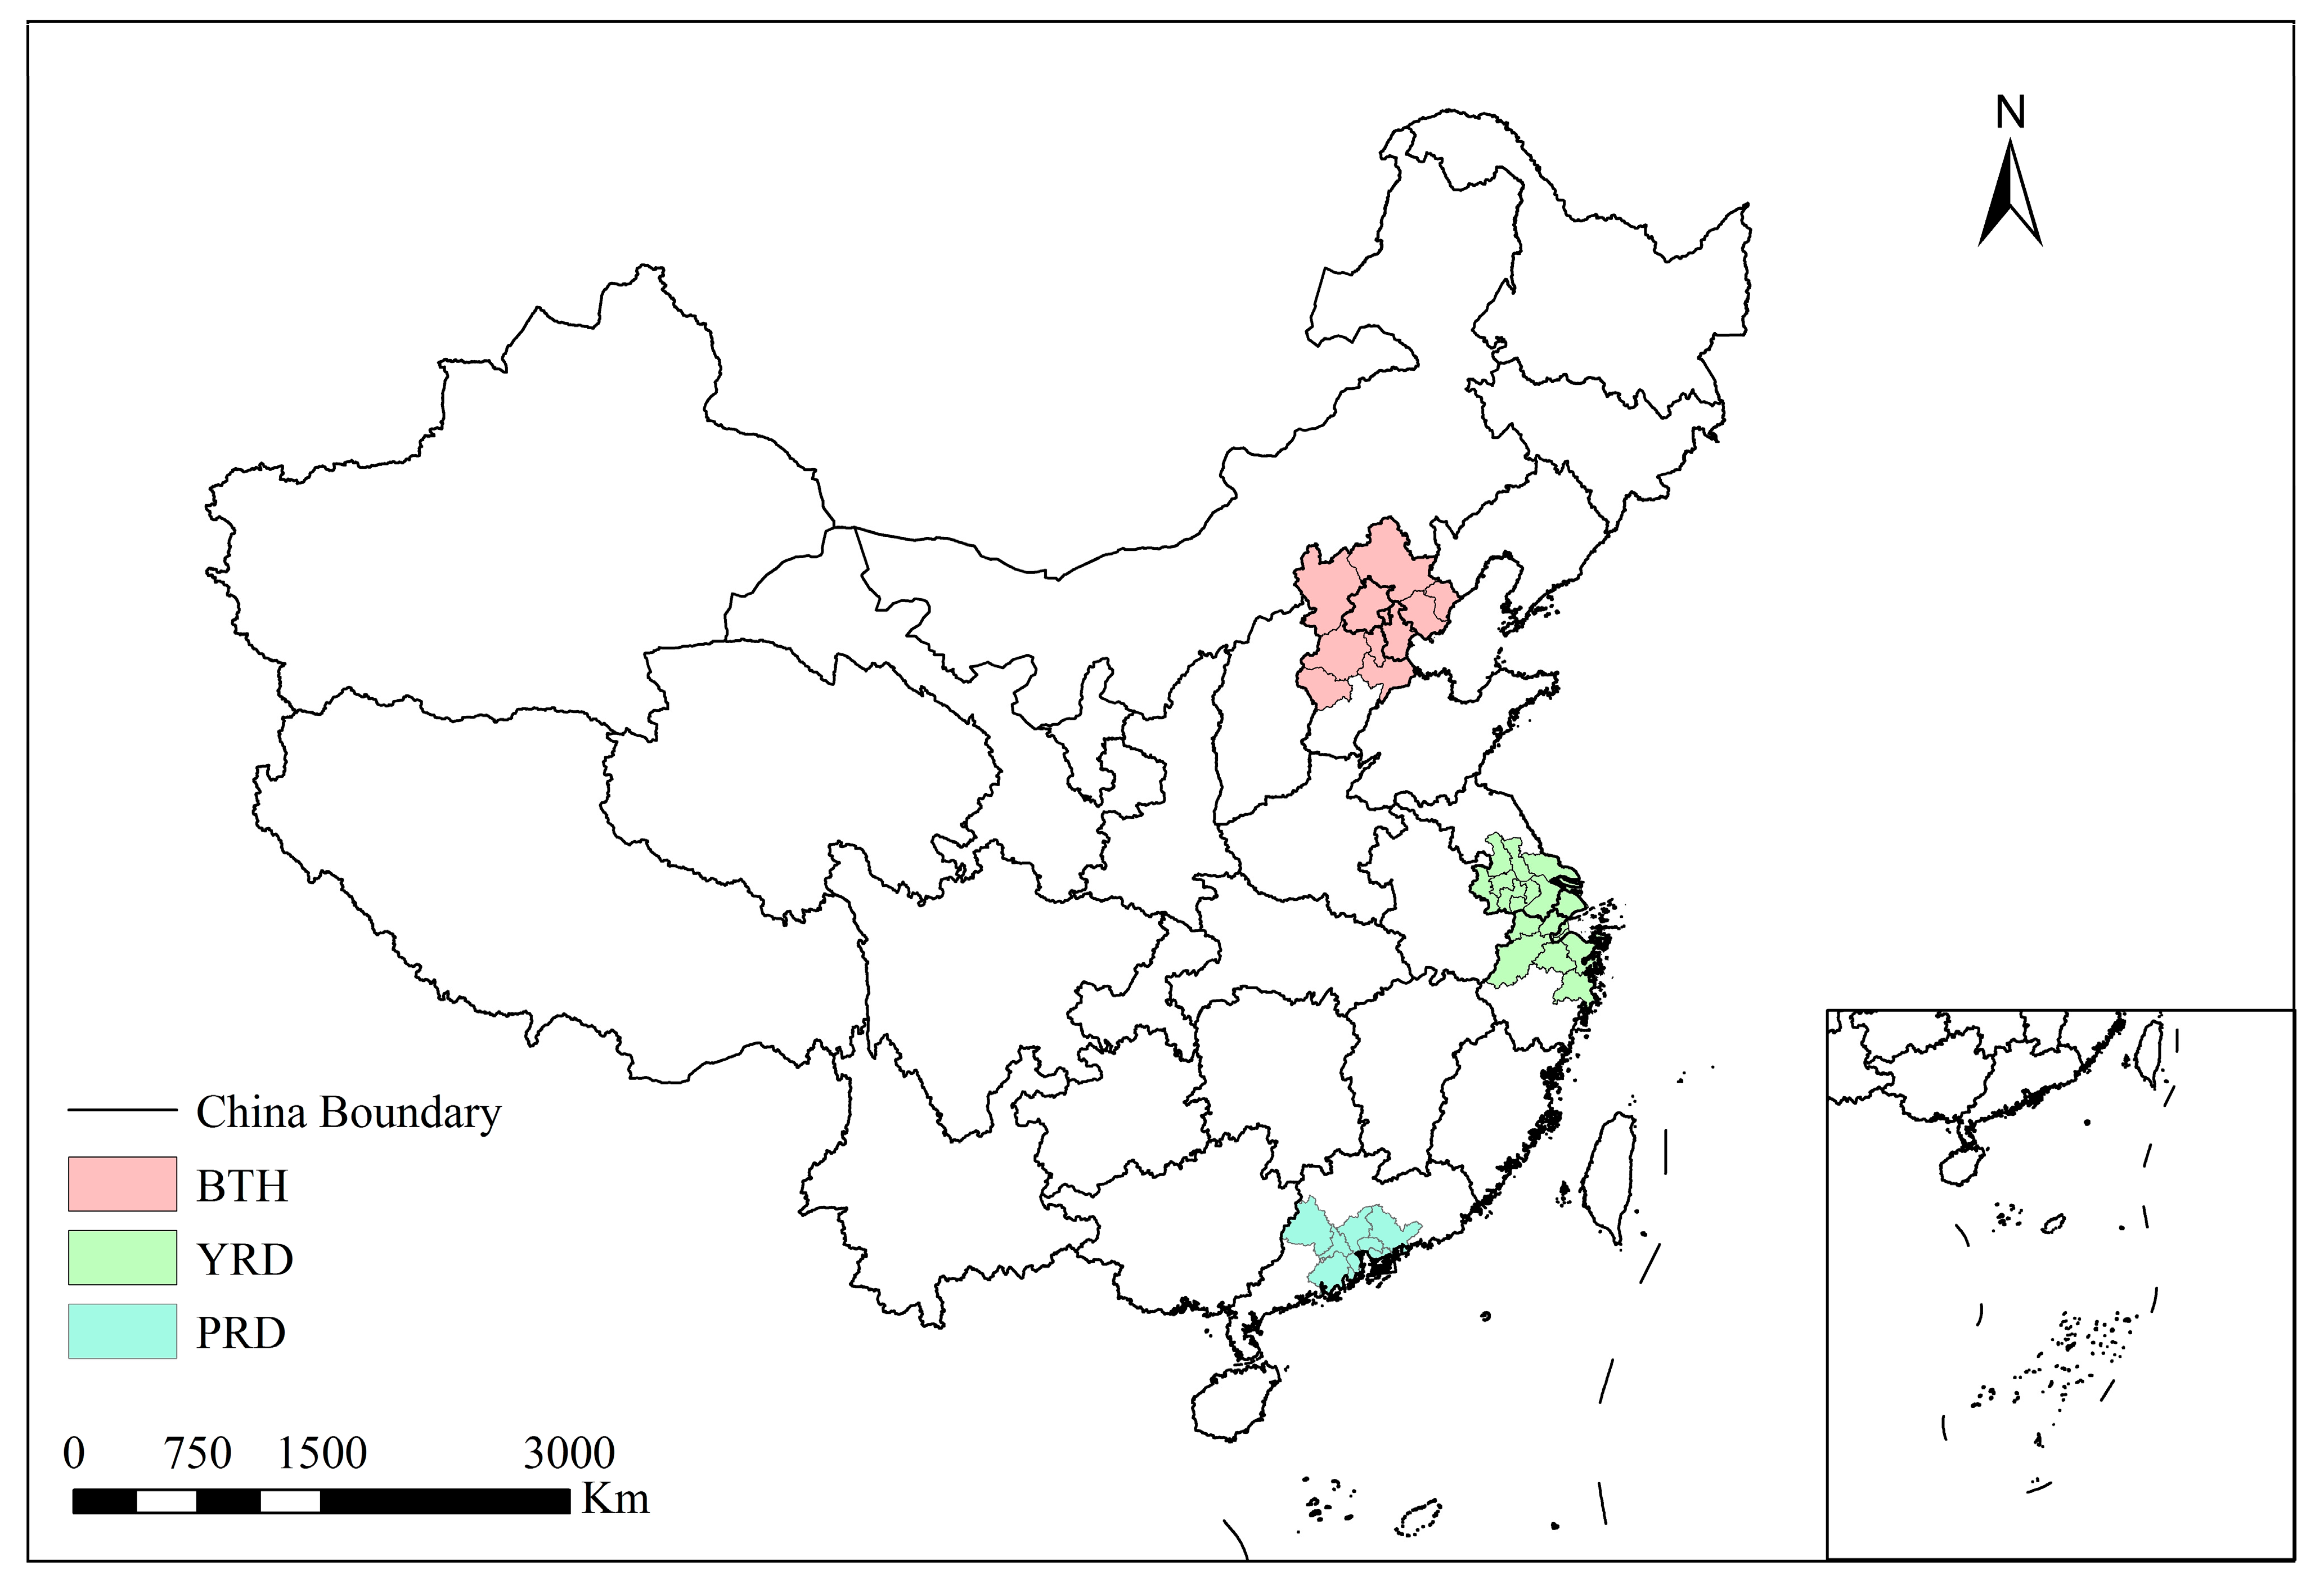
34]. China has taken the urban agglomerations as the main body to build an urban pattern with the coordinated development of large and medium-sized cities and small towns in recent years. The Beijing–Tianjin–Hebei urban agglomeration (BTH), Yangtze River Delta urban agglomeration (YRD), and Pearl River Delta urban agglomeration (PRD) are the most developed urban agglomerations in China, which contribute up to 40% of the Chinese GDP. They have aggregated innovation factors, large population density, strong industrial competitiveness, and high economic efficiency. They are bearing the responsibility of building world-class urban agglomerations, as well as leading high-level urban agglomeration construction in China. These three are highly representative among all the urban agglomerations in China. Thereby, we conducted our study at the urban agglomeration scale and selected these three major urban agglomerations as our study area to study spillover effects of information flows and their causes.
The above-mentioned studies have not yet paid much attention to the information flows, let alone to exploring the mechanisms of their formation or to finding an appropriate method to quantify the effect from the spillover and influencing factors. To fill this gap in knowledge, this study contributes to the literature by proposing a new framework for studying the spillover effects and influencing factors of information flows. Using the Baidu Search Index to characterize information flow intensity among cities, we developed a spatial econometric interaction model and applied it to the three major urban agglomerations in China. This study has important implications on the coordinated and sustainable development of information flows in urban agglomerations.
3. Methodology
The spatial econometric interaction model, compared with the traditional spatial econometric model, is more suitable for analyzing the spillover effects of flows, since it considers the characteristics that flows are influenced by both their origins and the destinations. However, this model has not yet been applied to the study of information flows. Therefore, this study aimed to construct the spatial econometric interaction model of information flows (SIM-IF), and, based on this, analyze the spillover effect of information flows and its influencing factors. The method consisted of four main steps: (1) determining the spatial dependence mode of information flows, (2) testing spatial autocorrelation, (3) constructing the SIM-IF, and (4) analyzing spillover effects and influencing factors of information flow. The details are described in the following sections.
3.1. Spatial Dependence of Information Flow Determination
According to Chun’s [
35] definition, there are three different specifications regarding spatial dependence of flows (
Figure 1), namely origin-based dependence, destination-based dependence, and origin-destination-based dependence. When the flow from origin A to destination Z increases, there is origin-based dependence if the flow from the neighboring origins (B, C) to destination Z also increases; there is destination-based dependence if the flow from origin A to the neighboring destinations (X, Y) also increases; and there is origin-destination-based dependence if both the above situations occur. The information flow is generally affected by both the places where the information is sent and received; thereby, we applied the origin–destination-based dependence [
36] (denoted as
Ww) in this study. Its expression is given in Equation (1):
where
W is the spatial weight matrix of the region and
is the Kronecker sum, and
Wo and
Wd denote the origin-based dependence and destination-based dependence of information flows, respectively. Their expressions are given in Equations (2) and (3):
where
In is the
n ×
n identity matrix, with
n being the number of cities within the urban agglomerations and
being the Kronecker product.
In order to further quantify
Ww, the spatial weight matrix
W needed to be determined. However, whether information flow is constrained by the geographic space or not is still under debate. Some scholars have argued that information transmission is weakly restricted by geographic space and the spatial weight matrix for cyberspace needs to be considered [
37]. In this study, we analyzed both types of spatial weight matrix. The geographic spatial weight matrix
is constructed based on the geographic adjacency of two regions, with its element described in Equation (4), while the cyber spatial weight matrix
is constructed based on the hypothesis that regions with closer information amount interact more in the cyberspace [
38], with its element described in Equation (6):
where
i and
j represent different cities in the city agglomerations;
i,
j = 1, 2, 3, …,
n;
and
represent the impact of city
i on city
j in the geographic and cyber spatial weight matrix, respectively;
is the impact of city
i on city
j in year
t in cyberspace;
T is the period in our study; and
and
denote the total information amount in city
i and city
j in year
t, respectively.
By applying the spatial weight matrices determined by Equations (4) and (5) to Equation (1), we could then obtain the spatial dependence expression under both circumstances, which is shown in Equation (7).
3.2. Spatial Autocorrelation Tests
The Global Moran’s I can measure spatial autocorrelation well and is easy to calculate. Therefore, we calculated the Global Moran’s I [
39] by Equation (8), with the spatial dependence determined by Equation (7), and further analyzed the spatial autocorrelation of information flows under different spatial dependence.
where
k denotes the number of information flows between cities (
k =
n × (
n − 1));
Wij,uv is the element in the matrix
Ww and represents the impact of flow from city
i to city
j on flow from city
u to city
v under origin–destination-based dependence;
xij and
xuv represent the amounts of these two flows reflected by the Baidu Search Index; and
is the average amount of the information flows.
3.3. Construct Spatial Interaction Model for Information Flows (SIM-IF)
Since information flows are spatially autocorrelated, we used the extended panel data model [
40] to construct the spatial econometric interaction model for information flows (SIM-IF) in this study, as shown in Equation (9):
where
denotes the information flow from origin to destination in year
t;
Ww denotes the spatial weight matrix of geographic or cyberspace under origin–destination-based dependence; ρ denotes the spatial dependence effect of information flows, i.e., the spillover effect on certain information flows from their neighboring information flows;
Xot and
Xdt are the explanatory variables of the flow’s origin and the destination in year
t;
is the geographic or information distance between the origin and destination of the flow in year
t;
and
θ are the coefficients of the corresponding explanatory variables; and
is the error term following the standard normal distribution. The response and explanatory variables in the model are log-transformed according to Lesage [
40].
The log-likelihood for the model was then calculated under both the geographic and cyberspace weight matrix. The matrix with a larger log-likelihood was then chosen for subsequent analysis. Based on the determined matrix, parameters of the SIM-IF were obtained through maximum likelihood estimation [
40,
41], since the commonly used least squares method is no longer applicable to models with spatial dependence.
3.4. Analyze Spatial Spillover Effects and Influencing Factors of Information Flows
According to the spatial econometric theory, there are two types of spillover effects of information flow in the SIM-IF constructed in
Section 3.3. The first type is the spillover effect on a certain information flow from its neighboring flow, which can be represented by the coefficient ρ in Equation (9). The second type is the spillover effect on a certain information flow from the explanatory variables of its neighboring flow, which is estimated by calculating partial derivative of the information flow with respect to the explanatory variables. The total effect consequently obtained can then be decomposed into the direct effect and the indirect effect. The direct effect refers to the impact of the explanatory variables of a certain information flow on its own, which also reflects the influencing factors of the information flow. The indirect effect, which refers to the impact from the explanatory variables of a certain information flow on its neighboring information flows, is the second type of spillover effect [
41]. Specific calculation steps for the second type of spillover effect and influencing factors of information flows are listed as follows.
Firstly, the explanatory variables of the information flow are denoted as
for simplicity, and the information flow
Y in year
t can be expressed as:
where
and
denote the explanatory variable
r and its coefficient, respectively.
Secondly, the partial derivatives of the information flow with respect to each explanatory variable are calculated. Then, the partial derivative matrix of the information flow with respect to the explanatory variable
r in year
t is calculated, as shown in Equation (11):
where
denotes the impact of the explanatory variable
r of the flow from city
u to city
v on the flow from city
i to city
j in year
t. The non-diagonal elements of the matrix measure the spillover effects, and the diagonal elements measure the direct effects. Then, the spillover and direct effects of the information flow in the whole region can be obtained by averaging the non-diagonal and the diagonal elements in the
matrix, respectively.
4. Study Area and Data
4.1. Study Area
As defined in the Beijing–Tianjin–Hebei Metropolitan Area Regional Plan, the Yangtze River Delta Regional Plan, and the Outline of the Plan for the Reform and Development of the Pearl River Delta (2008–2020), the BTH urban agglomeration is made up of 10 cities, including Beijing, Tianjin, and eight other cities located within Hebei province; the YRD urban agglomeration includes Shanghai, eight cities in Jiangsu Province, and seven cities in Zhejiang Province; the PRD urban agglomeration consists of nine cities in Guangdong Province. Detailed compositions and spatial distributions of each urban agglomeration are displayed in
Table 1 and
Figure 2, respectively.
4.2. Data Sources and Variable Selection
4.2.1. Dependent Variable
In this paper, we chose information flow constructed from the Baidu Search Index as the dependent variable. The Baidu Search Index, based on searches from Baidu users, sets keywords as the statistical objects and then calculates the weighted sum of the search frequency of each keyword in the search engine. It is divided into three categories including PC, mobile, and PC + mobile, according to the search devices used. The search index webpage provides three types of data, namely trend research, demand mapping, and crowd portraits for different applications. In trend research, users can set search time, search devices, and search location to obtain the amount of attention to the searched keywords, which can reflect the popularity of different keywords in different areas to a certain extent. A greater index value indicates more attention to the searched keyword. If we set one city as the keyword and another city as the searching origin, the Baidu Search Index can then reflect the attention paid from the searching origin city to the keyword city. The size and the direction of the search index can thereby reflect the intensity and direction of information interaction between the two cities.
In this study, we set one city as the keyword, representing the place where the information was received (destination), and another city as the place where the information was sent from (origin). The search device was set to PC + Mobile. Then the search index between two cities in the three major urban agglomerations was obtained. To guarantee data integrity, the Chinese character “city” was not included in the keyword, for example, “Beijing” instead of “Beijing City” was used during the search process. The search period was set as 1 January 2014 to 31 December 2019. The constructed information network of the three major urban agglomerations based on the Baidu Search Index is shown in
Figure 3, with the lines reflecting the Baidu Index between the cities.
4.2.2. Independent Variables
Existing studies have usually indicated that information flow is primarily affected by four major factors, specifically, the status of cities’ economic development, the effect of big events, the hierarchy of cities, and the distance between cities [
7]. A city’s economy supports its information infrastructure, and the status of its development largely determines the strength of information flows. Big events, such as conferences, exhibitions, and sports events, etc., have far-reaching impact on the city and will affect the information flows between the cities [
42]. The hierarchy of cities, which is the rank of cities in the regional scales, will affect the information flows between the cities since it may reflect different attractions and appeal of cities [
16].
Different studies may select different variables to characterize these factors. Based on comparative analysis results, we selected NPP-VIIRS nighttime light intensity (NTL), Baidu Media Index (event), weighted degree centrality (level), and geographic distance/information distance (distance) as explanatory variables to analyze the spillover effect of information flow and its influencing factors in our study. The same set of explanatory variables were chosen for both the “origin” and “destination” cities, otherwise, the estimation results would be biased [
25]. To distinguish the variables from both cities, “O_” or “D_” prefix have been added, denoted as, for example, O_NTL and D_NTL. The following part of this section will introduce detailed meanings of the explanatory variables, reasons for selecting them, as well as the data processing methods.
Nighttime light (NTL) intensity is the radiation brightness of ground light sources obtained by remote sensing platforms, which has a significant positive correlation with GDP, population, and other socio-economic statistical indicators [
43]. Unrestricted by administrative divisions, the NTL data can outperform traditional statistical data in various ways. This measure is often used to represent human socio-economic activity intensity at night and urban development situation. Compared with other NTL data products, the NPP-VIIRS product has comprehensive advantages in terms of spatial resolution, time series length, and radiation resolution. In this study, we selected the NPP-VIIRS monthly composite product for the same period as the Baidu Search Index (2014–2019). We removed outliers in the product by using Shi et al.’s method [
44] and obtained the average annual light intensity of each city, which is denoted as Equation (12).
where
n is the number of cities in the urban agglomeration.
Taking the year 2014 as an example, spatial distributions of the annual light intensity of the three major urban agglomerations are shown in
Figure 4.
The Baidu Media Index reflects the number of reports including the keywords collected by the Baidu News Channel from major internet media [
45]. It covers various major events such as sports events and cultural communication, and therefore is suitable for characterizing the effect of major events in cities. Since some outliers may lead to skewed data distribution, the annual median of the Baidu Media Index was adopted as the explanatory variable [
16], denoted as event.
The hierarchy of cities is often characterized by metrics describing the importance of nodes in a network, such as the degree centrality [
46]. Considering that the information flow is directional, the degree centrality for directed weighted networks is used to represent the hierarchy of a city in an information network [
47].
and
are the total amount of information flow received and sent by city
i, respectively, while
n is the number of cities in the urban agglomeration. The weighted degree centrality of city
i, denoted as
, can then be calculated using the following equations.
Distance is a common explanatory variable in flow research, with geographic distance being the most frequently used one. Some studies have used travel time, cost, economic distance, language distance, or cultural distance for different application problems [
48,
49,
50]. To date, studies have not reached a consensus regarding the influence of geographic distance and information distance on information flow. Therefore, both distances were used as explanatory variables in this study to analyze their influence on information flow, denoted by
dGij and
dIij, respectively. The geographical distance was defined as the shortest distance between government offices of cities obtained from the Baidu map. The information distance was measured by the absolute difference between the total information amounts between cities, which was calculated as follows.
where
dIij denotes the information distance between city
i and city
j, and
denotes the total information amount in city
i.
After the selection of variables, the specific expression for the SIM-IF can be obtained by substituting these above explanatory variables into Equation (9), as shown in Equation (18).
5. Results
5.1. Spatial Autocorrelation Analysis
Using the method described in
Section 3.1, we obtained the Global Moran’s I for information flows in the three major urban agglomerations, namely the BTH, the YRD, and the PRD, from 2014–2019 under the geographic and cyber spatial weight matrices, as well as their significance test results, as shown in
Table 2.
When analyzing the Moran’s I, it was found that the information flows of the three major urban agglomerations showed significant aggregation under both spatial weight matrices, i.e., strong flows were closer to strong flows and low flows were closer to low flows. In terms of the temporal dynamics of the spatial autocorrelation, information flows in the three major urban agglomerations were increasingly aggregated year by year, in general. For the information flow in the YRD, its spatial aggregation showed a steady upward trend, and the Moran’s I under geographic space and cyberspace increased from 0.323 and 0.457 in 2014 to 0.371 and 0.545 in 2019, respectively. As for the information flows of BTH and PRD, though slight fluctuations in the spatial aggregation were observed, the Moran’s I of both spatial weight matrices in 2019 were larger than those in 2014, indicating that the information flows were gradually forming a network of more aggregated connections. Among all the urban agglomerations, it was found that under the geographic space, information flows in the PRD were the most aggregated, while under the cyberspace, the flows in the YRD showed the most aggregation. This might show that information flows were more geographically related in the PRD, and were less spatially constrained in the YRD.
5.2. Application of SIM-IF
We applied the SIM-IF to the three major urban agglomerations and calculated the log-likelihood of the model under both the geographic and cyber weight matrix. The results are shown in
Table 3. It was found that the SIM-IF obtained a higher maximum likelihood under the geographic weight matrix for all the three major urban agglomerations. This indicates that the geographic weight matrix was more appropriate in this model and the spillover effects of information were more obvious in geographic space.
To further demonstrate the necessity for a spatial econometric interaction model, we estimated and tested the coefficients of both the non-spatial model (ρ = 0) and the spatial econometric interaction model based on the geographic weight matrix. When ρ equals 0, the constructed SIM-IF would degenerate into a simple linear regression model. In this case, the results obtained from either the maximum likelihood method or the least squares method would be the same. Hence, we used the least squares method to estimate the parameters of the non-spatial model.
The results (
Table 4) show that the SIM-IF proposed in this paper provided obviously better fitting results for all three urban agglomerations. The r
2 for BTH, YRD, and PRD (0.815, 0.919, and 0.828, respectively) were significantly higher than those of the non-spatial model (0.764, 0.891, and 0.809, respectively). This indicates that the SIM-IF was more suitable for studying the information flow.
5.3. Spillover Effects of Information Flows
Using the method described in
Section 3.3, we obtained the spillover effects of neighboring information flow on the target information flow (
Table 4) and the spillover effects of the explanatory variables of the neighboring information flow on the target information flow (indirect effect) (
Table 5).
For the spillover effects of neighboring information flow on the target information flow, it was concluded from the spatial dependence (ρ in
Table 4) that the first type of spillover effect in the three major urban agglomerations were all significantly positive, which means that if a certain information flow increased, its origin and destination also sent and received more information flow. Hence, information flows are mutually interactive. For three major agglomerations, the effects were the strongest in the BTH (0.475), followed by the YRD (0.433) and the PRD (0.345). This result is in accordance with the fact that the BTH contains the capital city in China, and the information flows have higher interaction intensity due to political bonds.
By further exploring spillover effects from the explanatory variables of neighboring information flows on the target information flow, we found the following characteristics for the second type of spillover effects (indirect effect in
Table 5):
Firstly, the hierarchy of both origin and destination cities had significantly positive spillover effects on information flow in the three major urban agglomerations. The higher hierarchical position a city possessed, the more information was received and sent by its neighbors. Moreover, among all the influencing factors, city hierarchy had the strongest spillover effect on information flow, which indicates that improvement of cities’ hierarchical position can most effectively help the development of information flows. This is possibly because higher hierarchical position is associated with more powerful government, and hence can affect and manage information flows more effectively. Among the three major urban agglomerations, the information flow in the BTH was the most affected one by the city hierarchy. This result also verified our above assumption to some extent. Specifically, if the hierarchical position of a certain city within BTH increased by 1%, the amount of information sent from and received by its neighbors would rise by 0.646% and 0.511%, respectively. It can, therefore, be concluded that enhancing the hierarchical position of cities is an effective way to promote the integrated development of information networks.
Secondly, the impact of the economic development level on information flow spillover effect varied greatly among different urban agglomerations. The flow origins of the PRD had the strongest positive impact. If the economic level of a certain city in the PRD grew by 1%, the amount of information sent from its neighbors would rise by 0.164%. However, the economic development levels of both flow origins and destinations in YRD showed significantly negative spillover effects. The neighbors of cities with the better economy would send and receive less information flow. This indicates the city’s economic development level may impede the development of its neighbors’ information flow in the YRD. The economic development level of flow origins in the BTH had no significant impact on information flows, i.e., information received by a city had little relationship with the economic development level of its neighbors. It was concluded that the mechanism of economic development level on the information flow spillover effect is quite complicated and varies in different urban agglomerations. This might be due to the complex theory underlying economy, and how it affects information flows needs further microanalysis.
Thirdly, the effect of big events on the information flow was insignificant in the three major urban agglomerations. Only the origins in the BTH and the YRD, and the destinations in the PRD had significant spillover effects on the information flow. Specifically, if a city’s big event effect increased by 1%, the amount of information received by its neighbors would increase by 0.042% and 0.023% in the BTH and the YRD, respectively, while the amount of information sent from its neighbors would increase by 0.050% in the PRD. These regression results are relatively small, which means holding big events may not be an effective way to promote information integration.
Fourthly, the distance factor had almost no spillover effect on information flows. Since distance is an inherent property, the information flow between any two cities is only affected by their distance between but not any other distances. It can also be seen that from
Table 4 the estimated results of the distance factor for the three major urban agglomerations (−0.029, −0.165, and −0.061) were closer to the direct effects in
Table 5 (−0.030, −0.166, and −0.063).
As can be concluded from the above, in these three urban agglomerations, the hierarchy of both origin and destination cities had the strongest spillover effects on information flow, while other factors had comparably weaker or insignificant spillover effects.
5.4. Influencing Factors of Information Flows
Using the method described in
Section 3.3, we also obtained the impact of various factors on the information flow (direct effect) (
Table 5). According to the results, we found the following characteristics for the influencing factors of information flow.
Firstly, all the influencing factors had greater direct effects than the indirect effect, i.e., the second type of spillover effect on information flow. This indicates that these factors in a certain city have a greater impact on the information flow of itself, rather than on its neighboring information flows.
Secondly, the hierarchy of cities had a significant positive impact on information flow, which indicates that cities with higher hierarchy both send and receive more information. Among the three major urban agglomerations in China, this phenomenon was the most obvious in BTH. This may because that agglomeration, with high hierarchical positions of its cities, attached more attention to long-term development and was more willing to facilitate technology development, which is the foundation for information flows. Specifically, when the centrality degree of a city in BTH increased by 1%, the amount of information sent from and received by it would rise by 0.795% and 0.601%, respectively.
Thirdly, the impact of economic development level on information flow varied in the three major urban agglomerations. Flow origins all showed significant impacts on information flow, while the PRD was the most significant one. When the economic development level of the cities in the PRD increased by 1%, 0.331% more information flow would be sent out. Direct effects in the other two urban agglomerations were, however, negative, indicating that cities with the weaker economy tended to send out more messages in the BTH and the YRD. Meanwhile, the effects of economic development level from flow destinations were significantly negative in the YRD and the PRD. This indicates that cities with weaker economy were more likely to receive information in these two urban agglomerations. The different results of the three major agglomerations may be due to the different economic development patterns underneath.
Fourthly, the influence of big events on information flow was insignificant in the three major urban agglomerations. Positive effects existed only in flow origins in the PRD, and flow destinations in the BTH and the YRD. This indicates that big events may have promoted the development of information flow to some extent. Among the three major urban agglomerations, the big event effect of information origins in the PRD had the largest impact on information flow. When a city’s big event effect increased 1% in the PRD, it would send out 0.1% more information flow. This might be credited to the plan for the Guangdong–Hong Kong–Macao Greater Bay Area. Many big events have been held in the PRD, which may have then impacted the information flow.
Fifth, the geographical distance may have influenced information flow to a certain extent. The impact was not significant in the BTH, but was negatively significant in the YRD and the PRD. The reason may be that the government played an important control role in the information construction in the BTH, so the flow between cities was less restricted by geographical location, while the information flows in the PRD and the YRD were mainly influenced by the market. In detail, if the distance between cities increased by 1%, the information flow in the YRD and the PRD would decrease by 0.166% and 0.063%, respectively. This indicates that the information interaction weakened as the distance between cities got longer. Geographic distance, therefore, remains an important constraint in the development of information flow. Among the three major urban agglomerations, the YRD had the strongest distance decay effect, followed by the PRD, while the information flow of BTH was the least affected. This means that the information transmission ability of the YRD was not as strong as that of the BTH or the PRD. The distance decay effect in our study was quite small, which may be ascribed to the fact that information flow has greater mobility and the fact that we have considered the spatial interactions in the model.
6. Discussion
Information flow is an important component in urban interaction. As the results show, the spillover effect can promote interactions between flows, and such information growth will facilitate more interaction within cities. With information as the carrier, elements such as innovation, industry, economy, and talents will flow and spread more smoothly, which leads to coordinated cooperation between cities. Accordingly, the development of the urban agglomerations will be more sustainable [
51]. Hence, it is of great importance that the government make full use of the information flow.
Primarily, the government should reinforce the construction of information infrastructures, which is fundamental to the interconnection in urban agglomerations in the information era. Although the core cities within urban agglomerations have been highly informationized, the internet penetration rate is still low in some less developed areas. The government should take various measures, such as building more communication base stations, promoting broadband network constructions, and reducing internet fees, etc., to narrow the digital divide and develop a more equalized and interconnected communication system.
Furthermore, the government should also reinforce the intervention and management of information flow by adopting more proactive policies to strengthen intercity communication and connection, such as formulating reasonable development plans and outlines and actively undertaking coordinating efforts. As the results suggest, since the cities’ hierarchy is the most important factor that contributes to the information flows, and also shows the strongest spillover effects for all the three urban agglomerations, the government can enhance the volume of information flows by raising the cities’ hierarchical positions, such as by attracting more talents, increasing the number of culture sites, and appealing to more headquarters of major corporations and banking and financial institutions. For different urban agglomerations, the government may also raise their economic development levels, such as by improving GDP per capita or by making use of the effect of big events, including organizing more cultural or athletic events. With the consequent increase in information spillover effects, interaction within cities will also increase, which will make the urban agglomeration more unified and coordinated.
This study quantified the spillover effects and provides scientific basis for the information flow construction in urban agglomerations, which will benefit the coordinated development of cities. However, there are still some deficiencies in this study. Information flows’ spillover effects are quite complex in their mechanisms and show spatial heterogeneity at the scale of urban agglomeration. Currently, we have only analyzed the spillover effects by considering the urban agglomeration as a whole and did not study the direction and the size of the spillover effects within the agglomerations. Future studies may focus on the spatial structure of information flows’ spillover effects, which are likely to facilitate inter-city information interaction and resource sharing more effectively.
7. Conclusions
Information flows have obvious spillover effects, which may facilitate urban interaction and coordinated development. However, this topic has rarely been studied. To fill this gap, we quantified the spatial spillover effects and influencing factors of information flows in our study through a new framework. Specifically, we used the Baidu Search Index to characterize information flow intensity among cities and developed a spatial econometric interaction model of information flows (SIM-IF) to do the analysis. The model was then applied to the three major urban agglomerations in China in the period of 2014–2019 and the major findings are listed as follows:
- (1)
The SIM-IF model performed well in the study area and revealed the mechanism of the formation of the information flows.
- (2)
There were strong and spatially heterogeneous spillover effects between information flows, which were the strongest in the BTH and the weakest in the PRD.
- (3)
Influencing factors, including the cities’ economic development levels, the big events effect, the hierarchy of the cities, and the distance between cities, all have different spillover effects or direct effects on information flows in different urban agglomerations. Among them, the hierarchy of cities had the largest impact in the study area.
Our study offers a new perspective for studying information flows. The proposed method has great potential of application in different regions. This study may advance our understanding of information flows, provide suggestions for information construction in urban agglomerations, and furthermore facilitate the coordinated development of cities.
Author Contributions
Conceptualization, C.W. and L.Z.; funding acquisition, L.Z.; methodology, C.W.; supervision, L.Z. and H.T.; writing—original draft preparation, C.W.; writing—review and editing, L.Z., Z.C. and H.T. All authors have read and agreed to the published version of the manuscript.
Funding
This research was supported by the National Natural Science Foundation of China (41971372, 41971345) and Natural Science Foundation of Guangdong Province (2020A1515010680).
Institutional Review Board Statement
Not applicable.
Informed Consent Statement
Not applicable.
Data Availability Statement
The data presented in this study are available on request from the corresponding author.
Acknowledgments
The authors would like to thank the editors and anonymous reviewers, whose detailed comments and suggestions have notably helped to improve the paper.
Conflicts of Interest
The authors declare no conflict of interest.
References
- Castells, M. The Informational City: Information Technology, Economic Restructuring, and the Urban-Regional Process; Blackwell: New York, NY, USA, 1989; pp. 126–172. [Google Scholar]
- Zhen, F.; Xi, G.; Qin, X. Smart city planning and construction based on geographic perspectives: Some theoretical thinking. Prog. Geogr. 2015, 34, 402–409. [Google Scholar] [CrossRef]
- Cen, D.; Zhou, J.; Zhao, M. New Urbanization from “Flow Space” Viewpoint. Planners 2013, 4, 16–21. [Google Scholar]
- Glaeser, E.L.; Kohlhase, J.E. Cities, regions and the decline of transport costs. Pap. Reg. Sci. 2003, 83, 197–228. [Google Scholar] [CrossRef]
- Wang, Q.; Zhao, M. Research on the city network of Guangdong, Hongkong and Macao from the perspective of information flow: Analysis based on baidu index. J. Reg. City Plan. 2018, 29, 281–293. [Google Scholar] [CrossRef]
- Li, C.; Duan, X. Exploration of urban interaction features based on the cyber information flow of migrant concern: A case study of China’s main urban agglomerations. Int. J. Environ. Res. Public Health 2020, 17, 4235. [Google Scholar] [CrossRef]
- Xiong, L.; Zhen, F.; Wang, B.; Xi, G. The Research of the Yangtze River Delta Core Area’s City Network Characteristics Based on Baidu Index. Econ. Geogr. 2013, 33, 67–73. [Google Scholar] [CrossRef]
- Fischer, M.M.; Varga, A. Spatial knowledge spillovers and university research: Evidence from Austria. Ann. Reg. Sci. 2003, 37, 303–322. [Google Scholar] [CrossRef]
- Smith, P.J. Do Knowledge Spillovers Contribute to U.S. State Output and Growth? J. Urban Econ. 1999, 45, 331–353. [Google Scholar] [CrossRef]
- Conley, T.G.; Ligon, E. Economic distance and cross-country spillovers. J. Econ. Growth 2002, 7, 157–187. [Google Scholar] [CrossRef]
- Griffith, D.A. Spatial Structure and Spatial Interaction: A Review. Environ. Plan. A 1976, 8, 731–740. [Google Scholar] [CrossRef]
- Mitchelson, R.L.; Wheeler, J.O. The Flow of Information in a Global Economy: The Role of the American Urban System in 1990. Ann. Assoc. Am. Geogr. 1994, 84, 87–107. [Google Scholar] [CrossRef]
- Dong, C.; Xiu, C.; Wei, Y. Network structure of “space of flows” in Jilin Province based on telecommunication flows. Acta Geogr. Sin. 2014, 69, 510–519. [Google Scholar] [CrossRef]
- Wang, B.; Zhen, F.; Loo, B.P.Y. The role of distance in online social networks: A case study of urban residents in Nanjing, China. Cities 2018, 78, 37–44. [Google Scholar] [CrossRef]
- Li, Z.; Zhao, M. City networks in cyberspace: Using douban-event to measure the cross-city activities in urban agglomeration of china. Hum. Geogr. 2016, 31, 102–108. [Google Scholar] [CrossRef]
- Wang, B.; Loo, B.P.Y. The hierarchy of cities in Internet news media and Internet search: Some insights from China. Cities 2019, 84, 121–133. [Google Scholar] [CrossRef]
- Baidu Search Index. Available online: http://zhishu.baidu.com/v2/index.html#/ (accessed on 2 February 2021).
- Capello, R. Spatial spillovers and regional growth: A cognitive approach. Eur. Plan. Stud. 2009, 17, 639–658. [Google Scholar] [CrossRef]
- Yan, Y.; An, H. Segmental Economic Space in China: Empirical Research Based on Economic Growth Spillover among Regions. Mod. Econ. Sci. 2014, 36, 47–57. [Google Scholar]
- Carlino, G.; Defina, R. Regional Income Dynamics. J. Urban Econ. 1995, 37, 88–106. [Google Scholar] [CrossRef]
- Gabauer, D.; Gupta, R. On the transmission mechanism of country-specific and international economic uncertainty spillovers: Evidence from a TVP-VAR connectedness decomposition approach. Econ. Lett. 2018, 171, 63–71. [Google Scholar] [CrossRef]
- Anselin, L. Spatial Econometrics: Methods and Models; Springer: Dordrecht, The Netherlands, 1988; pp. 32–40. [Google Scholar]
- Stefanouli, M.; Polyzos, S. Gravity vs radiation model: Two approaches on commuting in Greece. Transp. Res. Procedia 2017, 24, 65–72. [Google Scholar] [CrossRef]
- Jing, S.; Zhihui, L.; Jinhua, C.; Zhiyao, S. China’s renewable energy trade potential in the “Belt-and-Road” countries: A gravity model analysis. Renew. Energy 2020, 161, 1025–1035. [Google Scholar] [CrossRef]
- Lesage, J.P.; Thomas-Agnan, C. Interpreting spatial econometric origin-destination flow models. J. Reg. Sci. 2015, 55, 188–208. [Google Scholar] [CrossRef]
- Pu, Y.; Zhao, X.; Chi, G.; Zhao, J.; Kong, F. A spatial dynamic panel approach to modelling the space-time dynamics of interprovincial migration flows in China. Demogr. Res. 2019, 41, 913–948. [Google Scholar] [CrossRef]
- Ni, L.; Wang, X.; Chen, X. A spatial econometric model for travel flow analysis and real-world applications with massive mobile phone data. Transp. Res. Part C Emerg. Technol. 2018, 86, 510–526. [Google Scholar] [CrossRef]
- Ni, L.; Wang, X.; Zhang, D. Impacts of information technology and urbanization on less-than-truckload freight flows in China: An analysis considering spatial effects. Transp. Res. Part A Policy Pract. 2016, 92, 12–25. [Google Scholar] [CrossRef]
- Sun, B.; Ding, S. Do large cities contribute to economic growth of small cities? Evidence from Yangtze River Delta in China. Geogr. Res. 2016, 35, 1615–1625. [Google Scholar] [CrossRef][Green Version]
- Hong, J.; Gu, J.; He, R.; Wang, X.; Shen, Q. Unfolding the spatial spillover effects of urbanization on interregional energy connectivity: Evidence from province-level data. Energy 2020, 196, 116990. [Google Scholar] [CrossRef]
- Shi, K.; Yu, B.; Zhou, Y.; Chen, Y.; Yang, C.; Chen, Z.; Wu, J. Spatiotemporal variations of CO2 emissions and their impact factors in China: A comparative analysis between the provincial and prefectural levels. Appl. Energy 2019, 233–234, 170–181. [Google Scholar] [CrossRef]
- Fang, C.; Yu, D. Urban agglomeration: An evolving concept of an emerging phenomenon. Landsc. Urban Plan. 2017, 162, 126–136. [Google Scholar] [CrossRef]
- Batten, D.F. Network cities: Creative urban agglomerations for the 21st century. Urban Stud. 1995, 32, 313–327. [Google Scholar] [CrossRef]
- Glaeser, E.L.; Ponzetto, G.A.M.; Zou, Y. Urban networks: Connecting markets, people, and ideas. Pap. Reg. Sci. 2016, 95, 17–59. [Google Scholar] [CrossRef]
- Chun, Y. Modeling network autocorrelation within migration flows by eigenvector spatial filtering. J. Geogr. Syst. 2008, 10, 317–344. [Google Scholar] [CrossRef]
- Wang, Z.; Ye, X.; Lee, J.; Chang, X.; Liu, H.; Li, Q. A spatial econometric modeling of online social interactions using microblogs. Comput. Environ. Urban Syst. 2018, 70, 53–58. [Google Scholar] [CrossRef]
- Gottmann, J.; O’Brien, R. Global Financial Integration: The End of Geography. Geogr. J. 1993. [Google Scholar] [CrossRef]
- Lin, G.; Long, Z.; Wu, M. A Spatial Analysis of Regional Economic Convergence in China:1978–2002. China Econ. Q. 2005, 4, 349–356. [Google Scholar] [CrossRef]
- Cai, G.; Qian, J. The Origin of Spatial Correlation: A Theoretical Model and Empirical Evidence. China Econ. Q. 2013, 12, 869–894. [Google Scholar] [CrossRef]
- LeSage, J.P.; Pace, R.K. Spatial econometric modeling of origin-destination flows. J. Reg. Sci. 2008, 48, 941–967. [Google Scholar] [CrossRef]
- LeSage, J.; Pace, R.K. Introduction to Spatial Econometrics; Chapman and Hall/CRC: London, UK, 2009; pp. 211–236. [Google Scholar]
- Roche, M. Mega-events and urban policy. Ann. Tour. Res. 1994, 21, 1–19. [Google Scholar] [CrossRef]
- Li, X.; Xu, H.; Chen, X.; Li, C. Potential of NPP-VIIRS nighttime light imagery for modeling the regional economy of China. Remote Sens. 2013, 5, 3057–3081. [Google Scholar] [CrossRef]
- Shi, K.; Yu, B.; Huang, Y.; Hu, Y.; Yin, B.; Chen, Z.; Chen, L.; Wu, J. Evaluating the ability of NPP-VIIRS nighttime light data to estimate the gross domestic product and the electric power consumption of China at multiple scales: A comparison with DMSP-OLS data. Remote Sens. 2014, 6, 1705–1724. [Google Scholar] [CrossRef]
- Help Center of Baidu Search Index. Available online: https://index.baidu.com/v2/main/index.html#/help (accessed on 2 February 2021).
- Bonacich, P. Power and Centrality: A Family of Measures. Am. J. Sociol. 1987, 92, 1170–1182. [Google Scholar] [CrossRef]
- Zhao, G.; Jia, P.; Zhou, A. Improved degree centrality for directed-weighted network. J. Comput. Appl. 2020, 40, 141–145. [Google Scholar] [CrossRef]
- Wang, J.; Fischer, M.M.; Liu, T. Spatial Analysis for Economy and Social Science; Science Press: Beijing, China, 2012; p. 92. [Google Scholar]
- Buczkowska, S.; Coulombel, N.; de Lapparent, M. A comparison of Euclidean Distance, Travel Times, and Network Distances in Location Choice Mixture Models. Netw. Spat. Econ. 2019, 19, 1215–1248. [Google Scholar] [CrossRef]
- Hou, C.; Du, D.; Liu, C.; Gui, Q.; Liu, S.; Qin, X. Spatio-temporal evolution and factors influencing international student mobility networks in the world. Dili Xuebao/Acta Geogr. Sin. 2020, 75, 681–694. [Google Scholar] [CrossRef]
- Fang, C.; Yu, D. China’s Urban Agglomerations; Springer: Singapore, 2020; pp. 1–32. [Google Scholar]
| Publisher’s Note: MDPI stays neutral with regard to jurisdictional claims in published maps and institutional affiliations. |
© 2021 by the authors. Licensee MDPI, Basel, Switzerland. This article is an open access article distributed under the terms and conditions of the Creative Commons Attribution (CC BY) license (https://creativecommons.org/licenses/by/4.0/).


