Article

Assessing Sustainable Consumption in Packaged Food in Indonesia: Corporate Communication Drives Consumer Perception and Behavior

by
Ming-Lang Tseng
1,2,*,
Chun-Wei Remen Lin
1,
Raditia Yudistira Sujanto
3,4,
Ming K. Lim
5,6 and
Tat-Dat Bui
1
1
Institute of Innovation and Circular Economy, Asia University, Taichung 413, Taiwan
2
Department of Medical Research, China Medical University Hospital, Taichung 404, Taiwan
3
Department of Business Administration, Asia University, Taichung 413, Taiwan
4
Department of Communication, Universitas Aisyiyah Yogyakarta, Yogyakarta 55292, Indonesia
5
College of Mechanical Engineering, Chongqing University, Chongqing 400044, China
6
Faculty Research Centre for Business in Society, Coventry University, Coventry CV1 5FB, UK
*
Author to whom correspondence should be addressed.
Sustainability 2021, 13(14), 8021; https://doi.org/10.3390/su13148021
Submission received: 11 June 2021 / Revised: 15 July 2021 / Accepted: 15 July 2021 / Published: 18 July 2021

Abstract

:
Sustainable consumption has been addressed in the literature in recent years, especially in relation to changing from a traditional consumption to sustainable consumption. Reducing environmental impacts from waste generation has been the focal point of sustainable consumption. However, a large number of attributes has caused a complexity in understanding which attributes effectively enhance the consumption. In particular, sustainable consumption has been facing a negative trend due to low levels of knowledge about packaging’s environmental impact, failed communication which leads to misperception and irresponsible behavior. This study contributes to proposing a set of attributes for enhancing sustainable consumption in the Indonesian food industry, to fulfill the lack of understanding of the attribute interrelationships using qualitative information. This study proposes a set of attributes to enhance sustainable consumption with qualitative information by assessing the interrelationships among the attributes employing the Delphi method and fuzzy decision-making trial and evaluation laboratory method to provide causal and effect relationships. As a result, corporate communication, consumer perception, consumer behavior, and product packaging are major aspects for sustainable consumption enhancement. Corporate communication becomes a major driver to affect perception and behavior. This study proposes a managerial insight for the packaged food industry on improving several criteria including green marketing, green consumerism, verbal features, and importance of information.

1. Introduction

Packaged food consumption is experiencing a rapid growth. The Indonesian packaging industry is forecast to reach 159.2 billion units by 2024 at 2.4% of growth rate, and 44% of the share belongs to food products [1]. Food consumption continues to grow and contributes to 30% of total waste in the landfills, causing an environmental degradation and placing the country as the second biggest waste contributor in the world [2,3]. This growth has triggered waste generation where one third of parts of food products becomes waste, and generally contributes to 1.3 billion tons of food per year [4,5]. Such waste generation reflects that food packaging has not been treated properly to be environmentally friendly, and that consumers have been neglecting sustainable consumption [6,7,8]. Specifically, Olsen and Tuu [9] suggested that sustainable consumption (SC) potentially reduced the environmental impact. However, Potter and Röös [10] argued that SC remained neglected as consumers lack sustainable perception and behavior due to failed communication from the industry. Moreover, studies claimed that there is a lack of understanding of the effect of corporate communication on consumer perception and behavior [7,11,12]. This indicates that SC assessment requires a further exploration.
Prior studies have attempted to assess and explore SC as a change from traditional to environmentally friendly consumption with an effect to the environment [13,14]. Bravi et al. [15] highlighted the potential advantage of SC in lowering the environmental impact by pressing the waste generation. However, SC is often considered to be problematic due to the complexity and involvement of many attributes [16,17,18]. The complexity involves a conflict between consumers’ personal attributes, such as consumer perception and behavior, and industry attributes, such as product packaging and corporate communication [9,19,20]. Specifically, the industry tends to miscommunicate sustainable information which leads to a loss of understanding among consumers in their perception and behavior toward sustainable products [10,21,22]. In particular, Brennan et al. [7] argued that although prior studies have attempted to assess SC, the literature lacks an exploration of consumer perception and behavior toward the product packaging impact to the environment in relation to the effect of corporate communication. Therefore, an explicit investigation of how consumers’ perception and behavior, corporate communication, and product packaging contribute to the SC enhancement must be addressed.
In the literature, the attributes of consumers’ perception, consumers’ behavior, corporate communication, and product packaging showed to have effects on SC [6,23,24]. Specifically, Altintzoglou et al. [25] presented that consumers with environmental awareness tend to have a positive perception and behavior toward sustainable products. Moreover, products with environmental material such as recyclable packaging potentially motivates consumers to perceive and behave sustainably. However, Hoek et al. [18] argued that consumers with sustainable perceptions do not always translate into sustainable behavior due to ineffective communication from the industry. Prior studies found that despite corporate attempts to communicate sustainable information and environmentally friendly packaging, the perception of sustainable information is limited among the consumers [23,26,27]. Fischer et al. [28] reviewed that even though communication plays an important role, the literature remains lacking on the understanding, as only a few studies relate the topic of SC with corporate communication as an attribute. Therefore, this study argues that corporate communication should be a recommended form of appeal for enhancing the attributes toward sustainable consumption.
Prior studies have addressed SC attributes in different ways. Olsen and Tuu [9] presented that SC entails conflicting attributes. Hoek et al. [18] linked SC attributes to different stakeholders and indicated a complexity and uncertainties in understanding the decision-making problems. Morley [29] recognized a complexity in understanding the SC attributes, and highlighted the importance of the interrelationships among the attributes. However, these interrelationships among the attributes are not fully understood. This indicates that prior studies tend to miss addressing this gap, and it is necessary to examine the interrelationships between the attributes and the linguistic preferences. This study applies the Delphi method to obtain a consensus evaluation from an expert panel for selecting the important attributes by using a five-point Likert scale questionnaire. This study examines the attribute interrelationships with qualitative information from the decision-making experts’ linguistic preferences using the fuzzy decision-making trial and evaluation laboratory (fuzzy DEMATEL) [30,31]. The objectives are as follows:
  • To identify a set of valid attributes to enhance sustainable consumption;
  • To justify practical improvement under uncertainties
This study contributes to expanding the literature on SC with an emphasis on the role of corporate communication in affecting consumer perception and behavior, following up prior studies which have indicated a lack of an exploration of the communication’s effects on the perception and behavior [7,12]. This study focuses on assessing the attributes’ interrelationships depicted in causal-effect graphs and, indeed, the results show that SC can be enhanced by relying on effectively and efficiently communicating sustainable information to the consumers, to strengthen their perception and behavior. Green marketing, consumerism, verbal features, and information importance are among the highlighted criteria that the industry should prioritize on in a form of action plans. The rest of the study is organized as follows. Section 1 focuses on the introduction to how this study achieves the objectives through the literature background, highlighting the research gap and proposed method. Section 2 reviews the literature on sustainable consumption along with the attributes. Section 3 presents the method and analysis of data. Section 4 discusses the results and presents figures about the analyzed attributes. Section 5 focuses on industrial and theoretical implications, and limitations and future study directions. Section 6 concludes the study and presents the potential areas of improvement for future studies.

2. Literature Review

To provide a better understanding based on a theoretical perspective, this section reviews related literature addressing SC. Proposed methods and measures are also reviewed.

2.1. Sustainable Consumption

SC is defined as a use of goods and services that fulfill basic needs and bring a better quality of life, while minimizing disadvantages to the environment through pollution and waste [14,32]. Furthermore, SC needs a continuous nurture through an adaptive, balanced, and contextualized approach to consumption without causing any form of damage and dysfunction in the environment, improving resource use efficiency, and avoiding hyper-consumption [13,15,16]. Olsen and Tuu [9] extended the definition to an evolution process toward meeting the present needs without comprising the future generations’ needs. Hoek et al. [18] added that SC comprises reducing waste and consumption of products with harmful effects on the environment. These various definitions require specific attributes which are linked with consumer perception, consumer behavior, product packaging, and how sustainable information is communicated by the corporations.
Consumer perception has impacted the consumption of sustainable products. For instance, Altintzoglou et al. [25] claimed that consumers with a positive perception on the product’s environmental impact tend to exhibit sustainability in their consumption. Awan et al. [33] emphasized that consumer perceived knowledge driving the activities have a positive effect on the corporate improvements. Perception motivates the consumption towards sustainable products due to the personal gains such as health and the environmental protection [10,11,34]. Moreover, Thomas et al. [12] suggested that SC is enhanced by positive consumer perceptions of sustainable information which influences their preferences toward the product. However, studies found that there are limitations in consumer perception which leads to unsustainable consumption. For example, Boesen et al. [6] emphasized on a misperception where consumers tend to perceive SC based on the extrinsic aspect of the product such as the packaging material, not the packaging environmental impact. Such misperception tends to cause consumer misunderstandings about SC [7,26,35]. Additionally, Feil et al. [36] argued that perceptions on SC are difficult to capture due to different characteristics possessed by the consumers. Thus, this study stresses further exploration of how consumer perception of sustainability impacts SC.
Consumer behavior becomes a potential determinant toward SC. For instance, according to Yokokawa et al. [27], the environmental impact of a product depends on how consumers treat the product after the consumption. Dhir et al. [37] argued that there is a positive connection between consumers’ behavior of reducing waste and the benefits. Further, prior studies suggested that consumer behavior such as properly treating the product potentially reduces waste generation [7,9,38]. However, there is an inconsistency with consumer behavior toward SC in different domains. For example, consumers may exhibit sustainable behavior in the food domain, but not in other domains due to challenges such as low of knowledge and misperception of sustainability [17,24,39]. This indicates that sustainability is not fully understood, but only partially, and does not always imbed in the behavior. Moreover, according to Rondomi and Grasso [40], there is a lack of clear understanding on consumer behavior toward SC due to many attributes influencing that behavior. For example, Dorce et al. [11] claimed that even consumers with sustainable intentions do not always result in having a sustainable behavior. Therefore, consumer behavior remains in question to impact and enhance SC.
Product packaging plays a role in SC through the environmental impact. Often, the impact depends on the packaging design and material which should be determined thoroughly [8,41]. Brennan et al. [7] presented that during the production phases, packaging design and material continue to be improved to slow down waste generation by extending the expiry life. Moreover, packaging prevents the product from potential damage and degradation during the storing and transporting processes, and thus prolongs the time for becoming waste [42,43]. However, Yokokawa et al. [27] argued that environmentally friendly packaging design and material does not always attract consumers’ preferences. Specifically, consumer preferences fall upon the packaging information and usability [44,45]. Chen et al. [20] argued that although the information on the packaging in form of sustainable labels effectively affect the preferences, consumers tend to be overwhelmed by the various labels; this indicates an inconsistency. Therefore, sustainable consumption based on the product packaging impacts the environment depending on the packaging production phases and clarity with the sustainable information to convince consumers.
Corporate communication impacts SC by improving consumers’ sustainable awareness and knowledge. Commonly, corporate communication comes in the form of information found in the sustainable labels. For instance, Thomas et al. [12] claimed that sustainable labels effectively affect consumers to have a positive perception and opinion about the product. Moreover, through these labels, corporations communicate with the consumers about the product benefits or risk to the environment [7,21,46]. However, Sultan et al. [47] argued that labels are not the only effective medium for corporations to communicate with consumers. Several studies suggested that corporate communication mediums should be interactive with the consumers and emphasize the environmental benefits to enhance SC [19,28,48]. In contrast, corporations often fail to communicate with consumers due to information asymmetry and overload [22,44,49]. Flanagan and Priyadarshini [24] explained that the asymmetry comprises of consumers’ misunderstanding of sustainable information. According to Liu et al. [50], information asymmetry becomes a determining reason that hinders consumers from SC. Therefore, corporate communication remains in question in terms of the impact toward SC.

2.2. The Proposed Measures

This study highlights attributes that include four aspects and 18 criteria. The aspects consist of product packaging (A1), consumers’ perception (A2), corporate communication (A3), and consumers’ behavior (A4), as seen in Table 1.
Product packaging has a direct impact on the environment through waste. Therefore, either sustainability information on product packaging or type of packaging material are important attributes to improve SC. Sustainable information can be in the form of sustainability labels (C1) that are found on packaging [40,44,45]. These labels should be beyond a display purpose on the packaging, but more importantly the labels need to have a good visibility [23]. Another criterion is the packaging design in terms of having a green appearance [27,35]. Consumers determine green appearance (C2) by looking into the product through labels assessment, ingredients reading, packaging assessment, and products’ green performance analysis [41]. Material type of packaging (C3) is another a criterion for this aspect. Packaging material choices are the important attribute in decreasing the environmental burden of packaging [35,42]. In addition, packaging recyclability (C4) is a criterion in relation to consumers’ knowledge on the environmental impacts of packaging [6]. Furthermore, consumers tend to have limited knowledge about packaging sustainability. The environmental impacts of packaging (C5) are varieds depending on the recycling rates [6,43]. Consumers do not seem to have knowledge of the production process of product packaging and the packaging impact during transporting process on the environment.
Consumers’ perception about sustainability consists of three criteria. Practice of SC is related to consumers’ awareness or consciousness (C6) about environmental benefits [41,50]. In combination with commitment to environmental protection, the knowledge of environmental benefits contributes to the consumers’ environmental consciousness. Moreover, the knowledge about the disposal phase of packaging (C7) also plays an important role for sustainability. Consumers’ perception of SC is based on what should happen at the disposal stage of packaging [6]. Another criterion comprises consumers’ knowledge of sustainability labels [6,35]. Sustainability labels (C8) are one of the cues found on packaging that may lead consumers to having a perception about the product.
This study proposes the aspect of corporate communication consisting of seven criteria. Corporations potentially improve SC by communicating sustainability characteristics (C9) to the consumers [23]. These characteristics assist consumers to identify the desired attributes that belong to their beliefs and values. Apart from the characteristics, corporations should emphasize the environmental benefits in their communication efforts (C10) with the consumers [48]. This is to counter the corporate communication which focuses mostly on the product’s benefits instead of educating the consumers about the environmental benefits. Information plays an important role (C11) in persuading consumers to change their behavior more sustainably [40,49]. The importance also lies on how corporations build the message when exerting a communication effort with the consumers, and consequently which media are used for delivering the message so that the information becomes effective. One of the communication efforts with the consumers is through green marketing (C12) [28,41]. This is effective in improving SC as it involves more interactive actions between the corporations and the consumers. In addition, the source of information (C13) is no less important than the information content itself [46,49]. This is related to how consumers trust the information given by the corporations. Corporations communicate with the consumers through campaigns to augment the perception (C14) of SC [22]. Moreover, another effort of communication is through verbal features (C15). Verbal features are often used to communicate sustainability explicitly through informative description on the packaging [19,35].
Consumer behavior consists of three criteria to enhance SC. Green consumerism (C16) is a criterion where consumers place price, convenience, and quality pertaining to the environmental and social benefits as top considerations [38,41]. Green consumers are more critical when it comes to corporations not being responsible with the environmental impact of their products. Consumer behavior is extended to the life cycle in domestic phases (C17) [39]; not only the production phases, but also domestic or household consumption phases must be taken into consideration. In addition, dietary changes (C18) also contribute to SC, as consumers reduce their consumption of certain products based on their concern on the environment [18,39].

3. Methodology

3.1. Study Background

In Indonesia, food consumption has been increasing and has contributed to a large amount of food waste in the landfill. According to the Ministry of Environment and Forestry of Indonesia [3], waste produced from food product consumption dominates at 30% of the total amount of all waste types, wherein 32% originate from household consumption. Overall, the Indonesian household food consumption has contributed 20 million tons of waste every year, with 300 kg of waste per person per year [51,52]. There is 46% of waste that has not been managed every year. More specifically, packaging waste from food products is accountable for 9 out of 10 of all waste types [53]. This increase in waste generation is evidence that SC has been a challenge in Indonesia.
Perception about the packaging environmental impact has been low among the food consumers, which leads to irresponsible behavior. The corporates producing packaged food products are responsible for communicating the importance of SC in order to lower the waste generation. Corporates tend to lack of capability of effectively communicating SC to shape consumer perception and change their behavior. As a country with a huge population, the yearly Indonesian waste generation can be significantly lowered through SC.
Thus, this study examines the SC attribute interrelationships to provide insights for achieving SC in Indonesia. The initial attribute set is constructed from the literature, followed by an elimination and selection process using the Delphi method with a linguistic evaluating questionnaire. The experts were selected using a purposive sampling technique based on the number of years of experiences and intensity on sustainable consumption. This study involved 11 professionals with extensive experience of over 10 years in the Indonesian food industry, including eight experts from the food industry, and three from the academic field, as summarized in Table 2. A series of interviews with the experts is conducted for data validation based on their confirmation to check whether the attributes are valid for SC in Indonesia. Valid attributes are confirmed once over 75% of the experts come to an agreement and confirm. The questionnaire can be found in the Appendix A.

3.2. Delphi Method

Fuzzy set theory was integrated with the traditional Delphi method in order to achieve a decision made by a group of experts by addressing the fuzziness of the judgments [54,55]. This integration offers advantages in reducing the number of responses and investigation time for an effective assessment and transformation of the fuzzy evaluation into accurate data [56]. An initial set of SC attributes was provided to a panel of experts ranging from a CEO of a food production corporate to a number of academics who rated the importance level for each criterion using a five-point Likert scale based on their professional understanding. This study employed the Delphi method by corresponding with the expert panelists via e-mail. Most of the panelists have been in the Indonesian packaged food industry for over 10 years. The method allows the obtaining of a consensus evaluation from the panelists by applying three steps [19]. The analytical steps include (1) collecting experts’ evaluation scores for each criterion based on the importance level using the Likert scale of 0 (minimum importance) to 4 (maximum importance). The importance value of attribute b is evaluated by expert a as j = (xab; yab; zab), a = 1, 2, 3, …, n; b = 1, 2, 3, …, m; then weight jb of element b is jb = (xb; yb; zb), where xb = min (xab), yb = ( Π 1 n yab)1/n, zb = max (zb). Therefore, this step allows for a transformation of the linguistic terms and triangular fuzzy numbers into linguistic values, as seen in Table 3; (2) checking whether the panelists arrived at a consensus-based evaluation for each criterion based on the consensus threshold. The consensus degree distance is normally used as an agreement measure, as the consensus approach means that each participant does not come to the same agreement [57]; and (3) readjusting the attribute set according to the consensus level based on the panelists’ comments and removing the attributes that were not accepted. The refining threshold of the valid indicators uses the following calculation of t = a = 1 n (Db/n). If Dbt, the specific indicator of b is accepted. If Db < t, the indicator of b is unaccepted, is thus removed.

3.3. Fuzzy DEMATEL

A fuzzy set theory is applied to collect and transform the preferences in linguistic forms into triangular fuzzy numbers (TFNs), as seen in Table 3. The equations allow for the steps of normalization, aggregation, and defuzzification.
The assessment using a decision matrix focuses on the x attributes against the y attributes, where n refers to the number of decision makers. The linguistic preferences are represented by D ˜ n which denotes the decision-maker vector using ( g d ˜ L n ,   g d ˜ M   n ,   g d ˜ U   n ) (to represent the linguistic preferences [19,30].
D ˜ n = [ d ˜ L 1 j 1 y ,   d ˜ M 1 j   1 y ,   d ˜ L 1 j   1 y d ˜ L i 1 1 y ,   d ˜ M i j   1 y ,   d ˜ L i j   1 y d ˜ L 1 j x 1 ,   d ˜ M 1 j   x 1 ,   d ˜ L 1 j   x 1 d ˜ L i j x y ,   d ˜ M i j   x y ,   d ˜ L i j   x y ] x y ,   n = 1 ,   2 ,   ,   n
The next step is to normalize the fuzzy numbers. With a condition of the decision-making group comprising n members, d ˜ i j n represents the effect weights from all the attributes of ith and jth, which are assessed by nth decision making members.
D = ( g d ˜ L i j n ,   g d ˜ M i j   n ,   g d ˜ L i j   n ) = [ ( d ˜ L i j n m i n d ˜ L i j n ) / ( m a x d ˜ L i j n m i n d ˜ L i j n ) ,     ( d ˜ M i j n m i n d ˜ M i j n ) / ( m a x d ˜ M i j n m i n d ˜ M i j n ) ,     ( d ˜ U i j n m i n d ˜ U i j n ) / ( m a x d ˜ U i j n m i n d ˜ U i j n )   ]
where ( g d ˜ L i j n ,   g d ˜ M i j   n ,   g d ˜ U i j   n ) represents the normalized values of triangular fuzzy numbers.
The next step is to compute the normalized values that are obtained using the Equation (2), crisp values using the Equations (3) and (4).
( D d ˜ L T i j n   , D d ˜ R T i j n ) = [ g d ˜ M i j   n / ( 1 + g d ˜ M i j   n g d ˜ L i j n ) ,   g d ˜ U i j   n / ( 1 + g d ˜ U i j   n g d ˜ M i j   n )
D d ˜ i j n = [ ( D d ˜ L T i j n   ( 1 / D d ˜ L T i j n ) + ( D d ˜ R T i j n ) 2   ) ( 1 D d ˜ L T i j n + D d ˜ R T i j n ) ]
d w ˜ i j n = m i n   g d ˜ L i j n + D d ˜ i j n   ( m a x   g d ˜ U i j   n m i n g d ˜ L i j n )
This method uses an initial direct relation matrix (IDRM) for aggregating the subjectivity of the judgements from the evaluators, which results in a synthetic value using the Equation (5). This matrix allows for denoting which criterion i affects criterion j.
w i j n = ( w ˜ i j 1 + w ˜ i j 2 + w ˜ i j 3 + w ˜ i j n ) / n
The matrix continues to be standardized for generating the direct relationship matrix (NDM) that has been normalized.
NDM = S ∗ IDRM
where s = max ( j = 1 n w i j n )   f   or all i from 1 to n.
Afterwards, once the total relation matrix is obtained, the total interrelationship of matrix Y is then calculated using the following equation.
TM = NDM (1 − NDM)−1
where I is an identity matrix.
The next step is to draw a causal diagram. Here, vector α denotes the sum of the values within the rows, while vector β refers to the value sum within the columns. The “prominence” axis of ( α + β ) refers to the importance. Meanwhile, the “relation” axis ( α β ) represents the causal attributes. When the sum of ( α β ) turns out to be negative, the attributes consisting of each aspect and criterion fall in the effect group. Vice versa, when the value sum turns out to be positive, the attributes fall in the causal group.
α = j = 1 n N D M i j   ,   for   all   j   from   1   to   n
β = j = 1 n N D M i j   ,   for   all   i   from   1   to   n

3.4. Analytical Steps

This study employs the following four analytical steps:
  • Transformation of linguistic information into fuzzy numerical data;
  • Transformation of triangular fuzzy numbers into crisp values;
  • Setting of interrelationship matrix for the crisp values and aspect-criteria grouping;
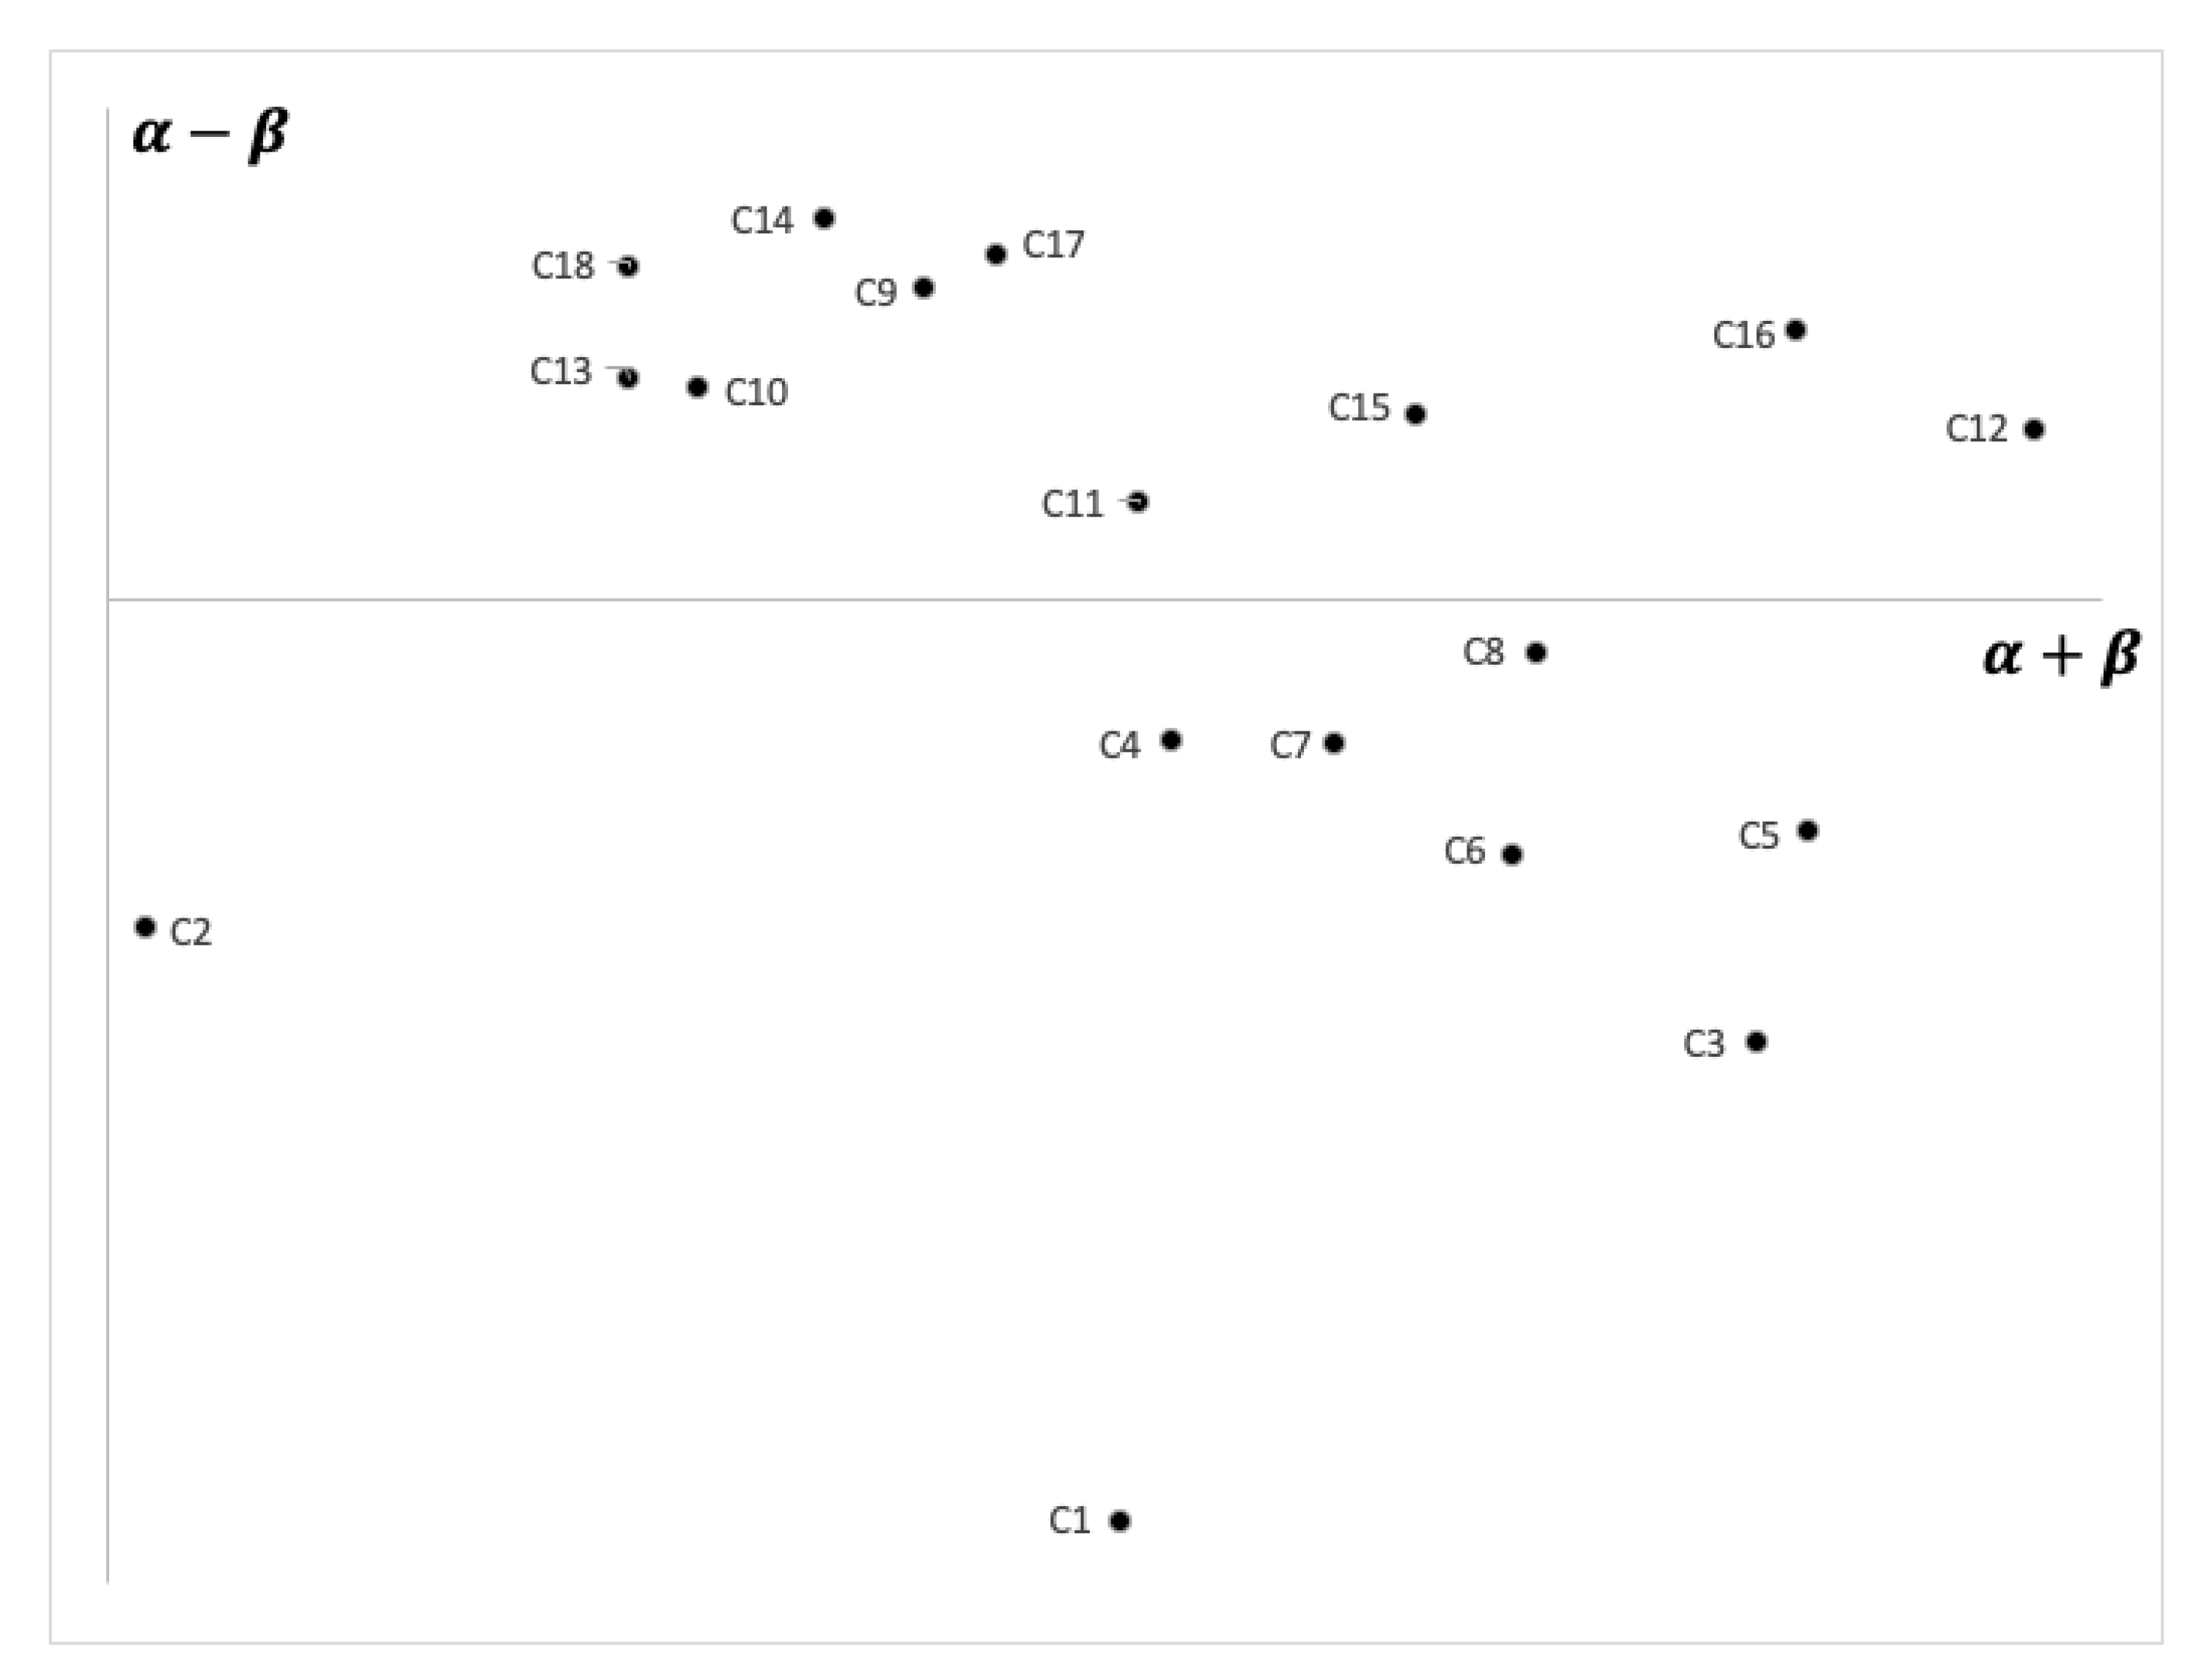
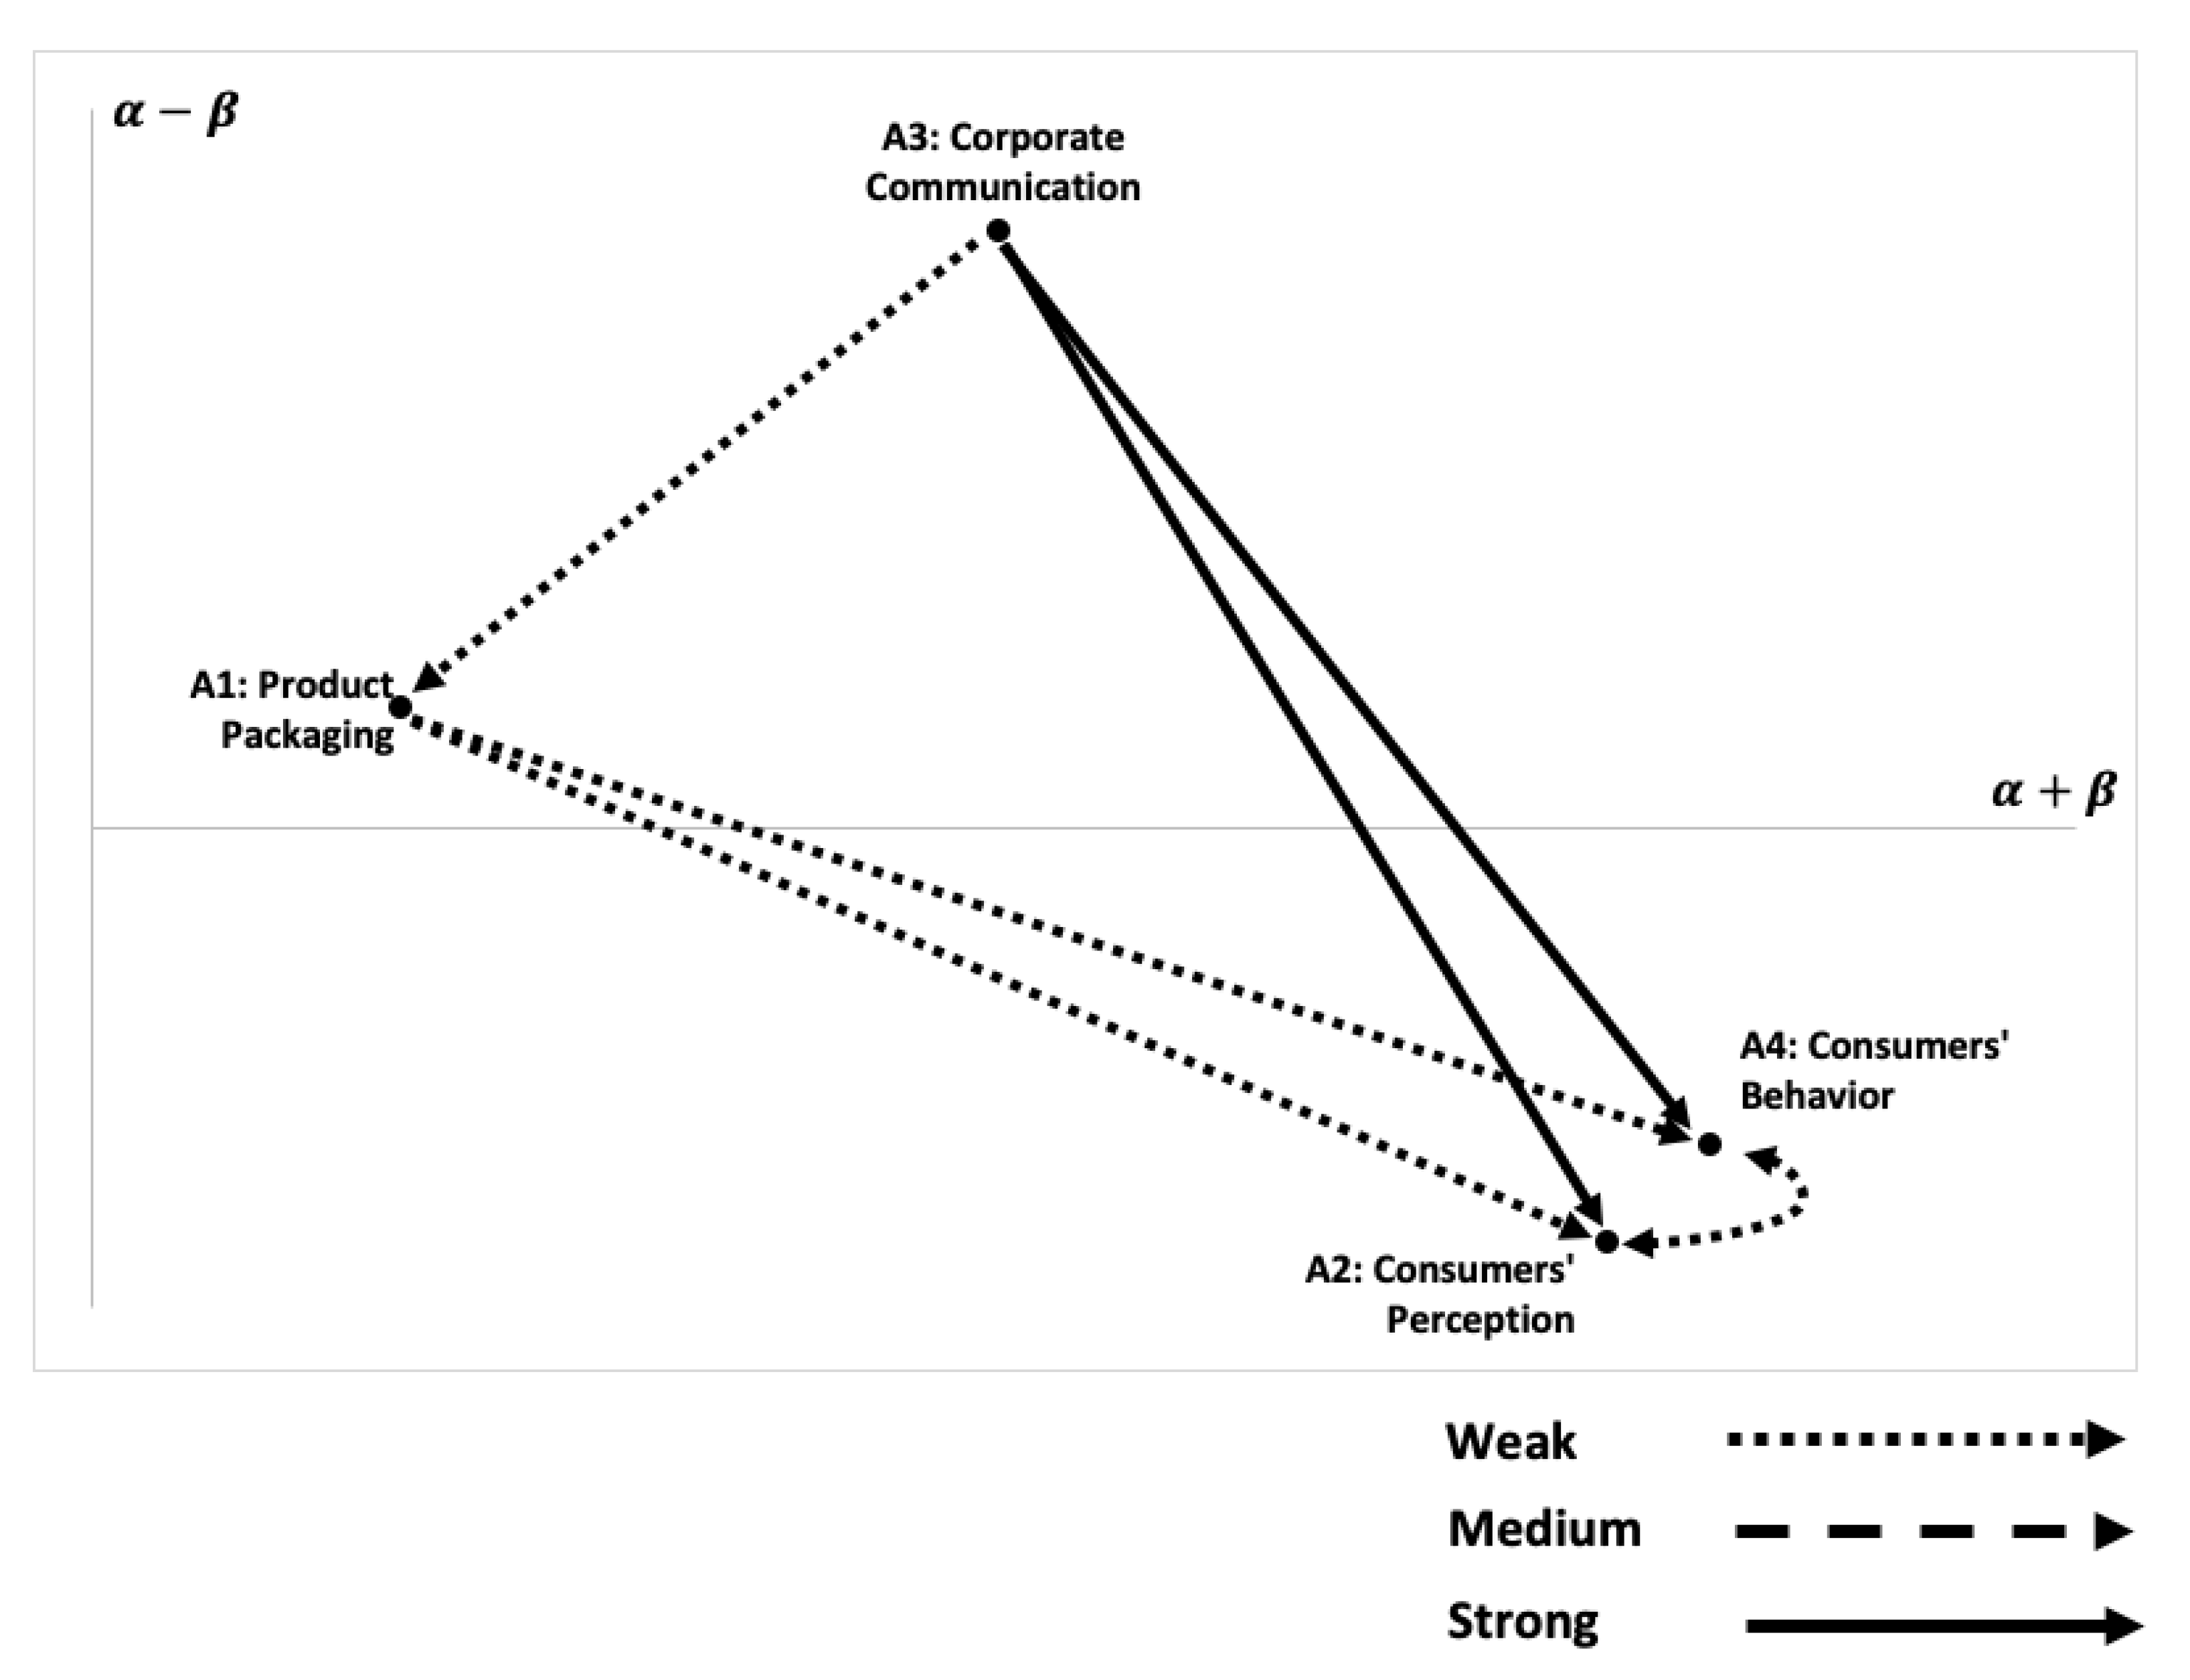
  • Mapping of a causal-effect diagram.

4. Results

The results are presented in the analytical steps, as follows.
Step 1: Transforming linguistic information into fuzzy numerical data.
The collected data from the experts come in linguistic forms. The evaluations of interrelationships among the aspects are, therefore, presented using a linguistic scale from ‘VL’ for being ‘very low influence’ to ‘VHI’ for being ‘very high influence’, as seen in Table 3.
These linguistic data are then transformed into triangular fuzzy numbers, as Table 4 shows.
The same data collection technique is implemented for criteria. The linguistic form of data range among ‘VL’ and ‘VHI’ using the same scale for evaluating the interrelationships among criteria.
Step 2: Transforming the triangular fuzzy numbers into crisp values.
As these fuzzy numbers are not possible to compute, procedures need to be followed in order to resolve the vague meanings and obtain precise, crisp values. Table 5 presents the average crisp values of the aspects for all the respondents.
Meanwhile, Table 6 shows the crisp values of the criteria for all the respondents. Both Table 5 and Table 6 are obtained from the computation using Equations (2)–(6).
Step 3: Setting the crisp values into an interrelationship matrix and aspect-and-criteria grouping.
The DEMATEL method is used for this process. This method functions to assess interrelationships through a causal-effect diagram. The aspects, including product packaging (A1), consumers’ perception (A2), corporate communication (A3), and consumers’ behavior (A4), are set into an interrelationship matrix. Table 7 shows the total interrelationship matrix of the aspects.
This matrix is then transformed into causal-effect interrelationships among the aspects, as seen in Table 8.
As for the criteria, the same method is employed. There are 18 criteria that are involved. They are set into an interrelationship matrix, as seen in Table 9, showing the total interrelationship of the criteria. The values in either Table 7 or Table 8 are obtained from the computation using Equations (6) and (8).
The matrix is then converted into causal-effect interrelationship matrix, as Table 10 shows, from a computation using Equations (9) and (10).
In either Table 7 or Table 9, there are α and β; the values of α are obtained from the accumulation of rows, while the values of β are obtained from the values of columns. To determine which values belong to the causal group, the value of α is subtracted by the value of β (αβ) for each aspect has to be positive. Otherwise, the aspects belong to the effect group. The mapping of ((α + β), (αβ)) is then transferred into a causal-effect diagram.
Step 4: Mapping the causal-effect diagram.
As seen in Figure 1 there are two aspects that belong to the causal group: A3 and A1. Meanwhile, A2 and A4 belong to the effect group. By assessing the strength of the line of the interrelationships, it can be seen that A3 is the main influencing aspect of SC. A3 shows the strongest impact on A2 and A4. A3 shows a weak influence on A1. A1 also shows weak influences on A2 and A4. The interrelationships of A2 and A4 are weak as well.
Figure 2 shows that there are criteria that belong to the causal group: C12, C16, C15, C11, C17, C9, C14, C10, C18, and C13. As for the rest of the criteria, they belong to the effect group. For the analysis, there are four criteria that are picked to be discussed as they show to be the strongest of the causal group.

5. Discussion

This section discusses the study’s theoretical and managerial implications for enhancing sustainable consumption in the literature and industry.

5.1. Theoretical Implications

This study discusses the theoretical implication to contribute to the literature by focusing on the causal aspects of SC. Based on the results, corporate communication (A3) and product packaging (A1) are among the causal aspects of SC. Particularly, corporate communication shows to be effective on the other SC aspects.
The results depict that corporate communication is among the causal aspects that play a significant role in achieving SC. Prior studies also found similar findings in which communication greatly impacts SC implementation [12,28,48]. Corporate communication entails effectively informing the consumers about the product’s sustainable information, with an emphasis on collaborating with consumers by interacting and building a relationship through social marketing or cause promotion, which can be included in the corporate social responsibility agenda. As found in prior studies, these collaborations and interactions should emphasize on communicating the sustainable benefits as the shared knowledge in order to improve the perception towards SC [36,48]. As a result, such knowledge potentially enhances the consumer perception of SC and, furthermore, improves the behavior, which is in line with other studies’ findings [19,22]. This study’s results show that corporate communication has a strong effect on other aspects, including consumer perception and behavior. In addition, the findings also show a similarity to other studies in which corporate communication have effects on product packaging, indicating that the communication depends on the product packaging when delivering the sustainable information to the consumers [10,12,47]. In sum, this study suggests that corporate communication should be achieved in integration through collaboration and interaction, and effective information on packaging to achieve and enhance SC. Future studies could explore the role of corporate communication in improving SC implementation, not only on the area of understanding the effects on perception and behavior, but on the challenges faced by the corporates, as asymmetry information often becomes a barrier.
Based on the results, product packaging is found to enhance SC, and prior studies have resulted in similar findings in which packaging is considered a potential way to directly inform the consumers about the product’s sustainability through the information reflected in the design and material [7,8,20]. Based on the results, this study also emphasizes that product packaging influences the other aspects including consumers’ perception and behavior. Similar to the findings from prior studies, this study’s results indicate the positive role of the packaging in improving the perception leading to sustainable behavior [7,44,49]. In particular, the sustainable information on the packaging normally comes in verbal and non-verbal forms, including letters, words, and phrases for a verbal form, and graphical information such as eco-labels for a non-verbal form. However, these findings are rather contradictive with prior studies which indicated that eco-labels can be difficult to differentiate and understand due to an exponential growth of the number of such labels over the years [12,21,34]. Therefore, this study suggests that product packaging should be used effectively by delivering easy-to-understand sustainable information and educating the consumers about proper packaging waste treatment. Future studies on product packaging’s impact on SC could place an emphasis on improving the production stage considering the use of recyclates and product’s recyclability after consumption.
In sum, in order to achieve SC, this study suggests giving corporate communication top priority, as this aspect exhibits the strongest effect on influencing consumer perception and behavior. Improving the product packaging as a tool to educate the consumers about the product’s sustainability is necessary to avoid mistreatment toward the packaging waste.

5.2. Managerial Implications

This section presents the criteria to provide industrial insights for food industry in Indonesia in order to improve the SC among the food consumers.
Green marketing (C12) plays an effective role to improve SC. The highlight of green marketing is an interactive communication among the corporations and consumers. One of the most common examples of green marketing programs are price cuts dedicated to environmental or social causes in the community, such as waste recycling or reduction programs. Specifically, in Indonesia food waste generation is caused by a lack of consumers’ contribution. Moreover, sustainable practices of consumption of packaged food products are low, and thus green marketing becomes an effective tool of corporate communication with the consumers to improve SC. There are benefits from conducting a green marketing strategy. For instance, as a result, purchasing sustainable packaged food provides consumers with a personal satisfaction for contributing to reducing waste. Nevertheless, corporations generate profits from the increased sales. Consumers with a concern in environmental impact tend to spend more on sustainable products or, at least, on green-marketed products. The impact of a successful green marketing strategy should improve the SC, as consumers become more concerned regarding their contribution to the environment. Therefore, this marketing strategy effectively affects sustainable consumption of packaged food products specially to generate less waste.
Green consumerism (C16) is affected by perception of the environmental impact. Consumers choose the food products based on the environmental impacts. The preferences tend to be based on the type of packaging, such as aluminum, carton, glass, or plastic, and extends to the reputation of the brand or corporation that produces the products. Although green consumers may be a niche community, their influence on other consumers must be considered. Moreover, the community is growing rapidly through social media campaigns in collaboration with environmental-oriented non-profit firms. Therefore, this study suggests that packaged food corporations should take advantage of the trend of green consumerism to obtain the attention. For example, corporations should involve more in reducing the use of materials that are harmful to the environment such as plastic straws and shopping bags in restaurants and shopping markets. Furthermore, this study suggests that corporations should consider using no packaging for the fresh products to generate less packaged food waste. In sum, green consumerism effectively improves SC with considerations such as corporate involvement with sustainable products during the production phases.
Verbal features (C15) are written letters, words, or phrases that are displayed on the product packaging. Such features affect consumers by allowing them to better understand the product sustainability. Moreover, corporations gain more trust from consumers by providing understandable sustainability features. This study suggests that packaged food corporations should take advantage of these features strategically to educate and convince the consumers during the decision-making process to purchase the products. This finding indicates that the use of verbal features potentially attracts consumers toward SC. These features comprise of sustainable information to accompany sustainable labels on the packaging and highlight the environmental benefits from purchasing the product. Moreover, verbal features can be an effective communication tool for corporations in building a sustainable brand or corporate image. A strong sustainable brand or corporate leads to contributing to greater SC. This study suggests that packaged food corporations should use descriptive verbal features on their product packaging in an attempt of communicating with consumers about sustainability. In addition, sustainability labels or logos should not be forgotten to be featured along with the verbal features.
Importance of information (C11) concerns on how corporates should be emphasizing on the content of information in their communication message for determining consumers’ behavior on SC. The information can be extended to more than features on product packaging, but also to corporate advertising and campaigning activities. Advertising can be achieved on either conventional media or on new media such as social media, corporate websites, and e-mailing. For the choice of media, this study suggests that corporates should study the audience characteristics so that the sustainability information can be effectively conveyed through the right media. Another way is that corporates can also use campaigns while collaborating with non-profit firms that focus on the environmental issues. Corporates that have collaborations with environment-oriented non-profit firms could gain a good reputation. As for the information, this study suggests that packaged food corporates should start from identifying well-studied environmental issues, preferably in the local community. Corporate campaigns that bring up a topic of the local environmental issue in their information will create an emotional bonding with the local consumers. This is as there is an image that the corporates want to solve the local community’s environmental problem.
This study proposes solutions for improving SC through the four criteria with the best performance. Packaged food corporates can use these criteria in their communication and marketing strategy, while at the same time contributing to the environmental sustainability through enhanced SC from the consumers. This study proves that the responsibility of sustainability does not only rely on what corporates should do but also on what the consumers can wisely choose to do. If applied with the right strategies and effectiveness, this helps to answer the environmental problem in Indonesia, especially to reduce the portion of waste from packaged food brands.

5.3. Limitations and Future Study Directions

There are limitations to this study. The attributes’ initial set is selected relying on the literature, which is subject to an incompletion to the model. Future study can extend the attributes set by involving the governmental attributes. This study uses a Delphi method to validate the attributes, yet is limited to the expert opinions which are subject to biases. Thus, involving a larger and more varied sample to validate the attributes is recommended for any future study. The generalizability of this study is limited to the food industry in Indonesia, however the results can be generalized in other companies in the food industry, which requires a future study to enhance the results’ generalizability. Alternatively, the future study could enlarge the geographical limitation by involving other countries and making a comparison among the countries in order to enrich SC.

6. Conclusions

This study involves 18 criteria categorized under four aspects including corporate communication, product packaging, consumer perception, and consumer behavior. The Delphi method is applied to eliminate and select the important attributes, and fuzzy DEMATEL is used to examine the attributes’ causal interrelationships by clarifying the experts’ opinions using their linguistic preferences.
The results show that two aspects fall in the causal group, with corporate communication exhibiting the strongest effect and product packaging having rather a weak effect toward the aspects in the effect group including consumer perception and consumer behavior. In particular, corporate communication requires greater attention for enhancing SC, as it strongly affects consumer perception and consumer behavior. Moreover, corporate communication needs to be prioritized for improving perception and behavior by focusing on collaboration and interaction with the consumers. Overall, 18 criteria are categorized into cause and effect criteria groups. This study recommends top causative criteria for enhancing SC in Indonesia, including green marketing, green consumerism, verbal features, and importance of information. Green marketing plays a role in involving the consumers in activities that support SC in order to raise the awareness and knowledge, building green consumerism among the consumers by persuasively communicating the sustainable information, improvement of sustainable verbal features through readable and understandable labels on the packaging, and emphasizing the sustainable information by using a combination of social media and mass media as communication tools to reach as many consumers as possible. Concentrating on these criteria is recommended to help practitioners effectively achieve SC in packaged food industry.
Furthermore, this study suggests that future studies should investigate attributes in a wider range by incorporating the government’s role in issuing policies toward the corporate’s sustainable activities and public support, to explore more possibilities and capabilities to enhance sustainable consumption. As an extension of this study’s results, corporate communication and product packaging could be further explored by integrating the use of digital technology, either from the operational side or consumer experience side. In sum, more studies are needed to better understand sustainable consumption, not only by identifying the causing and affected attributes, but also the challenges in the implementation.

Author Contributions

Conceptualization, first version writing, and final version editing: M.-L.T.; Conceptualization, first version writing, and final version editing, C.-W.R.L.; Conceptualization, first version writing, and final version editing, R.Y.S.; Conceptualization, first version writing, and final version editing, M.K.L.; Conceptualization, first version writing, and final version editing, T.-D.B. All authors have read and agreed to the published version of the manuscript.

Funding

This research received no external funding.

Institutional Review Board Statement

Not applicable.

Informed Consent Statement

Not applicable.

Data Availability Statement

Not applicable.

Conflicts of Interest

The authors declare no conflict of interest.

Appendix A

Questionnaire of sustainable consumption attributes’ interrelationship
Questionnaire
Sustainable consumption attributes’ interrelationship
Greetings,
We are a team of researchers from College of Management, Asia University, Taichung, Taiwan. Currently, we are conducting a study on sustainable consumption which is described as closely related to people’s consumption patterns of products on the market with the effect on the environment, taking place in Indonesia. The products discussed in this study are packaged food products, which are easily found in minimarkets to hypermarkets.
We appreciate and thank you for the willingness and time you have given to answer this questionnaire.
For further information or any question, please feel free to reach us.
This questionnaire aims to find the relationship between aspects and between criteria. There are four aspects and 18 criteria that will be asked in this questionnaire. The following is a description of the attributes in question.
AspectsCriteriaDescription
A1Product packagingC1Sustainability labelsThe visibility of sustainability labels on the packaging is important
C2Packaging designGreen appearance of the product is part of the design of the packaging
C3Material typeThere are different types of packaging material that are sustainable
C4Packaging recyclabilityThere are different recyclable types of packaging material
C5Environmental impactProduct packaging have different impacts on the environment
A2Consumer perceptionC6Environmental consciousnessConsumers’ consciousness about the environmental benefits
C7Disposal stageConsumers’ perception of the environmental sustainability is based on the material type and on what they can do at the end of life/disposal stage
C8Knowledge of sustainability labelsConsumers have different degrees of knowledge in understanding labels on sustainable packaging
A3Corporate communicationC9Communication of sustainability characteristicsCorporates communicate sustainability characteristics with the consumers
C10Communication of environmental benefitsCommunication efforts should emphasize the environmental benefits
C11Importance of information contentThe role of information is important in determining consumer behavior changes
C12Green marketingCorporates conduct marketing strategies which are green/sustainability-based
C13Source of informationInformation for consumers are needed from the scientific field
C14Augmentation of perceptionCorporates do campaigns to augment the consumers’ perception
C15Verbal featuresVerbal features are used to communicate sustainability explicitly through labelling
A4Consumer behaviorC16Green consumerismGreen consumers are concerned on the environmental impacts of products they consume
C17Lifecycle in domestic phasePackaging lifecycle in domestic phase
C18Dietary changeConsumers with a concern on the environmental issues may cause a dietary change
Matrix Filling Instructions
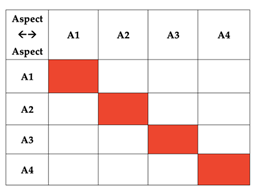
  • Of the attributes above (A1–A4 and C1–C18), please fill in the relationship between the aspect-to-aspect and criterion-to-criterion based on their importance with each other using the indicators below.
    VHI = Very High
    HI = High
    M = Normal
    L = Low
    VL = Very Low
    For example:
    Sustainability 13 08021 i001
  • Please leave the red boxes unfilled.
    Answer sheets
    Matrix of aspects
    Sustainability 13 08021 i002
    Matrix of criteria
    Sustainability 13 08021 i003
This is the end of the questionnaire. If you have any suggestion or comment on the study, please feel free contact us. Thank you very much for your cooperation!

References

  1. GlobalData. Indonesia’s Packaging Market to Grow at 2.4% CAGR and Reach 159.2 Billion Units by 2024, Says GlobalData, 2020. Available online: https://www.globaldata.com/indonesias-packaging-market-grow-2-4-cagr-reach-159-2-billion-units-2024-says-globaldata/ (accessed on 11 January 2021).
  2. Global Food Security Index Home Page. Available online: https://foodsecurityindex.eiu.com/ (accessed on 13 January 2021).
  3. Waste Composition 2020 Home Page. Available online: https://sipsn.menlhk.go.id/sipsn/?q=3a-sumber-sampah&page=12 (accessed on 11 January 2021).
  4. Food and Agriculture Organization of the United Nation. Food Loss and Food Waste. Available online: http://fao.org/food-loss-and-food-waste/en (accessed on 13 January 2021).
  5. INCPEN. Key Findings Report: UK Survey 2019 on Citizens’ Attitudes & Behaviours Relating to Food Waste, Packaging and Plastic Packaging; WRAP: Banbury, UK, 2019. [Google Scholar]
  6. Boesen, S.; Bey, N.; Niero, M. Environmental sustainability of liquid food packaging: Is there a gap between Danish consumers’ perception and learnings from life cycle assessment? J. Clean. Prod. 2019, 210, 1193–1206. [Google Scholar] [CrossRef]
  7. Brennan, L.; Langley, S.; Verghese, K.; Lockrey, S.; Ryder, M.; Francis, C.; Phan-Le, N.; Hill, A. The role of packaging in fighting food waste: A systematised review of consumer perceptions of packaging. J. Clean. Prod. 2021, 281, 125276. [Google Scholar] [CrossRef]
  8. Gerassimidou, S.; Martin, O.; Chapman, S.; Hahladakis, J.; Iacovidou, E. Development of an integrated sustainability matrix to depict challenges and trade-offs of introducing bio-based plastics in the food packaging value chain. J. Clean. Prod. 2021, 286, 125378. [Google Scholar] [CrossRef]
  9. Olsen, S.O.; Tuu, H.H. The relationships between core values, food-specific future time perspective and sustainable food consumption. Sustain. Prod. Consum. 2021, 26, 469–479. [Google Scholar] [CrossRef]
  10. Potter, H.; Röös, E. Multi-criteria evaluation of plant-based foods—Use of environmental footprint and LCA data for consumer guidance. J. Clean. Prod. 2021, 280, 124721. [Google Scholar] [CrossRef]
  11. Dorce, L.; da Silva, M.; Mauad, J.; Domingues, C.; Borges, J. Extending the theory of planned behavior to understand consumer purchase behavior for organic vegetables in Brazil: The role of perceived health benefits, perceived sustainability benefits and perceived price. Food Qual. Prefer. 2021, 91, 104191. [Google Scholar] [CrossRef]
  12. Thomas, C.; Maitre, I.; Picouet, P.; Symoneaux, R. Organic consumers’ perceptions of environmental impacts of food overlap only partially with those considered by life cycle assessment. J. Clean. Prod. 2021, 298, 126676. [Google Scholar] [CrossRef]
  13. Lim, W.M. A blueprint for sustainability marketing: Defining its conceptual boundaries for progress. Mark. Theory 2016, 16, 232–249. [Google Scholar] [CrossRef]
  14. Ahamad, N.R.; Ariffin, M. Assessment of knowledge, attitude and practice towards sustainable consumption among university students in Selangor, Malaysia. Sustain. Prod. Consum. 2018, 16, 88–98. [Google Scholar] [CrossRef]
  15. Bravi, L.; Francioni, B.; Murmura, F.; Savelli, E. Factors affecting household food waste among young consumers and actions to prevent it. A comparison among UK, Spain and Italy. Resour. Conserv. Recycl. 2020, 153, 104586. [Google Scholar] [CrossRef]
  16. Dong, C.; Wang, B.; Li, F.; Zhong, Q.; Xia, X.; Kong, B. Effects of edible chitosan coating on Harbin red sausage storage stability at room temperature. Meat Sci. 2020, 159, 107919. [Google Scholar] [CrossRef]
  17. Sorrell, S.; Gatersleben, B.; Druckman, A. The limits of energy sufficiency: A review of the evidence for rebound effects and negative spillovers from behavioural change. Energy Res. Soc. Sci. 2020, 64, 101439. [Google Scholar] [CrossRef]
  18. Hoek, A.; Malekpour, S.; Raven, R.; Court, E.; Bryne, E. Towards environmentally sustainable food systems: Decision-making factors in sustainable food production and consumption. Sustain. Prod. Consum. 2021, 26, 610–626. [Google Scholar] [CrossRef]
  19. Tseng, M.L.; Sujanto, R.Y.; Iranmanesh, M.; Tan, K.; Chiu, A.S.F. Sustainable packaged food and beverage consumption transition in Indonesia: Persuasive communication to affect consumer behavior. Resour. Conserv. Recycl. 2020, 161, 104933. [Google Scholar] [CrossRef]
  20. Chen, C.C.; Sujanto, R.Y.; Tseng, M.L.; Fujii, M.; Lim, M.K. Sustainable consumption transition model: Social concerns and waste minimization under willingness-to-pay in Indonesian food industry. Resour. Conserv. Recycl. 2021, 170, 105590. [Google Scholar] [CrossRef]
  21. Janßen, D.; Langen, N. The bunch of sustainability labels—Do consumers differentiate? J. Clean. Prod. 2017, 143, 1233–1245. [Google Scholar] [CrossRef]
  22. Vega-Zamora, M.; Torres-Ruiz, F.J.; Parras-Rosa, M. Towards sustainable consumption: Keys to communication for improving trust in organic foods. J. Clean. Prod. 2019, 216, 511–519. [Google Scholar] [CrossRef]
  23. Annunziata, A.; Mariani, A.; Vecchio, R. Effectiveness of sustainability labels in guiding food choices: Analysis of visibility and understanding among young adults. Sustain. Prod. Consum. 2019, 17, 108–115. [Google Scholar] [CrossRef]
  24. Flanagan, A.; Priyadarshini, A. A study of consumer behaviour towards food-waste in Ireland: Attitudes, quantities and global warming potentials. J. Environ. Manag. 2021, 284, 112046. [Google Scholar] [CrossRef]
  25. Altintzoglou, T.; Honkanen, P.; Whitaker, R. Influence of the involvement in food waste reduction on attitudes towards sustainable products containing seafood by-products. J. Clean. Prod. 2021, 285, 125487. [Google Scholar] [CrossRef]
  26. Kaczorowska, J.; Rejman, K.; Halicka, E.; Szczebyło, A.; Górska-Warsewicz, H. Impact of food sustainability labels on the perceived product value and price expectations of urban consumers. Sustainability 2019, 11, 7240. [Google Scholar] [CrossRef] [Green Version]
  27. Yokokawa, N.; Amasawa, E.; Hirao, M. Design assessment framework for food packaging integrating consumer preferences and environmental impact. Sustain. Prod. Consum. 2021, 27, 1514–1525. [Google Scholar] [CrossRef]
  28. Fischer, D.; Reinermann, J.; Mandujano, G.; DesRoches, C.; Diddi, S.; Vergragt, P. Sustainable consumption communication: A review of an emerging field of research. J. Clean. Prod. 2021, 300, 126880. [Google Scholar] [CrossRef]
  29. Morley, A. Procuring for change: An exploration of the innovation potential of sustainable food procurement. J. Clean. Prod. 2021, 279, 123410. [Google Scholar] [CrossRef]
  30. Tseng, M.L. Using social media and qualitative and quantitative information scales to benchmark corporate sustainability. J. Clean. Prod. 2017, 142, 727–738. [Google Scholar] [CrossRef]
  31. Yeh, L.T.; Tseng, M.L.; Lim, M. Assessing the carry-over effects of both human capital and organizational forgetting on sustainability performance using dynamic data envelopment analysis. J. Clean. Prod. 2020, 250, 119584. [Google Scholar] [CrossRef]
  32. IISD—Earth Negotiations Bulletin. Oslo Roundtable on Sustainable Consumption and Production. Available online: http://enb.iisd.org/consume/oslo004.html (accessed on 20 April 2021).
  33. Awan, U.; Khattak, A.; Rabbani, S.; Dhir, A. Buyer-Driven Knowledge Transfer Activities to Enhance Organizational Sustainability of Suppliers. Sustainability 2020, 12, 2993. [Google Scholar] [CrossRef] [Green Version]
  34. Siegrist, M.; Hartmann, C. Impact of sustainability perception on consumption of organic meat and meat substitudes. Appetite 2019, 132, 196–202. [Google Scholar] [CrossRef]
  35. Steenis, N.D.; van Herpen, E.; van der Lans, I.A.; Ligthart, T.N.; van Trijp, H.C.M. Consumer response to packaging design: The role of packaging materials and graphics in sustainability perceptions and product evaluations. J. Clean. Prod. 2017, 162, 286–298. [Google Scholar] [CrossRef]
  36. Feil, A.A.; Cyrne, C.C.; Sindelar, F.C.; Barden, J.E.; Dalmoro, M. Profiles of sustainable food consumption. Consumer behavior toward organic food in southern region of Brazil. J. Clean. Prod. 2020, 258, 120690. [Google Scholar] [CrossRef]
  37. Dhir, A.; Malodia, S.; Awan, U.; Sakashita, M.; Kaur, P. Extended valence theory perspective on consumers’ e-waste recycling intentions in Japan. J. Clean. Prod. 2021, 312, 127443. [Google Scholar] [CrossRef]
  38. Nicolau, J.; Guix, M.; Hernandez-Maskivker, G.; Molenkamp, N. Millenials’ willingness to pay for green restaurants. Int. J. Hosp. Manag. 2020, 90, 102601. [Google Scholar] [CrossRef]
  39. Notarnicola, B.; Tassielli, G.; Renzulli, P.A.; Castellani, V.; Sala, S. Environmental impacts of food consumption in Europe. J. Clean. Prod. 2017, 140, 753–765. [Google Scholar] [CrossRef]
  40. Rondoni, A.; Grasso, S. Consumers behaviour towards carbon footprint labels on food: A review of the literature and discussion of industry implications. J. Clean. Prod. 2021, 301, 127031. [Google Scholar] [CrossRef]
  41. Maniatis, P. Investigating factors influencing consumer decision-making while choosing green products. J. Clean. Prod. 2016, 132, 215–228. [Google Scholar] [CrossRef]
  42. Keränen, O.; Komulainen, H.; Lehtimäki, T.; Ulkuniemi, P. Restructuring existing value networkds to diffuse sustainable innovations in food packaging. Ind. Mark. Manag. 2021, 93, 509–519. [Google Scholar] [CrossRef]
  43. Petkoska, A.; Daniloski, D.; D’Cunha, N.; Naumovski, N.; Broach, A. Edible packaging: Sustainable solutions and novel trends in food packaging. Food Res. Int. 2021, 140, 109981. [Google Scholar] [CrossRef]
  44. Nikolaou, I.E.; Kazantzidis, L. A sustainable consumption index/label to reduce information asymmetry among consumers and producers. Sustain. Prod. Consum. 2016, 6, 51–61. [Google Scholar] [CrossRef]
  45. Zhao, R.; Geng, Y.; Liu, Y.; Tao, X.; Xue, B. Consumers’ perception, purchase intention, and willingness to pay for carbon-labeled products: A case study of Chengdu in China. J. Clean. Prod. 2018, 171, 1664–1671. [Google Scholar] [CrossRef]
  46. Jacobsen, L.; Stancu, V.; Wang, Q.; Aschemann-Witzel, J.; Lahteenmäki, L. Connecting food consumers to organisations, peers, and technical devices: The potential of interactive communication technology to support consumers’ value creation. Trends Food Sci. Technol. 2021, 109, 622–631. [Google Scholar] [CrossRef]
  47. Sultan, P.; Tarafder, T.; Pearson, D.; Henryks, J. Intention-behaviour gap and perceived behavioural control-behaviour gap in the theory of planned behaviour: Moderating roles of communication, satisfaction and trust in organic food consumption. Food Qual. Prefer. 2020, 81, 103838. [Google Scholar] [CrossRef]
  48. Azzura, A.; Massimiliano, A.; Angela, M. Measuring sustainable food consumption: A case study on organic food. Sustain. Prod. Consum. 2019, 17, 95–107. [Google Scholar] [CrossRef]
  49. Lombardi, G.V.; Berni, R.; Rocchi, B. Environmental friendly food. Choice experiment to assess consumer’s attitude toward “climate neutral” milk: The role of communication. J. Clean. Prod. 2017, 142, 257–262. [Google Scholar] [CrossRef]
  50. Liu, C.; Zheng, Y.; Cao, D. An analysis of factors affecting selection of organic food: Perception of consumers in China regarding weak signals. Appetite 2021, 161, 105145. [Google Scholar] [CrossRef]
  51. Food Sustainability Index. Available online: https://foodsustainability.eiu.com/food-loss-and-waste/ (accessed on 22 May 2021).
  52. Forbes, H.; Quested, T.; O’Connor, C. Food Waste Index Report 2021; United Nations Environment Programme: Nairobi, Kenya, 2021. [Google Scholar]
  53. Widyaningrum, G.L. Kemasan makanan dan minuman menjadi sampah terbanyak kedua di pantai. Natl. Geogr. Indonesia 2019. Available online: https://nationalgeographic.grid.id/read/131853669/kemasan-makanan-dan-minuman-menjadi-sampah-terbanyak-kedua-di-pantai (accessed on 23 May 2021).
  54. Ishikawa, A.; Amagasa, M.; Shiga, T.; Tomizawa, G.; Tatsuta, R.; Mieno, H. The max-min Delphi method and fuzzy Delphi method via fuzzy integration. Fuzzy Sets Syst. 1993, 55, 241–253. [Google Scholar] [CrossRef]
  55. Noorderhaven, N.G. Strategic Decision Making; Addison-Wesley Publishing: Boston, MA, USA, 1995. [Google Scholar]
  56. Lee, C.H.; Wu, K.J.; Tseng, M.L. Resource management practice through ecoinnovation toward sustainable development using qualitative information and quantitative data. J. Clean. Prod. 2018, 202, 120–129. [Google Scholar] [CrossRef]
  57. Cabrerizo, F.J.; Chiclana, F.; Hmouz, R.; Morfeq, A.; Balamash, A.S.; Herrera-Viedma, E. Fuzzy decision making and consensus: Challenges. J. Intell. Fuzzy Syst. 2015, 29, 1109–1118. [Google Scholar] [CrossRef] [Green Version]
Figure 1. Causal-effect diagram for aspects with interrelationship strength indicators.
Sustainability 13 08021 g001
Figure 2. Causal-effect diagram for criteria.
Sustainability 13 08021 g002
Table 1. Aspects and criteria of sustainable consumption.
AspectsCriteriaDescriptionReference
A1Product packagingC1Sustainability labelsThe visibility of sustainability labels on the packaging is important[23,40,44,45]
C2Packaging designGreen appearance of the product is part of the design of the packaging[27,35,41]
C3Material typeThere are different types of packaging material that are sustainable[35,42]
C4Packaging recyclabilityThere are different recyclable types of packaging material[6]
C5Environmental impactProduct packaging have different impacts on the environment[6,43]
A2Consumer perceptionC6Environmental consciousnessConsumers’ consciousness about the environmental benefits[41,50]
C7Disposal stageConsumers’ perception of the environmental sustainability is based on the material type and on what they can do at the end of life/disposal stage[6]
C8Knowledge of sustainability labelsConsumers have different degrees of knowledge in understanding labels on sustainable packaging[6,35]
A3Corporate communicationC9Communication of sustainability characteristicsCorporates communicate sustainability characteristics with the consumers[23]
C10Communication of environmental benefitsCommunication efforts should emphasize the environmental benefits[48]
C11Importance of information contentThe role of information is important in determining consumer behavior changes[40,49]
C12Green marketingCorporates conduct marketing strategies which are green/sustainability-based[28,41]
C13Source of informationInformation for consumers is needed from the scientific field[46,49]
C14Augmentation of perceptionCorporates run campaigns to augment the consumers’ perception[22]
C15Verbal featuresVerbal features are used to communicate sustainability explicitly through labelling[19,35]
A4Consumer behaviorC16Green consumerismGreen consumers are concerned about the environmental impacts of products they consume[38,41]
C17Lifecycle in domestic phasePackaging lifecycle in domestic phase[39]
C18Dietary changeConsumers with a concern about the environmental issues may experience a dietary change[18,39]
Table 2. Expert demographics based on position, gender, education levels, and years of experience.
ExpertPositionGenderEducation LevelsYears of Exp.
1.Chief of OperationsMalePh.D26
2.Director of MarketingFemaleMaster13
3.Marketing ManagerFemaleMaster10
4.Marketing ManagerFemaleMaster12
5.Product Development ManagerFemalePh.D16
6.Executive MarketingFemalePh.D14
7.Restaurant ManagerMaleMaster13
8.Restaurant ManagerMaleMaster11
9.AcademicsFemalePh.D11
10.AcademicsMalePh.D9
11.AcademicsFemaleMaster7
Table 3. Triangular fuzzy numbers’ linguistic scale.
ScaleLinguistic VariableCorresponding Triangular Fuzzy Numbers (TFN)
VLVery low influence(0.0, 0.1, 0.3)
LLow influence(0.1, 0.3, 0.5)
MModerate influence(0.3, 0.5, 0.7)
HIHigh influence(0.5, 0.7, 0.9)
VHIVery high influence(0.7, 0.9, 1.0)
Table 4. Transformed triangular fuzzy numbers for aspects.
A1 A2 A3 A4
A1(1.0001.0001.000)(1.0000.3000.500)(0.5000.7000.900)(0.5000.7000.900)
A2(0.5000.7000.900)(1.0001.0001.000)(1.0000.3000.500)(0.7000.9001.000)
A3(0.5000.7000.900)(0.7000.9001.000)(1.0001.0001.000)(1.0000.3000.500)
A4(0.5000.7000.900)(0.7000.9001.000)(1.0000.3000.500)(1.0001.0001.000)
Table 5. Crisp values for the aspects.
A1A2A3A4
A10.6540.3550.4930.459
A20.2750.7070.3710.594
A30.5020.5600.7280.371
A40.4840.5430.2640.707
Table 6. Crisp values for the criteria.
C1C2C3C4C5C6C7C8C9C10C11C12C13C14C15C16C17C18
C10.7350.5870.5190.4750.5130.4160.3590.5280.4660.4390.5180.5660.3150.4410.5330.5150.3340.380
C20.5640.7380.5550.4250.5140.4670.4120.4270.4990.4900.4660.6010.3510.3910.5160.5030.3860.362
C30.5980.5990.7140.5800.6290.4500.4830.4640.4980.4190.4680.5860.3530.4800.5170.4850.5100.465
C40.5440.4820.6000.7460.5770.4620.5090.5260.4810.4870.5520.5000.4730.4210.4850.4640.5110.446
C50.5460.5000.6030.5300.7450.4990.5480.5410.4640.4910.5500.5320.4920.4230.4990.5350.5280.449
C60.5290.4500.5330.5270.5430.7220.4990.5640.5020.4920.4330.5020.4890.4230.5540.5500.4730.535
C70.4960.4660.5710.5120.5480.6040.7590.4930.4320.4390.4660.4500.4900.4410.5160.5690.5590.516
C80.5750.4680.5530.5440.5430.5500.5460.7140.4490.4730.4670.5480.4720.5620.4860.5330.5070.501
C90.5780.5850.5170.4930.4980.5530.5450.5410.7310.5590.4840.5490.5420.5140.5200.4320.4410.432
C100.5440.4670.5170.5280.5250.5190.4980.4740.5520.7430.5510.5970.5270.4930.4300.4670.4750.416
C110.5300.4830.4820.5480.4950.6000.5670.5620.4860.5100.7380.4130.6410.5600.4480.4500.4570.469
C120.5960.6010.6330.5440.5430.5230.5180.4910.5480.5900.4970.7330.5090.4590.5200.5560.4930.539
C130.4910.3070.4320.4930.4980.5670.5300.5120.4670.5090.5990.5680.7520.5480.4650.5000.5100.533
C140.5460.4300.5500.4640.5180.5660.5670.5440.4800.5220.5130.5000.5420.7120.4820.5210.5140.536
C150.5570.5300.5330.4910.4430.5390.5500.5290.5360.5260.5360.5030.5760.5490.7320.5190.4910.483
C160.6300.5490.5990.5440.5790.5850.5480.5610.4480.4380.4630.5360.4750.4730.5360.7190.5940.584
C170.5280.4680.5650.5460.6290.5470.5990.5780.5190.4570.4840.4140.4910.4750.5030.5350.7210.501
C180.4620.4320.4820.4800.4790.5680.5320.5260.4680.4210.5050.5150.4930.5750.5880.5830.5290.729
Table 7. Interrelationship matrix of the aspects A1–A4.
A1A2A3A4
A13.2083.5033.0043.528
A22.9513.6462.8733.565
A33.4373.9813.4283.843
A43.1273.6252.8773.690
Table 8. Causal-effect interrelationships among the aspects.
αβCausal (α + β)Effect (α − β)
A113.24212.72325.9650.519
A213.03514.75427.788−1.719
A314.68912.18126.8702.507
A413.31814.62527.943−1.307
Table 9. Interrelationship matrix for the criteria of C1–C18.
C1C2C3C4C5C6C7C8C9C10C11C12C13C14C15C16C17C18
C11.0210.9220.9910.9390.9760.9550.9330.9530.8940.8890.9240.9620.8710.8810.9310.9390.8800.870
C21.0060.9390.9970.9360.9790.9630.9410.9450.9000.8970.9210.9680.8780.8780.9320.9400.8880.871
C31.0800.9891.0831.0181.0601.0291.0161.0160.9630.9520.9861.0340.9400.9500.9971.0040.9640.943
C41.0710.9741.0681.0331.0511.0271.0161.0190.9580.9560.9921.0220.9500.9410.9910.9990.9620.939
C51.0950.9971.0921.0331.0921.0541.0421.0440.9770.9781.0141.0480.9730.9631.0141.0290.9850.960
C61.0770.9761.0681.0171.0551.0611.0211.0300.9660.9630.9861.0290.9580.9481.0051.0150.9640.954
C71.0740.9791.0731.0161.0561.0501.0491.0230.9590.9580.9901.0240.9590.9501.0011.0180.9740.953
C81.1000.9951.0891.0361.0731.0621.0441.0630.9770.9781.0071.0510.9730.9791.0151.0310.9840.967
C91.1011.0081.0861.0311.0691.0631.0451.0461.0080.9881.0101.0530.9810.9751.0191.0210.9780.961
C101.0780.9781.0661.0171.0521.0401.0211.0200.9720.9890.9981.0390.9620.9550.9911.0060.9640.942
C111.0880.9901.0741.0301.0611.0601.0401.0410.9750.9751.0291.0300.9850.9731.0041.0150.9730.958
C121.1461.0491.1401.0771.1161.1011.0821.0821.0271.0291.0501.1131.0161.0071.0591.0741.0221.010
C131.0700.9581.0551.0111.0471.0431.0221.0220.9600.9621.0011.0330.9840.9590.9921.0070.9660.952
C141.0990.9931.0901.0291.0721.0651.0481.0480.9820.9841.0141.0480.9820.9961.0161.0310.9870.973
C151.1131.0151.1011.0441.0761.0751.0581.0581.0000.9961.0281.0610.9970.9911.0541.0430.9960.978
C161.1461.0411.1341.0741.1161.1041.0821.0861.0141.0101.0441.0891.0091.0051.0581.0881.0301.012
C171.1031.0021.0971.0431.0891.0691.0571.0560.9910.9821.0161.0440.9820.9761.0231.0381.0130.974
C181.0760.9811.0701.0181.0551.0531.0321.0330.9690.9621.0001.0360.9650.9701.0151.0250.9760.981
Table 10. Causal-effect interrelationships among the criteria.
αβCausal (α + β)Effect (α − β)
C116.73119.54536.275−2.814
C216.77917.78634.565−1.007
C318.02419.37337.397−1.349
C417.96818.40136.370−0.433
C518.39019.09537.485−0.705
C618.09318.87336.966−0.780
C718.10518.54936.654−0.445
C818.42418.58437.008−0.160
C918.44117.49335.9340.948
C1018.08917.44735.5370.642
C1118.30118.00836.3100.293
C1219.19918.68237.8810.517
C1318.04417.36735.4110.677
C1418.45917.29735.7561.162
C1518.68218.11536.7970.566
C1619.14018.32337.4630.818
C1718.55717.50436.0611.054
C1818.21617.19835.4141.018
Publisher’s Note: MDPI stays neutral with regard to jurisdictional claims in published maps and institutional affiliations.

