Abstract
The management of livestock manures and slurries noticeably improved since the massive introduction of anaerobic digestion (AD) plants in Italy and other European Union (EU) countries. However, these plants heavily rely on incentives, and the recent switch of European biogas policies from electricity to biomethane potentially threatens the economic viability of manure AD. In this study, three retrofit options are analyzed for an installation in Piedmont (NW Italy) that is currently producing 999 kWel through combined heat and power (CHP). The techno-economic feasibility and the greenhouse gas (GHG) budget is analyzed for each solution. Results show that exploiting current incentives on electricity is vital to fund the retrofit of CHP plants to biomethane. Energy crop and electricity prices, the sale price of biomethane certificates after the end of incentives, and biogas productivity are the critical parameters for the economic profitability of manure AD plants, along with the possibility to deliver biomethane directly to the pipeline grid. This study provides insight to the reconversion of manure AD plants, addressing issues that affect hundreds of installations in Italy and other EU countries.
1. Introduction
The reduction of greenhouse gas (GHG) emissions and the increase in renewable energy production are two pillars of European policies. With the Energy Roadmap 2050, the European Union pledged to achieve a reduction of 80–95% of GHG emissions compared to 1990 [1], with an intermediate milestone of 32% renewable energy coverage for electricity, heating, and transport by the year 2030 [2].
In this context, bioenergy performs a key role and the production of biogas from anaerobic digestion (AD) has been rapidly increasing in recent years [3,4]. Municipal solid waste landfills are an important biogas source that must be recovered due to the high greenhouse effect of methane [5,6]. For all other cases, biogas is produced with specifically developed anaerobic digesters that use different feedstocks, among which are agricultural crop residues and/or dedicated energy crops, livestock manure, organic fraction of municipal solid waste, and wastewater sludge [7].
The largest use of biogas currently occurs in combined heat and power (CHP) plants to produce electricity and heat. As of 2019, 18,943 biogas plants and 725 biomethane plants were operating in Europe, producing 167 TWhth of biogas used for CHP and 26 TWhth of biomethane. Although CHP largely prevails, biomethane production is increasing at a fast rate (+15% in 2019) [8].
The use of biogas for CHP proved suboptimal because usually a relevant share of the heat produced cannot be exploited on site due to the absence of users. This aspect is highlighted by a recent study on the energy efficiency of several possible uses of biogas (electricity, heating, CHP, and transportation) [9]. Biomethane used with combined cycle gas turbines (CCGT) achieves higher electrical efficiencies compared to biogas internal combustion engine (ICE) generators. As for CHP, biomethane can be used for plants where all the heat is exploited (e.g., district heating power stations) and thus exceed the energy efficiency achievable with biogas. Finally, biomethane can be used for transportation [10,11]. Several countries changed incentive policies in recent years to switch biogas use to the production of biomethane to be dispatched on the gas pipeline network. However, the end of incentives for electricity production poses a serious threat to the economic viability of existing biogas plants. Addressing this issue is of particular importance when AD plants also represent a waste disposal measure, i.e., for plants fed with organic waste fraction, food industry waste, and manure [12,13].
This study presents an energetic, economic, and environmental assessment on the retrofit of a manure-fed AD plant in Piedmont (NW Italy) that represents a typical case study for hundreds of installations that were performed in Italy, mainly between 2008 and 2013 [14]. The plant, built in 2012, is currently operating to produce electricity with a 999 kWel combined heat and power (CHP) unit, but the incentive through feed-in tariff ends in 2027. A reconversion is therefore being considered to ensure the plant operation in the future. Three options were considered, namely (1) the immediate switch to biomethane, keeping a smaller combined CHP unit to cover the energy needs of the plant, or (2) to delay this switch after the end of electricity incentives, with (2a) or without (2b) installing a smaller CHP unit sized for self-consumption. In this study, the above-described options were compared to the aim to identify the optimal from of an energetic, environmental, and economic point of view.
2. The Case Study
2.1. Territorial Context
The AD plant studied in this work is installed in a small village in the southern plain of Piedmont (NW Italy). Piedmont has a population of 4.36 million inhabitants (7.2% of the national population) and it hosts a large share of the national livestock production, namely 0.81 million cows, 1.28 million pigs, and 9.2 million poultry (i.e., 14.3%, 14.5%, and 6.7% of the national production, respectively) [15]. Such intense breeding activity represents a severe environmental pressure, especially for nitrate leaching into groundwater and ammonia emissions. Groundwater nitrate concentrations in the shallow aquifers of this region generally exceed the USEPA standard of 10 mg/L, with several monitoring wells that exceed the Italian law threshold of 50 mg/L [16]. Based on the EU Directive 91/676/CEE [17], the Piedmont regional government set the boundaries of Nitrate Vulnerable Zones (NVZs) in which the spreading of manure is limited to 170 kg N/ha/year, i.e., half of the normal limit (340 kg N/ha/year) set for the rest of the regional territory [18]. The overall area of the NVZ as of the year 2021 is 3637 km2, i.e., 14.3% of the surface of the region. The opportunity to perform ammonia removal treatments on manure and slurries in large-scale centralized plants is therefore of key importance to reduce nitrogen loads on soils and aquifers. In addition, the high density of livestock represents a resource for biogas production with a short supply chain. Piedmont and the Po Valley are among the areas with the highest potential in the EU for manure-operated AD plants [19]. Not surprisingly, the incentives for biogas production set in 2008 boosted the expansion of biogas plants in Piedmont, where the power production was 1 TWh/y in 2019 (i.e., 12.4% of the national biogas production) [14]. As previously explained, the incentive policies recently switched to biomethane, and existing AD plants must cope with this change to ensure their future operation. For this reason, the techno-economic feasibility of retrofitting an existing biogas CHP plant was assessed in a representative installation.
2.2. Plant Description
The AD plant analyzed in this study was built in 2012 by a local consortium of 16 farms promoted by the municipality administration with the aim to improve the management of manure. In particular, the consortium was formed to simplify the administrative and sanitary procedures related to the transport of animal waste and to schedule the deliveries of manure to each farm. Therefore, each farm regularly contributes with manure, collects a proportional quantity of digestate and disposes it under its own responsibility. Each day, the plant collects about 100 t of swine manure and slurry, 16 t of cattle manure, 30 t of corn silage, and 10 t of triticale silage.
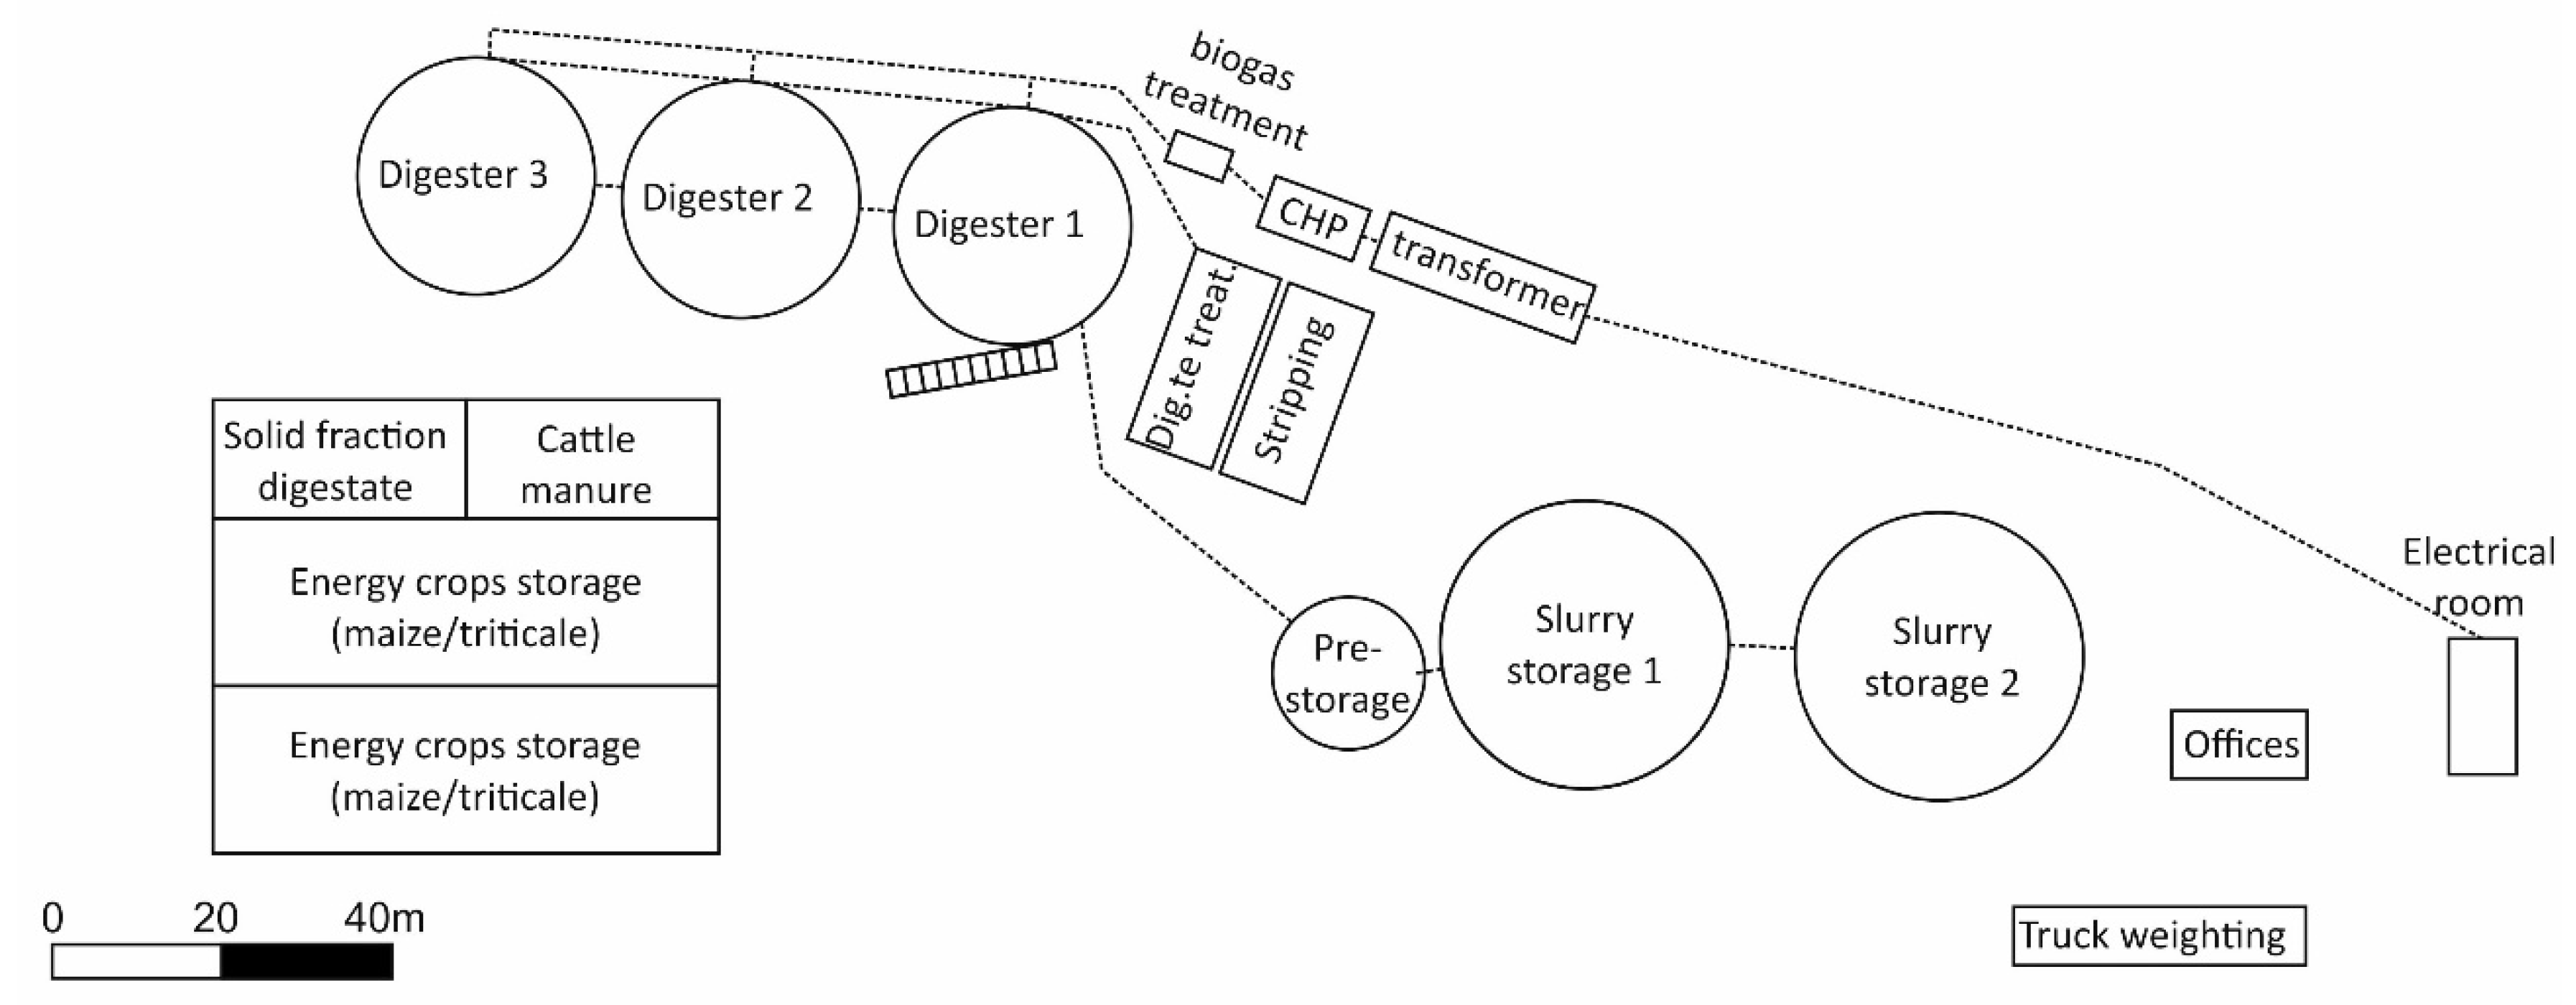
As shown in Figure 1, the plant is composed of 3 digesters in series, a storage section for swine manure composed of 2 concrete cylindrical storage tanks (4991 m3 each) and a smaller pre-charge tank (703 m3), 2 storage sections for corn and triticale silage (20 × 60 × 5 m each, with a total storage volume of 12,000 m3), and 3 storage sections for cattle manure and solid fraction of digestate (total volume: 3090 m3).

Figure 1.
Plan view of the AD plant.
The 3 dome-shaped digesters (28 m diameter, 6 m high, 3323 m3 each) operate in series with a total retention time of 60 days. The current production of 10,523 Nm3/d of biogas is performed, approximately 60% by the first digester, 30% by the second and 10% by the third. The plant operates in a mesophile regime at a temperature of 41 ± 1 °C with a thermal regulation performed using the heat produced by the CHP system. The biogas produced, with an average CH4 concentration of about 55%, is treated before being sent to the CHP system through the following steps: (i) gravel filtration, (ii) desulphurization, (iii) dehumidification. The CHP system is a General Electric Jensbacher J 320 GS-C25 with an electric power of 999 kWel (an electric efficiency of 40.6%) and a recoverable thermal power of 1248 kWth (thermal efficiency: 50.7%) [20]. The CHP system currently produces 8350 MWhel/y, 7500 MWhel/y of which are sent to the grid and 850 MWhel/y (i.e., 10.2% of the overall production) are consumed by the AD plant.
The plant is equipped with an ammonia stripping unit with a treatment capacity of 60 m3/h, which uses a share of the heat produced by the CHP unit (270 kWhth) to foster air stripping. The stripping unit removes about 40 t/y of nitrogen on a total input of 85 t/y, transforming it into ammonium sulphate to be used for fertilizer and glue production. The nitrogen removal yield achieved with the stripping treatment (47%) results in a reduction of 132 to 264 ha (depending on whether the NVZ constraints apply or not) of the cultivated area needed for spreading the digestate, compared to raw manure.
2.3. Incentivization Regimes for AD Plants
Since 1999, different incentives have been introduced in Italy for electricity production from biogas. The Legislative Decree 79/1999 introduced market incentives based on compulsory quotas of renewable energy production and consumption, which were expected to boost the development of renewable energy sources in Italy [21]. However, this decree did not foster the diffusion of AD plants; hence, different incentivization regimes were introduced in 2008 and are summarized in Table 1. The Ministerial Decree 18th December 2008 [22] introduced a feed-in tariff for electricity produced by RES plants up to 1 MWel (200 kWel for wind power). Since the AD plant analyzed in this study was installed before the end of 2012, it benefits from a tariff of 280 €/MWhel until the end of 2027. Two other decrees were issued since then, one in 2012 [23] and one in 2016 [24], which reduced the amount granted but extended it from 15 to 20 years. It is critical to achieve a sufficient profitability of AD plants due to the new incentive schemes, and as a result, the growth of biogas plants slowed since 2013 [14]. The incentivization scheme of biogas production radically changed in 2018 with the issuing of the Ministerial Decree 2nd March 2018 (DM 2018) [25], along with the law 145/2018 [26]. An incentive is granted for the biomethane delivered to the network, which adds to the price granted by the gas market manager. Incentives and conditions are further described in Section 3.3.3.

Table 1.
Feed-in tariffs (€/MWhel) for electricity from AD plants by the ministerial decrees (DM) of 2008, 2012, and 2016 [22,23,24].
3. Methods
This section presents the methodology adopted to identify the best retrofitting option from the economic and environmental points of view. Section 3.1 presents the three retrofit options (1 and 2a, b) that were hypothesized considering the current configuration and the constraints imposed by the new incentivization regime, such as the replacement of maize in the feedstock. Section 3.2 presents the assessment of the energetic production and needs of the plant. The biogas production with the new feedstock mix was estimated and consequently, the biomethane and electricity production for the three options were estimated (Section 3.2.1). The heating and electricity needs of the plant (Section 3.2.2 and Section 3.2.3, respectively) were assessed to verify the ability of the CHP unit to cover them (options 1 and 2a) and the quantities to be drawn from the grid (option 2b). The results of the energetic assessment were then used as inputs for the economic (Section 3.3) and GHG budget assessment (Section 3.4). The capital (Section 3.3.1) and operational costs (Secion 3.3.2), along with revenues (Section 3.3.3), are the inputs for the income statement (Section 3.3.4) and for the indicators of economic viability (payback time and internal rate of return). The economic viability, however, depends on several parameters that may vary through time. Therefore, an uncertainty analysis was conducted (Section 3.3.5). Further details on the economic assessment and on the uncertainty analysis are available in the Supplementary Materials. The GHG budget (Section 3.4) was assessed considering the emissions due to the production and transport of feedstock, the methane leakage from the digester and the upgrading unit, and the energy drawn from the grid. Avoided emissions were calculated considering the replaced fossil fuel energy.
3.1. Retrofit Options and Plant Modifications
As previously explained, the incentive regime with feed-in tariffs ends after the 15th year of operation (i.e., at the end of 2027). For this reason, three configurations were considered for the period 2022–2041, with different breakdowns for biogas production:
- For the whole period (2022–2041), 75% of biogas production is transformed into biomethane and 25% is sent to a 250 kWel biogas-powered CHP system. The current CHP system (999 kWel) is dismantled.
- From 2022 to 2027, 70% of the biogas production is used for electricity production with the existing CHP unit, while 30% of the production is transformed into biomethane. From 2028 onwards, two options are hypothesized:
- Same as option 1.
- 100% of the biogas production is transformed into biomethane, covering the energy demand of the plant with gas and electricity from the grid.
The three options are hereby referred as 1, 2a, and 2b, respectively. All of them require the implementation of a biogas upgrading system to increase the purity and the methane share of biogas to a level suitable for the gas pipeline network. The membrane technology was chosen due to its low footprint and methane losses [27] and because it is the most economically competitive option for this plant size [28].
As previously explained, the plant currently uses 30 t/day of corn as feedstock. The use of this cereal as an energy crop is sharply criticized due to its competition with food production [29] and the recent biomethane decree excluded it from the so-called advanced biomethane production and the related benefits [25]. This decree also identified a few alternative feedstocks (second or cover crops) allowed for advanced biomethane production. Among them, triticale was chosen because of its successful use (10 t/d) in this plant and because of its low cost, adaptability to marginal lands, and complementarity to maize cultivation as a second crop [30,31]. A replacement ratio (triticale: maize) of 1.5:1 was adopted to achieve a similar biogas productivity [32,33].
3.2. Energetic Production and Needs
3.2.1. Biogas, Biomethane and Electricity Production
The daily production of biogas was estimated based on the values of the volatile solid (VS) fraction derived from operational monitoring data. The values of biogas productivity were derived from [33] considering a loss fraction from the digester of 0.3%. The resulting biogas production foreseen with the new feedstock mix, as shown in Table 2, is of 10,704.7 Nm3/d, that is, slightly higher than the current production (10,523 Nm3/d).
Table 2.
Calculation of the biogas production of the AD plant with the new feedstock supply.
Based on the monitored average composition of biogas produced by the plant, a share of 55% vol. CH4 was assumed to estimate biomethane production. The methane loss in the upgrading phase was set to 1.4% as a safe assumption based on the highest literature values for the membrane technology [27,34]. The maximum biomethane production achievable is therefore equal to 5805.1 Nm3/d if all the biogas produced is converted (option 2b). This quantity is proportionally reduced if a share of biogas is kept for direct use in the CHP unit (25% for options 1 and 2b, and 70% for option 2a).
The electricity and heat production of the CHP unit is calculated assuming the energy yield values of the currently installed unit (40.6% and 50.7% respectively, see Section 2.2).
3.2.2. Heating Needs of the AD plant
The heat demand of the AD plant was measured since it is largely exceeded by the installed power of the CHP system (999 kWel, 1248 kWth). However, it is necessary to estimate it in case the plant is fully or partially reconverted to biomethane production; thus, reducing (options 1 and 2a) or annulling (2b) the quantity of heat generated on site.
The heating demand of the plant is composed of (i) the preheating of biomass (Qph) to the operating temperature of the AD (i.e., 41 °C), (ii) the heat losses from the digester (Qdig), and (iii) the ammonia stripping unit (Qstrip).
Heat losses Qdig (MWhth/y) were estimated with the following relation:
where Tdig = 41 °C and Tair = 12 °C are the temperature of the digester and of the outdoor air (yearly average value), respectively; r = 14 m is the radius of the digester, h1 = 6 m is the height of the cylindrical part of the digester and h2 = 7 m is the height of the dome-shaped gasometer section; Ufloor, Uwalls and Udome are the transmittance values of the floor, the lateral walls and the dome, respectively (equal to 0.465, 0.32, and 1 Wm−2K−1, respectively). The resulting heat loss is Qh = 481.6 MWhth/y for the three digesters. This value is calculated with the cautious assumption of neglecting the contribution of solar heat gains.
The energy needed for preheating the biomass is identified by the following relation:
where Tdig = 41 °C and Tfs = 12 °C are the temperature of the digester and of the feedstock, respectively; cfs is the specific heat of feedstock (assumed equal to 3245 J·kg−1K−1), and Mfs is the feedstock intake (i.e., 171 t/d). The resulting heating need for preheating the biomass is therefore Qph = 1803.1 MWhth/y.
The ammonia stripping plant absorbs a thermal power of 270 kWth operating at 60 m3/h. Considering the pig slurry load (36,500 m3/y), the yearly thermal demand for ammonia stripping is Qstrip = 164.25 MWhth/y.
The overall heating demand of the AD plant is therefore equal to 2449 MWhth/y and does not change depending on the biogas use foreseen. However, the breakdown of biogas use influences the amount of heat produced. As shown in Table 3, the heat demand is fully covered by the CHP unit (options 1 and 2a). For option 2b (when the CHP unit is removed and all biogas is transformed into biomethane), only the waste heat from the upgrading unit is available, which was estimated as 0.13 kWhth per Nm3 of biomethane treated [33].
Table 3.
Heat demand and production/recovery of the AD plant for the different options hypothesized.
3.2.3. Electricity Needs of the AD Plant
The current electricity demand of the plant is 850 MWhel/y. The conversion of biogas to biomethane results in an additional electricity need for the upgrading and compression stages, which were estimated at 0.3 kWhel/Nm3 and 0.4 kWhel/Nm3 of biomethane, respectively [33].
The resulting electrical demand values for each option hypothesized are shown in Table 4. The electricity production was estimated based on the electrical efficiency of the current CHP unit (40.6%), which is kept for option 2 (years 2022–2027) and is replaced by a smaller 250 kWel unit for option 1 and 2a. As shown in Table 4, the electricity needs are fully covered with the new CHP unit, with slight excess production (119.6 MWhel/y) delivered to the grid.
Table 4.
Electricity demand and production of the AD plant for the different options hypothesized.
3.3. Economic Assessment
3.3.1. Capital Costs
The retrofit of the plant includes the expansion of the sileage storage trench, the upgrading plant, the compression and measuring stations, the dismantling of the existing CHP unit and, for options 1 and 2a, the installation of a new unit with less power (250 kWel instead of 999 kWel). The expansion of the sileage storage section (5500 m3) is needed due to the increase of 15 t/d (i.e., 5475 t/y) of daily input when switching from the current supply (30 t/d corn + 10 t/d triticale) to the new supply (55 t/d triticale). Two versions of the upgrading station were hypothesized, a larger one (300 m3/h of biogas) in the hypothesis of a full conversion to biomethane (option 2b) and a smaller one (250 m3/h) for the two hypotheses with partial conversion (options 1 and 2a). The unit cost of 4800 €/(m3/h) was set based on reference values by TUW [28] for membrane upgrading systems of this capacity. For all configurations, the installation costs of the compression station (200,000 €), of the measuring station (250,000 €), the decommissioning of the current CHP unit (100,000 €) and the expert consultancy for design and authorization procedures (50,000 €) were taken as lump sums based on a market survey. A unit cost of 3000 €/kWel was set for the CHP unit in option 1 and 2a, based on an Italian market survey discounted due to inflation [35].
The overall investments required are 2281 k€ for option 2b and of 2816 k€ for options 1 and 2a. The only difference between options 1 and 2a is that the replacement of the CHP unit is performed in 2021 in the first case and in 2027 in the second case.
3.3.2. Operational Costs
The operational costs of the three options hypothesized are related to four categories, namely: (i) feedstocks and digestate treatment, (ii) fixed costs (staff, fees, insurance), (iii) maintenance of the CHP unit and of the biogas upgrading and compression systems, and (iv) energy costs.
Costs are incurred for the supply of two feedstocks, i.e., cow manure and triticale, whereas pig slurry is transported to the plant at the expense of farmers. Based on the experience of previous years, a cost of 2.5 €/t was incurred for the transport of cow manure. The cost of triticale was assumed equal to 35 €/t based on a local price list [36]. The cost of chemical-physical treatment of feedstock was estimated, based on the operation of previous years, at 1 €/t. All these costs related to feedstocks are the same for the three solutions hypothesized. By contrast, the operation and maintenance costs of the CHP unit depend on its production. Based on the currently installed unit, it was estimated at 18 €/MWhel and this value was kept for both the hypotheses of replacing the unit (options 1 and 2a) and of keeping the existing one (option 2b until 2027).
Fixed costs for staff, fees and insurance were estimated at 48 k€/y, 20 k€/y, and 40 k€/y, respectively.
The yearly maintenance cost of the gas upgrading and compression systems was estimated as 2% of capital expense [37,38].
Finally, energy costs were considered for option 2b using the average unit costs for non-household users in Italy calculated by Eurostat [39,40], i.e., 175.25 €/MWhel for electricity and 50.76 €/MWhth for gas.
3.3.3. Revenues
Depending on the operating scheme foreseen, the AD plant relies on revenues from the sale and incentives of electricity, biomethane, or both.
The current incentives to produce electricity from biogas (280 €/MWhel) last until the end of 2027. However, to benefit from the new incentivization regime (DM 2018, see Section 2.3), the plant must be converted to a partial production of biomethane (at least 30% of the biogas production) before the end of 2022. If such conversion is performed, the plant can benefit from feed-in tariffs on electricity until the deadline (15 years after the plant startup, i.e., in this case, until the end of 2027) on the remaining share of biogas production (i.e., up to 70%). This is the case considered for options 2a,b. The feed-in tariff is all inclusive, whereas biomethane possesses two revenue sources, the sale price and the incentive. The sale price was set to 15.36 €/MWhth based on the mean values for the Italian market in the year 2019 [41]. The incentive on biomethane is based, similarly to the other biofuels, on the trade of CIC (certificate of release for consumption, in Italian). A CIC for advanced biomethane equals to 5 Gcal, that is, 5.814 MWhth or 583 Nm3. These certificates must be purchased by oil companies with quotas based on their gasoline and diesel production. The price of the CIC therefore varies depending on the market and currently ranges between 150 € and 400 € [42]. Nevertheless, the current incentive regime grants a fixed value of 375 € per CIC of advanced biomethane for 10 years [25]. After this period, i.e., from 2031 onwards, a market price of 300 €/CIC was assumed.
3.3.4. Income Statement
The yearly income statements of the three options (1, 2a, and 2b) from 2021 to 2041 were evaluated to assess the return on investment. The earning before interests, taxes, depreciation, and amortization (EBITDA) is the difference between the revenues (R) and the operational expenses (OPEX):
EBITDA provides a quick indication of the profitability of a business because a negative value identifies an economically unsustainable operation; however, a positive value does not imply that the business is profitable.
The return on the investment was evaluated based on yearly values of discounted cash flows (DCFi):
where WACC is the weighted average cost of capital, imposed equal to 3.3%, and CFi is the cash flow of the i-th year, with 2021 being the 0-th year (I = 0).
The values of cash flow (CFi) were calculated as free cash flows to the firm:
where Ti is corporate taxes (which, in Italy, are calculated as a share of EBITDA and of staff costs), and CAPEXi is the investment at the i-th year.
3.3.5. Uncertainty Analysis
The business plan of the three options evaluated is subject to uncertainty related to all the parameters described (biogas production, energy demand of the plant, sale price of biomethane etc.). The method proposed by Sartori et al. (2015, [43]) was adopted to identify critical parameters. Each parameter was increased by 1% and, if the consequent variation in the net present value in 2041 exceeds 1%, the parameter is deemed as critical. Four parameters are critical, namely (i) the price of the triticale sileage, (ii) the sale price of the CIC after 2031 (i.e., after the end of incentives), (iii) the biogas production, and (iv) the price of electricity (for option 2b only).
A Monte Carlo simulation was performed on these parameters, combining random values of the critical parameter taken from the ranges shown in Table 5. As suggested in [12], 1000 analyses were performed for each option. Probabilistic distributions of economic indicators were derived and are shown in Section 4.1.2.
Table 5.
Ranges of variation adopted for the uncertainty analysis on the price of triticale sileage, on the sale price of biomethane certificates (CIC) after the end of the fixed tariff (2031), on the biogas production, and on the purchase price of electricity.
3.4. GHG Budget Assessment
The production of biogas and its use for electricity or biomethane production has a complex GHG budget that depends on several factors. The carbon footprint assessment was performed based on (i) energy crop cultivation, (ii) feedstock transport, (iii) methane leakages, and (iv) energy produced and/or taken from the grid. The assumed input values are summarized in Table 6 and hereby explained.
Table 6.
Input data for the GHG emission assessment.
The cultivation of triticale possesses three main sources of GHG: fuel consumption for agricultural machinery, the production of fertilizers, and the emissions of nitrous oxide. Based on the yearly input (20,075 t/y) of feedstock and on other input data shown in Table 6, an overall emission of 871.6 tCO2eq/y was estimated.
Feedstock transport was evaluated considering the maximum distance (8 km) from the plant and the different transport capacities for pig slurry (20 t), cattle manure (16 t), and triticale (27.5 t). A unique value of fuel consumption was set (0.35 L/km) and an overall impact of 37.3 tCO2eq/y was estimated.
The operation of the anaerobic digester impacts climate due to (i) methane losses (0.3%) from the digester, (ii) from the sileage storage (6.264 kgCO2eq/MWhth, see Ref. [33]) and (iii) from biogas upgrading (1.4%). Methane losses were transformed into CO2 equivalent using the global warming power value (GWP = 28, i.e., 1 kg CH4 = 28 kg CO2eq) [44].
The GHG emissions related to the energy exchanged with the grid were evaluated considering the emission factors for gas (206 kgCO2eq/MWhth, see Ref. [44]) and electricity (337.1 kgCO2eq/MWhth for the Italian grid, see Ref. [45]). Energy delivered to the grid (biomethane and electricity) was considered as a negative contribution to the GHG budget, whereas energy taken from the grid was considered as a positive contribution. By contrast, energy production with CHP was considered climate neutral since the CO2 emitted by the combustion was previously fixated by the feedstock and the GHG emissions related to biogas production are already accounted.
4. Results and Discussion
4.1. Economic Assessment
4.1.1. Income Statement
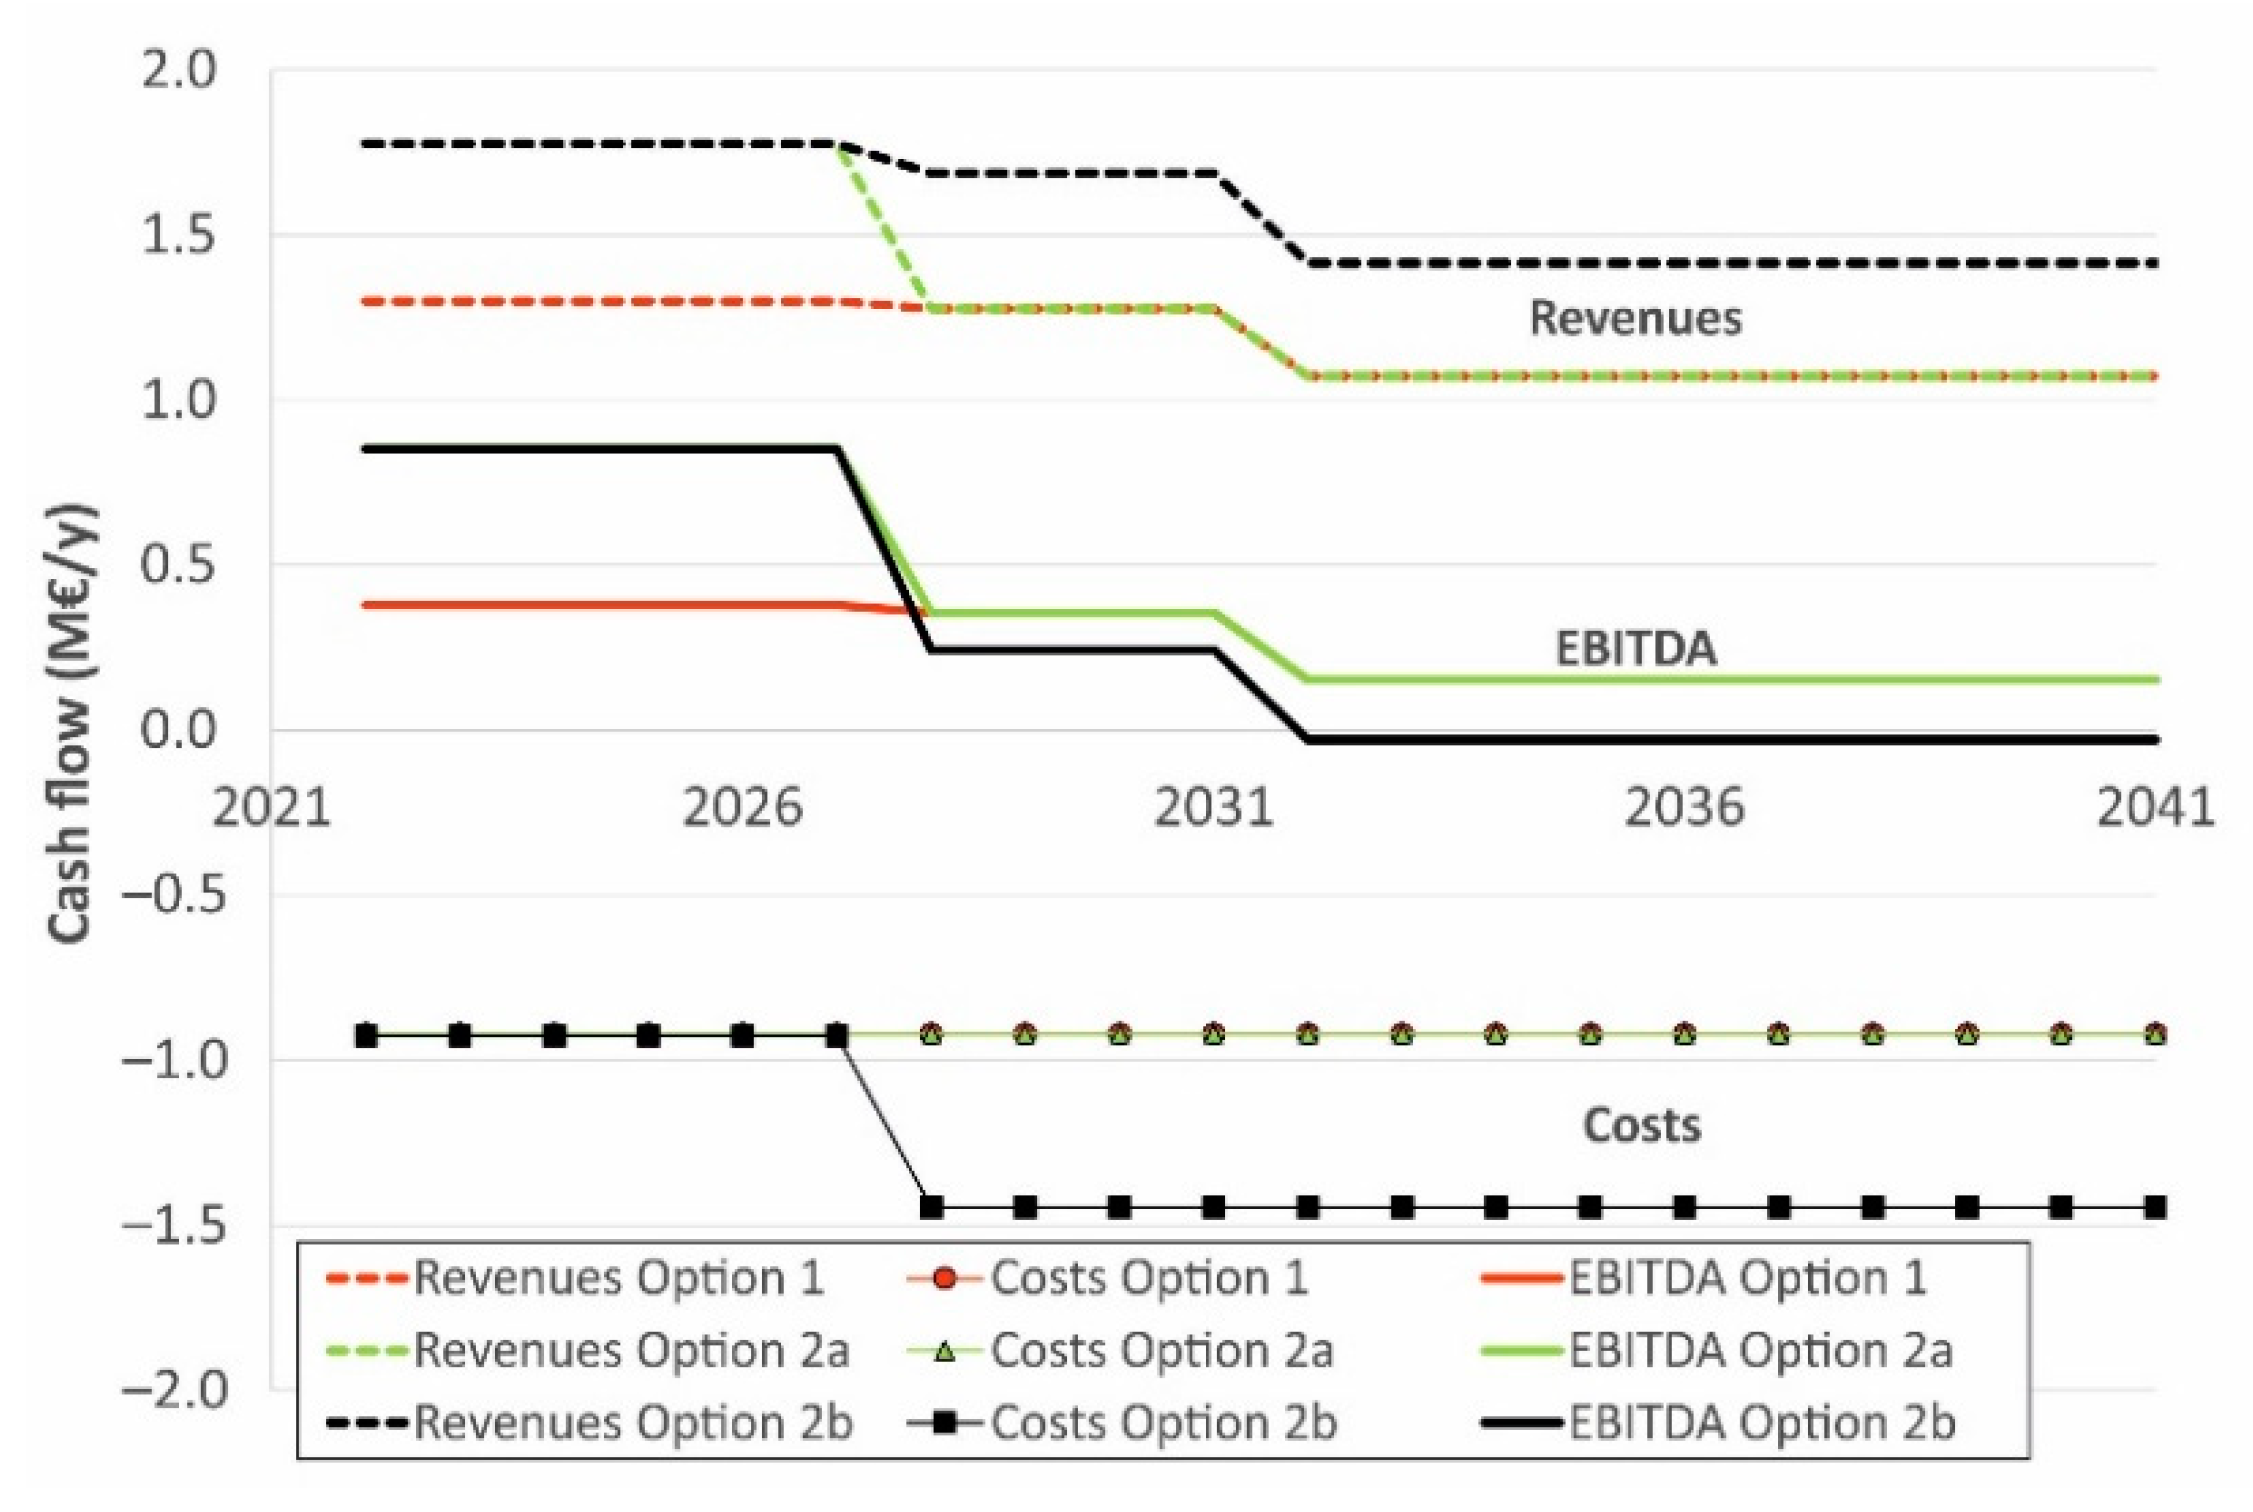
The return on investment of the three options foreseen was analyzed considering different indicators and their time evolution. Figure 2 shows the time trends of revenues, costs, and EBITDA in 20 years, from 2022 to 2041. The main difference is observed between options 1 and 2a,b: in the first 6 years of operation (2022–2027) the retrofit options 2a,b show higher revenues and higher EBITDA values thanks to the feed-in incentive tariffs on the electricity produced exploiting 70% of the biogas production, i.e., the maximum share allowed by DM 2018 [25]. From 2028 onwards, option 2a follows the same trend as option 1 for revenues and costs, as it shows the same use of biogas (75% for biomethane and 25% for CHP). On the other hand, option 2b keeps a high value of revenues but operational costs noticeably increase due to the electricity and gas purchased from the grid, resulting in a lower EBITDA after 2027. The gap between options 1 and 2a and the less favorable option 2b widens from 2032 onwards, as the purchase price for biomethane certificates set by DM 2018 (375 €/CIC) ends, and a lower one is expected (300 €/CIC). The result is a negative EBITDA for option 2b from 2032 to 2041.

Figure 2.
Yearly revenues (upper dashed lines), costs (lower thin lines with markers), and EBITDA (continuous lines in between) for the years 2022–2041 for options 1 (red), 2a (green), and 2b (black).
Revenues and costs are an incomplete indicator of the profitability of the three options evaluated since taxes and interests on loans change the equilibria. Cumulated discount net cash flows were therefore evaluated since they provide a more comprehensive view of how the investment is returned. As shown in Figure 3, options 2a,b display a much better economic performance in the first years of operation. This is reflected in the discounted payback times of 10.33, 3.07, and 3.66 years, respectively, for options 1 and 2a,b. The internal rate of return on 20 years of operation is of 5.96% for option 1, 26.14% for option 2a, and 21.77% for option 2b.
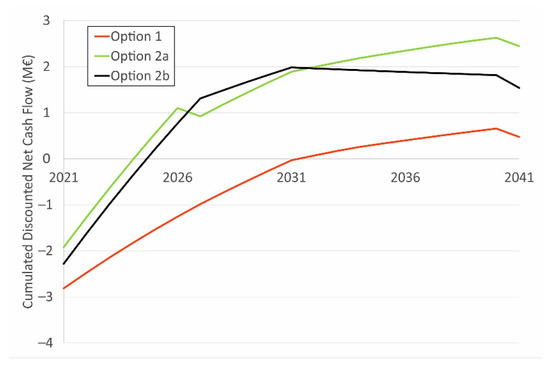
Figure 3.
Cumulated discounted net cash flows for the years 2021–2041 for options 1 (red), 2a (green), and 2b (black).
The time trend of discounted cash flows (Figure 3) highlights that the economic sustainability of biomethane production is quite critical after the end of incentives (i.e., from 2032 onwards) and, for option 2b, the cumulated discounted cash flow of this period is even negative. In this period the biomethane production plant relies on two incomes, the sale of CIC and of methane, with a share of about 77% and 23% of revenues, respectively. The sale prices of both CIC and methane are hardly predictable, and several factors may contribute to their reduction. As for CIC sales, the decline of transportation fuel production [46] is expected to be counteracted by the gradual increase in the quota of CIC required (2.25% of fuel production from 2023). For methane, the national gas demand is expected to remain substantially stable, but the supply increases with the commissioning of new pipeline and gasifiers [47]. As previously reported, the economic analysis was based on a CIC price of 300 € and a methane price of 15.36 €/MWhth, that is, 66.93 €/MWhth overall. Neglecting the variability in the gas sale price, the break-even value of revenues from the sale of CIC is of 262.20 €/CIC for option 1, 260.47 €/CIC for option 2a, and of 321.57 €/CIC for option 2b. Below these CIC price values, the sum of the discounted net cash flows in years 2032–2041 becomes negative.
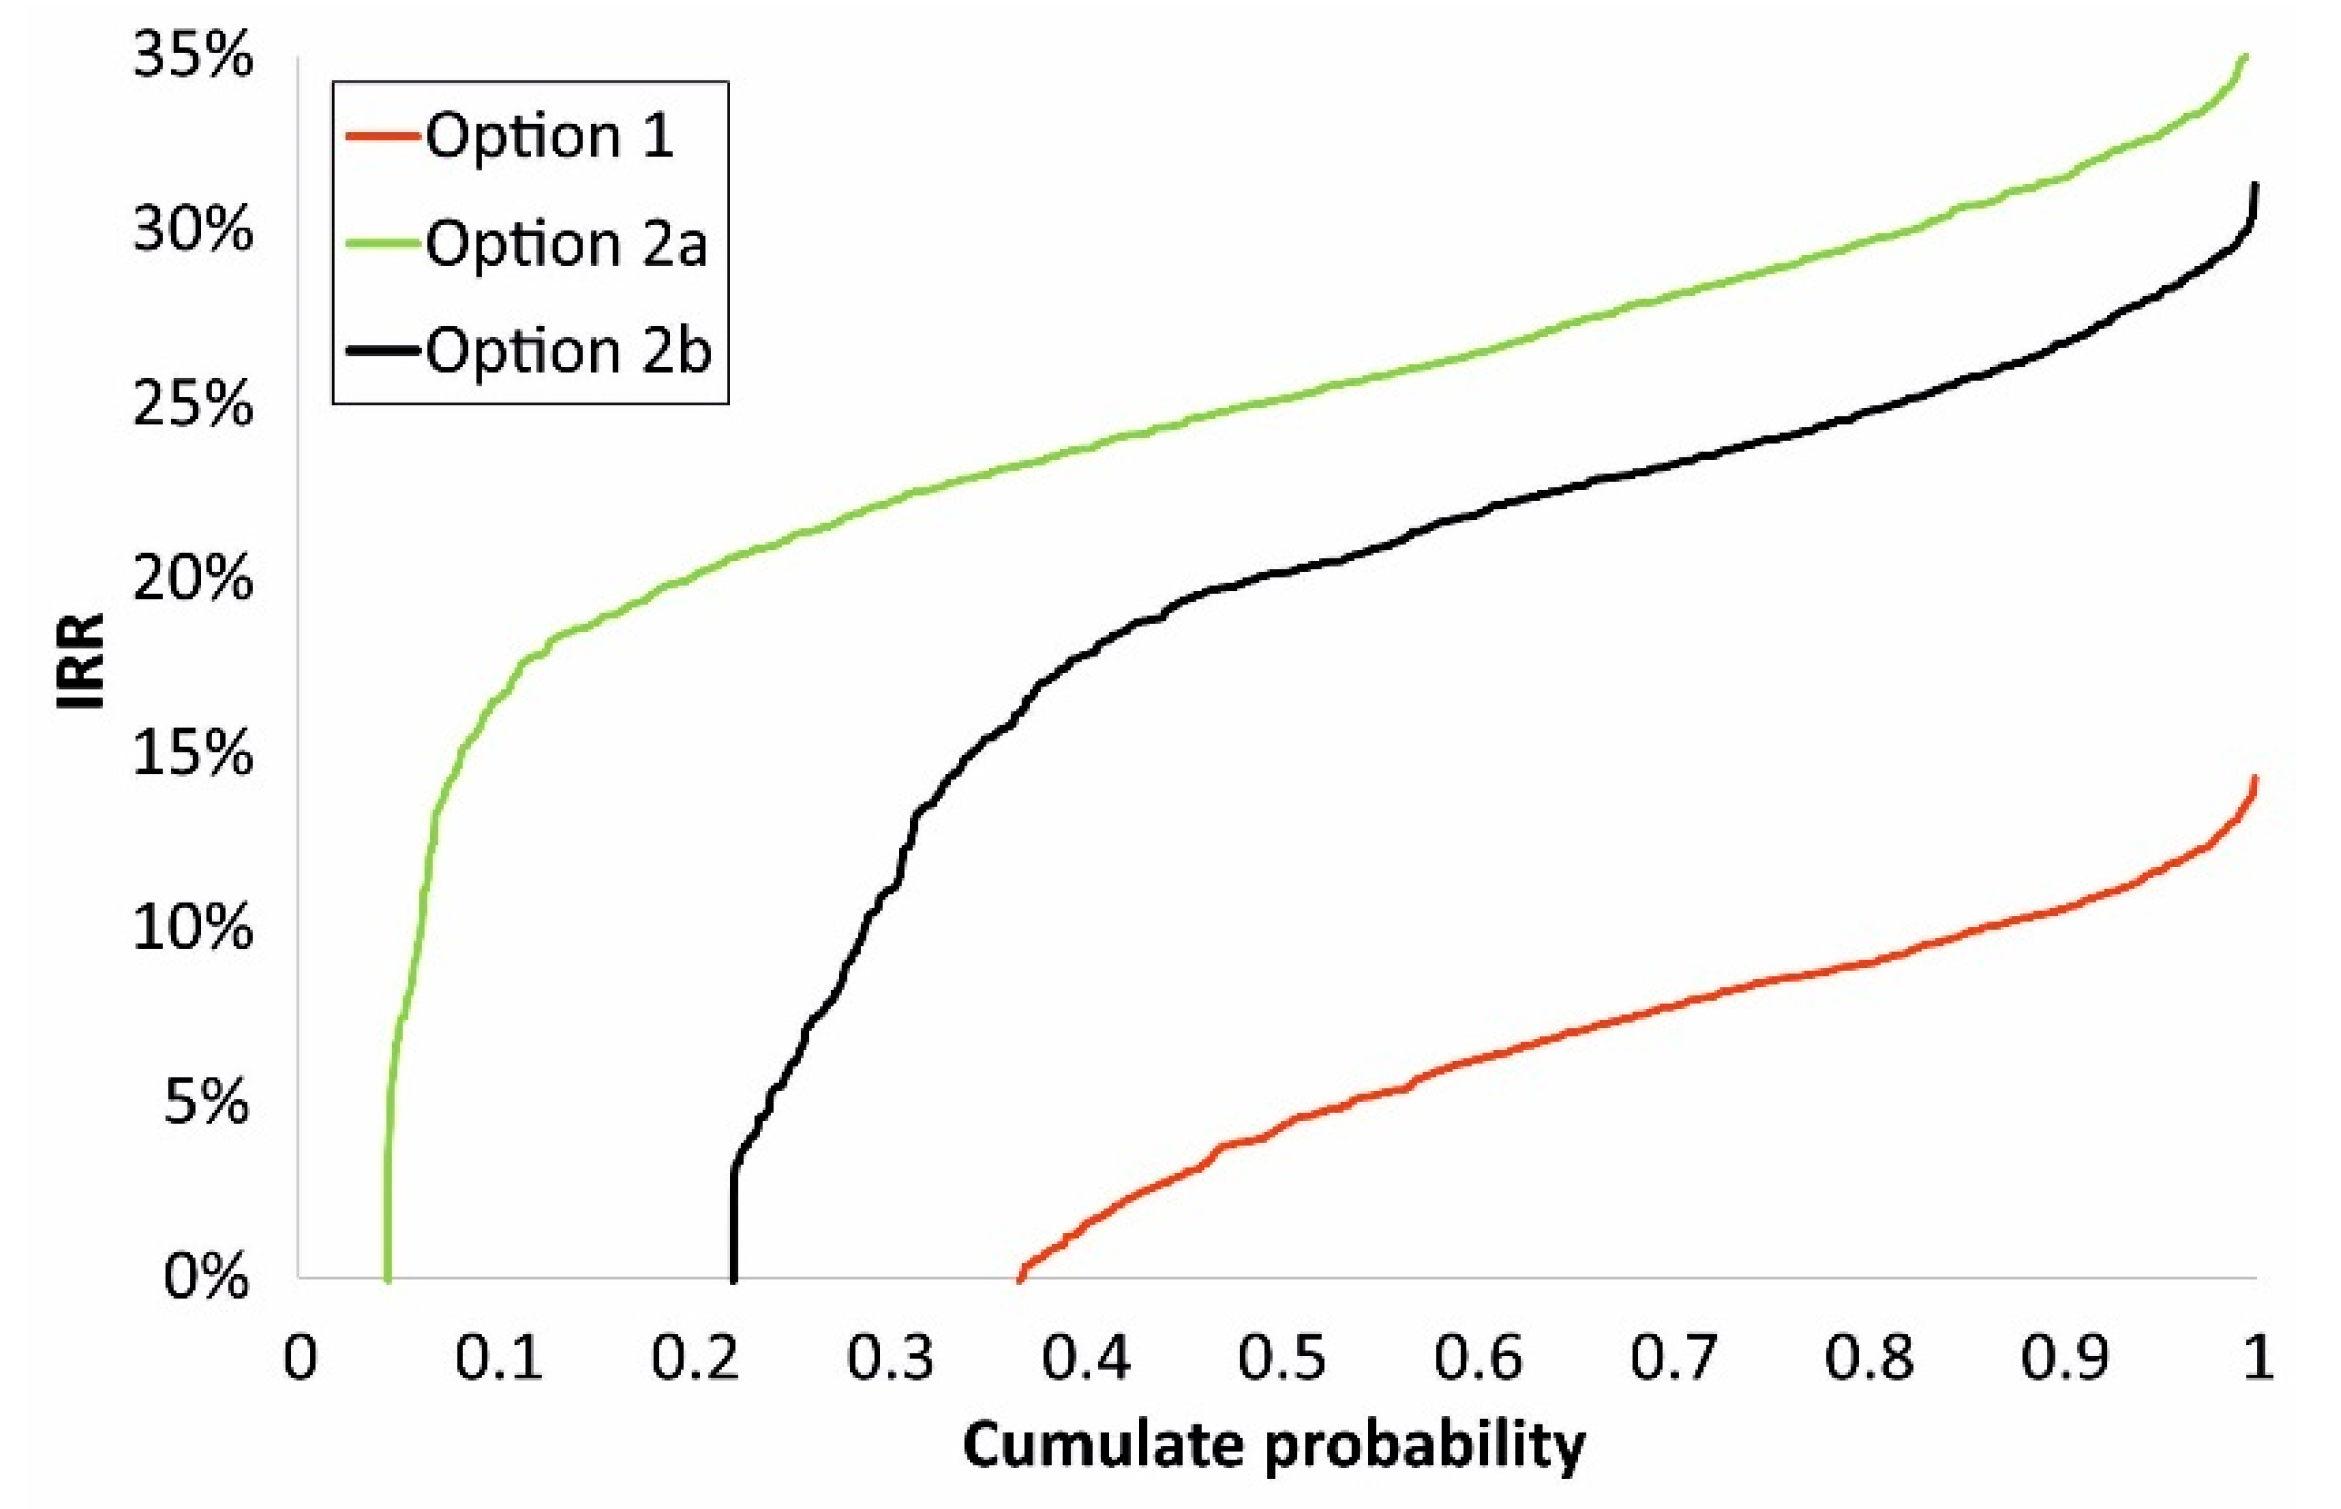
4.1.2. Uncertainty Analysis
The sensitivity analysis performed on the three options led to the identification of 4 critical parameters (the price of the triticale sileage, the sale price of the CIC after 2031, the biogas production and, for option 2b, the price of electricity). Figure 4 shows the cumulate distribution of the internal rates of return (IRR) for the 1000 simulations performed for each option. Above the 50th percentile, the IRR curves for options 2a,b are quite close, whereas the economic performance of option 2a is below this percentile. The economic return of option 2a is less sensitive to parameter variability because it is not subject to variation in electricity price. By contrast, option 1 is hardly economically viable for most simulated cases, with a large probability (37%) of a negative IRR.
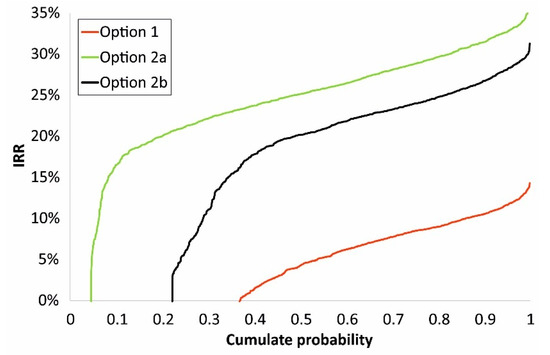
Figure 4.
Cumulated discounted net cash flows for the years 2021–2041 for options 1 (red), 2a (green), and 2b (black).
4.1.3. Further Considerations
The case study analyzed is representative of several plants in Italy, both for its size and the type of feedstock used: the size (999 kWel) is the maximum allowed for all-inclusive feed-in tariffs and almost all manure-fed biogas plants use energy crops for co-digestion. However, the plant analyzed in this study suffers from the major issue of needing a compression station to produce liquified natural gas, due to limitations in the local gas pipeline network that do not allow for a direct delivery of the gas produced. In this case, the limitation is not present, the compression station (200 k€) must not be installed. In addition, a smaller CHP unit can be installed to cover the self-consumption of the plant (options 1 and 2a), or a lower electrical demand must be covered by the grid (option 2b). In particular, the power of the CHP unit can be reduced to 200 kW and the share of biogas transformed into biomethane is increased to 80%. This results in an increase in the internal rate of return of the investment, from 5.96% to 13.12% for option 1 and from 26.14% to 34.58% for option 2a. For option 2b, the demand of electricity from the grid is reduced of 36% and, as a result, the IRR is increased from 21.77% to 30.02%. The possibility of directly delivering biomethane to the pipeline grid is therefore of pivotal importance for biomethane production plant that do not benefit from the feed-in tariffs on electricity granted by the old incentive regime, such as for option 1 in this case study.
The savings on manure spreading that are achieved with the AD plant can be further considered. Indeed, the ammonia stripping plant noticeably reduces the nitrogen content of digestate compared to raw manure. This results in a reduced expense for farmers for the purchase of manure spreading rights to dispose the nitrogen load that exceeds the quota allowed on their owned, cultivated areas. Based on recent estimates, the cost of these spreading rights in the areas with the highest demand is 1 €/kgN excluding transport [48,49].
4.2. GHG Budget Assessment
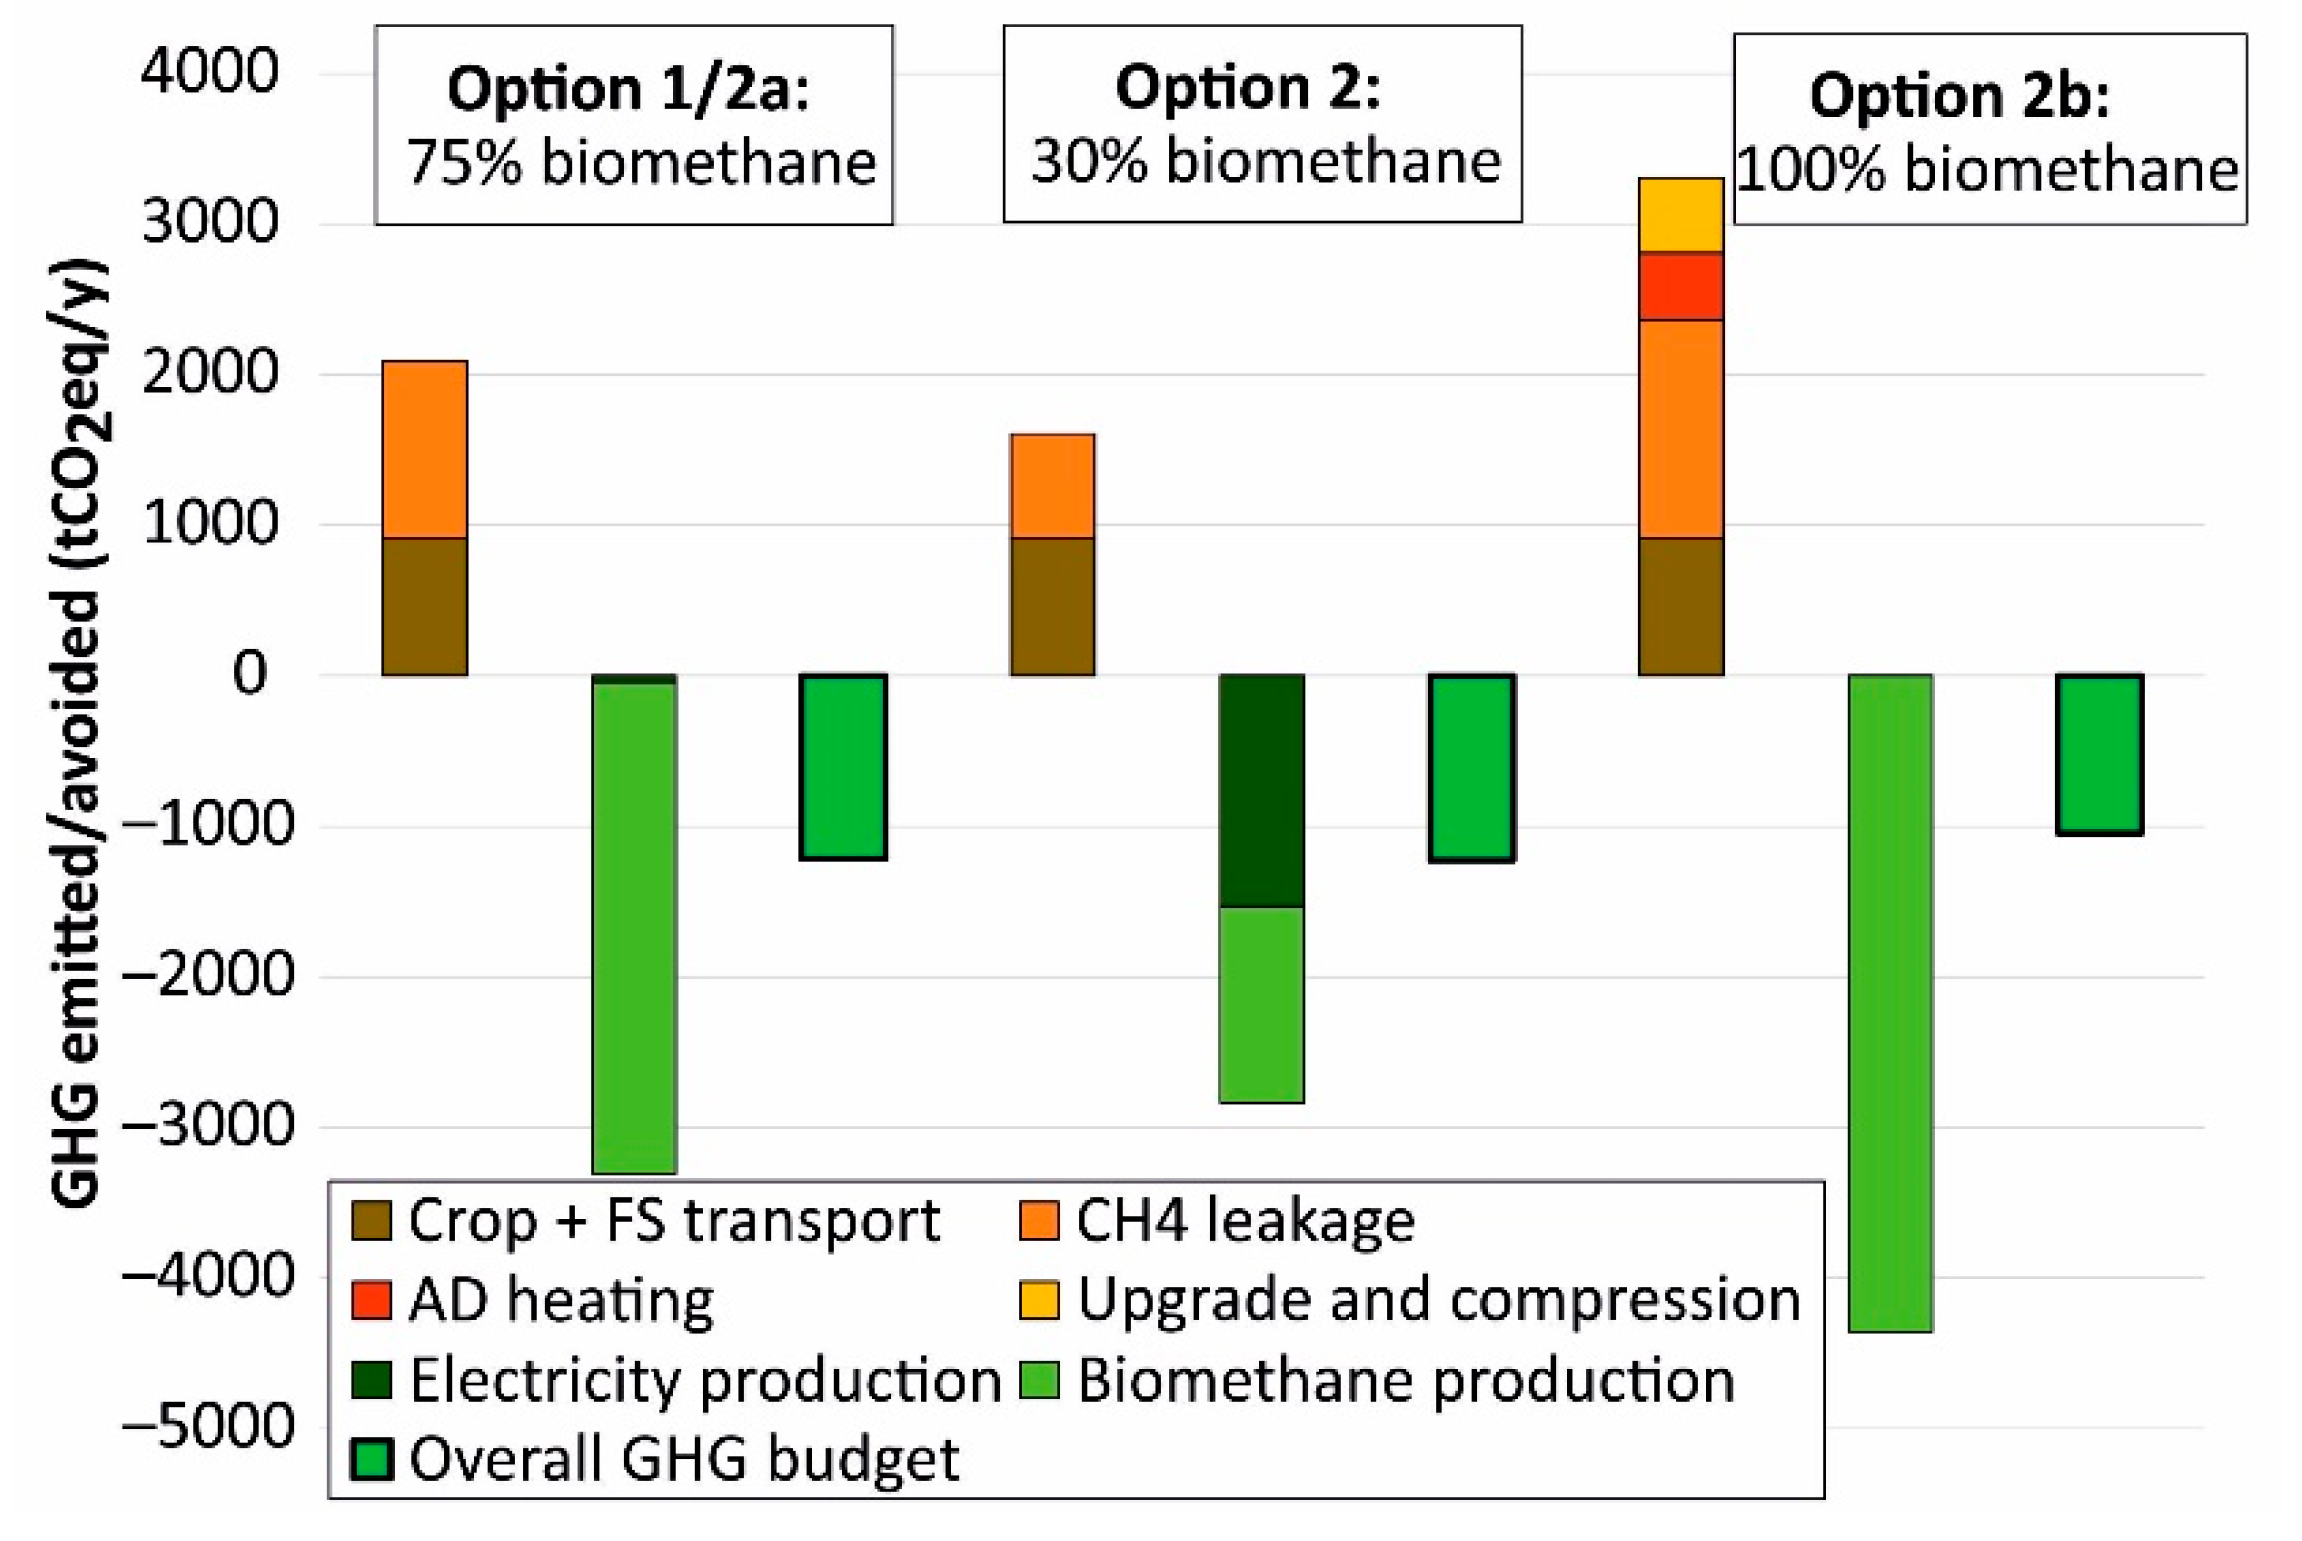
4.2.1. GHG Avoided Emissions at the Plant Scale
The greenhouse gas budget is shown in Figure 5 for the three options hypothesized. All of them lead to negative emissions, −1215 tCO2eq/y for options 1 and 2a, −1228 tCO2eq/y for option 2a,b until 2027, and −1046 tCO2eq/y for option 2b. Considering the plant lifetime (2022–2041), option 1 leads to a GHG budget of −24,292 tCO2eq, option 2a to −24,372 tCO2eq, and option 2b to −22,016 tCO2eq.
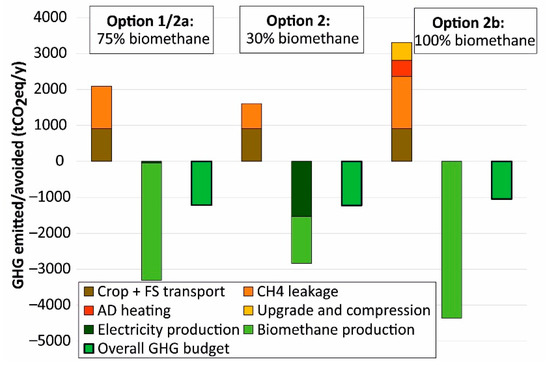
Figure 5.
Greenhouse gas budgets for option 1 and 2a (on the left), for option 2 until 2027 (in the center) and option 2b (on the right).
As shown in Figure 5, methane fugitive emissions due to the operation of the AD plant, feedstock stockage, and upgrading losses are the largest contributor to GHG emissions. Methane losses in the upgrading system were considered, with a cautious assumption, using the high value (1.4%) observed for membrane-based systems. The coverage of the energy demand with gas and electricity from the grid reveals that option 2b is the least performing one for GHG emissions. However, the GHG emissions due to the electrical demand are expected to decline in the future, following the trend of the GHG emission factor [45]. As for heat production, GHG emissions can be reduced by 54–76% using a heat pump [50]. The favorable trend of the carbon intensity of electricity and the use of low-carbon heat can therefore reduce the gap of the GHG reduction of option 2b compared to the other options.
4.2.2. Potential GHG Avoided Emissions at the Regional Scale
The GHG assessment at a plant scale can be projected at a regional scale, considering statistics on biogas plants in Piedmont. As of 2017, 190 biogas plants were installed in this region with a total electric power of 126.1 MWel [51] and none produced biomethane. Most of these plants (126) started operating between 2008 and 2012 so they benefit from the same incentive regime of the plant studied in this study (i.e., DM 2008, see Table 1). A total of 103 plants (total power: 70.2 MWel) exploit manure and crops (generally maize and/or triticale silage) and the most diffused size is around 999 kWel (44 installations), confirming the typical national trend of the period for large plants below the 1 MWel threshold [52]. The other 23 plants range between 500 kWel and 844 kWel (overall production: 15 MWel) and only one plant exceeds the MW size (2.3 MWel).
The case study examined in this paper is therefore representative of 68 plants (total power: 61.4 MWel) between 500 kWel and 2300 kWel that need similar retrofit measures to keep operating after the end of feed-in electrical tariffs foreseen 15 years after their startup (i.e., between 2023 and 2027). Detailed data for the scale of the single plant are needed for a precise GHG budget. However, if we extend the results shown in Figure 5 to the 68-plant pool, an overall benefit of between 67,588 tCO2eq/y and 74,821 tCO2eq/y can be achieved as an average in the period 2022–2041, depending on the retrofit option adopted among those described in this study. This estimate can be even higher if we consider that a part of these plants is connected to the gas grid and, hence, biomethane can be released directly, avoiding compression and transport.
4.2.3. Further Considerations
The GHG budget was calculated based on simplifying assumptions that are hereby further discussed.
The digestate produced by the plant is a fertilizer that partially replaces synthetic fertilizers. Strictly speaking, the avoided emissions can be accounted in the GHG budget only if digestate is used for growing feedstock [53]. In the case study examined, the digestate (about 142 t/d) is distributed to farmers proportionally to their slurry supply, so we opted for not taking the avoided emissions into account. Using data on the N, P, and K content provided by Buratti et al. (2013, [54]) and GHG emission factors by IPCC [44] (see Table 6), the resulting avoided emissions are of 16.23 kgCO2eq/t for the solid fraction of the digestate and of 10.50 tCO2eq/t for the liquid fraction. These are only potential GHG savings since additional fertilizer input is needed to integrate nutrients missing or lacking in the digestate.
The use of digestate can also result in the reduction of N2O emissions compared to raw slurry application; however, this slight reduction is soil- and crop-specific and must be evaluated with in situ measurements [55,56]. For this reason, our GHG budget did not consider this possible environmental benefit.
The methane losses from the digester and the biogas upgrading equipment account for 698–1451 tCO2eq/y depending on the option (1, 2a or 2b), i.e., the same order of magnitude of the overall GHG benefit. The estimated loss (0.3% in the digester and 1.4% in the upgrading plant) is in line with recent measures conducted in similar plants [57]. The sensitivity of the GHG budget to methane loss rate is confirmed by several studies in literature, among which is [58], and strongly influences the choice of the best retrofit option. For example, using a methane loss value of 0.6% (see [27]), option 2a can continue to be the least carbon-intensive, but the gap on option 2b is strongly reduced (−1676 tCO2eq/y and −1661 tCO2eq/y, respectively).
As observed for the economic budget, the electricity needed to compress and liquify biomethane represents a relevant item in the GHG budget as well. If no compression system is necessary, the environmental benefit of the plant increases to −1429 tCO2eq/y for option 2a and to 1332 tCO2eq/y for option 2b.
5. Conclusions
The anaerobic digestion of manures for producing electricity from biogas has largely spread in the last 15 years in several European countries, among which is Italy. Recently, the new incentive regimes switched the target from electricity to biomethane with the aim to increase the share of renewable energy in transport. For AD plants operating with manures, this change potentially hampers their economic sustainability, which is more critical than plants operating with feedstocks with a higher biogas yield, such as organic or food industry waste. In addition, the anaerobic digestion of manures provides several environmental benefits, both related to the production of renewable energy and the reduction of impacts from ammonia and nitrogen.
This study addressed these issues by studying the options available for the reconversion of an AD plant from electricity to biomethane production. The plant analyzed currently produces 999 kWel and operates with a mix of pig slurry (100 t/d), cattle manure (16 t/d), triticale (10 t/d) and maize (30 t/d). Three retrofit options were hypothesized, namely (1) transforming 75% of biogas into biomethane, and using the remaining 25% for a CHP unit sized for the plant self-consumption, and (2) keeping the minimum required share (30%) for biomethane using the remainder to produce electricity until the phase-out of feed-in tariffs (year 2027). From 2028 onwards, option 2a foresees the switch to option 1, whereas option 2b foresees to cover the energy needs of the plant with electricity and gas from the grid. In addition, the use of maize can be phased out by replacing it with triticale, which can be cultivated as a second crop on maize fields, thus removing the impact on food production.
Results show that feed-in electricity tariffs (for the case study analyzed, options 2a,b from 2022 to 2027) are vital to repay the investment for the upgrading and compression systems. As the plant is converted to biomethane to cope with the new incentive regime, self-consumption with a biogas-powered CHP unit (option 2a) is more convenient than covering energy needs with the grid (option 2b), with internal rate values of 26.14% and 21.77%, respectively. The immediate reconversion to biomethane production (option 1) is an investment with an IRR of 5.96%.
The economic viability of the AD plant is influenced by four critical parameters, namely (i) the price of the triticale sileage, (ii) the sale price of biomethane certificates (CIC) after the end of incentivization, (iii) the biogas productivity and, for option 2b only, (iv) the purchase price of electricity. Based on the results of Monte Carlo simulations with random values of these four variables, option 2a proves more robust compared to 2b, as it provides good IRR values in a higher number of cases.
The price of biomethane certificates is a very influential variable for the economic viability of AD plants. The break-even sale price of the CIC in the decade 2032–2041 (i.e., after the phase out of the incentives) is 262.20 €/CIC for option 1, 260.47 €/CIC for option 2a, and 321.57 €/CIC for option 2b. Below these thresholds, the cumulated cash flow in the last decade of operation becomes negative.
The economic analysis highlighted that the need to compress methane for its transport to a gas grid release point hampers the profitability of the AD plant. Indeed, if the gas pipeline network permits a direct delivery, the IRR would double for the worst performing option, option 1, from 5.96% to 13.12%. This result is particularly important as it highlights the importance of finding suitable installation sites for future AD plants, where biomethane can be directly delivered to the pipeline network.
The GHG budget assessment reveals that covering the energy needs of the plant with a CHP unit (options 1 and 2a) is the best solution of GHG emissions. Nevertheless, the GHG budget is negative for all the options considered, ranging from 1046 tCO2eq/y (option 2b) to 1228 tCO2eq/y avoided (option 2a). This budget is strongly influenced by methane loss rates in the digester, the CHP unit, and the upgrading. High values were used as a conservative assumption and, hence, the real GHG budget is likely to be better.
Option 2a therefore proves to be the best solution for both economic return and the GHG budget. It is also the least economically vulnerable option considering the possible variation in critical parameters (triticale purchase price, CIC sale price, and biogas production).
This study provides insight to the opportunities and risks of retrofitting AD plants operating with manures, from electricity to biomethane production. This challenge involves hundreds of installations in Italy and in other European countries with similar issues. Future research is therefore necessary to reduce operational costs and to improve incentivization regimes, considering the importance of AD plants for the management of manures.
Supplementary Materials
The following are available online at https://www.mdpi.com/article/10.3390/su13147979/s1, Excel spreadsheets BP_option1.xlsx, BP_option2a.xlsx, and BP_option2b.xlsx reporting input data and results of the economic assessment performed for options 1, 2a, and 2b, respectively.
Author Contributions
Conceptualization, A.C., M.P., D.P., M.Z.; methodology, A.C., M.P., D.P., M.Z.; writing—original draft preparation, A.C.; writing—review and editing, A.C., M.P., D.P., M.Z.; supervision, D.P. All authors have read and agreed to the published version of the manuscript.
Funding
This research received no external funding.
Data Availability Statement
Data used in this paper are available in the Supplementary Materials and in the References provided.
Acknowledgments
The authors gratefully acknowledge the valuable contribution of Sofia Credaro, who assisted in the proofreading and language editing of the manuscript.
Conflicts of Interest
The authors declare no conflict of interest.
Abbreviations and Symbols
| AD | Anaerobic digester (or digestion) |
| CAPEX | Capital expenditure |
| CCGT | Combined Cycle Gas Turbine |
| CF | Cash flow |
| CHP | Combined heat and power |
| DCF | Discounted cash flow |
| EBITDA | Earnings before interests, taxes, depreciation, and amortization |
| EU | European Union |
| GHG | Greenhouse gas |
| ICE | Internal Combustion Engine |
| IRR | Internal rate of return |
| NVZ | Nitrate vulnerable zones |
| OPEX | Operational expenditure |
| R | Revenues |
| T | Taxes |
| USEPA | United States Environmental Protection Agency |
| WACC | Weighted average capital costs |
References
- European Commission Energy Roadmap 2050. Available online: https://bit.ly/3pIuWEE (accessed on 22 February 2021).
- European Commission 2030 Climate Target Plan. Available online: http://bit.ly/3bvI76P (accessed on 22 February 2021).
- Scarlat, N.; Dallemand, J.-F.; Monforti-Ferrario, F.; Nita, V. The Role of Biomass and Bioenergy in a Future Bioeconomy: Policies and Facts. Environ. Dev. 2015, 15, 3–34. [Google Scholar] [CrossRef]
- Scarlat, N.; Dallemand, J.-F.; Fahl, F. Biogas: Developments and Perspectives in Europe. Renew. Energy 2018, 129, 457–472. [Google Scholar] [CrossRef]
- Abbasi, T.; Tauseef, S.M.; Abbasi, S.A. Anaerobic Digestion for Global Warming Control and Energy Generation—An Overview. Renew. Sustain. Energy Rev. 2012, 16, 3228–3242. [Google Scholar] [CrossRef]
- Rada, E.; Ragazzi, M.; Stefani, P.; Schiavon, M.; Torretta, V. Modelling the Potential Biogas Productivity Range from a MSW Landfill for Its Sustainable Exploitation. Sustainability 2015, 7, 482–495. [Google Scholar] [CrossRef] [Green Version]
- Al Seadi, T.; Rutz, D.; Prassl, H.; Köttner, M.; Finsterwalder, T.; Volk, S.; Janssen, R. Biogas Handbook; University of Southern Denmark Esbjerg: Esbjerg, Denmark, 2008; ISBN 978-87-992962-0-0. [Google Scholar]
- EBA. EBA Statistical Report. 2020. Available online: https://bit.ly/3gDgyen (accessed on 15 June 2021).
- Hakawati, R.; Smyth, B.M.; McCullough, G.; De Rosa, F.; Rooney, D. What Is the Most Energy Efficient Route for Biogas Utilization: Heat, Electricity or Transport? Appl. Energy 2017, 206, 1076–1087. [Google Scholar] [CrossRef] [Green Version]
- Banja, M.; Jégard, M.; Motola, V.; Sikkema, R. Support for Biogas in the EU Electricity Sector—A Comparative Analysis. Biomass Bioenergy 2019, 128, 105313. [Google Scholar] [CrossRef]
- Prussi, M.; Padella, M.; Conton, M.; Postma, E.D.; Lonza, L. Review of Technologies for Biomethane Production and Assessment of Eu Transport Share in 2030. J. Clean. Prod. 2019, 222, 565–572. [Google Scholar] [CrossRef] [PubMed]
- De Clercq, D.; Wen, Z.; Fei, F. Economic Performance Evaluation of Bio-Waste Treatment Technology at the Facility Level. Resour. Conserv. Recycl. 2017, 116, 178–184. [Google Scholar] [CrossRef]
- Wang, J.; Chai, Y.; Shao, Y.; Qian, X. Techno-Economic Assessment of Biogas Project: A Longitudinal Case Study from Japan. Resour. Conserv. Recycl. 2021, 164, 105174. [Google Scholar] [CrossRef]
- GSE Statistical Report on Renewable Energy Sources. Available online: https://bit.ly/3vAGOMs (accessed on 3 May 2021). (In Italian).
- Italian Health Ministry. National Livestock Register. Available online: https://www.vetinfo.it/ (accessed on 4 May 2021).
- Lasagna, M.; Franchino, E.; De Luca, D.A. Areal and Vertical Distribution of Nitrate Concentration in Piedmont Plain Aquifers (North-Western Italy). In Engineering Geology for Society and Territory—Volume 3; Lollino, G., Arattano, M., Rinaldi, M., Giustolisi, O., Marechal, J.-C., Grant, G.E., Eds.; Springer International Publishing: Cham, Switzerland, 2015; pp. 389–392. ISBN 978-3-319-09053-5. [Google Scholar]
- CEE. Council Directive 91/676/EEC of 12 December 1991 Concerning the Protection of Waters against Pollution Caused by Nitrates from Agricultural Sources. Available online: https://bit.ly/2ZY2yUP (accessed on 28 February 2021).
- Regione Piemonte La Direttiva Nitrati in Piemonte (the Nitrate Directive in Piemonte). Available online: http://bit.ly/3bOxI6E (accessed on 28 February 2021).
- Scarlat, N.; Fahl, F.; Dallemand, J.-F.; Monforti, F.; Motola, V. A Spatial Analysis of Biogas Potential from Manure in Europe. Renew. Sustain. Energy Rev. 2018, 94, 915–930. [Google Scholar] [CrossRef]
- General Electric GE Jenbacher J 320 GS-C25 999 KW Datasheet. Available online: https://bit.ly/2NFu5rv (accessed on 22 March 2021).
- Repubblica Italiana Legislative Decree n. 79/1999. Available online: http://bit.ly/3b1ZP2P (accessed on 1 March 2021).
- MISE. Ministerial Decree 18th December 2008—Incentives for Electricity Production from Renewable Energy Sources. Available online: http://bit.ly/3uGHm3D (accessed on 1 March 2021).
- MISE. Ministerial Decree 6th July 2012—Incentives for Renewable Energy Sources. Available online: https://bit.ly/3kwSz2h (accessed on 1 March 2021).
- MISE. Ministerial Decree 23th June 2016—Incentives for Electricity Production from Renewable Energy Sources Other than Photovoltaic. Available online: https://bit.ly/3bTu9MB (accessed on 1 March 2021).
- MISE. Ministerial Decree 2nd March 2018. Promotion of the Use of Biomethane and Other Advanced Biofuels in the Transport Sector. Available online: http://bit.ly/3b9NbiA (accessed on 2 March 2021).
- Repubblica Italiana Law 145/2018. Budget Forecast of the State for the Financial Year 2019 and Budget for Years 2019-2022. Available online: https://bit.ly/2NLNuqZ (accessed on 2 March 2021).
- Angelidaki, I.; Treu, L.; Tsapekos, P.; Luo, G.; Campanaro, S.; Wenzel, H.; Kougias, P.G. Biogas Upgrading and Utilization: Current Status and Perspectives. Biotechnol. Adv. 2018, 36, 452–466. [Google Scholar] [CrossRef] [Green Version]
- TUW Biogas to Biomethane Technology Review. Available online: https://bit.ly/3cwzTNN (accessed on 5 December 2020).
- Ingrao, C.; Bacenetti, J.; Adamczyk, J.; Ferrante, V.; Messineo, A.; Huisingh, D. Investigating Energy and Environmental Issues of Agro-Biogas Derived Energy Systems: A Comprehensive Review of Life Cycle Assessments. Renew. Energy 2019, 136, 296–307. [Google Scholar] [CrossRef]
- Cantale, C.; Petrazzuolo, F.; Correnti, A.; Farneti, A.; Felici, F.; Latini, A.; Galeffi, P. Triticale for Bioenergy Production. Agric. Agric. Sci. Procedia 2016, 8, 609–616. [Google Scholar] [CrossRef]
- Gissén, C.; Prade, T.; Kreuger, E.; Nges, I.A.; Rosenqvist, H.; Svensson, S.-E.; Lantz, M.; Mattsson, J.E.; Börjesson, P.; Björnsson, L. Comparing Energy Crops for Biogas Production—Yields, Energy Input and Costs in Cultivation Using Digestate and Mineral Fertilisation. Biomass Bioenergy 2014, 64, 199–210. [Google Scholar] [CrossRef]
- Panepinto, D.; Genon, G.; Brizio, E.; Russolillo, D. Production of Green Energy from Co-Digestion: Perspectives for the Province of Cuneo, Energetic Balance and Environmental Sustainability. Clean Techn Environ. Policy 2013, 15, 1055–1062. [Google Scholar] [CrossRef]
- Ravina, M.; Castellana, C.; Panepinto, D.; Zanetti, M.C. MCBioCH4: A Computational Model for Biogas and Biomethane Evaluation. J. Clean. Prod. 2019, 227, 739–747. [Google Scholar] [CrossRef]
- Awe, O.W.; Zhao, Y.; Nzihou, A.; Minh, D.P.; Lyczko, N. A Review of Biogas Utilisation, Purification and Upgrading Technologies. Waste Biomass Valor 2017, 8, 267–283. [Google Scholar] [CrossRef] [Green Version]
- CRPA Biogas: Techno-Economic Feasibility Analysis. Available online: https://bit.ly/3rilk4o (accessed on 24 March 2021).
- CONDIFESA. Cuneo Consortium for the Defense of Intensive Production. Price Ranges for Agricultural Commodities in the District of Cuneo. Available online: https://www.condifesacuneo.it/ (accessed on 6 December 2020).
- Mariani, F.; Gonzalez, D.; Ribas, X. Cost Analysis of LNG Refuelling Stations. Available online: https://bit.ly/2OdTWqX (accessed on 1 April 2021).
- Warren, K.E.H. A Techno-Economic Comparison of Biogas Upgrading Technologies in Europe. Available online: https://bit.ly/3wtjsK6 (accessed on 1 April 2021).
- Eurostat Electricity Prices for Non-Household Consumers—Bi-Annual Data (from 2007 Onwards). Available online: https://bit.ly/3tKnvj7 (accessed on 23 April 2021).
- Eurostat Gas Prices for Non-Household Consumers—Bi-Annual Data (from 2007 Onwards). Available online: https://bit.ly/3ew4Bqa (accessed on 23 April 2021).
- GSE Gas Market Statistics. Available online: https://bit.ly/3nxu72m (accessed on 28 April 2021).
- CMA Facts Sheet on Biomethane for Italian Farms. Available online: https://bit.ly/3dJaLUr (accessed on 13 March 2021). (In Italian).
- Sartori, D.; Catalano, G.; Genco, M.; Pancotti, C.; Sirtori, E.; Del Bo, C. Guide to Cost-Benefit Analysis of Investment Projects: Economic Appraisal Tool for Cohesion Policy 2014–2020. Available online: https://bit.ly/2Q1eVgU (accessed on 13 March 2021).
- IPCC Fifth Assessment Report AR5. Available online: https://www.ipcc.ch/assessment-report/ar5/ (accessed on 7 March 2020).
- ISPRA CO2 Emission Factors of the Electric Sector. Available online: https://bit.ly/ISPRA_EF (accessed on 21 March 2021).
- FAIB Report on Transportation Fuel Sales. Available online: https://bit.ly/3vbDPKe (accessed on 23 April 2021). (In Italian).
- SNAM Decadal Plan of Gas Pipeline Network Development. Available online: https://bit.ly/3sJviwo (accessed on 23 April 2021). (In Italian).
- Le Goffe, P. The Nitrate Directive, Incompatible with Livestock Farming? The Case of France and Northern European Countries. Available online: https://bit.ly/32ZBlmh (accessed on 30 April 2021).
- Ragazzoni, A. Biogas in the Barn Abates the Costs of Nitrate Directive (Original in Italian). Available online: https://bit.ly/3aQLSo5 (accessed on 30 April 2021).
- Casasso, A.; Capodaglio, P.; Simonetto, F.; Sethi, R. Environmental and Economic Benefits from the Phase-out of Residential Oil Heating: A Study from the Aosta Valley Region (Italy). Sustainability 2019, 11, 3633. [Google Scholar] [CrossRef] [Green Version]
- ARPA Piemonte WebGIS Biogas Plants in Piemonte Region. Available online: https://bit.ly/3srT8NU (accessed on 28 March 2021).
- Bartoli, A.; Hamelin, L.; Rozakis, S.; Borzęcka, M.; Brandão, M. Coupling Economic and GHG Emission Accounting Models to Evaluate the Sustainability of Biogas Policies. Renew. Sustain. Energy Rev. 2019, 106, 133–148. [Google Scholar] [CrossRef]
- Adams, P.W.R.; Mezzullo, W.G.; McManus, M.C. Biomass Sustainability Criteria: Greenhouse Gas Accounting Issues for Biogas and Biomethane Facilities. Energy Policy 2015, 87, 95–109. [Google Scholar] [CrossRef] [Green Version]
- Buratti, C.; Barbanera, M.; Fantozzi, F. Assessment of GHG Emissions of Biomethane from Energy Cereal Crops in Umbria, Italy. Appl. Energy 2013, 108, 128–136. [Google Scholar] [CrossRef]
- Baral, K.R.; Labouriau, R.; Olesen, J.E.; Petersen, S.O. Nitrous Oxide Emissions and Nitrogen Use Efficiency of Manure and Digestates Applied to Spring Barley. Agric. Ecosyst. Environ. 2017, 239, 188–198. [Google Scholar] [CrossRef]
- Shen, J.; Treu, R.; Wang, J.; Nicholson, F.; Bhogal, A.; Thorman, R. Modeling Nitrous Oxide Emissions from Digestate and Slurry Applied to Three Agricultural Soils in the United Kingdom: Fluxes and Emission Factors. Environ. Pollut. 2018, 243, 1952–1965. [Google Scholar] [CrossRef]
- Bakkaloglu, S.; Lowry, D.; Fisher, R.E.; France, J.L.; Brunner, D.; Chen, H.; Nisbet, E.G. Quantification of Methane Emissions from UK Biogas Plants. Waste Manag. 2021, 124, 82–93. [Google Scholar] [CrossRef] [PubMed]
- Scheutz, C.; Fredenslund, A.M. Total Methane Emission Rates and Losses from 23 Biogas Plants. Waste Manag. 2019, 97, 38–46. [Google Scholar] [CrossRef]

Publisher’s Note: MDPI stays neutral with regard to jurisdictional claims in published maps and institutional affiliations. |
© 2021 by the authors. Licensee MDPI, Basel, Switzerland. This article is an open access article distributed under the terms and conditions of the Creative Commons Attribution (CC BY) license (https://creativecommons.org/licenses/by/4.0/).