Abstract
The New Public Management allows us to reflect upon whether intellectual capital helps public sector organisations meet their performance benchmarks. Sustainable economic performance gains importance from the public sector’s service ideal. Although there have been empirical endeavours using intellectual capital as operational variables, this study examines the theoretically informed relationship between the intellectual capital construct and its construct dimensions and the sustainable economic performance construct and its construct dimensions. The decision-making inputs of senior officials in the Malaysian public sector are vital for evaluating the relationship, as these officials are the individual strategists of the collective organisational strategy. The study conducted a survey that received 1092 usable responses and analysed them using the structural equation modelling research method. The findings showed a robust theoretical relationship between intellectual capital and sustainable economic performance. Furthermore, the study identified intellectual capital items that play a vital role in supporting public sector sustainable economic performance in Malaysia under New Public Management. The findings provide useful knowledge for public sector officials and policymakers, and for further research.
1. Introduction
Research has pointed out that intellectual capital in the public sector is less researched than in the private sector [1,2]. The public sector contributes to the gross domestic product of countries [2]. It makes substantial use of organisational knowledge and service-delivery capabilities [3]. A review of the literature has shown a positive, non-linear relationship between intellectual capital and performance in organisations, regions, and countries [4]. This non-linear relationship can arise because the public sector must use its organisational capacity with available resources to create legitimated values. The legitimation is not just for the elected parliamentary representatives, but also a more extensive set of stakeholders [5]. The public values relate to being efficient and effective, and that outcomes result from good governance—being honest, open, participative, lawful, and professional; this can enhance reputation [6,7]. Creating public values is a top priority in the New Public Management (NPM) [8].
Many countries have embraced NPM as a basis for structural reform of the public sector, using intellectual capital (IC) as a mode of operation to orient a sustainable economic enterprise system [9]. Intellectual capital is a gamut of intangible resources that are not recognised as assets on financial statements, but that contribute to economic value creation. Sustainable economic performance is value-for-money performance sustained over a longer time horizon. Countries have institutionalised NPM as an organisational model in the public sector, adopting rational and progressive cultural norms that support newly embraced management practices [10,11,12].
The traditional mode of public management emphasised service. The New Public Management has shifted the emphasis to service delivery being both responsive to those receiving products and services from the public sector and also accountable in making policy choices to the collective will of those directly involved with the particular service. This shift has resulted in a change in public-sector identity, resulting from the shift in ideology from bureaucracy to management. There are different versions of bureaucracy—procedural, corporate, market, and network. Although bureaucracy has not completely disappeared, the NPM has introduced managerial logic to conducting public-sector operations, with the aim of maintaining economically sustainable organisations [4].
Three factors motivated this study. First, the Malaysian government has identified the public sector as a critical driver to attain its Vision 2020, focused on developing a knowledge-based economy towards sustainable economic performance [13]. As a consequence, IC’s role in value creation for the public sector has assumed greater importance. Second, the NPM reforms have transformed the Malaysian public sector, notably with the national government transformation program launched in 2010 to improve accountability and effectiveness. These strategically directed transformations provide an opportunity to ascertain sustainable economic performance for public-sector organisations [14]. Third, several emerging economies in Asia have embraced NPM philosophies in the public sector to support sustainable economic performance. Thus, the case of Malaysia can serve as an example for contrast and comparison.
This study chose sustainable economic performance measures for the following reasons. First, sustainable economic performance measures have a close link to long-term organisational performance. Second, long-term performance success includes IC, which has implications for financial and non-financial performance over a longer time horizon. Third, organisational capabilities can influence sustainable economic performance measures, promoting a shared vision among staff and establishing supportive, participatory relationships with outside stakeholders [15].
This study examines the relationship between IC and sustainable economic performance. The body of literature informs us that internal capital, external capital, and human capital are conceptual dimensions that represent the IC construct. The literature also reports that a firm sustainable economic-performance construct can have conceptual dimensions, three of which are efficiency, effectiveness, and reputation. The study used a survey questionnaire that solicited senior executives’ decision-making inputs about IC and sustainable economic performance by operationalising these into real-life situations. Senior executives’ experiences, personalities, and values can influence strategic organisational decisions because strategic choices have a substantial behavioural input from these executives [16,17]. Our findings showed that IC had a strong positive influence on sustainable economic performance, supporting its use as a conceptually and empirically sound proposition.
Section 2 presents the Malaysian institutional context, followed by a review of literature about performance, intellectual capital, and NPM in Section 3. Section 4 outlines a theoretical framework showing that IC is a set of capabilities that enable sustainable economic performance, and Section 5 explains the survey design, checks for validity and reliability, sampling, and data collection. Section 6 outlines the findings obtained through structural equation modelling. Finally, Section 7 explains the limitations encountered, future research propositions arising from the study, and the results’ conceptual and managerial implications.
2. Malaysian Public Sector Context
The Malaysian public sector comprises 1.4 million staff serving 28 million people. It undertook various reforms under the Government Transformation Program to increase its efficiency and effectiveness and overcome barriers that hinder firm performance. These intended resource savings imitate private-sector accountability by using performance-management systems to monitor customer-focused productivity [18,19].
After achieving independence from colonial governance in 1957, the Malaysian government created public enterprises to support its development goals, situated alongside a less-developed private sector that was unable to make such a contribution. In the early 1980s, two critical policies influenced the Malaysian public sector in adopting NPM. These were the Look East Policy in 1982 and the Malaysian Incorporated and Privatisation Policy in 1983. These policies encouraged the public sector to embrace a managerial mindset more typical of the private sector and accept more accountability for actions undertaken [20,21]. As the Malaysian public sector failed to meet expected outcome targets in the mid-1980s, these two policies led to new and increased privatisation of government enterprises and required the public sector to assume greater accountability for service delivery [22].
These changes have led to public-sector organisations developing key performance indicators around four aspects involving greater managerialism and accountability. First, the efficacy test determines whether the organisation does things right according to citizens. Second, the efficiency test ascertains whether the organisation is maximising benefits from resource use. Third, the alternative test examines whether the organisation forges internal and external partnerships that support effectiveness and efficiency by transferring activities to and from other organisations. Fourth, the money-worth test considers whether citizens are receiving the best value for the money invested and spent on their behalf [22]. These performance outcomes are self-assessed by the public-sector organisations [23].
A redefined focus on macroeconomic policies and strategies is paramount to make a sustained transition into a borderless knowledge economy [24]. In 2010, one pillar of the National Transformation Plan set goals to attain Vision 2020, with another one of these pillars being the effective delivery of government services. The NPM reforms have required a significant shift in adopting best practices, contextualising them to Malaysia, and effectively executing them. This project focuses on organisational knowledge relating to staff capabilities and the structure of relationships with outsiders. These are the competencies of intellectual capital [25].
Public-sector firms respond to performance matrices ranging from financial to non-financial [26] as mainstream performance benchmarks. Still, NPM has focused on customer satisfaction, where organisational reputation plays a vital role in sustainable economic performance [27]. Moreover, public sector organisations provide products and services that are mostly intangible. Therefore, NPM requires the Malaysian public sector to adopt its ethos from the private sector, but with a long-term economic performance outlook, to deliver goods and services that contribute to Vision 2020 effectively and efficiently, and to become a reputable, citizen-focused cluster of high-performing organisations.
Several studies have shown that IC affects private-sector firm performance [28,29,30,31], but the association between IC and public-sector organisational performance for economic sustainability remains ill-examined. Malaysia is an appropriate choice to advance IC studies in developing countries because of the following: (i) its adoption of a market-oriented and enterprise-development approach in public-sector organisations; (ii) its significant reforms in the public sector, including privatisation and the introduction of a management-oriented philosophy; and (iii) its goal of being highly developed in the knowledge economy by 2020. NPM practices draw from the private sector to hold the public sector accountable, with an efficient, effective, and reputable public sector as key performance indicators. NPM practices must operationalise an array of intangibles—IC—because tangible assets alone have a limited capacity to meet the needs of market forces.
3. Relevant Literature and Hypothesis Development
3.1. Intellectual Capital and Sustainable Economic Performance Constructs
Intellectual capital is a construct that was developed at the initial stages of IC research. Later, IC research conceptualised IC according to three dimensions to aid empirical investigations: internal capital, external capital, and human capital [32]. Therefore, this study chose the three-dimensional IC classification of internal capital (capital generated by internal organisational structures), external capital (capital generated by relating to the external environment), and human capital (capital created by the staff). Thus, Malaysian NPM aims to build citizen-focused organisational knowledge (external capital), develop staff capabilities (human capital), and restructure firms through cultural, systemic, and processual changes (internal capital).
In the past, the Malaysian public sector suffered a low level of public trust due to its poor responsiveness to outcomes, its failure to meet citizens’ delivery needs, and its corruption. The low level of faith in the Malaysian public sector has contributed to embracing the NPM model. IC in NPM enables public-sector firms with resource capabilities to differentiate the products and services provided, and facilitates public-sector firms operating like private firms, with sustainable economic performance in organisational matrices, including customer-focused accountability [24].
3.2. Relationship between Intellectual Capital and Sustainable Economic Performance
After administering a survey questionnaire across two public sector entities within the Gulf Cooperation Council region and collecting responses from 371 employees, Farah and Abouzeid [33] showed a positive relationship between IC and performance. They selected the multi-item scale measure developed by Youndt and colleagues [34], which drove IC dimensions. Farah and Abouzeid [33] measured the human-capital dimension with six items, social capital with four items, and organisational capital with four items. They conducted ordinary least squares regression with a given dimension of organisational performance (measured with five items). They found a significant positive relationship between each IC dimension and organisational performance. In their conclusions, they suggested that future studies could use partial least squares instead to attain conceptual rigour.
An exploratory study conducted by Verma and Dhari [12] in India compared IC association with organisational effectiveness using purposive sampling, collecting 210 responses from the public sector. They analysed responses by regressing each IC dimension (human capital, customer capital, and social capital) with organisational effectiveness. They concluded that IC dimensions in the public sector associated with higher organisational effectiveness. However, they restricted the methodological rigour with purposive sampling.
Carmeli and Tishler [35] investigated the relationships between intangible organisational elements and organisational performance in the public sector. First, they measured the effect of six intangibles: managerial capabilities, human capital, internal auditing, labour relations, organisational culture, and perceived corporate reputation. Second, they measured performance as financial performance, municipal development, internal migration, and employment rate. Then, they individually established relationships between intangibles and organisational performance, finding a positive association.
Isolating operational variables and establishing relationships between IC constructs and organisational-performance constructs enriches the empirical evidence. Each association noted in the above-mentioned empirical studies can offer different explanations, as they are minor representations of the relationships between the two constructs. These previous studies have examined only certain aspects of IC using operational variables, but do not show how IC comprehensively influences performance at both the functional and conceptual levels. Additionally, these investigations have not examined these issues in the NPM context. This study helps bridge the gap concerning the relationship between IC and public-sector organisational-performance constructs for economic sustainability in the NPM context.
4. Theoretical Framework and Hypothesis
A resource-based view rests on the crucial insight that the scarcity, value, and imperfect imitability of resources can create sustained performance differences among competing firms [36]. Competencies are one such imperfectly inimitable resource [29]. Although the resource-based theory acknowledges that knowledge and capabilities are resources, it does not conclude which is more important. It also does not explain how deploying resources leads to a competitive advantage.
IC is a gamut of resources and capabilities comprising the knowledge that can improve an organisation’s competitive advantage. The knowledge-based view assesses knowledge as a strategically significant resource with the capability for competitive advantage [37], but does not explain how competitive advantage leads to value creation. The intellectual-capital-based view (ICV) complements the knowledge-based view, focusing on the IC competitive edge leading to value creation that manifests as sustainable-performance measures [34]. The ICV also acknowledges that IC constructs consist of multiple IC dimensions: Human capital includes assets that create value with the help of talented and committed workers; external capital refers to assets that sustain long-term relationships with the firm and its stakeholders; and structural capital comprises supportive infrastructure to retain, transfer, reinforce, and package knowledge and organisational activities [38,39].
As shown in Figure 1, this study first examines operationally and then conceptually the research question concerning the extent to which IC relates to sustainable economic performance. Then, guided by the private-sector findings, we state the hypothesis in a directional form (Figure 1).
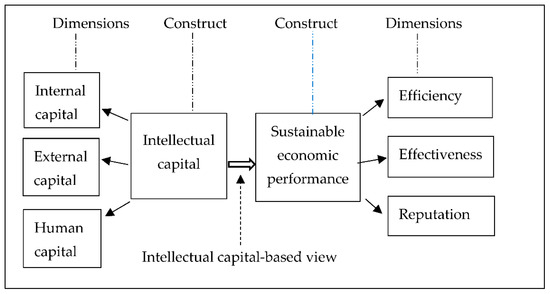
Figure 1.
The theoretical proposition of the hypothesis.
Hypothesis: the intellectual capital construct and its construct dimensions positively influence the sustainable economic-performance construct and construct dimensions.
5. Research Methodology
5.1. Developing IC Measurement Items in the Survey Questionnaire
As shown in Figure 2, this study conducted four different focus group interviews to explore the relevance of a list of IC items to the Malaysian public sector, with 30 participants from the Malaysian public sector. The participants were selected using the Delphi consultation technique. They provided their expert opinions about items included in the pilot questionnaire [40,41]. The study ensured that these participants did not know each other, in order to eliminate the peer pressure and undue influence that can otherwise occur in group settings. The study followed the guidelines for planning, organising, and developing questions, and moderating focus-group sessions [9,27]. Each session ran for 45 min to one hour.
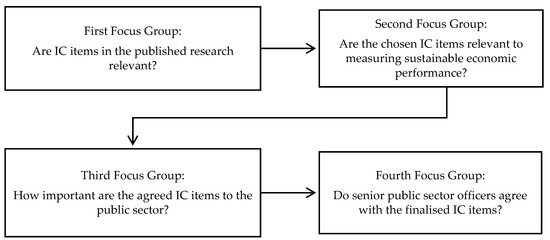
Figure 2.
Developing and finalising intellectual-capital items through four separate focus-group discussions.
The first focus-group meeting established the relevance of IC items identified from the literature and from a preliminary organisational performance list [19]. Before proceeding with the focus-group meeting, an author explained the meaning of the two constructs (IC and sustainable economic performance) and their dimensions (internal capital, external capital, and human capital; and effectiveness, efficiency, and reputation) to the participants.
The second focus-group meeting involved a different set of participants who were asked to review IC items of relevance and sustainable economic-performance items identified by the first focus group. Thus, the first two focus-group meetings expanded the list of preliminary items from 23 to 38.
The participants in the third focus group were not in the first two groups. After giving them the IC items list finalised by the second focus group, they reviewed them to ascertain their relative importance to the public sector by ranking each item on a 7-point Likert scale (0 = highly disagree to 7 = highly agree).
The fourth focus-group meeting comprised participants who were not in the previous three focus groups. They received the list of items finalised by the third focus group, and each participant rated them on the 7-point Likert scale. This session aimed to reach a consensus on IC resource items in order to build a rigorous list of research items from the perspective of highly ranked public sector officers. Participants did not propose changes to the items, indicating a consensus among participants and reaching the items’ saturation in the final questionnaire. The rankings assigned to each item also showed a high level of agreement between focus groups three and four. These activities led to a final list of 54 IC items. In this list, the human-capital dimension consisted of 19 items, the internal capital dimension of 18 items, and the external capital dimension of 17 items.
5.2. Developing Performance-Measurement Items in the Survey Questionnaire
The effectiveness dimension included items adapted from Waterman and colleagues’ 7-S framework comprising shared values, strategy, structure, skills, staff, systems, and style and culture [42]. This study invited the first two focus groups to discuss the relevance to the Malaysian public sector of 17 items listed in the 7-S framework to the effectiveness dimension. The focus-group participants validated the 17 items suggested and retained them all without adding any.
Service quality is highest on the agenda of the public sector [43]. The efficiency dimension’s initial items were adapted from Ruiqi and Adrian [11], with 22 items to measure service quality using the SERVQUAL model. We asked the first two focus groups to identify whether these items were relevant to the Malaysian public sector organisations and invited them to add any missing items. This process resulted in 25 items for the efficiency dimension.
Fombrun and colleagues’ [44] reputation quotient (RQ) instrument measures corporate reputation using six aspects: emotional appeal, products and services, financial performance, vision and leadership, workplace environment, and social responsibility. This study adopted 20 items from RQ. In addition, the study asked the first two focus groups to review these items for the Malaysian public sector context; the final list for the reputation dimension comprised 19 items.
5.3. Survey Questionnaire Testing
The questionnaire testing followed two stages: pilot and final, as shown in Figure 3, with each step contributing to the development of a reliable, valid, and responsive final questionnaire.
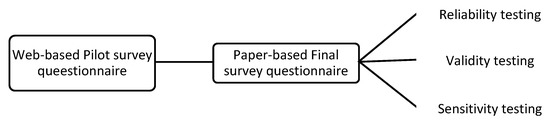
Figure 3.
Survey questionnaire testing.
5.3.1. Pilot Survey Questionnaire Testing
This study conducted a website-based pilot survey using the LimeSurvey platform. Before inviting participants to respond, the study tested for any errors (“bugs”) by administering the questionnaire over one week. During that time, we randomly chose participants from the Malaysian public-sector target group for the pilot study by pre-screening them using four criteria: (i) being in a middle-management position or above; (ii) having five or more years of experience working in the public sector; (iii) having more than five subordinate staff members reporting to them, and (iv) being either federal, state, or local government agency employees. The study initially contacted participants over the telephone, informed them about the research, invited them to participate in the pilot survey, and obtained their preferred email address.
After receiving their verbal consent, participants received an email to access the questionnaire via the URL. After a week, the study contacted the participants by email or by telephone to remind them to complete the survey. A total of 80 invitations were sent, resulting in 50 completed questionnaires. The survey instrument had 115 items (54 IC items + 61 performance items), with participants rating each item on a 7-point Likert scale from 1 = highly disagree to 7 = highly agree. In addition, the website was offered in two languages—English and Malay—enabling optimal comprehension for participants.
5.3.2. Final Survey Questionnaire Testing
To make the survey questions robust, the study tested the questions for: (1) reliability (consistency of the measurement), (2) validity (accuracy of the measure in representing what it claims to represent), and (3) sensitivity (variability of the construct measurement) [45].
- (1)
- Reliability testing of the survey questionnaire
This study measured the internal consistency aspect of an item’s reliability with a coefficient Cronbach alpha score (α) that computed the level of convergence by the average item values for the given construct [45]. Using the SPSS statistical software package, we ascertained the coefficient α for each of the six dimensions separately—i.e., the three IC dimensions and the three performance dimensions. Each dimension had a coefficient α score above 0.90. A high score indicated high reliability of questions in the scaled survey instrument. The specific scores were as follows: human capital (19 items, α = 0.94), internal capital (18 items, α = 0.92), external capital (17 items, α = 0.92), effectiveness (17 items, α = 0.95), efficiency (25 items, α = 0.95), and reputation (19 items, α = 0.93).
- (2)
- Validity testing of the survey questionnaire
The study inferred that the items had high content validity because there was no negative feedback from the participants for the pilot study questionnaire [45,46] content, the wording arrangement, the type and forms of questions asked, or sequence of the question items.
- (3)
- Sensitivity testing of the survey questionnaire
The study accommodated and measured sensitivity using a 7-point Likert scale to gauge responses to items more accurately, as a broader scale solicits more precise answers.
- (4)
- The sampling procedure adopted in the study
The sampling frame restricted participants selected to senior public-sector officers in resource decision-making roles. The study randomly chose suitable officers as participants. The usable sample size was 1092 participants who completed the finalised survey questionnaire. Many observations more than sufficiently allowed to include the required number of parameters [47]. The study analysed the data to test the hypothesis using two-stage structural equation modelling.
6. Results and Discussion
6.1. Establishing the Links in the Structural Equation Model (SEM)
The descriptive estimates of the findings showed that there were no negative variances. The standardised coefficients neither exceeded nor were close to 1.0 (Table 1). There were no substantial standard errors. These results showed that the estimates were reliable.

Table 1.
Descriptive statistics for the observed variables.
It is usual for structural equation modelling to use a covariance matrix rather than a correlation matrix for analysis for more sound statistical analysis. The correlation matrix provides an interpretation similar to factor analysis [48,49]. The correlation shows a change in one variable on another variable, assuming constant (one variable depends on the relationship). On the other hand, covariance is about how the two variables vary together (inter-dependent relationship), and these standardised relationships are interpretable with standardised beta values [50,51]. The intellectual-capital dimensions had a high correlation with the intellectual-capital construct, indicating that the construct dimensions contributed towards the construct. The performance dimensions also had a strong correlation with the performance construct, indicating a high dimensional contribution towards the construct. The construct dimensions showed positive correlations with the constructs. The pairwise correlations between the intellectual-capital dimensions and performance dimensions were not high, and did not indicate auto-correlations.
6.2. Confirmatory Factor Analysis
6.2.1. First-Order CFA of IC Dimensions (Measurement IC Model Fit)
The study measured the goodness-of-fit between the actual output matrix generated using field data and the matrix proposed by the model [32]. This study chose GFI, SRMR, and RMSEA to represent absolute fit measures; TLI, CFI, and AGFI to describe incremental fit measures; and NC to describe parsimonious fit measures.
The SEM results showed that the factor loadings and variances of each indicator variable fit the conceptual model. The study tested the final IC resource items to ensure that they had factorial validity. The factorial validity showed to what extent the items loaded into relevant IC dimensions. The three IC dimensions were the three different factors [52].
6.2.2. Second-Order CFA of IC Dimensions (Structural IC Model Fit)
After considering the measurement model fit with IC dimensions and resource items, the study examined the IC structural model fit. The study found IC dimensions intercorrelated with the IC construct, and no additional resource items were deleted, with no changes or modifications required to the model. Table 2 presents the acceptable model fit comprising 17 IC items: six internal capital items, five external capital items, and six human capital items.
Table 2.
Observable IC resource items that contributed to IC dimensions.
Table 2 shows that all factor loadings were more than 0.7. This meant that each survey question item (factor) provided sufficient explanation (variance) with respect to the intended construct dimension. The variance values are the squared value of the factor loading values. Because all these factor loadings were more than 0.7, all the questionnaire items provided valuable information.
6.2.3. First-Order CFA of Performance Dimensions (Measurement Performance Model Fit)
The initial model analysis that tested each performance dimension with its items showed an unacceptable overall fit. The study then dropped the questionnaire items that did not meet the standardised residuals and modification indices to attain a proper model fit.
6.2.4. Second-Order CFA of Performance Dimensions (Structural Performance Model Fit)
After finalising, the measurement component required no further deletion of performance items to attain the acceptability threshold. Table 3 presents the acceptable model fit comprising 19 performance items: six effectiveness items, six efficiency items, and seven reputation items.
Table 3.
Observable performance items contributing to sustainable economic performance dimensions.
Table 4 shows that all factor loadings were more than 0.7. The same conclusions as for Table 3 apply here. This meant that each survey question item (factor) provided sufficient explanation (variance) with respect to the intended construct dimension. The variance values are the squared value of the factor loading values. Because all factor loadings were more than 0.7, all the questionnaire items provided valuable information.
Table 4.
Structural-model fit: final run.
6.2.5. Structural Fit of the Overall Model
The revised model consisted of 38 items: 18 IC items and 20 performance items. The initial structural-fit run showed a mediocre AGFI score of 0.891 (below 0.9). However, a further review showed that the “union activity” item and the “commitment” item had high scores that led to the model misspecification; deleting these two items and re-running the model provided acceptable model-fit statistics. The final SEM model consisted of 36 items, with 16 IC items and 18 performance items.
6.2.6. Model Fit Residuals
The study also examined the model-fit residuals, but the final model specification remained the same. These findings showed that these data fit statistical grounds supported by acceptable model indices, as shown in Table 4.
Table 4 shows the acceptability benchmarks to compare with each index. A SEM model becomes fit when the data used to reproduce the model (variance–covariance matrix) are “fit”, or consistent with the proposed model. There are three ways of measuring the fit: absolute, incremental, and parsimonious. With each of these approaches, there are different indices that measure fit. The absolute measures include GFI (goodness-of-fit index), SRMSR (standardised root mean square residual), and RMSEA (root mean square error of approximation). The incremental measures include TLI (Tucker–Lewis index), CSI (comparative fit index), and AGFI (adjusted goodness-of-fit index). The parsimonious fit index includes NC (normed chi-square). All those indices generated using the data from the model were acceptable.
A reliability analysis of the overall structural model showed that Cronbach α coefficient scores exceeded 0.70, pointing to a high consistency of the final items selected from the survey questionnaire that were included in the model [30]. Table 5 presents the Cronbach α coefficient for each construct dimension.
Table 5.
Coefficient α of the overall structural model.
6.3. Relationship between Intellectual Capital and Sustainable Economic Performance
The study also examined the relationships between the IC dimensions (human capital, external capital, and internal capital) and sustainable economic performance dimensions (effectiveness, efficiency, and reputation). The regression weights shown in Table 1 indicate that the relationships between observed variables and the two constructs are strong.
As shown in Figure 4, the SEM analysis results showed a positive and significant relationship between IC and sustainable economic performance (IC → performance) of 0.93 (χ2 = 1737.392, df = 524, p < 0.001). The findings supported the hypothesis and indicated that an increase of one standard deviation in IC value increased sustainable economic performance by 0.93.
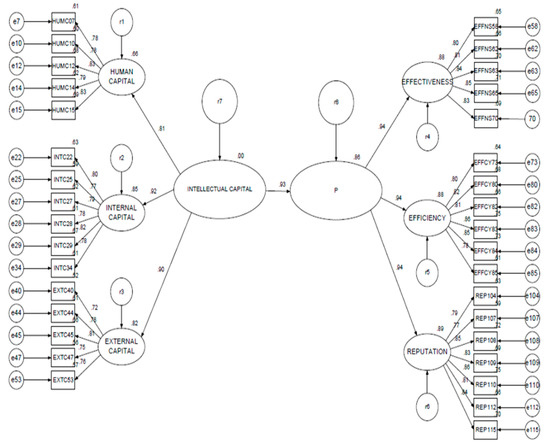
Figure 4.
Relationship between IC and sustainable economic performance. Abbreviations: IC, intellectual capital; P, sustainable economic performance.
From the perspective of public-sector decision-makers, such a positive impact of IC on sustainable economic performance signifies the importance of knowledge competencies to attain sustainable economic-performance matrices. For example, the squared multiple regressions value indicated that IC explained 86% of the variance of organisational sustainable economic performance (r = 0.86, p < 0.001).
By paying attention to observed variables with coefficients over 0.8, managers can improve management processes (INT22), benchmark activities for improvement (INT28), conduct activities that will enhance image among customers (EXT45), and look at ways of improving professionalism (HUMC15) and staff dedication (HUMC12). These can contribute to excellent sustainable economic performance.
The findings of this study reinforced the previous empirical findings that there was a positive relationship between IC constructs and IC dimensions [33]. The findings also were consistent with previous studies that examined the relationship between IC construct dimensions and organisational effectiveness in the public sector [53]. The findings supported the ICV theory by demonstrating that IC constructs can contribute to organisational value creation for sustainable performance [34].
7. Concluding Remarks
The findings showed that IC in the NPM context in Malaysia strongly facilitated sustainable economic performance. IC and sustainable economic performance had a strong correlation. The study empirically validated the relationship with items included in the construct dimensions. The study also theoretically validated the relationship of IC and sustainable performance with construct dimensions and constructs. This validation was obtained with 1092 public-sector decision-makers’ inputs using structural equation modelling. The model revealed that these decision-makers focus on specific items of intellectual capital and sustainable performance to strategically enable the strong relationship between them.
7.1. Implications of Findings
Managerial implications: the findings suggested that public-sector firms aiming to increase sustainable economic performance can focus their attention on IC strategically. The SEM analysis showed that managers selectively chose intellectual-capital items and sustainable economic-performance items for value creation. The original questionnaire examined 19 human capital items, 18 internal capital items, and 17 external capital items. The analysis revealed that managers selectively chose six human capital items, six internal capital items, and five external capital items that contribute to value creation (Table 2).
Value creation occurred in three dimensions: by improving effectiveness, efficiency, and reputation. The original survey questionnaire inquired into a value-creating proposition comprising 17 effectiveness items, 25 efficiency items, and 19 reputation items. However, the SEM analysis showed that managers strategically chose six effectiveness items, six efficiency items, and seven reputation items to focus on value creation (Table 3). The inter-correlations of items found through the SEM analysis indicated that managers wished to focus on all their chosen items in order to create firm value with the selected intellectual-capital resource items.
Research implications: this study contributes to filling the empirical vacuum by conducting field-based research to understand the role of IC for those with resource-related decision-making authority. The findings fulfill a call for scholars to develop deeper field-based understanding of the public sector [1,2]. This research also contributes to empirically validating the conceptual constructs using observed variables. Finally, the SEM findings contribute to raising IC research from operational understandings to the analysis of latent constructs that can help to evaluate sustainable economic performance in the public sector.
Malaysian public-sector executives place a high level of importance on knowledge resources and staff competencies. This is indicative of the public-sector focus on sustainable economic-performance constructs, and contributes to enriching the ICV theory [14]. The squared multiple regressions value of 0.86 highlighted that IC as knowledge competencies is a pivotal contributor to sustainable economic-performance matrices.
Researchers have found that IC statements enable public-sector firms to perform like businesses [9]. These findings were also consistent with earlier studies on private firms [30,31,35,54], which established a positive relationship within private firms between various IC dimensions and organisations’ financial performances. Overall, the findings of this study were consistent with these earlier findings focused on the private sector. The results confirmed that public-sector managers take a business-like attitude in the context of NPM towards developing, maintaining, and deploying IC to support organisational performance in becoming more efficient, effective, and reputable. The public sector takes a longer-time horizon view, as found here with sustainable economic-performance measures.
7.2. Limitations and Future Research
The study collected and analysed data from public-sector officials in decision-making positions, capturing their perspectives as data through a survey questionnaire. These perspectives can change over time due to social, political, and economic factors affecting the public-policy sphere. This research must be replicated for updates to respond to evolving national situations. Additionally, the data relates to the Malaysian public sector in the NPM context. On the one hand, the NPM context facilitates generalising findings. On the other, each country has its own political, social, cultural, and economic forces that shape the public sector. Research has found four factors influencing NPM reforms in the Western countries: macroeconomics, political party ideologies, political systems, and national traditions concerning the embrace of a market economic system [23]. The factors influencing NPM reforms in Asian countries are rather unique. Many Asian countries undertake NPM reforms with an aim of supporting economic development. Each country is different in its governance model, level of financial conservatism as to whether they spend within their means, and level of government intervention in market behaviour. Understanding the characteristics of a political regime in an Asian country help to clarify the context and importance placed on NPM reform [55]. These different national contexts offer a fruitful future research proposition for examining the theoretical relationship between IC and sustainable economic performance within NPM.
Although this research selected specific dimensions to represent the constructs, other conceptual dimensions could have better contextual representation in different geographical locations [56,57]. Since the results relied on respondents’ self-reports, this study is subject to the criticisms levelled at all self-report scales [25]. These limitations provide opportunities for future studies. Future research can also examine whether public sector officers place equal importance on all immutable resources for sustainability performance, combining economic, social, and environmental performance.
Future research can conduct a longitudinal study to appreciate the crucial interventions of the association between IC and sustainable economic performance. Another research proposition is to complete an international survey that compares and contrasts various scenarios. One scenario is the maturity of the adoption of NPM in a country and its influence on the studied association. Hofstede has shown countries are culturally different [58]. These differences can have implications for the associations found by this research in Malaysia. Sustainability has gained more momentum by bringing the public sector to the fore. There are accounting and auditing guidelines already in place to facilitate sustainable performance. Data has become a key asset in the digital economy, and an increasingly crucial IC item for value creation in the public sector. Access to large amounts of data has dramatically enhanced the human-capital dimension, increasing staff capacity and performance capability [59]. Future research can examine the possibility of enabling IC with big data to strengthen sustainable economic performance in the public sector.
Author Contributions
Both authors contributed to this article’s development, specifically through conceptualising, theorising, developing methodology, and data analysis. K.K. collected research data in the field. I.A. wrote the article. Both authors have read and agreed to the published version of the manuscript.
Funding
This research received no external funding.
Institutional Review Board Statement
This research was approved by the Human Research Ethics Committee at the University of Wollongong, Australia (HE09/399).
Informed Consent Statement
Participants provided informed consent for this research.
Data Availability Statement
The data presented in this study are currently available upon request from the corresponding author.
Conflicts of Interest
The authors declare no conflict of interest.
References
- Guthrie, J.; Dumay, J. New frontiers in the use of intellectual capital in the public sector. J. Intellect. Cap. 2015, 16, 258–266. [Google Scholar] [CrossRef]
- Guthrie, J.; Ricceri, F.; Dumay, J. Reflections and projections: A decade of intellectual capital accounting research. Br. Account. Rev. 2012, 44, 68–82. [Google Scholar] [CrossRef]
- Cuganesan, S.; Dunford, R.; Palmer, I. Strategic management accounting and strategy practices within a public sector agency. Manag. Account. Res. 2012, 23, 245–260. [Google Scholar] [CrossRef]
- Horton, S. New Public Management: Its Impact on Public Servant’s Identity: An Introduction to this Symposium. Int. J. Public Serv. Manag. 2016, 19, 533–542. [Google Scholar] [CrossRef]
- Alford, J.; Douglas, S.; Geuijen, K.; Hart, P. Ventures in public value management: Introduction to the symposium. Public Manag. Rev. 2017, 19, 589–604. [Google Scholar] [CrossRef] [Green Version]
- Jorgensen, B.T.; Sorensen, D. Codes of Good Governance: National or Global Values? Public Integr. 2013, 15, 71–96. [Google Scholar] [CrossRef]
- De Graaf, G.; Huberts, L.; Smulders, R. Coping with Public Value Conflicts. Adm. Soc. 2014, 1–27. [Google Scholar] [CrossRef] [Green Version]
- Bryson, J.M.; Crosby, B.C.; Bloomberg, L. Public Value Governance: Moving beyond Traditional Public Administration and the New Public Management. Public Adm. Rev. 2014, 74, 445–456. [Google Scholar] [CrossRef]
- Mouritsen, J.; Thorbjørnsen, S.; Bukh, P.N.; Johansen, M.R. Intellectual capital and new public management: Reintroducing enterprise. Learn. Organ. 2004, 11, 380–392. [Google Scholar] [CrossRef] [Green Version]
- Colyvas, J.A.; Powell, W.W. Roads to institutionalization: The remaking of boundaries between public and private science. Res. Organ. Behav. 2006, 27, 305–353. [Google Scholar] [CrossRef]
- Ruiqi, Z.; Adrian, P. Using SERVQUAL to measure the service quality of travel agents in Guangzhou, South China. J. Serv. Res. 2009, 9, 87–107. [Google Scholar]
- Verma, T.; Dhari, S. The impact of intellectual capital on organisational effectiveness: A comparative study of public and private sectors in India. JUP J. Knowl. Manag. 2016, 14, 7–27. [Google Scholar]
- Abu Shah, I. Innovations in governance and the public service to achieve a harmonious society: The Malaysian perspective. In Proceedings of the Network of Asia-Pacific Schools and Institutes of Public Administration and Governance (NAPSIPAG) Annual Conference, Beijing, China, 5–7 December 2005. [Google Scholar]
- Yong, J.I.; Yusliza, M.-Y.; Ramayah, T.; Fawehinmi, O. Nexus between green intellectual capital and green human resource management. J. Clean. Prod. 2019, 215, 364–374. [Google Scholar] [CrossRef]
- Reiter, R.; Klenk, T. The manifold meanings of ‘post-New Public Management’—A systematic literature review. Int. Rev. Adm. Sci. 2019, 85, 11–27. [Google Scholar] [CrossRef]
- Hambrick, D.C.; Mason, P.A. Upper Echelons: The Organization as a Reflection of Top Managers. Acad. Manag. Rev. 1984, 9, 193–206. [Google Scholar] [CrossRef] [Green Version]
- Hambrick, D.C. Editor’s Forum. Upper Echolons Theory: An Update. Acad. Manag. Rev. 2021, 32, 334–343. [Google Scholar] [CrossRef]
- Ali, A.R.H.; Zain, M.M.; Abidin, Z.Z.; Embi, R. The level of knowledge of corporate governance in federal statutory bodies in Malaysia. Procedia Econ. Financ. 2015, 28, 170–175. [Google Scholar] [CrossRef]
- Schneider, A.; Samkin, G. Intellectual capital reporting by the New Zealand local government sector. J. Intellect. Cap. 2008, 9, 456–486. [Google Scholar] [CrossRef] [Green Version]
- Noruddin, K. Privatisation. In Reengineering the Public Service: Leadership and Change in an Electronic Age; Abdul Karim, M.A., Ed.; Pelanduk Publications: Subang Jaya, Malaysia, 1999; pp. 293–316. [Google Scholar]
- Triantafillou, P. Machinating the responsive bureaucrat: Excellent work culture in the Malaysian public sector. Asian J. Public Adm. 2002, 24, 185–209. [Google Scholar] [CrossRef]
- Khalid, S.N.A. New Public Management in Malaysia: In search of an efficient and effective service delivery. Int. J. Manag. Syst. 2008, 15, 69–90. [Google Scholar]
- Green-Pedersen, C. New Public Management Reforms of the Danish and Swedish Welfare States: The Role of Different Social Democratic Responses. Governance 2002, 15, 271–294. [Google Scholar] [CrossRef] [Green Version]
- Nordea. Malaysia: Economic and Political Overview. The Economic Context of Malaysia. c2016–2020 [Cited 4 October 2020]. 2016. Available online: https://www.nordeatrade.com/fi/explore-new-market/malaysia/economical-context (accessed on 14 June 2021).
- Spector, P.E. Using self-report questionnaires in OB research: A comment on the use of a controversial method. J. Organ. Behav. 1994, 15, 385–392. [Google Scholar] [CrossRef]
- Figlio, D.N.; Kenny, L.W. Public sector performance measurement and stakeholder support. J. Public Econ. 2009, 93, 1069–1077. [Google Scholar] [CrossRef]
- Luoma-aho, V.; Canel, M.-J. Public Sector Reputation; Sage Publications: Thousand Oaks, CA, USA, 2016; pp. 597–600, c2016–2021; [Cited 4 March 2021]; Available online: https://pdfs.semanticscholar.org/7baf/2d3fadc8239afa82de4d99b8764b23c881aa.pdf (accessed on 14 June 2021).
- Bontis, N.; Keow, W.C.C.; Richardson, S. Intellectual capital and business performance in Malaysian industries. J. Intellect. Cap. 2000, 1, 85–100. [Google Scholar] [CrossRef] [Green Version]
- Bryson, J.M.; Ackermann, F.; Eden, C. Putting the resource-based view of strategy and distinctive competencies to work in public organisations. Public Adm. Rev. 2007, 67, 702–717. [Google Scholar] [CrossRef]
- Pallant, J. SPSS Survival Manual: A Step by Step Guide to Data Analysis Using SPSS (Version 15); Open University Press: London, UK, 2007. [Google Scholar]
- Waterman, R.; Peters, T.; Phillips, J. Structure is not organisation. Bus. Horiz. 1980, 23, 14–26. [Google Scholar] [CrossRef]
- Hair, J.H.J.; Anderson, R.E.; Tatham, R.L.; Black, W.C. Multivariate Data Analysis; Prentice Hall: Saddle River, NJ, USA, 1995. [Google Scholar]
- Farah, A.; Abouzeid, S. The impact of intellectual capital on performance: Evidence from the public sector. Knowl. Manag. E-Learn. 2017, 9, 225–238. [Google Scholar] [CrossRef]
- Youndt, M.A.; Subramaniam, M.; Snell, S.A. Intellectual capital profiles: An examination of investments and returns. J. Manag. Stud. 2004, 41, 335–362. [Google Scholar] [CrossRef]
- Carmeli, A.C.; Tishler, A. The relationships between intangible organisational elements and organisational performance. Strateg. Manag. J. 2004, 25, 1257–1278. [Google Scholar] [CrossRef] [Green Version]
- Stiles, P.; Kulvisaechana, S. Human Capital and Performance in Public Sector; Judge Institute of Management, University of Cambridge: Cambridge, UK, 2004. [Google Scholar]
- Kamukama, N.; Ahiazu, A.; Ntyai, J.M. Intellectual capital and performance: Testing interaction effects. J. Intellect. Cap. 2010, 11, 554–574. [Google Scholar] [CrossRef]
- Mihret, D.G.; Yismaw, A.W. Internal audit effectiveness: An Ethiopian public sector case study. Manag. Audit. J. 2007, 22, 470–484. [Google Scholar] [CrossRef] [Green Version]
- Morgan, D.L.; Krueger, R.A. The Focus Group Kit; Sage Publications: Thousand Oaks, CA, USA, 1998. [Google Scholar]
- Andreou, A.N.; Green, A.; Stankosky, M. A framework of intangible valuation areas and antecedents. J. Intellect. Cap. 2007, 8, 52–75. [Google Scholar] [CrossRef]
- Coy, D.; Dixon, K. The public accountability index: Crafting a parametric disclosure index for annual reports. Br. Account. Rev. 2004, 36, 79–106. [Google Scholar] [CrossRef]
- Xavier, J.A.; Siddiquee, N.A.; Mohamed, M.Z. The Government Transformation Programme of Malaysia: A successful approach to public service reform. Public Money Manag. 2016, 36, 81–87. [Google Scholar] [CrossRef]
- Halachmi, A. Service Quality in the Public Sector: An International Symposium. Public Product. Manag. Rev. 1997, 21, 7–12. [Google Scholar]
- Fombrun, C.J.; Gardberg, N.A.; Sever, J.M. The Reputation QuotientSM: A multi-stakeholder measure of corporate reputation. J. Brand Manag. 2000, 7, 241–255. [Google Scholar] [CrossRef]
- Zikmund, W.G.; Babin, B.J.; Carr, J.C.; Griffin, M. Business Research Methods; Thomson/South-Western: Thousand Oaks, CA, USA, 2010. [Google Scholar]
- Siddiquee, N.A.; Xavier, J.A.; Mohamed, M.H. What works and why? Lessons from public management reform in Malaysia. Int. J. Public Adm. 2019, 42, 14–27. [Google Scholar] [CrossRef]
- Moshagen, M. The Model Size Effect in SEM: Inflated Goodness-of-Fit Statistics are due to size of Covariance Matrix. Struct. Equ. Model. A Multidiscip. J. 2012, 19, 86–98. [Google Scholar] [CrossRef]
- Bollen, B.M. Strcutural Equation Modelling with Latent Variables; Wiley: New York, NY, USA, 1989. [Google Scholar]
- Loelin, J.C. Latent Variables Models: An Introduction to Factor, Path, and Structural Analysis; Erlbaum: Hillsdale, NJ, USA, 1987. [Google Scholar]
- WallStreetMojo. Covariance vs. Correlation. Available online: https://www.wallstreetmojo.com/correlation-vs-covariance/ (accessed on 10 July 2021).
- Bentler, P.; Bagozzi, R.; Cudeck, R. SEM Using Correlation or Covariance Matrices. J. Consum. Psychol. 2001, 10, 85–87. [Google Scholar]
- Byrne, B.M. Structural Equation Modeling with AMOS: Basic Concepts, Applications, and Programming; Lawrence Erlbaum Associates Publishers: Mahway, NJ, USA, 2010. [Google Scholar]
- Wang, W.-Y.; Chang, C. Intellectual capital and performance in causal models: Evidence from the information technology industry in Taiwan. J. Intellect. Cap. 2005, 6, 222–236. [Google Scholar] [CrossRef] [Green Version]
- Kline, R.B. Principles and Practices of Structural Equation Modelling; Guilford: New York, NY, USA, 1998. [Google Scholar]
- Lee, E.W.Y.; Haque, M.S. Governance in Asian NICs: A comparison of Hong Kong and Singapore. Gov. Int. J. Policy Adm. Inst. 2006, 19, 605–626. [Google Scholar] [CrossRef]
- Firer, S.; Williams, S.M. Intellectual capital and traditional measures of corporate performance. J. Intellect. Cap. 2003, 4, 348–360. [Google Scholar] [CrossRef]
- Goh, P.C. Intellectual capital performance of commercial banks in Malaysia. J. Intellect. Cap. 2005, 6, 385–396. [Google Scholar] [CrossRef]
- Hostede, G. Dimensionalizing Cultures: The Hostede Model in Context. Online Readings on Psychology and Culture. Unit 2, 2011, 3, Article 6. Available online: http://mchmielecki.pbworks.com/w/file/fetch/64591689/hofstede_dobre.pdf (accessed on 14 June 2021).
- Abeysekera, I. Intellectual Capital and Knowledge Management Research towards Value Creation. From the Past to the Future. J. Risk Financ. Manag. 2021, 14, 238. [Google Scholar] [CrossRef]
Publisher’s Note: MDPI stays neutral with regard to jurisdictional claims in published maps and institutional affiliations. |
© 2021 by the authors. Licensee MDPI, Basel, Switzerland. This article is an open access article distributed under the terms and conditions of the Creative Commons Attribution (CC BY) license (https://creativecommons.org/licenses/by/4.0/).