Article

Present and Future Energy Poverty, a Holistic Approach: A Case Study in Seville, Spain

by
Mª Desirée Alba-Rodríguez
1,
Carlos Rubio-Bellido
1,*,
Mónica Tristancho-Carvajal
1,
Raúl Castaño-Rosa
2,3 and
Madelyn Marrero
1
1
Department of Building Construction II, School of Building Engineering, University of Seville, 41012 Seville, Spain
2
School of Architecture, Faculty of Built Environment, Tampere University, 33720 Tampere, Finland
3
Department of Electrical Engineering, University Carlos III of Madrid, 28911 Leganés, Spain;
*
Author to whom correspondence should be addressed.
Sustainability 2021, 13(14), 7866; https://doi.org/10.3390/su13147866
Submission received: 25 May 2021 / Revised: 8 July 2021 / Accepted: 9 July 2021 / Published: 14 July 2021

Abstract

:
Energy poverty is a social problem that is accentuated in a climate change future scenario where families become increasingly vulnerable. This problem has been studied in cold weather, but it also takes place in warm climates such as those of Mediterranean countries, and it has not been widely targeted. In these countries, approximately 70% of its building stock was built during 1960–1980, its renovation being an opportunity to reduce its energy demand, improve tenants’ quality of life, and make it more resilient to climate change. In the retrofitting process, it is also important to consider tenants’ adaptability and regional scenarios. In this sense, the present work proposes an assessment model of retrofitting projects that takes into consideration energy consumption, comfort, tenants’ health, and monetary poverty. For this, the Index of Vulnerable Homes was implemented in this research to consider adaptive comfort in the energy calculation as well as the adaptability to climate change. A case study of 40 social housings in Seville, Spain, was analyzed in 2050 and 2080 future scenarios, defining the impact in energy poverty of the building retrofitting projects.

1. Introduction

In 2010, 32% of global primary energy was employed in buildings, which produced 19% of global emissions, as summarized in the Fifth Assessment Report (AR5) of the United Nations Intergovernmental Panel on Climate Change (IPCC) [1]. In order to reduce emissions and, consequently, stop the temperature increase and mitigate the effects of climate change, a series of agreements have been established at a European level, starting with the new European directive on the energy efficiency of buildings, which toughens its objectives in search of eliminating the use of fossil fuels in the real estate stock before 2050 [2], continuing with the agreement of the Climate and Energy Package 2020 to guarantee that the EU achieves the climate objectives of 2020 [3] and then extends them until 2030 [4], and ending with the European Green Deal [5], a continental tool to combat climate change that aims to make Europe the first climate-neutral continent by 2050.
In European countries with a Mediterranean climate, such as Spain, Greece, and Portugal, with a high percentage of aging existing buildings, built between the 1960s and 1980s [6], the renovation of buildings is a key factor in reducing the environmental and social impact of the housing and in the achievement of the global objective of mitigation of climate change. The mildness of winters in Mediterranean climate areas has resulted in existing homes being energy inefficient and excessively cold, making it very expensive to achieve thermal comfort inside homes. In the same way, the harshness of summers requires that the air conditioners be kept connected for a high number of hours a day, and thus in the Mediterranean climate, the use of refrigeration devices becomes a necessity to achieve adequate comfort inside the houses. This problem is exacerbated in the future projection of climate change, where temperatures will presumably increase, and this will affect more seriously the situations of energy poverty (EP) to which families may be exposed. The energy rehabilitation of existing buildings positively affects both environmental aspects, through the reduction of emissions and energy consumption, and socio-economic aspects, with the savings achieved in the National Health Service (NHS), highly related to energy poverty [7,8,9].
Although the relationship amongst health, EP, cold homes, and overheating risk has been analyzed in many studies [10,11], it remains difficult to identify the direct impact due to the multidimensional aspects of EP. The effectiveness of current EP indicators is limited, and it is therefore necessary to combine various indicators and to analyze their results together [12].
In the case of Spain, in 2002, the Energy Performance of Buildings Directive (EPBD) [13] was applied in the Building Technical Code (CTE) [14] and in the regulations of thermal installations in buildings (RITE) [15]. More recently, the directive 2018/844 [2] established new energy efficiency targets for 2050, encouraging the energy renovation of existing buildings. This led to a modification of the Basic Document “DB HE Energy Saving” [16]. In the current legislation, which establishes a maximum limit of thermal transmittance to the building envelope elements, the values are becoming increasingly restrictive for winter climatic severity; however, this increase in the restriction does not apply to summer. Moreover, thermal comfort is based on Fanger’s thermal model, which presents upper and lower limits with a narrow range, and thus these thermal comfort limits show a static behavior. This supposes overlooking external climate conditions and high levels of energy consumption.
In this sense, international adaptive comfort standards EN 16798-1:2019 [17] and ASHRAE 55-2017 [18] as well as research works studying thermal comfort with field methods in actual buildings based on adaptive thermal comfort [19,20] set an alternative to consider in this research. In addition, various studies gather the potential use of mixed-mode natural ventilation of buildings as an effective strategy to reduce energy consumption [21,22] and fuel poverty [23].
In the present work, an implementation of the Index of Vulnerable Homes (IVH) assesses the vulnerability to EP (pre- and post-intervention) in a housing project in Spain. The implemented IVH adds the evaluation of energy consumption considering mixed-mode and adaptive comfort as well as the future climate change scenarios to the robust indicator, which considered monetary poverty, comfort, and health of tenants. A representative social housing project in Andalusia, Spain is analyzed, which is formed by 40 dwellings of a multifamily building. The main objective is to be able to predict the impact of the renovation projects in the present and future vulnerability to EP. The objective also includes the IVH improvements, that is, the quantification of the energy consumption using an adaptive comfort control system, considering also the climate change predictions for 2050 and 2080.

2. Methodology

EP is commonly defined as the inability of a home to satisfy a minimum quantity of energy for its basic needs, such as keeping the home temperature in a range suitable for its health [12]. This problem has generated interest among the countries, standing out are France, Italy, United Kingdom, Austria, Ireland, and Slovakia [24]. In general, the European Commission (EC) uses three basic criteria to assess EP: the inability to keep the houses adequately conditioned, the delay in the payment of utility bills, and inhabiting unhealthy homes. The EP concept has been evolving to include the deprivation of hot water, lighting, and other domestic needs [25].
Castaño-Rosa et al. [12] reviewed the indicators used to analyze EP and grouped them into two categories: based on household income and expenses and on household perception by surveys. In addition, they identified indicators that analyze, in a broader sense, the most vulnerable consumers through econometric analyses [26,27], identifying overcrowded homes [28,29], measuring thermal comfort [30,31,32], and analyses based on the energy efficiency of buildings [33,34].
The objective of the work resides in the implementation of the Vulnerable Household Index (IVH) as a comprehensive model of EP assessment. The need for this implementation is because the indices and social parameters required for the analysis of the problem are scattered, and thus it is very complex to carry out a holistic assessment of the problem. In addition, current indicators do not include in the analysis future climate change scenarios, and there is a need to approach the issue from an integrative point of view. Climate change has been analyzed in many economic sectors, especially in construction, which represents approximately 40% of energy consumption by human activities [35]. For this reason, the holistic analysis of energy management is key to guaranteeing minimum conditions of habitability in homes. This makes climate change, together with adaptive comfort, the focus of attention for governments and researchers, generating numerous studies based on the analysis of the adaptive control of thermal comfort for the prediction of consumption in homes. [21,36,37]. The proposed model, in addition to integrating social factors, such as the occupants’ health and economic analysis of households [38,39], is capable of integrating energy efficiency factors and their future forecast. As a novelty in this work, climatic adaptability is also included in the model to better predict consumption and comfort levels with respect to habitability conditions.

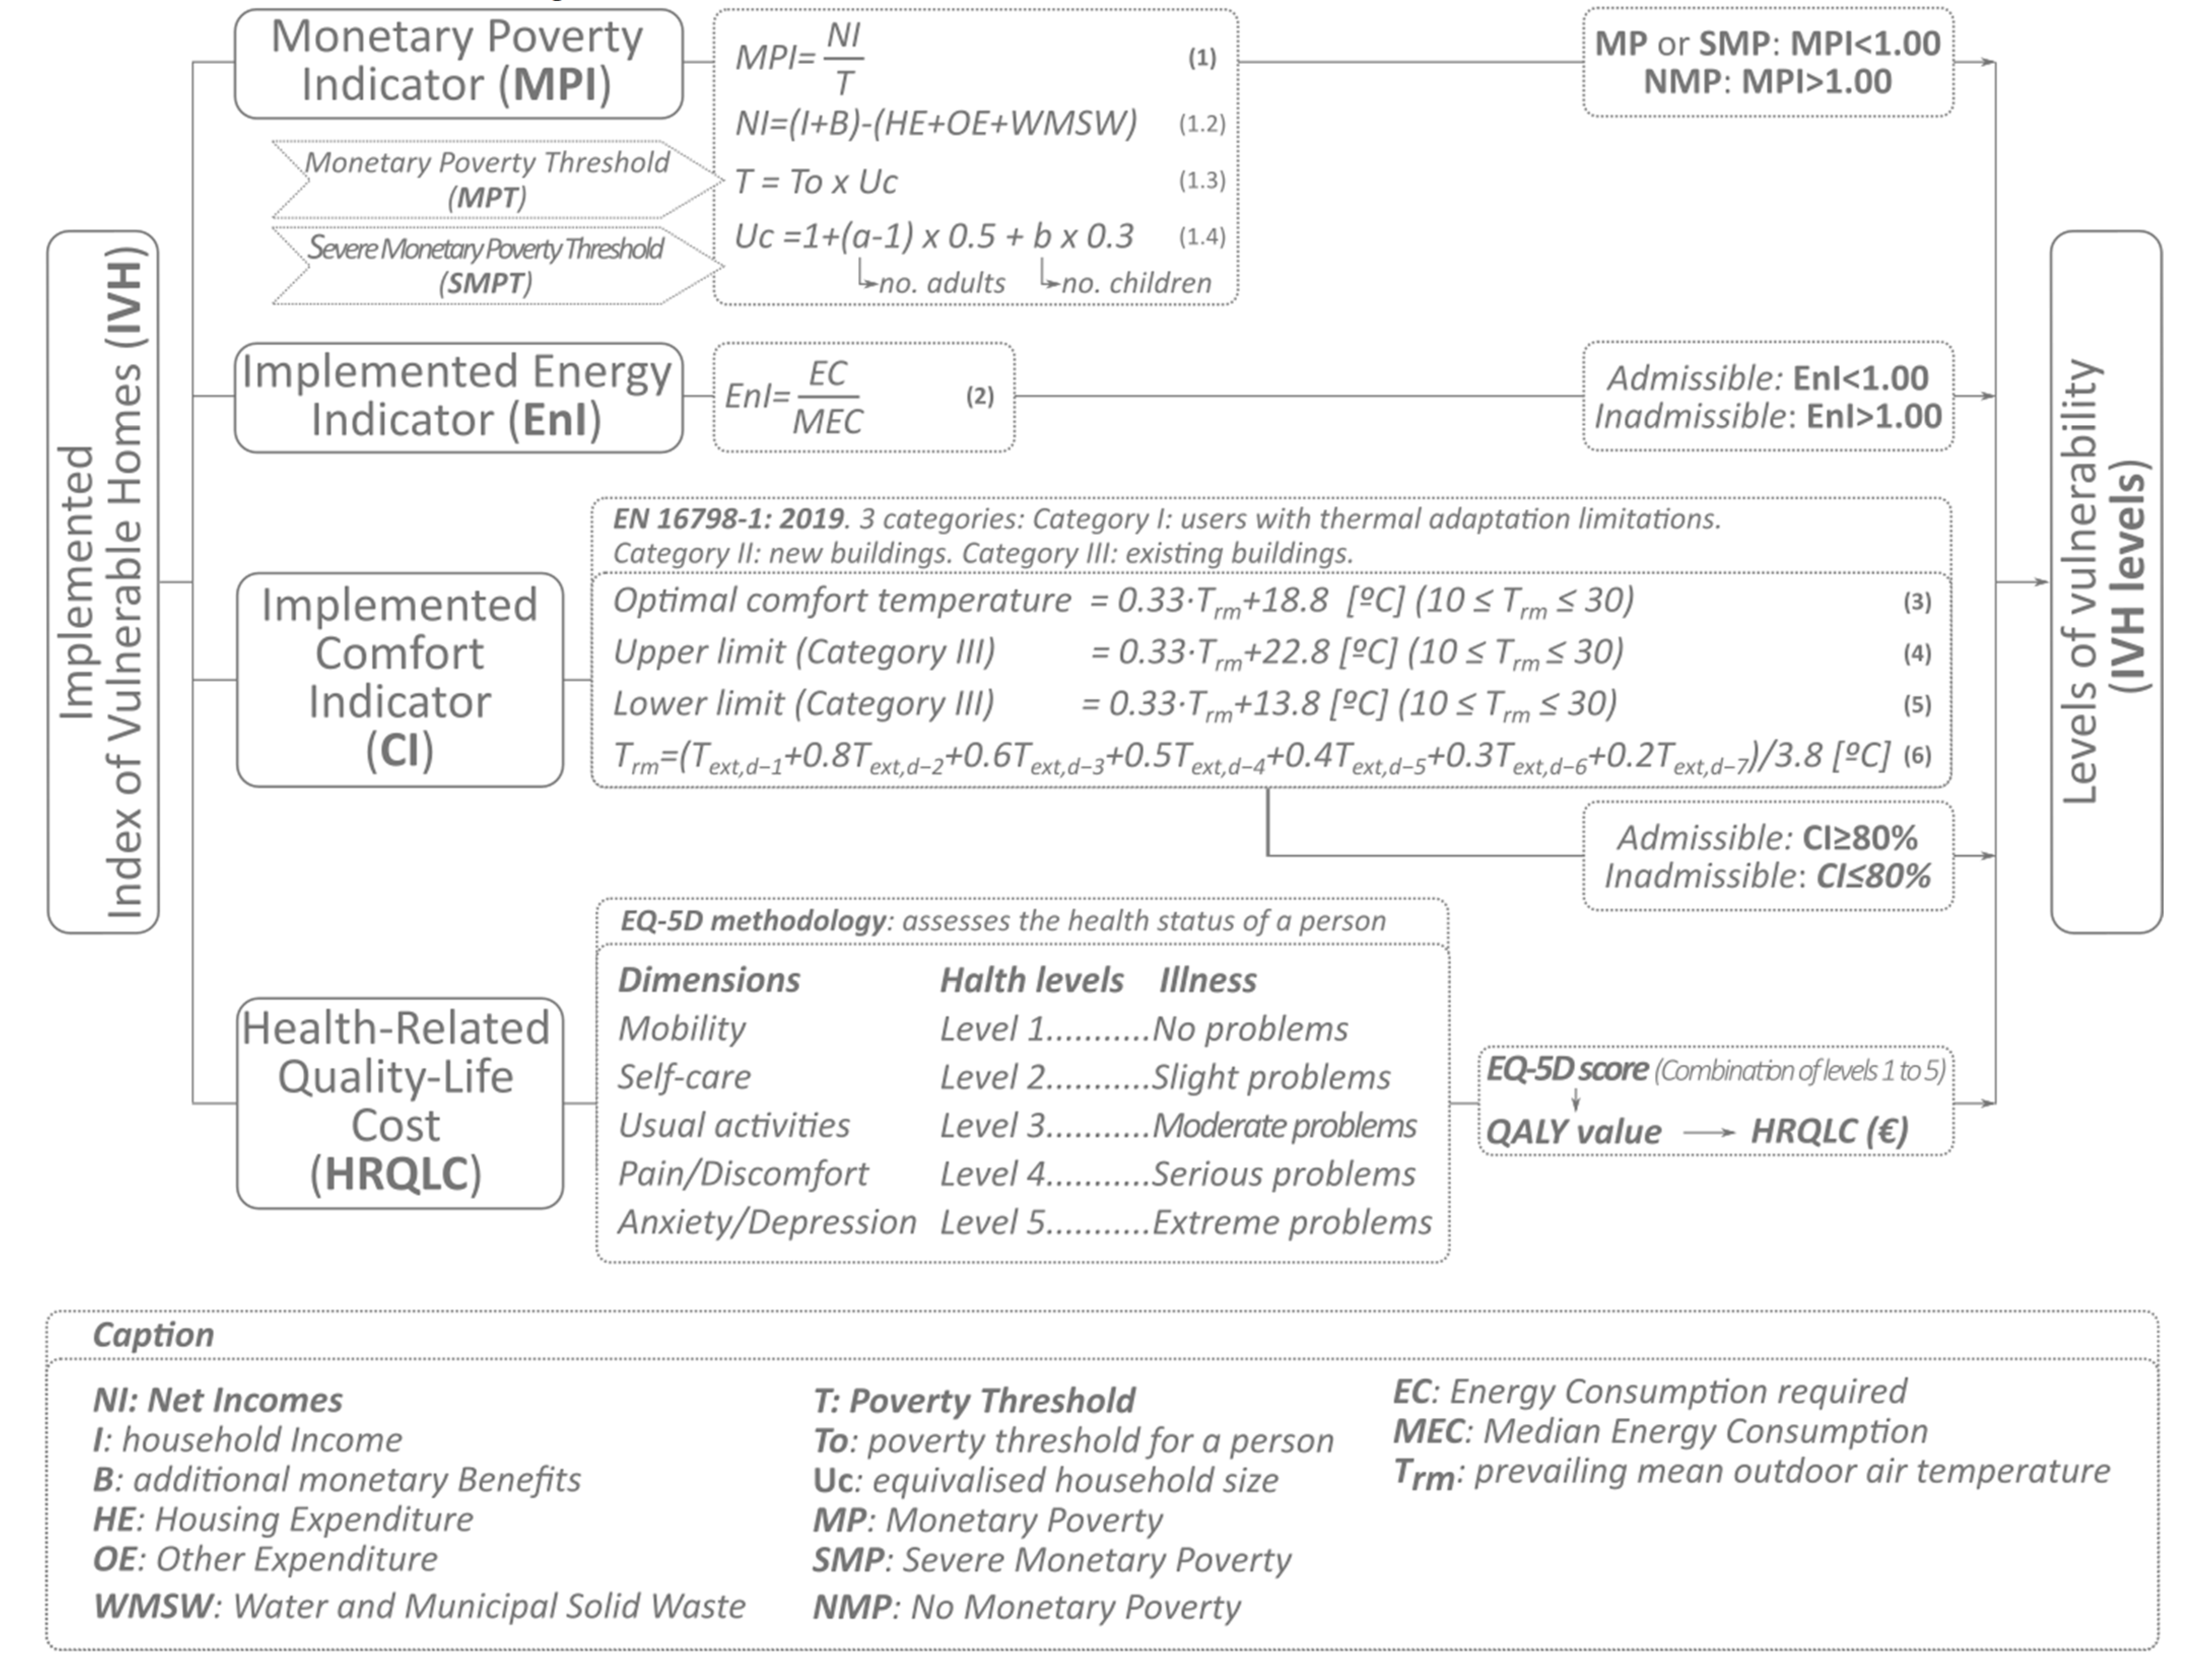
2.1. Index of Vulnerable Homes

The Index of Vulnerable Homes (IVH) analyses the vulnerability situation of families in relation to the consequences, as well as the possibility of evaluating the energy retrofitting impact in order to improve their life quality. The IVH identifies different situations of vulnerability to EP [12,38,40], becoming a comprehensive measure to better understand EP at the local scale. In its latest application, six buildings located in Seville are analyzed. The index estimates the cost of the National Health Service associated with EP, as well as the corresponding savings after the building renovation project [38]. Additionally, the IVH has been adapted and applied to the British context [39]. The index is formed by four components: Monetary Poverty Indicator (MPI), Energy Indicator (EnI), Comfort Indicator (CI), and Health-Related Quality-Life Cost (HRQLC) (Figure 1).

2.1.1. Monetary Poverty Indicator (MPI)

The monetary vulnerability of the household is analyzed by combining regionally specific indicators, the Monetary Poverty Threshold (MPT) and the Severe Monetary Poverty Threshold (SMPT). The MPT is obtained by extracting 60% of the average operating income of the area under study. In this work, Seville, Spain, is analyzed using Eurostat [41] statistics. The SMTP defines extreme poverty and corresponds to the lowest extraordinary unemployment benefit granted by the Spanish State, called active insertion income [42]. Then it relates the net income to the poverty threshold. A household is in monetary poverty or severe monetary poverty when MPI < 1.00. The calculation procedure is summarized in Figure 1 (Equations (1), (1.1), (1.2), (1.3) and (1.4) of Figure 1).

2.1.2. Implemented Energy Indicator (EnI)

The required energy consumption (EC) of a household is compared to the energy threshold set for the neighborhood (Equation (2), Figure 1) and is obtained according to EN 16798-1:2019 [17] and the works of Sánchez-García et al. [36]; MEC is the median energy consumption required for the type of building in the area of study [43]. Therefore, the housing energy consumption is admissible if it is below the energy threshold, or EnI < 1.00.

2.1.3. Implemented Comfort Indicator (CI)

The adaptive thermal comfort model used in the present work considers that if the relationship between the exterior temperature and the interior temperature remains within the established comfort range, the occupants will be in a comfortable situation. IC determines the percentage of hours that the temperature is outside the established comfort range. The comfort threshold is set at 80% because the remaining 20% are considered part of the sleeping hours. This means that the occupants of a home can be thermally uncomfortable for 5 h a day, coinciding with the hours of sleep [44]. To obtain hourly temperatures, advanced dynamic simulations were performed using hourly climate data files in the case study model. Finally, when the hours considered within thermal comfort are in a percentage equal to or greater than 80%, it is established that IC is admissible (IC ≥ 80%) (Figure 1).
The EN 16798-1: 2019 standard [17] establishes four categories of comfort temperature range, according to the expectations of the occupants and the age of the building. Due to the type of building under study in this work (existing residential building), category III is considered for the calculation of the limits of the range of thermal comfort.
As can be seen from the explanation developed in the previous paragraphs, the IVH is a model based on the calculation of four indicators. MPI is obtained from the family-specific economic situation, and the comfort and energy indicators are obtained from software modeling. The ones obtained from simulations are not subjected to the tenant’s perceptions or actual consumptions. With this new approach, based on the use of adaptive comfort models, it is intended to reduce subjectivity when analyzing EP, using more objective data, which allows opening a new line of research of the EP indicators used so far.

2.1.4. Health-Related Quality-Life Cost (HRQLC)

This health-related cost is defined by the Quality-Adjusted Life Year (QALY), equivalized to each level of vulnerability of the IVH (Figure 1). The Spanish National Health Service cost of maintaining a person in good health for a year is EUR 30,000 [45]. The calculation process is explained in detail in Castaño et al. [39].
Table 1 shows the result of the QALYs which depends on the dimensions levels from 1 to 5, 5 being the worst. The example combination 12333, defined in Table 1, is input into the EQ-5 D-5 L Index Value Calculator [46], and its corresponding QALY is obtained. The HRQLC (EUR) is the monetary value assigned to that QALY and is obtained by applying the QALY to the cost of the Spanish NHS to keep a person in good health for one year (EUR 30,000) (Figure 2).
In Figure 2, the QALY obtained in Table 1 corresponds to IVH´s level 6 where MPI is severe and EnI and CI are admissible. The subjective information obtained from surveys in Table 1 gave rise to a scale that is defined with objective data measured in terms of Enl, CI, and MPI. The equivalences are summarized in Figure 2.

2.2. Adaptive Comfort and Adaptive Energy Consumption Assessments for Implemented CI and Enl

As stated in the introduction section, energy modeling is usually based on static setpoint temperatures; it overestimates energy consumption because it does not take into consideration the adaptability of building users. The energy-saving prediction is not realistic enough to adequately determine the actions that have high impact on EP and climate change mitigation. The effect called meteorological memory, in which both the expectations of the occupants and their psychological adaptation to different temperatures intervene, is taken into account in the adaptive models [47]. Recently, it has been studied, in relation to PE, how this adaptive approach can influence the use of air-conditioning devices by occupants [37,48,49].
This is supported by the use of so-called daily setpoint temperatures, that is, the temperatures that achieve the highest percentage of acceptability to keep the interior at a set temperature within the daily adaptive comfort limits. If necessary, you can opt for a mixed solution, natural ventilation, when the outside temperature allows it, or use of air conditioning when the outside temperature is not favorable.
The adaptive approach, based on the use of adaptive setpoint temperatures, results in an adaptive energy demand, that is, energy necessary to maintain the interior thermal conditions of the home within the adaptive comfort range. This new definition of energy demand can influence the definition of PE since it allows adaptive comfort to be applied considering the influence of climate change [50,51].
The European standard EN 16798-1:2019 [17] establishes 3 categories according to users’ thermal adaptation capacity. More specifically, each category is defined for a type of building or user. Category I is applicable to users with thermal adaptation limitations (e.g., the elderly), category II to new buildings, and category III to existing buildings, the latter having a wider comfortable temperature range. For this research category III is used, in which the optimal thermal comfort temperature (Equation (3) Figure 1) oscillates between the upper and lower limits (Equations (4) and (5), Figure 1). The limits correspond to linear regressions according to the prevailing mean outdoor air temperature T r m (Equation (6), Figure 1). T r m is determined by the weighted average of daily external temperatures; it is useful to determine the values of upper and lower limits and to control whether the adaptive thermal comfort model could be applied. For this purpose, many models establish a range of values among which T r m should oscillate to apply the adaptive model. According to EN 16798-1:2019 [17], T r m should oscillate 10 and 30 °C. These are the thresholds that are applied to the implemented comfort indicator (CI) (Figure 1).
For the quantification of the energy consumption considering adaptive comfort, a combination of setpoint temperatures is considered (Table 2). That is, in the case of T r m below 10 °C or above 30 °C static temperatures are set according to EN 16798-1:2019 [17] for category III. This algorithm is introduced in the dynamic simulations for the implementation of energy indicator (EnI).

2.3. Present and Future Scenarios Simulations Considering Global Warming
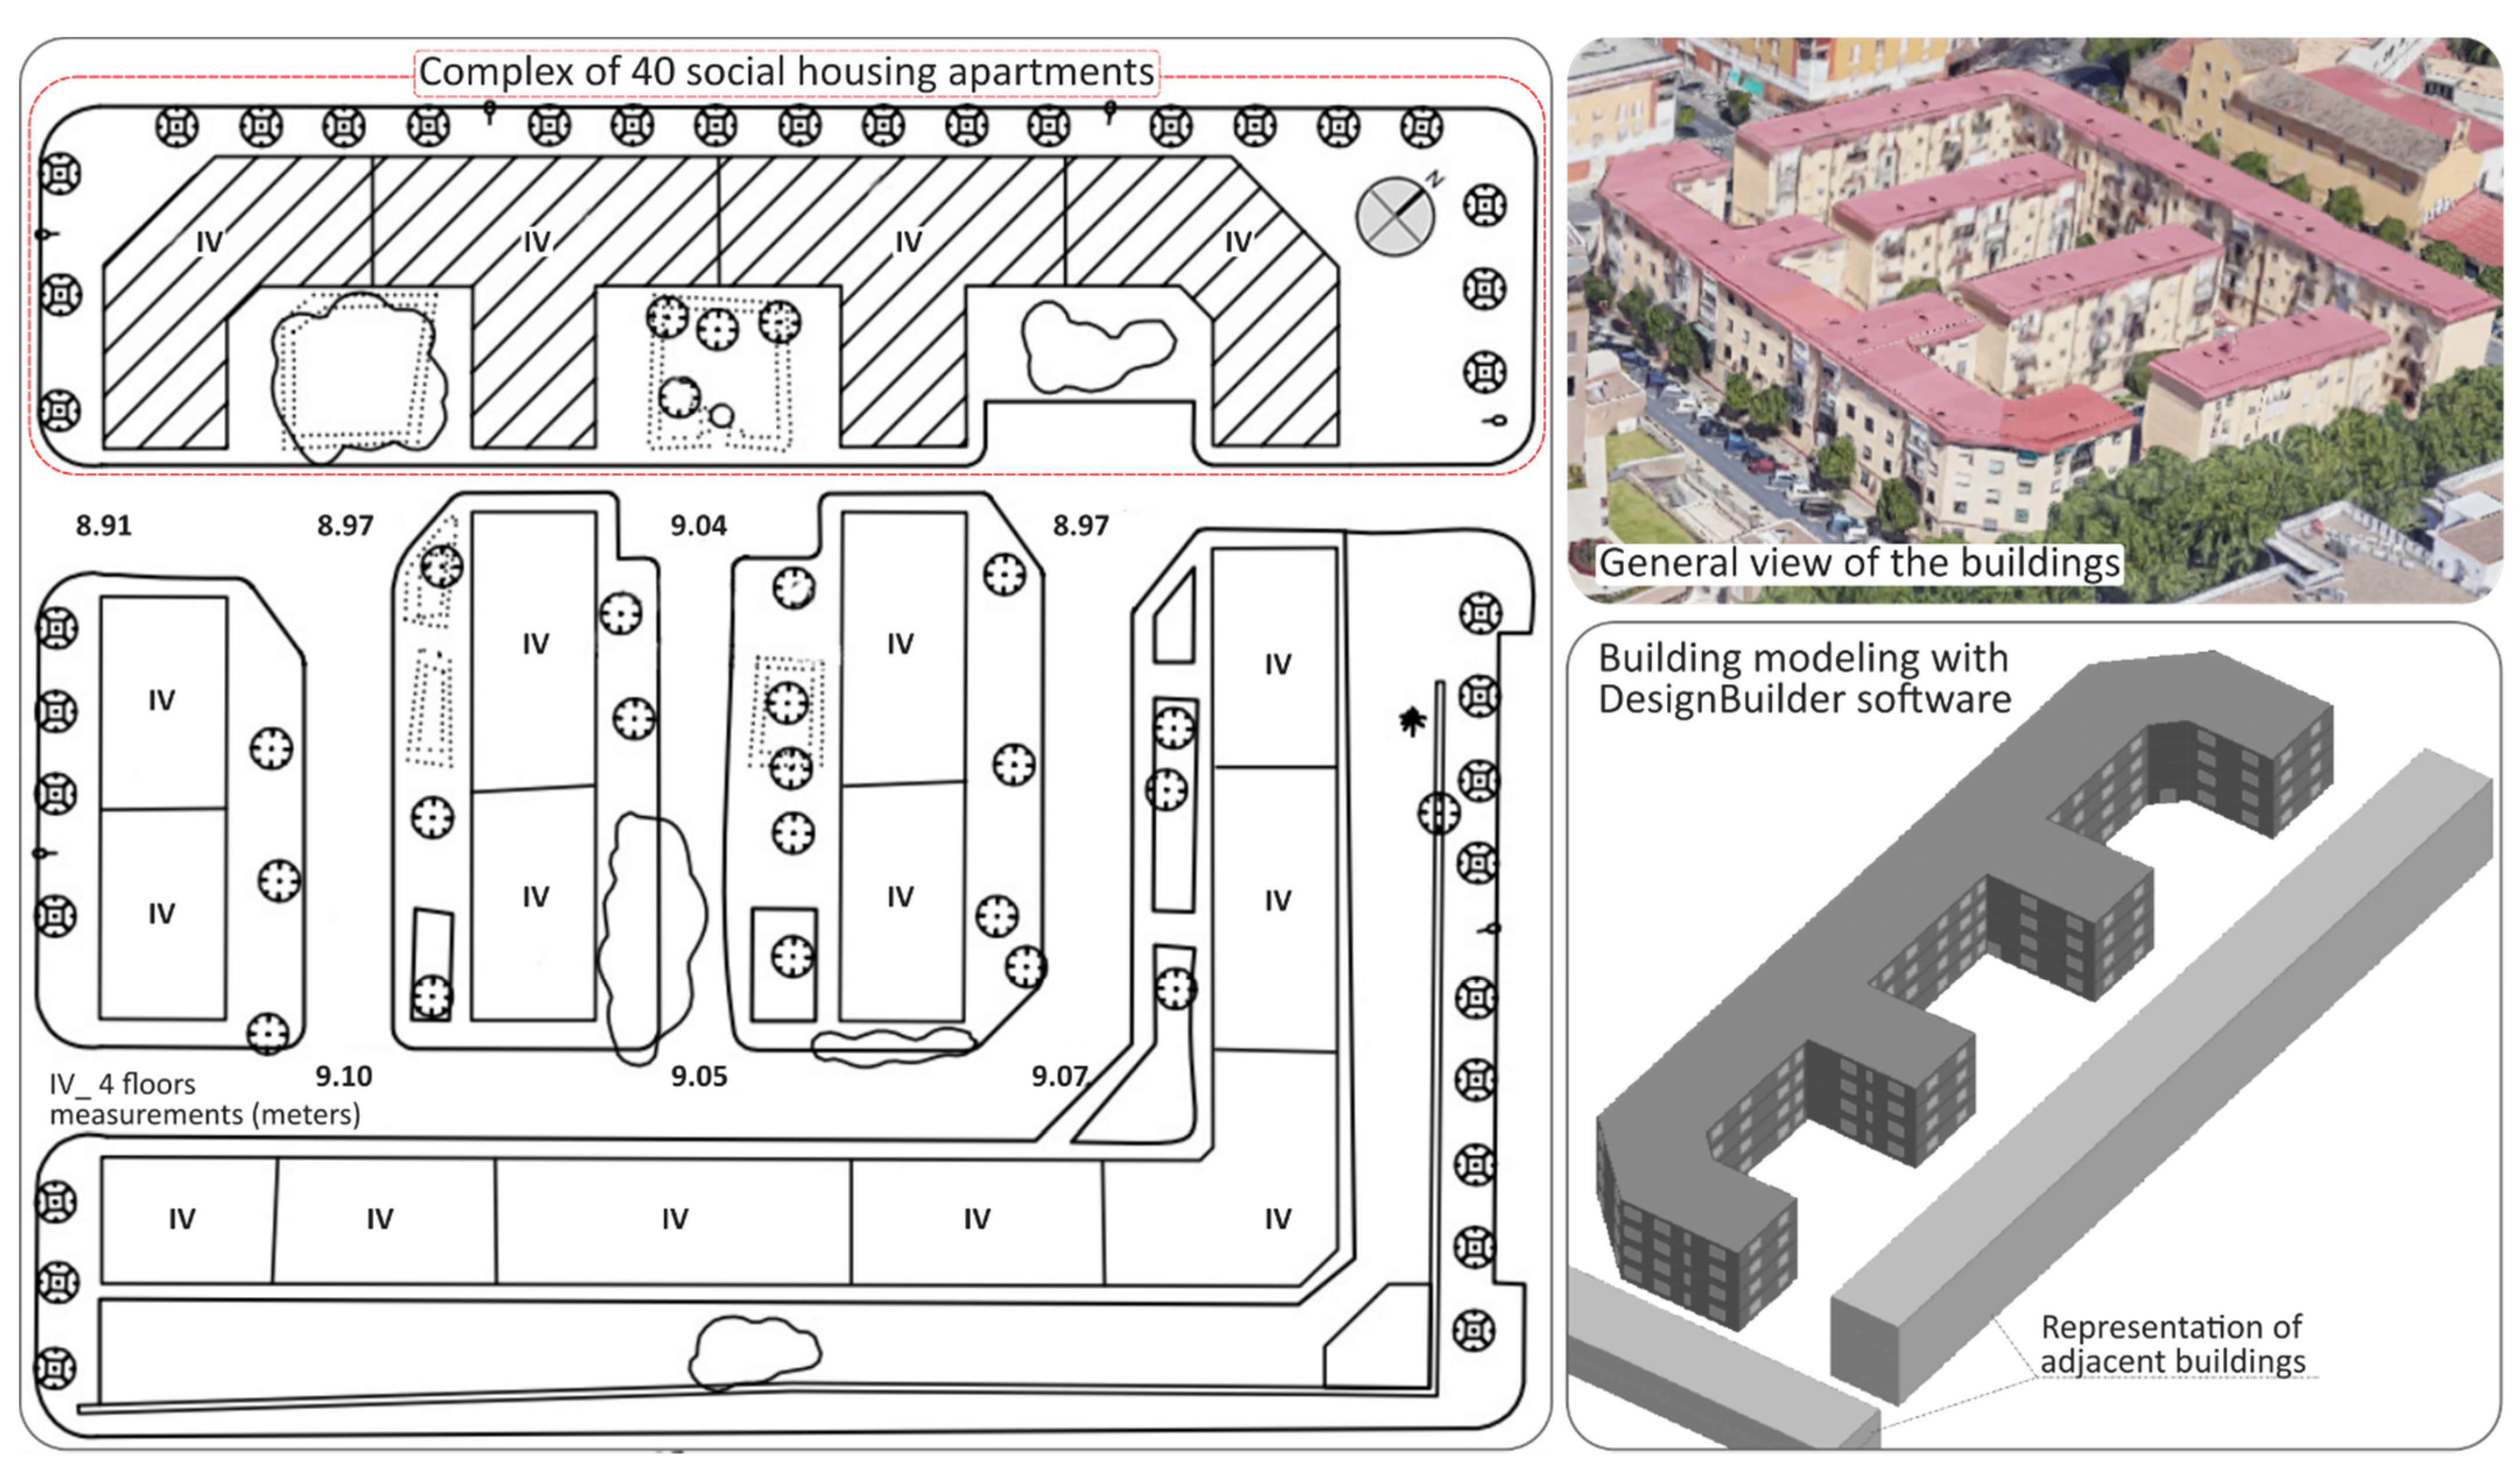
To assess the vulnerability to EP by means of the implementation of the IVH, the DesignBuilder software is used; this software allows the energy simulation of buildings and is highly reliable as it contains the EnergyPlus calculation engine. Using hourly weather data files, the software develops advanced dynamic simulations, allowing the incorporation of data such as internal loads, construction characteristics, and temperatures adjusted according to the adaptive approach. These are crucial to carry out pre- and post-intervention evaluations in relation to EP. Moreover, to evaluate the degree of households’ vulnerability throughout the timespan after the retrofit, future climate scenarios are considered. To this end, the CCWorldWeatherGen tool of the Hadley Centre Coupled Model 3 HadCM3 UK Met Office is used, which, through a morphing process, generates, for any geographical location, meteorological data according to the prediction of climate change. Furthermore, these data are generated in interchange files compatible with a large number of building energy simulation software [52]. The “morphing” of the climatological data used in this work coincides with the A2 scenario of greenhouse gas emissions, as established in the IPCC (Intergovernmental Panel on Climate Change). This has generated the climatic scenarios established for 2050 and 2080 in this work. Energy consumption data can then be extracted from each simulation.

2.4. Case Study

The case study is a residential building formed by 40 social housing apartments, developed on four floors, with 876 m2 per floor and a total area of 3504 m2 (Figure 3). The building was constructed in 1950 in Seville, and thus it shares the characteristics of the social housing of the 1950s and 1960s, common to many of the workers’ housing developments that were built in the city at that time, in response to demographic and industrial development.
The original foundation consists of a system of concrete pads connected with reinforced concrete beams. The vertical structure is composed of load-bearing walls of solid ceramic brick up to the first floor, and the upper floors are made of alternating solid and hollow bricks. The slabs are made of ceramic lightening pieces and a layer of reinforced concrete. The connection between floors is made of stairs of solid brick vaults. The rooftop is flat, with slope formation and ceramic tile finish. The façade has a final coating of painted cement mortar. The windows are made of sliding aluminum frames and single glass panels.
The interior distribution of the dwellings varies according to the location within the complex; all have a living room, kitchen, bathroom, and two to three bedrooms. This study focuses on the two-bedroom apartments. Domestic hot water (DHW) is independent for each home and is provided by standard combustion gas heaters. The building characteristics and internal loads are shown in Table 3 and Table 4, respectively.
The DHW is replaced by a new system supported by renewable energy. The equipment is centralized for the whole building and is formed by solar thermal panels that contribute to the production of DHW with accumulators and individual auxiliary systems per dwelling that work with electric power. The original exterior windows are replaced by a more efficient one with low-emissive glass and frames with thermal break, with low emissivity and dehydrated air chamber of 12 mm. These reduce the thermal and acoustic transmission.
With respect to the loads schedule, data similar to previous research studies are used [21,23,36] (Table 5). All internal loads vary depending on the day of the week (weekdays and weekends). The airflow is set constant, 0.7 ac/h, due to windows’ infiltration.

3. Results

Vulnerability Comparison: Present and Future Scenarios of the Baseline and Enhanced Case

The energy consumption simulations were applied to the baseline and enhanced case, in the current scenario, as well as in future scenarios considering the predictions of climate change (2050 and 2080, respectively), prior to any intervention. The energy improvement project was developed for the entire building, but the required energy consumption obtained represents a single dwelling on an intermediate floor.
This work aimed to provide a real analysis at the local level to identify the vulnerability of low-income homes and dwellings of poor quality. These results are underpinned by the standard economic situation of homes located in these areas according to the Spanish Household Budget Survey (HBS) as collected by the Spanish National Statistics Institute (SNSI) [53]. Given that the households studied are in a situation of monetary poverty, the same size and typology were assimilated for all scenarios.
The results of applying the indicator to the case study are presented below:
Monetary Poverty Indicator (MPI): As it has been introduced in previous paragraphs, in this study, it was assumed that households, in all scenarios, are in a situation of monetary poverty. To obtain this result, a household size of two adults and two children was considered, and the net income and expenditure correspond to the ones classified as standard in the Spanish National Statistics Institute (SNSI) [53].
The monetary poverty threshold (MPT) used to calculate the MPI corresponds to 60% of median equivalized disposable income in Spain for a person, being EUR 9009 per person in the case of monetary poverty according to Eurostat [41]. In the case of severe monetary poverty (SMPT), the data used correspond to the lowest benefit granted by the Spanish State, which is active income of insertion which is collected as an extraordinary unemployment benefit, with a value of 451 EUR/month per person [42]. Based on these monetary poverty thresholds for one person (MPT and SMPT) and consumption units by household size (Equations (1) and (4) in Figure 1), the MPI value obtained is 0.76 for MP and 1.27 for SMP (after applying Equations (1), (1.2) and (1.3) in Figure 1). It is considered that a household is in monetary poverty when MPI is less than one, and then the result is “MP: Monetary poverty” (see MPI results in the last results table of this section).
Energy Indicator (EnI): Based on the energy consumption data published by the Institute for Energy Diversification and Saving for Spain (IDAE) [43], the average energy consumption threshold was obtained for the type of home analyzed.
Table 6 compares the EnI results. The total consumptions for a 76.22 m2 dwelling area can be observed, depending on the construction characteristics of the houses of the baseline and enhanced cases (Table 3 and Table 4), and in the three scenarios analyzed (current, 2050, and 2080).
Even though the results of the intermediate indicators are binary, CI, EnI, and MPI were combined into the HRQC in the previous work by [40], giving rise to a scale formed by 13 levels of vulnerability (Figure 2). The levels were calibrated with empirical data from surveys, obtained in a neighborhood in England [39].
The Buildings Performance Institute Europe (BPIE) defines as inefficient those residential buildings with an energy demand greater than 200 kWh/m2; thus we can consider these data as support for the “inadmissible” results for the case analyzed in this study [54].
Comfort Indicator (CI): To obtain this indicator, the percentage of hours within or outside the established comfort range was counted. Each dwelling was studied independently, considering the local climatology (Mediterranean climate, Seville) and the characteristics of the dwellings: in the baseline case, none of the dwellings have been retrofitted, and thus the technical characteristics were maintained in three scenarios (Table 3). In the enhanced case, the improvement measures described in Section 2.4. Case study (Table 4) were implemented in the three scenarios. Table 7 summarizes the comfort hours for each scenario. It may not be possible to replicate this analysis in other countries and/or building typology since thermal comfort situations vary depending on the characteristics of the home. In the results of Table 7, the percentage of hours in comfort (IC) is less than 80% in all scenarios, and thus, according to the limits established by the comfort indicator, the result for both the baseline case and the enhanced case is inadmissible.
Health-Related Quality-Life Cost (HRQLC):
Table 8 shows the results of the IVH in all studied scenarios located in the city of Seville. The final level of vulnerability was obtained from the combination of the results obtained in each of the indicators developed (according to Figure 2). The vulnerability level of the current baseline and enhanced cases is 5.00, derived from inadequate energy efficiency in the home. In the 2050 scenario, for the baseline case, a vulnerability level 8 was obtained, but this vulnerability level was reduced to 5 in the improved case for 2050 due to the energy efficiency achieved. Finally, in the scenario for 2080, the level of vulnerability is 12. It is situated in one of the most critical levels because the worst possible situation of energy poverty is defined, in which the home cannot afford minimal energy consumption due to its low monetary level, representing the ″heating or eating″ effect (choosing between eating or consuming minimal energy). The HRQLC provided in Table 8 represents cost per life year to the NHS of those of homes analyzed in each scenario.

4. Discussion

From the analysis of the results in Table 8, it is possible to estimate the vulnerability of households by applying the implemented IVH. In addition, these results show that, assuming the same monetary situation for all scenarios, improving the energy efficiency of homes is key to reducing the level of vulnerability of households and, consequently, reducing the cost for the NHS (HRQL).
From the results applied to the case study, it can be noticed that:
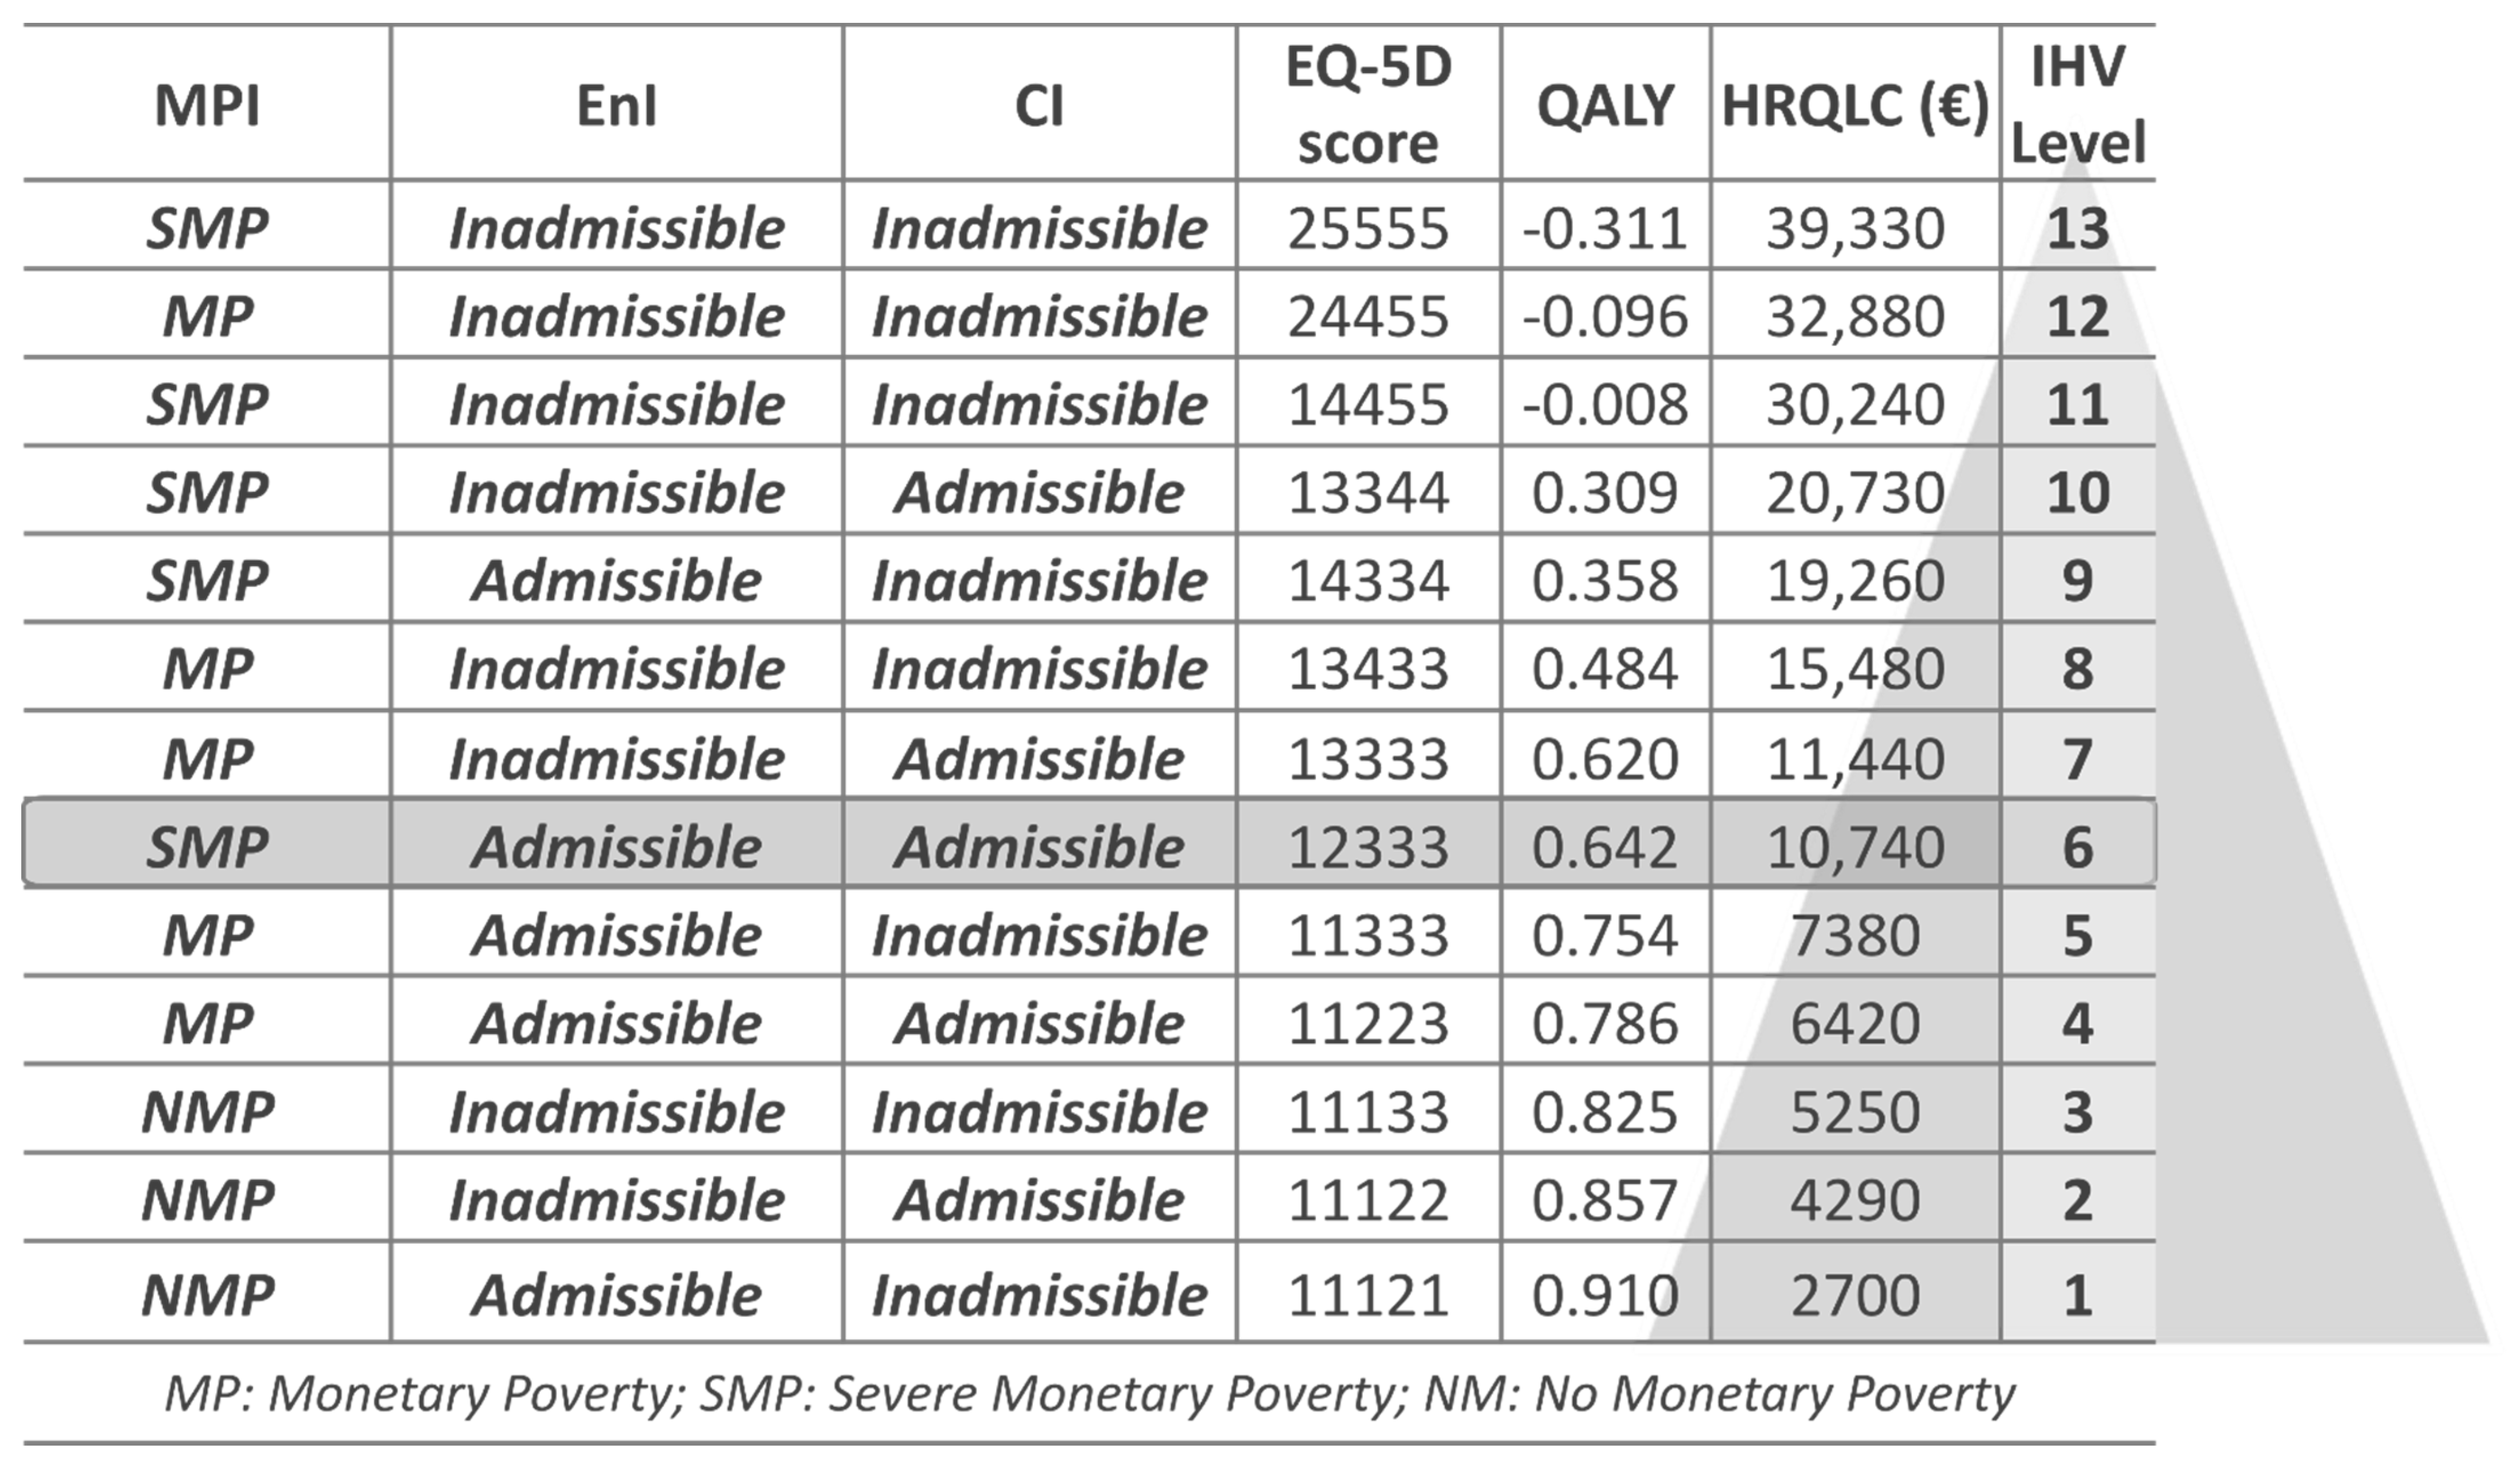
  • − The situation of monetary poverty in which households are immersed is the main cause of the situation of vulnerability.
  • − The improvement retrofitting carried out in the 2050 scenario contributed to an improvement in the quality of life of the household, reducing the IVH level from 8 to 5; however, it is necessary for the household to overcome the situation of monetary poverty, by means of reducing expenses or increasing their income, in order to get out of the vulnerability situation.
  • − The implementation of adaptive comfort in the calculation of the energy consumption identified situations of discomfort in a more realistic way because tenants’ discomfort is relative to the average outside weather.
  • − The results show that the improvements implemented in the case studies worsened comfort in the Mediterranean climate as the solutions implemented are too watertight for the local climate.
  • − From the results, the passive retrofitting proposed by itself does not improve the comfort of the home in the climate under study and makes ventilation necessary to achieve it.

5. Conclusions

The aim of this work was to provide a new approach to energy poverty by identifying vulnerable households, considering economic and social aspects and climate change adaptability of families in a global warming context. The present research can have a big impact technically because it generated a new tool to define priorities in renovation works, and this can be extrapolated to new buildings assessment and to the rehabilitation projects of obsolete ones. The public funding can be allocated in a more efficient way to tackle vulnerability in a climate change scenario.
One of the main contributions of this work lies in the location of the case studies analyzed. Energy poverty has been studied in cold climates since it has traditionally been related to areas where winters are very harsh, but in climates where summers are long and extremely hot, it is not as well studied, although high energy consumption during the summer can cause a situation of energy poverty. The adaptive criteria applied in energy simulation of the building, in future climate change scenarios (2050 and 2080), and the severity of summer in the Mediterranean climate make annual cooling energy consumption much higher than heating consumption in both scenarios.
From the analysis of the results obtained, it can be concluded that, in the Mediterranean climate, energy improvement solutions based mainly on passive building design criteria result in homes that are too tight, making ventilation necessary to reach comfort.
Returning to the objective of this work, the implementation in the IVH of the adaptability of households in the context of climate change provides an evolution of the indicator that allows an assessment of the households’ situation in a more complete and complex way by identifying not only which factors have the greatest impact on the situation of vulnerability but also assessing the household’s adaptive capacity based on climate variability and how it influences the occupants’ quality of life.
The implementation carried out confirms that the IVH can combine information about the monetary situation of the household according to the monetary poverty threshold of the study area and the home energy consumption under adaptive comfort criteria and subjected to the climatic zone where the home is located. New lines of research will be to identify how the climatology of the area defines the comfort levels of homes in relation to the monetary situation, energy costs, and quality of life.

Author Contributions

Conceptualization, R.C.-R.; Data curation, M.T.-C.; Formal analysis, M.T.-C.; Funding acquisition, C.R.-B.; Methodology, R.C.-R.; Project administration, C.R.-B.; Software, M.T.-C.; Supervision, C.R.-B. and M.M.; Writing—original draft, M.D.A.-R.; Writing—review and editing, C.R.-B. and M.M. All authors have read and agreed to the published version of the manuscript.

Funding

This paper and the costs for its publication in open access have been funded by the research project called “Nuevo Análisis Integral de la Pobreza Energética en Andalucía (NAIPE). Predicción, evaluación y adaptación al cambio climático de hogares vulnerables desde una perspectiva económica, ambiental y social (US- 125546)”, financed by “Consejería de Economía y Conocimiento de la Junta de Andalucía (Spain)” with the European Regional Development Fund (ERDF).

Institutional Review Board Statement

Not applicable.

Informed Consent Statement

Not applicable.

Data Availability Statement

Not applicable.

Acknowledgments

The authors express their gratitude to the research project called “Nuevo Análisis Integral de la Pobreza Energética en Andalucía (NAIPE). Predicción, evaluación y adaptación al cambio climático de hogares vulnerables desde una perspectiva económica, ambiental y social (US- 125546)”, financed by “Consejería de Economía y Conocimiento de la Junta de Andalucía (Spain)” with the European Regional Development Fund (ERDF).

Conflicts of Interest

The authors declare no conflict of interest.

References

  1. Intergovernmental Panel on Climate Change (Ed.) Intergovernmental Panel on Climate Change Climate Change 2014: Synthesis report. In Contribution of Working Groups I, II and III to the Fifth Assessment Report of the Intergovernmental Panel on Climate Change; Cambridge University Press: Cambridge, UK, 2014. [Google Scholar]
  2. European Union. Directive (EU) 2018/844 of the European Parliament and of the Council of 30 May 2018 Amending Directive 2010/31/EU on the Energy Performance of Buildings and Directive 2012/27/EU on Energy Efficiency. Off. J. Eur. Union. 2018, L156, 75. Available online: https://eur-lex.europa.eu/legal-content/EN/TXT/?uri=celex:32018L0844 (accessed on 7 April 2021).
  3. European Commission. 2020—Europe’s Climate Change Opportunity; Climate Action: Brussels, Belgium, 2008. [Google Scholar]
  4. European Commision. A Policy Framework for Climate and Energy in the Period from 2020 to 2030; Climate Action: Brussels, Belgium, 2014. [Google Scholar]
  5. European Commission. A European Green Deal. Available online: https://ec.europa.eu/info/strategy/priorities-2019-2024/european-green-deal_en (accessed on 8 June 2021).
  6. Semprini, G.; Gulli, R.; Ferrante, A. Deep regeneration vs shallow renovation to achieve nearly Zero Energy in existing buildings: Energy saving and economic impact of design solutions in the housing stock of Bologna. Energy Build. 2017, 156, 327–342. [Google Scholar] [CrossRef]
  7. Anthony, T. Understanding the Costs and Benefits of Fuel Poverty Interventions: A Pragmatic Economic Evaluation from Greater Manchester; Greater Manchester Public Health Practice Unit: Manchester, UK, 2011. [Google Scholar]
  8. Barker, A.V.; Dip, D.M.S.P.G. Assessment of the Impact on Health and Health Costs due to Fuel Poverty in Bolton; National Health Service: Bolton, UK, 2011. [Google Scholar]
  9. Department of Energy & Climate Change (DECC). Annual Fuel Poverty Statistics Report 2014; National Statistics: London, UK, 2014. [Google Scholar]
  10. ASSIST 2GETHER. Report on National and European Measures Addressing Vulnerable Consumers and Energy Poverty; European Commission: Brussels, Belgium, 2018. [Google Scholar]
  11. Baker, E.; Lester, L.H.; Bentley, R.; Beer, A. Poor housing quality: Prevalence and health effects. J. Prev. Interv. Community 2016, 44, 219–232. [Google Scholar] [CrossRef]
  12. Castaño-Rosa, R.; Solís-Guzmán, J.; Rubio-Bellido, C.; Marrero, M. Towards a multiple-indicator approach to energy poverty in the European Union: A review. Energy Build. 2019, 193, 36–48. [Google Scholar] [CrossRef]
  13. European Commision. Directive 2002/91/EC of the European Parliament and of the Council of 16 December 2002 on the energy performance of buildings. Off. J. Eur. Union 2002, 2010, 65–71. [Google Scholar]
  14. Gobierno de España (Government of Spain). Royal Decree 314/2006 Approving the Technical Building Code (Real Decreto 314/2006, de 17 de Marzo, por el que se Aprueba el Código Técnico de la Edificación; Imprenta Nacional del Boletín Oficial del Estado: Madrid, España, 2006. [Google Scholar]
  15. Gobierno de España (Government of Spain). Royal Decree 1027/2007 Approving the Spanish Thermal Building Regulations (Real Decreto 1027/2007, de 20 de Julio, por el que se Aprueba el Reglamento de Instalaciones Termicas en los Edificios); Imprenta Nacional del Boletín Oficial del Estado: Madrid, España, 2007. [Google Scholar]
  16. Technical Building Code (TBC): Royal Decree 314/2006 of 17 March 2006, Approving the Technical Building Code; Ministerio de Vivienda: Alcobendas, Spain, 2006; ISBN 843401632X.
  17. EN 16798-1:2019. Energy Performance of Buildings—Ventilation for Buildings—Part 1: Indoor Environmental Input Parameters for Design and Assessment of Energy Performance of Buildings Addressing Indoor Air Quality, Thermal Environment, Lighting and Acous; European Committee for Standardization: Brussels, Belgium, 2019. [Google Scholar]
  18. American Society of Heating, R.; A.C.E. (ASHRAE). ASHRAE Standard 55-2017 Thermal Environmental Conditions for Human Occupancy; ASHRAE Inc., Ed.; American Society of Heating, Refrigerating and Air Conditioning Engineers: Atlanta, GA, USA, 2017; ISBN 1041–2336. [Google Scholar]
  19. Brager, G.S.; De Dear, R.J. Thermal adaptation in the built environment: A literature review. Energy Build. 1998, 27, 83–96. [Google Scholar] [CrossRef] [Green Version]
  20. Carlucci, S.; Bai, L.; De Dear, R.; Yang, L. Review of adaptive thermal comfort models in built environmental regulatory documents. Build. Environ. 2018, 137, 73–89. [Google Scholar] [CrossRef] [Green Version]
  21. Bienvenido-Huertas, D.; Sánchez-García, D.; Rubio-Bellido, C. Comparison of energy conservation measures considering adaptive thermal comfort and climate change in existing Mediterranean dwellings. Energy 2020, 190, 116448. [Google Scholar] [CrossRef]
  22. Bienvenido-Huertas, D.; Quiñones, J.A.F.; Moyano, J.; Rodríguez-Jiménez, C.E. Patents Analysis of Thermal Bridges in Slab Fronts and Their Effect on Energy Demand. Energies 2018, 11, 2222. [Google Scholar] [CrossRef] [Green Version]
  23. Bienvenido-Huertas, D.; Sánchez-García, D.; Rubio-Bellido, C. Analysing natural ventilation to reduce the cooling energy consumption and the fuel poverty of social dwellings in coastal zones. Appl. Energy 2020, 279, 115845. [Google Scholar] [CrossRef] [PubMed]
  24. Thomson, H.; Snell, C.; Liddell, C. Fuel poverty in the European Union: A concept in need of definition? People Place Policy Online 2016, 10, 5–24. [Google Scholar] [CrossRef]
  25. Bouzarovski, S.; Petrova, S. A global perspective on domestic energy deprivation: Overcoming the energy poverty-fuel poverty binary. Energy Res. Soc. Sci. 2015, 10, 31–40. [Google Scholar] [CrossRef]
  26. Heindl, P. Measuring Fuel Poverty: General Considerations and Application to German Household Data. Finanz. Arch. 2015, 71, 178–215. [Google Scholar] [CrossRef] [Green Version]
  27. Rademaekers, K.; Yearwood, J.; Ferreira, A.; Pye, S.; Ian Hamilton, P.; Agnolucci, D.G.; Karásek, J.; Anisimova, N. Selecting Indicators to Measure Energy Poverty; Trinomics: Rotterdam, The Netherlands, 2016. [Google Scholar]
  28. Legendre, B.; Ricci, O. Measuring fuel poverty in France: Which households are the most vulnerable? Energy Econ. 2014, 49, 620–628. [Google Scholar] [CrossRef] [Green Version]
  29. Miniaci, R.; Scarpa, C.; Valbonesi, P. Fuel Poverty and the Energy Benefits System: The Italian Case; Universita’ Bocconi: Milano, Italy, 2014. [Google Scholar]
  30. Hatt, T.; Saelzer, G.; Hempel, R.; Gerber, A. High indoor comfort and very low energy consumption through the implementation of the Passive House standard in Chile. Rev. Constr. 2012, 11, 123–134. [Google Scholar]
  31. Martínez, P.W.; Kelly, M.T. Integration of performance criteria in the energy-environmental improvement of existing social housing in Chile. Ambient. Construído 2015, 15, 47–63. [Google Scholar] [CrossRef] [Green Version]
  32. Van Hooff, T.; Blocken, B.; Hensen, J.L.M.; Timmermans, H.J.P. Reprint of: On the predicted effectiveness of climate adaptation measures for residential buildings. Build. Environ. 2015, 83, 142–158. [Google Scholar] [CrossRef] [Green Version]
  33. Fabbri, K. Building and fuel poverty, an index to measure fuel poverty: An Italian case study. Energy 2015, 89, 244–258. [Google Scholar] [CrossRef]
  34. Braubach, M.; Ferrand, A. Energy efficiency, housing, equity and health. Int. J. Public Health 2013, 58, 331–332. [Google Scholar] [CrossRef] [Green Version]
  35. UNEP Global Status Report for Buildings and Constructi. Available online: https://wedocs.unep.org/handle/20.500.11822/34572 (accessed on 9 June 2021).
  36. Sánchez-García, D.; Bienvenido-Huertas, D.; Tristancho-Carvajal, M.; Rubio-Bellido, C. Adaptive Comfort Control Implemented Model (ACCIM) for Energy Consumption Predictions in Dwellings under Current and Future Climate Conditions: A Case Study Located in Spain. Energies 2019, 12, 1498. [Google Scholar] [CrossRef] [Green Version]
  37. Sánchez-García, D.; Rubio-Bellido, C.; Tristancho, M.; Marrero, M. A comparative study on energy demand through the adaptive thermal comfort approach considering climate change in office buildings of Spain. Build. Simul. 2020, 13, 51–63. [Google Scholar] [CrossRef]
  38. Castaño-Rosa, R.; Solís-Guzmán, J.; Marrero, M. Energy poverty goes south? Understanding the costs of energy poverty with the index of vulnerable homes in Spain. Energy Res. Soc. Sci. 2020, 60, 101325. [Google Scholar] [CrossRef]
  39. Castaño-Rosa, R.; Sherriff, G.; Thomson, H.; Guzmán, J.S.; Marrero, M. Transferring the index of vulnerable homes: Application at the local-scale in England to assess fuel poverty vulnerability. Energy Build. 2019, 203, 109458. [Google Scholar] [CrossRef]
  40. Castaño-Rosa, R.; Solís-Guzmán, J.; Marrero, M. A novel Index of Vulnerable Homes: Findings from application in Spain. Indoor Built Environ. 2018, 29, 311–330. [Google Scholar] [CrossRef]
  41. Eurostat. At-Risk-of-Poverty Thresholds—EU-SILC and ECHP Surveys. Available online: http://appsso.eurostat.ec.europa.eu/nui/show.do?dataset=ilc_li01&lang=en (accessed on 7 April 2021).
  42. Gobierno de España (Government of Spain). Real Decreto Legislativo 8/2015, de 30 de Octubre, por el que se Aprueba el Texto Refundido de la Ley General de la Seguridad Social. Available online: https://www.boe.es/buscar/act.php?id=BOE-A-2015-11724 (accessed on 7 April 2021).
  43. IDAE. Consumption of the Residential Sector in Spain. Summary of Basic Information. SPAHOUSEC I Project. Institute for the Diversification and Saving of Energy. Eurostat. Ministry of Industry, Energy and Tourism. Available online: https://www.idae.es/uploads/documentos/documentos_Documentacion_Basica_Residencial_Unido_c93da537.pdf (accessed on 7 April 2021).
  44. Dear, R.J.; De, G.S. Brager Thermal comfort in naturally ventilated buildings: Revision to ASHRAE standards 55. J. Energy Build. 2002, 34, 549–561. [Google Scholar] [CrossRef] [Green Version]
  45. Vallejo-Torres, L.; García-Lorenzo, B.; Valcárcel Nazco, C.; García-Pérez, L.; Linertová, R.; Serrano-Aguilar, P. Valor Monetario de un Año de Vida Ajustado por Calidad: Estimación Empírica del coste de Oportunidad en el Sistema Nacional de Salud. Available online: https://www3.gobiernodecanarias.org/sanidad/scs/contenidoGenerico.jsp?idDocument=e690e0c1-cbed-11e5-a9c5-a398589805dc&idCarpeta=ce590e62-7af0-11e4-a62a-758e414b4260 (accessed on 7 April 2021).
  46. Van Hout, B.; Janssen, M.F.; Feng, Y.-S.; Kohlmann, T.; Busschbach, J.; Golicki, D.; Lloyd, A.; Scalone, L.; Kind, P.; Pickard, A.S. Interim scoring for the EQ-5D-5L: Mapping the EQ-5D-5L to EQ-5D-3L value sets. Value Health 2012, 15, 708–715. [Google Scholar] [CrossRef] [Green Version]
  47. Luo, M.; Wang, Z.; Brager, G.; Cao, B.; Zhu, Y. Indoor climate experience, migration, and thermal comfort expectation in buildings. Build. Environ. 2018, 141, 262–272. [Google Scholar] [CrossRef] [Green Version]
  48. Bienvenido-Huertas, D.; Sánchez-García, D.; Rubio-Bellido, C. Adaptive setpoint temperatures to reduce the risk of energy poverty? A local case study in Seville. Energy Build. 2020, 231, 110571. [Google Scholar] [CrossRef]
  49. Sánchez-García, D.; Bienvenido-Huertas, D.; Pulido-Arcas, J.A.; Rubio-Bellido, C. Analysis of energy consumption in different European cities: The adaptive comfort control implemented model (ACCIM) considering representative concentration pathways (RCP) scenarios. Appl. Sci. 2020, 10, 1513. [Google Scholar] [CrossRef] [Green Version]
  50. Sánchez, C.S.-G.; González, F.J.N.; Aja, A.H. Energy poverty methodology based on minimal thermal habitability conditions for low income housing in Spain. Energy Build. 2018, 169, 127–140. [Google Scholar] [CrossRef]
  51. Sánchez-Guevara Sánchez, C.; Mavrogianni, A.; Neila González, F.J. On the minimal thermal habitability conditions in low income dwellings in Spain for a new definition of fuel poverty. Build. Environ. 2016, 114, 344–356. [Google Scholar] [CrossRef]
  52. Climate Change World Weather File Generator for World-Wide Weather Data—CCWorldWeatherGen—University of Southampton Blogs. Sustainable Energy Research Group. Available online: https://energy.soton.ac.uk/climate-change-world-weather-file-generator-for-world-wide-weather-data-ccworldweathergen/ (accessed on 12 June 2021).
  53. SNSI_Spanish_National Statistics_Institute. Income per Household by Autonomous Communities. Available online: https://www.ine.es/jaxiT3/Datos.htm?t=9949 (accessed on 22 April 2021).
  54. BPIE. Europe’s Buildings Under the Microscope A Country-by-Country Review of the Energy Performance of Buildings. Build. Perform. Inst. Eur. Available online: https://bpie.eu/wp-content/uploads/2015/10/HR_EU_B_under_microscope_study.pdf (accessed on 13 July 2021).
Figure 1. Summary scheme of the methodology for calculating the implemented Index of Vulnerable Homes (IVH).
Sustainability 13 07866 g001
Figure 2. Levels of vulnerability [39].
Sustainability 13 07866 g002
Figure 3. Layout and surroundings of the 40 social apartments building. Image of the energy simulation modeling.
Sustainability 13 07866 g003
Table 1. Example of QALYs.
DimensionsHealth LevelsIllnessQALY
Mobility1 No problems0.642
Self-care2 Slight problems performing self-care activities
Usual activities3 Moderate problems performing usual activities
Pain/Discomfort3 Moderate pain/discomfort problems
Anxiety/Depression3 Moderate anxiety/depression problems
Table 2. Setpoint temperatures considering adaptive comfort temperature ranges for category III and the prevailing mean outdoor air temperature ( T r m ) .
SchemePrevailing Mean Outdoor Air Temperature Trm—Comfort Temperature
T r m < 10 ° C 10 ° C T r m 30 ° C T r m   > 30 ° C
Upper setpoint 25.0 0.33 × T r m + 18.8 + 4 27.0
Lower setpoint 19.0 0.33 × T r m + 18.8 5 22.0
Table 3. Building characteristics (baseline case).
Construction ElementsThickness (m)Thermal Conductivity (w/m2 K)Transmittance
U (W/m2 K)
EnvelopeCement mortar plastering (M5 (1:6))0.020.552.1
Brick wall for facing0.241.04
Cement mortar plastering (M5 (1:6))0.020.55
RooftopCeramic tile floor (14 × 28 cm)0.021.001.11
Bastard mortar0.020.55
Lost flooring with ceramic tile0.021.00
Protective mortar0.020.55
Lightweight slope-forming concrete0.150.41
Resistant support with self-supporting beams and ceramic vaults0.250.91
Cement mortar plastering (M5 (1:6))0.020.55
WindowsSliding aluminum frames, without thermal bridge breakage (4.0 m2 K/W)5.7
Simple monolithic glass panels (5.7 m2 K/W).
SystemNominal Performance
Heating Heat pump2.10 COP
Cooling Heat pump2.00 EER
According to the Spanish building code, the internal load of residential buildings is a low internal load, i.e., electrical equipment, lighting, and occupants generate little heat, with a density of internal sources below 6 W/m2.
Table 4. Building characteristics (retrofitting project).
Energy RetrofittingThickness (m)Thermal Conductivity (w/m2 k)Transmittance
U (W/m2 K)
EnvelopeMono-layer coating0.040.720.38
Insulation. Rigid EPS panels0.080.04
Brick wall for facing0.241.04
Cement mortar plastering (M5 (1:6))0.020.55
Gypsum plastering0.010.57
RooftopCeramic tile floor (14 × 28 cm)0.021.000.33
Cement mortar plastering (M5 (1:6))0.020.55
Anti-puncture fabric (separator)0.0010.05
Waterproof layer (EPDM)0.0010.25
Lightweight slope-forming concrete0.150.41
Resistant support with self-supporting beams and ceramic vaults0.250.91
Cement mortar plastering (M5 (1:6))0.020.55
Gypsum plastering0.010.57
WindowsSliding aluminum frames, with thermal bridge breakage (4.0 m2 K/W)2.22
Low-emission glass (6 mm) (1.6 m2 K/W)
SystemNominal Performance
Heating Heat pump with inverter multi-split system4.4 COP
Cooling Heat pump with inverter multi-split system4.2 EER
According to the Spanish building code, the internal load of residential buildings is low, i.e., electrical equipment, lighting, and occupants generate little heat, with a density of internal sources below 6 W/m2.
Table 5. Loads schedule in the case study.
Loads Schedule
LoadsTime Period
1:00–7:008:0009:00–15:0016:00–18:0019:0020:00–23:0000:00
Sensible load (W/m2)Weekdays2.150.540.541.081.081.082.15
Weekend2.152.152.152.152.152.152.15
Latent load (W/m2)Weekdays1.360.340.340.680.680.681.36
Weekend1.361.361.361.361.361.361.36
Lighting (W/m2)Weekdays and
weekend
0.441.321.321.322.204.402.20
Equipment (W/m2)Weekdays and
weekend
0.441.321.321.322.204.402.20
Table 6. Results of the energy indicator for baseline and enhanced cases: current, 2050, and 2080.
EnI_Implemented Energy Indicator
AnnualTotal Consumption kwhMEC_lim. kWhEnIResult
BASELINE CASE
Current5404.156386.110.85Admissible
20507953.021.25Inadmissible
20809631.711.51Inadmissible
ENHANCED CASE
Current4901.136386.110.77Admissible
20506152.060.96Admissible
20806841.511.07Inadmissible
Table 7. Results of hours of comfort for baseline and enhanced case: current, 2050, and 2080.
CI_Implemented Comfort Indicator
AnnualTotal HoursHours ComfortCIResult
BASE CASE
ACTUAL8760.005289.0060.38%Inadmissible
20504696.0053.61%Inadmissible
20804078.0046.55%Inadmissible
ENHANCED CASE
ACTUAL8760.004530.0051.71%Inadmissible
20502739.0031.27%Inadmissible
20802351.0026.84%Inadmissible
Table 8. Results of the implemented indicator of vulnerable homes of the baseline and enhanced cases. States: current, 2050, and 2080.
Implemented Index of Vulnerable Homes (IVH)
AnnualMonetary Poverty Indicator (MPI)Implemented Energy Indicator (EnI)Implemented Comfort Indicator (CI)Health-Related Quality-Life Cost (HRQLC)IVH Levels
EQ-5 D ScoreQALYHRQLC (EUR)
BASE CASE
CurrentMPAdmissibleInadmissible113330.7547380.005.00
2050MPInadmissibleInadmissible134330.48415480.008.00
2080MPInadmissibleInadmissible24455−0.09632880.0012.00
ENHANCED CASE
CurrentMPAdmissibleInadmissible113330.7547380.005.00
2050MPAdmissibleInadmissible113330.7547380.005.00
2080MPInadmissibleInadmissible24455−0.09632880.0012.00
Publisher’s Note: MDPI stays neutral with regard to jurisdictional claims in published maps and institutional affiliations.

