Abstract
Carbon emissions have been considered a major reason behind climate change and global warming. Various studies report that rapid urbanization and the changing demands of 21st century life have resulted in higher carbon emissions. This study aims to examine the carbon footprints in an academic building to observe the carbon dioxide (CO2) levels at crucial landmarks and offices. A sensor-based automated system was designed and implemented for the collection of CO2 concentrations at selected locations. In the final stage, a CO2 footprint map was generated to highlight the vulnerable areas of CO2 in the academic building. It was concluded that offices have higher CO2 concentrations at both intervals (morning and afternoon), followed by the laboratory, corridors, and praying area. The CO2 concentration did not exceed 500 ppm at any location. Thus, all locations other than offices had normal CO2 concentration levels. Similarly, the humidity level was also satisfactory. The average humidity level was below 50%, which is below the permissible value of 65%. The recommended range for temperature values as per ASHRAE standards is 22.5 °C to 25.5 °C, except for prayer places. It was concluded that the selected academic institute is providing a good environment to the users of the building, but that may change once the academic institute becomes fully functional after COVID-19. This study assists the stakeholders in making guidelines and necessary actions to reduce CO2 concentration in academic buildings, as it is expected to rise once the human load increases in the next academic year. The suggested approach can be used in any other country and the results will vary based on the building type, building energy type, and building ventilation design.
1. Introduction
The earth’s environment is inseparable due to feasible development across the world [1]. CO2 is a consequence of the human metabolism and is kept to clarify buildings adequately. Fresh air needs to be provided to the end user of the buildings [2,3,4]. A higher level of CO2 concentration may affect human consciousness, causing headaches, fatigue, nausea, dizziness, and vomiting. Therefore, fresh air is needed in buildings where there is a possibility of high concentrations [5].
Across the world, the energy requirement is increasing rapidly due to the attraction of urbanization facilities and the human population [6,7,8]. The world’s largest CO2 contributors are buildings, as the current building structures are demolished and rebuilt as huge buildings like skyscrapers to accommodate the population in urban areas [9,10,11]. It is reported that the building sector is responsible for almost 40% of global CO2 emissions. Building emissions are a combination of two things: (1) energy use for heating, lighting, and cooling; and (2) the pollution generated through construction activities, such as the production and transport of raw building materials [12,13]. Moreover, the high level of CO2 in the surroundings also affects human cognitive and creative skills, which can be mitigated through effective ventilation systems but also raises CO2 concentrations [14,15,16]. Most of the case studies indicate that cognition and performance become low when CO2 is higher. Furthermore, due to continued greenhouse gas emissions from living things, there is a prominent rise in CO2 levels [17,18]. Therefore, it is necessary that construction engineers discover innovative methods to reduce CO2 levels by incorporating ventilation requirements.
Urban places consume more than 70% of global energy and can be the key cause of CO2 emissions, primarily via construction. It is indicated that 60% of construction projects will demolish old buildings and build skyscrapers [19]. In addition, societies emit a large amount of different heat-trapping gases into the atmosphere [20]. Figure 1 shows the highest CO2 emitting countries reported by the International Energy Agency for the year 2018. These emissions include CO2 emissions from burning natural gas, coal, fossil fuel, other fuels, industrial waste, and non-renewable local municipal waste.
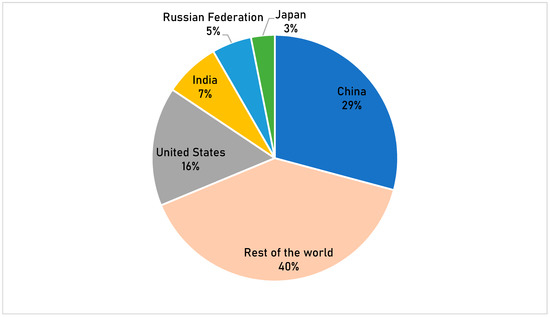
Figure 1.
Highest emitters of annual CO2 for the year 2018 [21].
In 2015, the erection and destruction of numerous structures in many countries was reported as one of the main causes of CO2 emissions [9,22]. Every day a massive amount of CO2 is emitted into the environment via factories, vehicles, and the consumption of fuels, resulting in climate change. CO2 is the leading cause of greenhouse gases, and its higher concentration leads to air pollution, acid rain, and harmful effects on the health of living beings. The annual growth of CO2 is predicted by the Keeling Curve, which shows the significance of CO2 assessment in the future. The Keeling Curve prediction is shown in Figure 2.
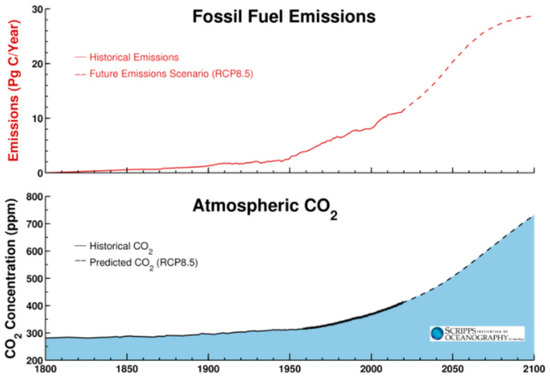
Figure 2.
Estimated growth of CO2 concentration in the next 80 years [23].
Most of the studies collected the CO2 concentration data at a specific time, which is time dependent [24,25,26]. It was reported that room temperature also has various consequences on the human body and health, whereas global temperature is normalized but may rise. Figure 3 shows the rise in global temperature since 1880.
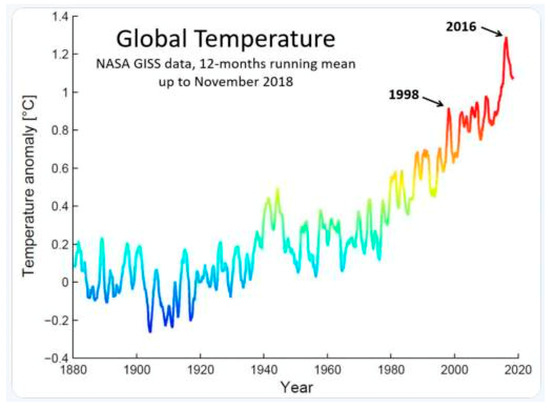
Figure 3.
Rise in global temperature [27].
It can be observed that the global temperature is also rising to a severe level, and it is essential to take action today to protect the world. Substantial quantities of greenhouse gas discharge in structures are consolidated carbon from transportation and industrial product cycles of several building substances [28,29]. Outside air usually carries 400 ppm (part per million) of CO2. Mostly, people breathe out in the range of 35,000–50,000 ppm of CO2 into the adjacent atmosphere. At the same time, high CO2 is thin in the surrounding air. This issue is key in areas with congestion, such as hotels, concert halls, or offices [30,31,32]. In academic buildings, students, teachers, and staff use the classrooms, labs, offices, corridors, and other areas most of the time. It is observed that people spend most of their time together in the building and in enclosed rooms with increasing CO2 levels. The University of Denmark reported via a case study that increasing CO2 at concentrations between 2500 ppm and 4000 ppm could negatively impact people’s performance.
A clear and precise relationship occurs between energy consumption, energy indications, and different spaces of the building [33]. Moreover, different amounts of energy create a significant challenge to establish benchmark data [34]. In the case of laboratories, studio halls, and lecture rooms, they can be comparatively vulnerable to CO2 in any academic building. Moreover, Harvard Chan School of Public Health reported that high CO2 levels directly affect the creative and problem-solving skills of students. The case study reported that cognitive results dropped by 21% at a 400 ppm CO2 level. In addition, rooms or enclosed buildings with poor ventilation quality could cause CO2 to be high [30]. An experiment was implemented with the GSS CozIR®-A CO2 sensor and it was reported that when a car had four people inside, the CO2 level went up to 2000 ppm within 20 min. People lost concentration and suffered from headaches and sleepiness at this level, as shown in Figure 4.
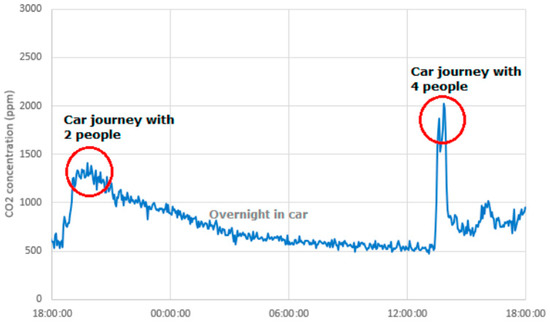
Figure 4.
CO2 level on a car journey at different times and with different numbers of travelers [35].
There are some health issues related to CO2 levels, as shown in Figure 5.
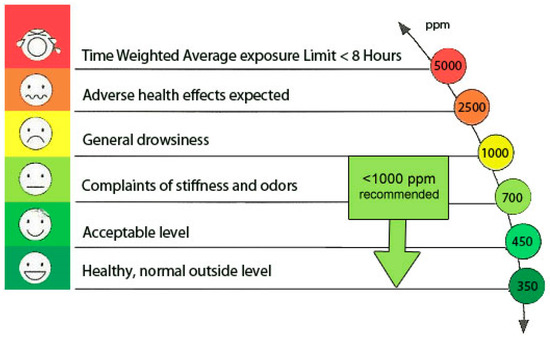
Figure 5.
Human behavior at different levels of CO2 [22].
Environmental protection is a major factor in the battle of tackling environmental challenges. The Kingdom of Saudi Arabia’s 2030 vision of environmental sustainability remarkably indicates that the country is committed to reducing CO2 emissions. Around 582.15 million metric tons of CO2 emission were recorded in the year 2019, which was 1.6% of global CO2 emissions. Figure 6 shows the CO2 emission trend in Saudi Arabia [36].
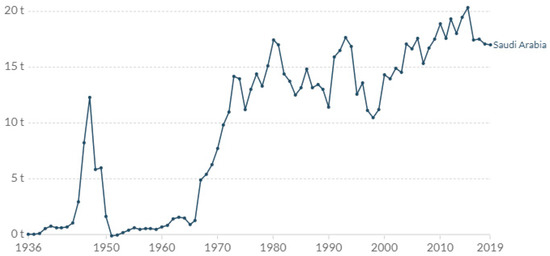
Figure 6.
CO2 emissions in Saudi Arabia [37].
The country is developing a long-term strategy for renewable energy that would lead to net CO2 emissions in the power sector by 2050. In 2019, Saudi Arabia raised its renewable energy target from 9.5 GW in 2023 to 58.7 GW by 2030 and it will significantly reduce the CO2 emissions in the country [38]. Therefore, this paper is an attempt to protect academic buildings, and using the smart system proposed in this study may significantly contribute to this noble cause. All spaces and buildings are important, but this study focuses on the carbon footprint of academic buildings. The system can also be used in other buildings with some modification to the threshold values in the system to generate the warning.
2. Research Methodology
The methodology of this research consisted of four (4) phases. In first phase, the latest literature on carbon dioxide and its implications in the different areas was analyzed to identify research gaps. In the second phase, the research and annual reports were reviewed to observe the carbon dioxide behavior in buildings with a focus on its impact and effect on academic buildings. In the third phase, a framework was designed to record the data on CO2 concentrations using unsupervised and supervised approaches. In the fourth and final phase, an automated approach was implemented for this study to observe the CO2 concentrations, humidity, and temperature at different locations set for this study. Figure 7 provides a complete overview of the implementation model.
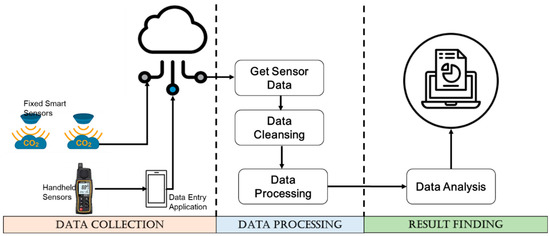
Figure 7.
Data collection model.
This study designed a three-step automized methodology for data collection, data processing, and findings.
2.1. Limitation of the Study
During COVID-19, it was hard to collect the data for selected places, as quarantine was in place. Therefore, this study collected data only for the time when faculty, staff, and students were allowed, while following the Ministry of Health guidelines. The data was collected for 30 days only, as after that, quarantine restrictions were applied again. The selection of locations was made based on three types: (1) offices, (2) hallways, and (3) gathering places. For offices, this research selected a shared office and an individual office. For corridors, this research selected corridors with variable human traffic. For gathering places, a prayer place was selected, as due to COVID-19 restrictions, all other kinds of gatherings were not allowed. This study consolidated the data for each category, as there was no significant deviation in sensor readings between different places. The selected institute uses a central air-conditioning system, with exhaust used as a ventilation mechanism.
2.2. Data Collection
In the first phase, the data were collected using two methods: (a) smart sensors and (b) handheld sensors. Smart sensors were deployed in the offices and corridors. The sensor readings were directly loaded into the cloud using a small application interface (API) from the slightly tweaked vendor application to load the data into the cloud. Handheld sensors were used to take asynchronous readings at selected times in the morning and afternoon. The data were collected using a mobile application that was installed in the data collectors’ mobile phones, and later the data were uploaded into the cloud. The data were collected for a continuous 30 days.
2.3. Data Consolidation and Cleansing
In the second phase, the two data formats were combined only for the common time collected through sensors and others through the mobile application. Both of the readings were consolidated using the aggregation method. The data were converted into the required format and then fed into Statistical Package for Social Sciences (SPSS) and downloaded as CSV for selected analysis.
2.4. Findings
In the third phase, the results were assessed based on (1) data analysis and (2) discussion. Data analysis was performed on the data using trend analysis, comparative analysis, and statistical analysis. A discussion was held and the results were analyzed for each research objective.
Figure 8 shows the location of data collection in different parts of the selected academic institute.
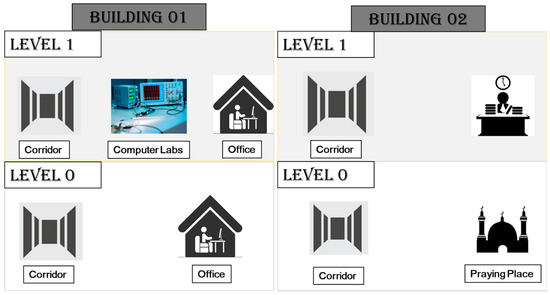
Figure 8.
Data collection locations.
The sensors were deployed in two buildings on two floors, as shown in the figure above. The sensor readings were recorded for CO2, temperature, and humidity levels at each location at different time intervals. The deployment of smart sensors was carried out in a joint office, a single-person office, corridors, a prayer place, a laboratory, and at a staff lounge. A manual reading was also computed at the same locations at fixed time intervals to validate both readings.
3. Results and Discussion
The data were collected at different locations, as mentioned in the last section, and the data were analyzed using SPSS. Figure 9 shows the overall carbon dioxide level recorded at different locations of both buildings on the campus.
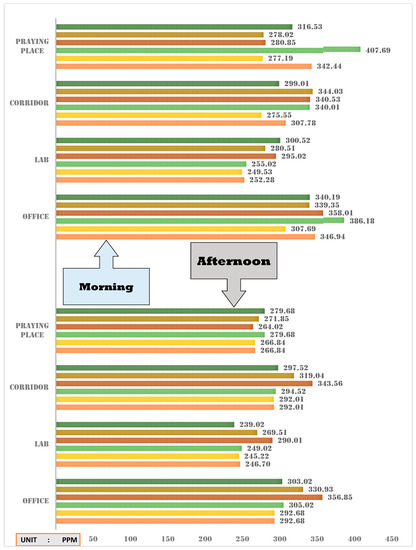
Figure 9.
CO2 measurement at different locations in the morning and afternoon.
Buildings in urban areas are one of the primary sources of CO2 emissions [39,40,41,42]. The values for CO2 concentration were recorded through a CO2 meter at four places: offices, a laboratory, corridors, and the praying area of the two buildings at various intervals in the morning and the afternoon. As evident from the results, significant carbon concentration values were recorded at offices in the morning and afternoon. Furthermore, a strong correlation was found between CO2 concentrations noted in offices and corridors in the morning compared to the laboratory and praying area. Such an increase in carbon concentration noted at the office and in the corridor can be justified by the possible excessive functioning of carbon-resourced sources in the mentioned areas. Similarly, there was a strong correlation between CO2 concentration recorded at the offices and in corridors in the afternoon. In all cases, the CO2 concentration did not exceed 500 ppm. Hence, all four locations ensured typical CO2 concentration levels found in occupied spaces with good air exchange, the standard range being 350 ppm to 1000 ppm. In the next phase, an overall assessment was conducted for all mentioned locations, as shown in Figure 10.
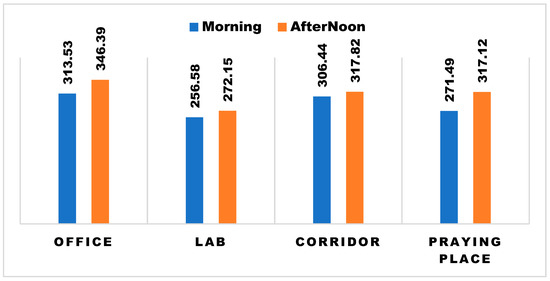
Figure 10.
Average CO2 measurement at different locations in the morning and afternoon.
Figure 10 portrays the average values of carbon concentration levels at different locations mentioned earlier. Although the CO2 concentration at the office was highest among all cases, the carbon concentration level did not exceed 350 ppm, showing that all four places ensured average outdoor air levels.
The data assessment of temperature levels was conducted in the next phase of this study. Figure 11 shows the temperature concentration at different locations in the buildings on the campus.
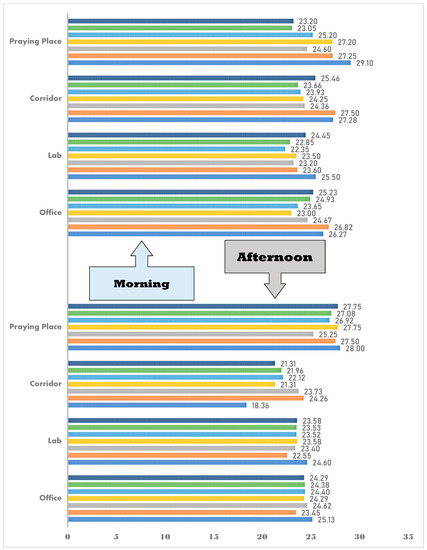
Figure 11.
Temperature level measurement at different locations in the morning and afternoon.
The above figure illustrates the values of temperature recorded at different locations mentioned earlier. It was observed that other than the praying area, the temperature levels at the other three places were in the range recommended as per ASHRAE standards [43]. The praying place’s temperature levels were recorded to exceed 25.5 °C in all readings. However, in the afternoon, all four places exceeded the recommended temperature level of 25.5 °C. Increasing values were noted twice. Therefore, an overall assessment was conducted for all mentioned locations in the next phase, as shown in Figure 12.
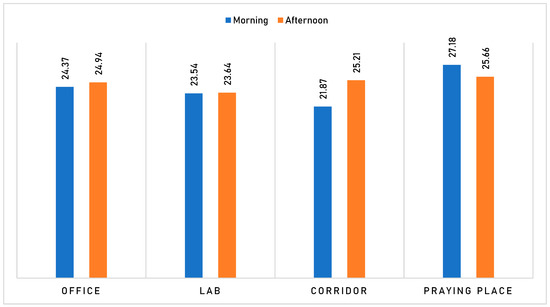
Figure 12.
Average temperature level measurement at different locations in the morning and afternoon.
However, Figure 12 shows that on average, all four places had temperature levels as recommended by ASHRAE standards, i.e., 22.5–25.5 °C, except for one instance at the praying area in the morning. It shows that all four places had fair values for temperature levels and were suitable for habitants’ thermal comfort.
The data assessment of humidity levels was conducted in the next phase of this study, and Figure 13 shows the humidity concentration at different locations in the buildings on the campus.
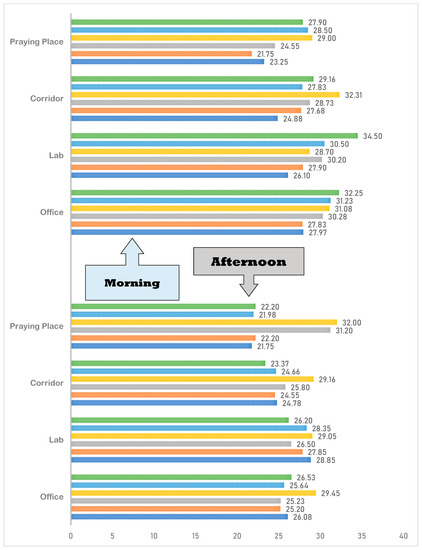
Figure 13.
Humidity level measurement at different locations in the morning and afternoon.
As prescribed by ASHRAE and USEPA for standards of humidity levels, the humidity should be below 50% ideally and below 60% or 65% in extreme cases. The values for humidity were recorded at different locations mentioned earlier. It was observed that the humidity level was well below 50% in all places, which shows that it was satisfactory as per the international standards. Then, an overall assessment was conducted for all mentioned locations in the last phase, as shown in Figure 14.
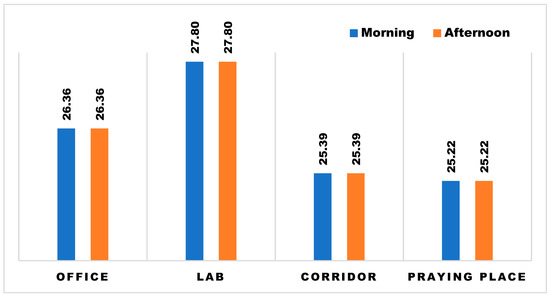
Figure 14.
Average humidity level measurement at different locations in the morning and afternoon.
Figure 14 shows that on average, in all four locations, the humidity levels recommended by ASHRAE and USEPA standards were satisfactory, as all were within the acceptable limits. Therefore, humidity control can be a productive strategy for preventing asthma and allergy symptoms among teachers, staff, and students in academic buildings.
A vulnerability map was generated in the final stage based on carbon dioxide concentrations observed in the study, as shown in Figure 15.
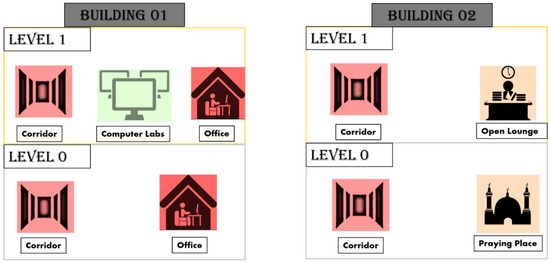
Figure 15.
CO2 footprint map.
It shows that the concentration was higher in offices due to their consistent usage as well as smaller size and fewer openings. In contrast, the praying place had a lower concentration of CO2. The timings that were selected were busy hours, but due to COVID-19 restrictions and the larger size and proper ventilation, there was a lower concentration. For corridors, as they are a passage, they also have a small width, lower number of openings, and less time students, staff, and faculty spend in them. Thus, it resulted in almost an equivalent concentration as offices. Therefore, it is suggested to create spaces with proper ventilation. The height and size of the room also play an essential role, so it should be considered while designing. Factors such as air-conditioning system, energy type, age of the building, number of people in the building, and building surroundings also play an important role in CO2 concentration. The approach applied in this case study can be used in any setting without any modification; the results may vary based on identified factors.
4. Conclusions
It is concluded that there were higher CO2 concentration traits in the offices observed in this study in the morning and in the afternoon than at the other three places, i.e., the laboratory, corridors, and praying area. This was due to the limited concentration of students at these locations during the pandemic. Therefore, in all cases, the CO2 concentration did not exceed 500 ppm. Hence, all four locations ensured typical CO2 concentrations were established per occupancy levels with adequate air interchange, with the standard range being 350 ppm to 1000 ppm for sufficient air exchange and living comfort. Similarly, the humidity level was well below 50% in all places, which shows that humidity was also normal. The average humidity level was below 50%, and under the extreme permissible value of 65%. Hence, it can be concluded that students, staff, and teachers performing academic activities in the building will not be vulnerable to asthma or allergy discomfort. In addition, except for the praying area, the other three places recorded temperature values in the range recommended per ASHRAE standards, i.e., 22.5 to 25.5 °C. Nonetheless, an exceedance was noted twice or thrice out of six readings.
This shows that on average, all four places had promising values for temperature levels and were suitable for the thermal comfort of students, staff, and teachers performing academic activities in the building. It is concluded that the institute in the case study provides a satisfactory environment to the users of the building. This vulnerability map designed after this study’s results may change when the institute is fully functional after the pandemic. If we monitor and adequately control the CO2 levels, it will provide support for improving buildings’ air quality and reducing the issues mentioned in this study. If the ventilation is reduced, it creates hot or cool air and there will be no air from outside. Thus, a reduction in ventilation creates a higher CO2 level. This approach requires active sensors with internet connectivity and a proper machine learning-based system that can monitor CO2 levels and generate warnings for areas with higher CO2 concentrations. The warning system will result in the safety of building users. In the future, an automated system can control ventilation and other electrical device usages to keep CO2 in the safe zone. The system can be integrated with the building management system to support firefighting and smoke detection systems. The use of cameras and IR sensors can also help identify human traffic, and can be used to turn on controlled ventilation in a specific area before CO2 concentration levels increase. The recorded sensor data will create a CO2 data bank that can provide designers an idea about ventilation design and help researchers analyze the relationship of other factors with CO2.
5. Recommendations and Suggestions
The limitation to this study is first the variable usage of offices, hallways, and gathering places depending on events. This study considered the busiest timings possible during COVID-19 restrictions. The selected institute has a central air-conditioning system with exhaust used as a ventilation mechanism. In addition, this research consolidated the readings if they were in the range of ±0.4.
University students, faculty, and staff play an essential role in determining the CO2 concentration in any academic building. The daily activities of students, faculty, and staff on the campus directs the CO2 levels and the sustainability path of the campus environment. It is recommended that the design of academic buildings be carried out with sustainability codes or using green building codes. It is suggested to utilize maximum benefit from natural resources like air and sunlight while designing academic buildings. A proper ventilation system can adequately reduce the CO2 on the campus. Similarly, proper lighting design can also reduce energy consumption, resulting in lower CO2 concentrations, especially in classrooms, laboratories, cafeterias, and offices.
In addition, this study suggests turning off the air-conditioning systems on the campus if not needed, instead managing personal comfort through clothing and coats rather than electronic appliances and heaters. Using lights only when necessary and powering down computers and monitors when not in use is also recommended. Setting temperatures to university guidelines and scheduling utilities to reduce energy consumption during unoccupied hours will also significantly impact the reduction in CO2 concentrations.
Author Contributions
Formal analysis, supervision, resources and validation, M.A.K.A.; Conceptualization and writing—original draft preparation, S.H.K.; methodology, writing—review and editing, project administration and software, Y.J. All authors have read and agreed to the published version of the manuscript.
Funding
This research received no external funding.
Institutional Review Board Statement
Not Applicable.
Informed Consent Statement
Not Applicable.
Data Availability Statement
The data can be reached on request from corresponding author.
Acknowledgments
The authors are thankful to the participants who helped collect the data for this research. This paper is supported under PSU Seed Project Grant No. 21, dated 26 February 2020. The authors are also thankful to Prince Sultan University, Riyadh, for providing a platform and financial support to conduct this study.
Conflicts of Interest
The authors declare no conflict of interest.
References
- Li, W.; Zhang, P. Developing the transformation of scientific and technological achievements in colleges and universities to boost the development of low-carbon economy. Int. J. Low-Carbon Technol. 2021, 16, 305–316. [Google Scholar] [CrossRef]
- Ürge-Vorsatz, D.; Harvey, L.D.D.; Mirasgedis, S.; Levine, M.D. Mitigating CO2 emissions from energy use in the world’s buildings. Build. Res. Inf. 2007, 35, 379–398. [Google Scholar] [CrossRef]
- Khahro, S.; Kumar, D.; Siddiqui, F.; Ali, T.; Raza, M.; Khoso, A. Optimizing Energy Use, Cost and Carbon Emission through Building Information Modelling and a Sustainability Approach: A Case-Study of a Hospital Building. Sustainability 2021, 13, 3675. [Google Scholar] [CrossRef]
- Lowe, R.J.; Huebner, G.; Oreszczyn, T. Possible future impacts of elevated levels of atmospheric CO2 on human cognitive performance and on the design and operation of ventilation systems in buildings. Build. Serv. Eng. Res. Technol. 2018, 39, 698–711. [Google Scholar] [CrossRef]
- Renau, J.; García, V.; Domenech, L.; Verdejo, P.; Real, A.; Giménez, A.; Sánchez, F.; Lozano, A.; Barreras, F. Novel Use of Green Hydrogen Fuel Cell-Based Combined Heat and Power Systems to Reduce Primary Energy Intake and Greenhouse Emissions in the Building Sector. Sustainability 2021, 13, 1776. [Google Scholar] [CrossRef]
- Sher, F.; Curnick, O.; Azizan, M. Sustainable Conversion of Renewable Energy Sources. Sustainability 2021, 13, 2940. [Google Scholar] [CrossRef]
- Kiwan, A.; Berg, W.; Fiedler, M.; Ammon, C.; Gläser, M.; Müller, H.-J.; Brunsch, R. Air exchange rate measurements in naturally ventilated dairy buildings using the tracer gas decay method with 85Kr, compared to CO2 mass balance and discharge coefficient methods. Biosyst. Eng. 2013, 116, 286–296. [Google Scholar] [CrossRef]
- Omrany, H.; Soebarto, V.; Sharifi, E.; Soltani, A. Application of Life Cycle Energy Assessment in Residential Buildings: A Critical Review of Recent Trends. Sustainability 2020, 12, 351. [Google Scholar] [CrossRef]
- Garbbatiss, J. Construction Fever’ Responsible for One Fifth of China’s CO2 Emissions; Carbon Brief: London, UK, 2020. [Google Scholar]
- Mukhtar, M.; Ameyaw, B.; Yimen, N.; Quixin, Z.; Bamisile, O.; Adun, H.; Dagbasi, M. Building Retrofit and Energy Conservation/Efficiency Review: A Techno-Environ-Economic Assessment of Heat Pump System Retrofit in Housing Stock. Sustainability 2021, 13, 983. [Google Scholar] [CrossRef]
- Asif, M. Role of Energy Conservation and Management in the 4D Sustainable Energy Transition. Sustainability 2020, 12, 6. [Google Scholar] [CrossRef]
- Reducing CO2 Emissions in the Building Sector: A Push for New Buildings or Discovering the Potential in Existing Infrastructure? The Case of Budapest; Department of Environmental Science Policy: Budapest, Hungary, 2020; p. 1.
- Robinson, O.; Kemp, S.; Williams, I. Carbon management at universities: A reality check. J. Clean. Prod. 2015, 106, 109–118. [Google Scholar] [CrossRef]
- UCL Energy Institute. Study into Mitigating Effects of Higher CO2 Levels on Productivity Receives Widespread Coverage; University College London: London, UK, 2018; Available online: https://www.ucl.ac.uk/news/2018/dec/carbon-dioxide-can-impact-human-cognitive-performance (accessed on 1 July 2021).
- Jurado, S.R.; Bankoff, A.D.P.; Sanchez, A. Indoor Air Quality in Brazilian Universities. Int. J. Environ. Res. Public Health 2014, 11, 7081–7093. [Google Scholar] [CrossRef] [PubMed]
- Musarat, M.; Alaloul, W.; Liew, M.; Maqsoom, A.; Qureshi, A. The Effect of Inflation Rate on CO2 Emission: A Framework for Malaysian Construction Industry. Sustainability 2021, 13, 1562. [Google Scholar] [CrossRef]
- Trovato, M.R.; Nocera, F.; Giuffrida, S. Life-Cycle Assessment and Monetary Measurements for the Carbon Footprint Reduction of Public Buildings. Sustainability 2020, 12, 3460. [Google Scholar] [CrossRef]
- Lee, J.; Tae, S.; Kim, R. A Study on the Analysis of CO2 Emissions of Apartment Housing in the Construction Process. Sustainability 2018, 10, 365. [Google Scholar] [CrossRef]
- Stott, R. UIA Commits to Zero Carbon Emissions with ‘2050 Imperative’. 2014. Available online: https://www.archdaily.com/537377/uia-commits-to-zero-carbon-emissions-with-2050-imperative#:~:text=A%20statement%20released%20by%20the,CO2%20emissions%2C%20mostly%20from%20buildings.&text=This%20provides%20an%20unprecedented%20opportunity,out%20CO2%20emissions%20by%202050.%22 (accessed on 1 July 2021).
- Rieser, A.; Pfluger, R.; Troi, A.; Herrera-Avellanosa, D.; Thomsen, K.; Rose, J.; Arsan, Z.; Akkurt, G.; Kopeinig, G.; Guyot, G.; et al. Integration of Energy-Efficient Ventilation Systems in Historic Buildings—Review and Proposal of a Systematic Intervention Approach. Sustainability 2021, 13, 2325. [Google Scholar] [CrossRef]
- IEA. Each Country’s Share of CO2 Emissions; Union of Concerned Scientists: Cambridge, UK, 2018; Available online: https://www.ucsusa.org/global-warming/science-and-impacts/science/each-countrys-share-of-co2.html#.XDdn3y10c1I (accessed on 16 July 2008).
- Bonino, S. Carbon Dioxide Detection and Indoor Air Quality Control. Occup. Health Saf. 2016, 85, 46–48. [Google Scholar] [PubMed]
- The Keeling Curve. 2020. Available online: https://sioweb.ucsd.edu/programs/keelingcurve/ (accessed on 1 July 2021).
- Rahman, H.; Han, H. Bayesian estimation of occupancy distribution in a multi-room office building based on CO2 concentrations. Build. Simul. 2018, 11, 575–583. [Google Scholar] [CrossRef]
- Tagliabue, L.C.; Manfren, M.; Ciribini, A.L.C.; De Angelis, E. Probabilistic behavioural modelling in building performance simulation. Energy Build. 2016, 128, 119–131. [Google Scholar] [CrossRef]
- Zuraimi, M.; Pantazaras, A.; Chaturvedi, K.; Yang, J.; Tham, K.W.; Lee, S. Predicting occupancy counts using physical and statistical Co2-based modeling methodologies. Build. Environ. 2017, 123, 517–528. [Google Scholar] [CrossRef]
- Mckenna, P. That Global Warming Hiatus? It Never Happened. Two New Studies Explain Why; Inside Climate News: New York, NY, USA, 2018. [Google Scholar]
- Gan, V.J.; Cheng, J.C.; Lo, I.M.; Chan, C.M. Developing a CO2-e accounting method for quantification and analysis of embodied carbon in high-rise buildings. J. Clean. Prod. 2017, 141, 825–836. [Google Scholar] [CrossRef]
- Joelsson, A. Primary Energy Efficiency and CO2 Mitigation in Residential Buildings. Ph.D. Thesis, Mid Sweden University, Sundsvall/Östersund, Sweden, 2008. [Google Scholar]
- Barton, R. 4 Good Reasons to Monitor CO2 Levels. 2018. Available online: https://www.rs-online.com/designspark/4-good-reasons-to-monitor-co2-levels (accessed on 1 November 2018).
- Fisk, W.J.; Faulkner, D.; Sullivan, D.P. A pilot study of the accuracy of CO2 sensors in commercial buildings. In Proceedings of the IAQ Conference, Baltimore, MD, USA, 15–17 October 2017; American Society of Heating, Refrigerating and Air Conditioning Engineers, Inc.: Atlanta, GA, USA, 2008; pp. 1–11. [Google Scholar]
- Ürge-Vorsatz, D.; Koeppel, S.; Mirasgedis, S. Appraisal of policy instruments for reducing buildings’ CO2 emissions. Build. Res. Inf. 2007, 35, 458–477. [Google Scholar] [CrossRef]
- Franco, A.; Leccese, F. Measurement of CO2 concentration for occupancy estimation in educational buildings with energy efficiency purposes. J. Build. Eng. 2020, 32, 101714. [Google Scholar] [CrossRef]
- Aboulnaga, M.; Moustafa, M. Sustainability of higher educational buildings. Renew. Energy Environ. Sustain. 2016, 1, 28. [Google Scholar] [CrossRef][Green Version]
- Gas Sensing Solutions Helps Monitor CO2 Levels for Health and Wealth. 2019. Available online: https://www.rs-online.com/designspark/gas-sensing-solutions-helps-monitor-co2-levels-for-health-and-wealth (accessed on 1 July 2021).
- Adenle, Y.A.; Alshuwaikhat, H.M. Spatial Estimation and Visualization of CO2 Emissions for Campus Sustainability: The Case of King Abdullah University of Science and Technology (KAUST), Saudi Arabia. Sustainability 2017, 9, 2124. [Google Scholar] [CrossRef]
- Ritchie, H.; Roser, M. Saudi Arabia: CO2 Country Profile. 2021. Available online: https://ourworldindata.org/co2/country/saudi-arabia (accessed on 10 June 2021).
- Climate Transparency. Climate Transparency Report. 2020. Available online: https://www.climate-transparency.org/g20-climate-performance/the-climate-transparency-report-2020 (accessed on 10 June 2021).
- Liu, Z.G.; Wang, S.S.; Liu, J.Y.; Liu, F.; Fu, X.L. Analysis of factors affecting CO2 emissions by civil buildings in China’s urban areas. Int. J. Low-Carbon Technol. 2013, 10, 460–463. [Google Scholar] [CrossRef]
- Surahman, U.; Kubota, T.; Higashi, O. Life Cycle Assessment of Energy and CO2 Emissions for Residential Buildings in Jakarta and Bandung, Indonesia. Buildings 2015, 5, 1131–1155. [Google Scholar] [CrossRef]
- Kim, T.H.; Chae, C.U.; Kim, G.H.; Jang, H.J. Analysis of CO2 Emission Characteristics of Concrete Used at Construction Sites. Sustainability 2016, 8, 348. [Google Scholar] [CrossRef]
- Roh, S.; Tae, S. Building Simplified Life Cycle CO2 Emissions Assessment Tool (B-SCAT) to Support Low-Carbon Building Design in South Korea. Sustainability 2016, 8, 567. [Google Scholar] [CrossRef]
- Jaakkola, J. Temperature and Humidity. In Safe and Healthy School Environments; Oxford University Press: Oxford, UK, 2006. [Google Scholar]
Publisher’s Note: MDPI stays neutral with regard to jurisdictional claims in published maps and institutional affiliations. |
© 2021 by the authors. Licensee MDPI, Basel, Switzerland. This article is an open access article distributed under the terms and conditions of the Creative Commons Attribution (CC BY) license (https://creativecommons.org/licenses/by/4.0/).