Abstract
Planting multifunctional trees (e.g., fruit species) in cities can promote genetic conservation, economic activity, ecosystem services, and social cohesion. However, in Indonesia, the relationship between the abundance of fruit tree species and different city characteristics, including their involvement in the national smart city project, is still unknown. In this study, published reports and field surveys were used to evaluate the fruit tree distribution and its relationship with the characteristics of 224 of 514 Indonesian cities in order to identify tree species for multifunctional city greenery. This is the first study on the distribution of fruit tree species at the national level. The study identified 151 fruit species of 90 genera and 40 families, including large-sized fruits, such as avocados, breadfruit, coconuts, durians, jackfruit, and mangos. On average, cities contained 54 tree species, of which 21 (38.9%) were fruit trees. These findings indicate that cities are important contributors to the genetic conservation of local fruit trees, which can be further evaluated as new city greenery. However, a city’s involvement in the smart city project bore no relationship (p > 0.05) with the number of identified fruit species. Conversely, non-fruit species tended to be more diverse in smart cities. Since the presence of fruit species is associated with the city population, geographic position, climate, altitude, and attitude towards the fragility of sustainable conservation, introducing and maintaining these species as city greenery requires advocacy to city stakeholders.
1. Introduction
Cities in developing countries are the most dynamic landscapes due to rapid changes in urbanization, demographics, economic activities, and land use [1,2,3,4]. In Indonesia, the urbanization rate is approximately 20–40% per annum [3], leading to increasing issues involving the environment, sustainable landscape, and food and nutrition security, especially for the poor. In such situations, trees, as soft elements of the city landscape, can be viewed from a broader perspective as providing not only aesthetic and ecological functionality but also ecosystem services, city identity, and nutrition for the community.
On the other hand, there is an increasing trend in city development to adopt the smart city concept, including in Indonesia. The Indonesian government has mandated the implementation of the smart model in 100 cities by 2045 [5,6], an initiative that began in 2011 [7]. The smart city is a global concept that has been widely adopted by city planners to address the complexity of urban areas [8,9]. In this concept, cities utilize real-time information and communication technologies (ICT) to unify governance, people, and city resources for the betterment of their social climate, economy, environment, and living standards [9,10,11,12]. Nevertheless, a substantial critique of the model is how nature and city stakeholders benefit [12]. In Indonesia, residents are hopeful that city managers will plant multifunctional trees, especially fruit trees that provide food.
Therefore, there is still room for improvement in the smart city model [8,9,12]. Cities can evolve along different pathways depending on their resources and citizenry. Angelidou et al. [13] recommended harmonizing the smart city with local heritage. In this context, the Indonesian smart city should be in harmony with the Indonesian vision, particularly in relation to biodiversity conservation [14], food security [15], and cultural heritage [16]. As in some other countries, many Indonesians imagine cities as miniature versions of paradise, i.e., cities flourishing with evergreens, flowers, and fruits, rich in biodiversity and in ecological harmony [17,18]. This vision is inspired by the country’s status as a reservoir of “mega genetic resources”, as it consists of more than 17,000 tropical islands [14]. The long history of peoples’ association with these genetic resources has fostered their economic, socio-cultural, and ecological perspectives [14]. However, incorporating the Indonesian vision into the smart city model is not simple because, to some extent, there is still a gap between the local and national levels of the policy (see Vujanovic [19]).
Fruit tree species (FTS) in the city can be viewed as multifunctional greenery because they provide nutrients, ecosystem services, social cohesion, and genetic conservation. FTS are available sources of minerals and functional food [20,21]. Arifin et al. [22] reported that the average fruit consumption in Indonesia is 18.8 kg per capita per annum. Due to limited access to the market, the consumption rate is 27% of the global recommendation, which is about 70 kg. Moreover, FTS support birds [23,24] and serve other ecological functions [24,25,26,27,28,29]. According to Fadrikal et al. [30] and Ghifari et al. [23], of 27 songbird species found in Indonesian parks, 41–67% are insectivores, 7% are nectarivores, 14–19% are graminivores, and 11–33% are omnivores. Birds are cultural attractants for Indonesian parks because listening to bird song is a form of mental healing [31,32]. Despite these benefits, the abundance of FTS, especially underutilized FTS, has tended to decline in both rural and urban areas for complex reasons [33,34,35]. In Indonesia, genetic conservation of trees is mainly forest-based and community-based in that they are relatively vulnerable due to agricultural intensification, logging, fire, and lack of economic incentives [35,36,37,38]. There is a need for an initiative to conserve FTS resources, such as the introduction of multifunctional greenery to urban areas. According to Pratama et al. [35], compared to rural society, urban communities have a greater appreciation for underutilized fruits in terms of their use and economic incentives.
Although planting FTS is not a new practice in Indonesian cities [33,34], many pros and cons remain. In some developed countries, planting FTS in the city is a good initiative for stimulating societal relationships, ensuring adequate nutrient consumption, and increasing species awareness for conservation [39,40,41,42,43]. According to Colinas et al. [43], expansion of FTS into public areas promotes the bonding of families and friends, provides inexpensive food for the community, and improves pro-environmental actions. In developed countries, the introduction of FTS to the city has been supported by wide public participation through Android apps developed by local governments, such as Fruitmap, and open databases that assist in fruit tree selection based on risk assessment [40,41,44,45]. On the other hand, Indonesia still lacks a formal city policy on the adoption of FTS. The disadvantages mainly arise from the fact that many tropical trees have very large fruits, such as breadfruit, coconuts, durians, and jackfruit [46]. Moreover, limited information on species safety, agroecological suitability, and productivity has prompted lengthy debates among horticulturists and city planners before the formal adoption of an FTS introduction strategy. In particular, city planners require an understanding of tree characteristics related to horticulture, hazards, and advantages before establishing urban greenery [47,48].
In this study, a metapopulation evaluation was conducted on Indonesian city landscapes. Tree species were evaluated to map their current distribution for a better understanding of the utilization and conservation of FTS biodiversity and the attendant restoration activities, as stated by Lepczyk et al. [49]. The distribution of fruit species was evaluated in relation to the Indonesian city’s agroecology, its position relative to Wallace’s Line, city population, and city vision, with the goal of enriching the smart city model with multifunctional FTS trees. The data in the presented FTS list can be used as a reference for city stakeholders in other tropical cities.
2. Materials and Methods
2.1. Study Design
The data were collected from April to October 2019 from all 34 Indonesian provinces. Data collection was performed in two steps (Figure 1). The first step was collecting data on FTS distribution through a literature review (Figure S1). Publications related to fruit tree species in Indonesian cities as of 2019 were obtained through online searches in GARUDA (http://garuda.ristekbrin.go.id (accessed on 5–15 April 2019)), the main Indonesian journal database, and Science Direct (https://www.sciencedirect.com (accessed on 20 April 2019)). The searched keywords were “park vegetation”, “open green space”, “urban forest”, “flora identity”, “city landscape”, and “fruit tree”, in combination with the city name or “Indonesia”. The search resulted in 194 prospective reports. The reports were further screened to identify tree species on roadsides and in city parks, urban forests, community forests, and city gardens; studies performed in nurseries were excluded. A total of 44 reports were retained, encompassing 36 cities with their tree species [50,51,52,53,54,55,56,57,58,59,60,61,62,63,64,65,66,67,68,69,70,71,72,73,74,75,76,77,78,79,80,81,82,83,84,85,86,87,88,89,90,91,92,93].
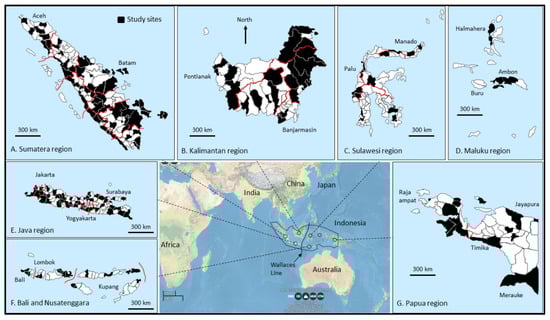
Figure 1.
Study sites (shaded areas), island group, and Wallace’s Line in Indonesia.
Second, tree species on roadsides and in city parks were identified by means of a car survey (Figure 2). Two methods were used for the car survey: an indirect method using “Instant Google Street View-GSV” (www.instantstreetview.com (accessed on 2 May–2 October 2019)) [94] and direct field survey methods; all methods are listed in Table S1. Before the survey, cities in a province representing different altitudes were mapped and sampled. Tree images for species identification were collected from primary, secondary, and tertiary road segments (Figure 2). The roads were classified as described by Pandey and Lalamentik [95]. Highways were excluded from sampling. The survey route formed circles, starting from one road and returning by an alternate route. For large cities, such as Jakarta, Tangerang, and Surabaya, the routes comprised five or more circles (Figure 2A). Trees on private property were recorded if their growth encroached on pedestrian walkways or city parks (Figure 2B). To minimize sampling bias due to larger areas in some surveys, which are naturally expected to have more species than smaller areas, the sampling areas of road segments were predetermined, and the length of each road segment was about 7–10 km. First, the GSV survey was performed. We excluded cities without street images, sites where imagery was out of date (dated before 2016), and sites where tree images were not clear. In total, we successfully evaluated 160 cities using GSV. The remaining 28 cities were evaluated using direct field surveys.
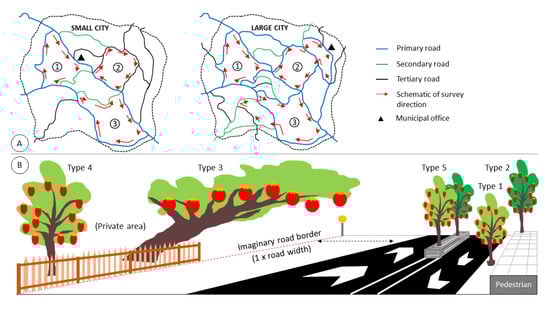
Figure 2.
Assessment flow illustration in a small and large city (A) and scope of tree identification (B). Trees growing next to the main road (Type 1), growing along a pedestrian path (Type 2), having a canopy bending toward a pedestrian path (Type 3), growing outside the road line but with a twig bending over the road or pedestrian path (Type 4), and growing on a road island (Type 5) were recorded.
2.2. Tree Data
Our initial list of fruit species in Indonesia is in accordance with references [46,96,97,98]. A fruit tree is defined as a self-standing or climbing perennial that produces edible fruit/nuts/beans, consumed either fresh or after cooking, with a height of three meters or more in nature. The studied fruit trees included legume trees, such as jengkol (Archidendron jiringa) and petai (Parkia speciosa), trees with edible nuts in the Arecaceae family, climbing vines (Passiflora edulis and members of the Vitaceae family), and pineapple (Ananas comosus). Cucurbitaceae, palm oil, and Zingiberaceae were excluded.
Tree species listed in a report for a particular city were adopted as is, while those found during car surveys were identified based on the leaf, flower, fruit, stem, and canopy morphologies [46,96]. Unidentified species were captured as images and identified by experts at IPB University, Bogor, Indonesia. The number of individual species was not counted due to technical difficulties.
Potential hazards and the conservation status of the tree species were obtained from references [46,96,97,98] and the Urban Forest Ecosystems Institute (https://ufei.calpoly.edu (accessed on 10 April 2020)). The hazard criteria were in accordance with Mukhlison [99] with modification; eleven criteria were used, i.e., drop rate of young fruit, dropped fruit causes slippery conditions, tree canopy/leaves have thorns, stems have thorns, fallen leaves cause serious injury, rolling distance of dropped fruit, the ease with which mature fruit drops, visibility of fruit, fruit has thorns, hardness of fruit, and fruit size. Hazard scores of 1, 3, and 5 were assigned according to the nature of the tree and the incremental level of risk (Table S2). For example, stems without thorns received a score of 1, those with a few thorns received a score of 3, and those with many thorns received a score of 5. Total scores of <22, 22–33, 34–44, and >44 correspond to hazard levels of 1 (very low), 2 (low), 3 (medium), and 4 (high hazard), respectively.
2.3. City Data
A “city” is defined as central to a municipality (Kota in Indonesia) or regency (Kabupaten). The study involved 224 out of 514 cities in Indonesia (Table S3). The term “city” refers to a “city proper” according to the United Nations [100]. The evaluated city characteristics were its involvement in the smart city project [5,6], geographic position (Java/outside Java, altitude, climatic zone, island group, province), location relative to Wallace’s Line [101,102], city size, and city vision. According to Bacon et al. [102], Wallace’s Line represents geological and climatic history, separating Indonesian flora into three groups: Java, Sumatera, and Kalimantan regions are the first group; Sulawesi, Maluku, Bali, and Nusa Tenggara regions are the second group, and Papua is the third group (see Figure 1). The biogeography of Wallace’s Line has attracted the attention of many researchers because of the differences in species diversity due to long geological processes and differences in the interactions of civilizations between regions [101,102,103,104].
City size was classified as small, medium, large, metropolitan, or megapolitan, corresponding to population sizes of 50–100 K, 100–500 K, 500 K–1 M, 1–5 M, and >5 M, respectively. City visions were derived from their designation or motto as described in official websites and Wikipedia entries (https://id.wikipedia.org (accessed on 10 Oct 2019)). In this context, a city vision is an inspirational statement that reflects city resources, the focus of services, the focus of development, desired atmosphere, and future aspirations for all relevant stakeholders. In cases where a city had more than one motto, such as Yogyakarta, we selected the most prominent one by subjective judgment. Cities without a vision or a vision that was difficult to categorize were classified as cities with an unclear vision. City visions were grouped into nine categories: agrarian, business, cultural, educational, heritage, industrial, touristic, and unclear vision.
Ecological data, including altitude, precipitation, rivers, and wind velocity, were obtained from the Statistical Bureau of the relevant regency or municipality (http://www.namecity.bps.go.id). These data were collected to determine the land suitability for growing fruit species [105]. City altitude was classified as low (LA; 0–600 m) or high (HA; 601–1500 m), referring to the classification of Junghuhn [106]. Monthly precipitation (MP) was grouped into wet (MP > 100 mm) and dry months (MP < 60 mm), and then the cities were classified according to the Q ratio (dry to wet months) based on the Schmidt–Ferguson climate classification [107]. Cities with Q < 1 were defined as wet cities (A+B+C+D climate zones), and those with Q > 1 were designated as dry cities (E+F+G climate zones). Tree species and city distribution data were plotted in quadrants defined by city altitude (low/high) and climatic classification (wet/dry).
2.4. Data Analysis and Limitations
Data were analyzed using ANOVA (F test), with the number of FTS found in a city as the dependent variable against city characteristics as independent variables, and variables with significant effects were further tested using the Tukey test at a 95% confidence level (p < 0.05). In some cases, additional testing using p < 0.1 was performed to explore the “tendency of the effect”. Correlation among bivariate variables of city characteristics (e.g., smart city project, Java/outside Java, Wallace’s zone, altitude, climatic zone, city population, city vision, island group, province) was evaluated using the Pearson test. In this statistical test, for example, the nine city vision categories were transformed into numerical categories (Table S3). If the Pearson test of the bivariate variables was significant (p value ≤ 0.05), the absolute correlation value of 0.10–0.30, 0.31–0.50, and 0.51–1.00 were categorized into the strength of association as weak, medium, and strong correlation, respectively (https://statistics.laerd.com (accessed on 16 June 2021)).
A multiple regression analysis was conducted to evaluate the effect of city characteristics on the number of tree species, in accordance with Khamis et al. [108]. The test included variables of city categories that contributed significantly to the number of FTS and independent after performing the bivariate correlation test. Durbin-Watson test was used to detect autocorrelation; autocorrelation is commonly used to detect randomness in data (https://www.ncss.com (accessed on 16 June 2021)). All statistical analyses were performed using Minitab 14 software (Minitab LLC, State College, PA, USA). A discussion with experts was carried out at Bogor on 8–9 November 2019 and involved 24 horticulturists, city authorities, and urban planners.
3. Results
3.1. Species Distribution, Status, and Potential Hazards
Among the 224 studied cities, 151 fruit tree species (FTS) of 90 genera and 40 families (Table S4) were identified, accounting for approximately 75% of the 203 fruit tree species recorded in Indonesia [46,96,97,98]. Anacardiaceae, Moraceae, and Fabaceae species were the most prevalent, with 17, 13, and 11 species, respectively (Figure 3). Based on the frequency distribution, the FTS were grouped into four categories: very common (18 species), common (18 species), less common (32 species), and rare (83 species) (Table S4). Twenty-five species were found in a single city, indicating that these species may be specific to a given location. According to species status, 31 species were classified as commercial, 80 species were endangered, and 40 species were rare.
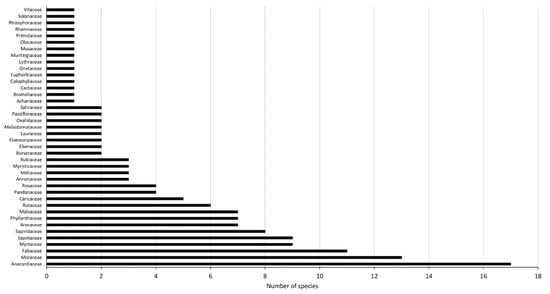
Figure 3.
The number of fruit tree species in each family found in the study.
The number of FTS was not evenly distributed among cities, provinces, or islands. In a given province, the minimum number of FTS species was 2–31, and the maximum number was 15–46, with an average of 11.7–35.2 species (Table 1). In cities, the proportion of FTS relative to total tree species ranged from 29.49% to 54.16%. Surakarta City had the most FTS (46 species), while Blangkejeran-Gayolues Regency had the fewest (2 species) (Table S6). The genetic diversity of FTS in cities and provinces is still unknown, as this parameter was not measured in the present study. The variation in the FTS number between cities may be due to differences in city land area or sampling effects [109,110]. City sizes in Indonesia range from 16 to 45,075 km2. In the absence of human intervention in planting, according to Hill et al. [110], the sampling effect applies to species that are distributed randomly, so more species are recorded in large areas according to the law of probability. A future study on the FTS distribution in a city to determine whether it follows ecological or non-ecological processes could provide clarification on this issue.

Table 1.
Number of fruit and total tree species identified in Indonesian cities by province.
The distribution of FTS in cities is unlikely to be a consequence of a systematic conservation program. However, according to the Homeland Ministry [111], each city should develop iconic flora as part of a strategy to promote economic development, culture, identity, and genetic conservation. According to this regulation, cities within a province are mandated to maintain iconic province species and iconic regency/municipal species. FTS have been adopted as iconic species in 10 of 34 provinces (29.4%) and 55 of 514 regencies/municipalities (10.7%), but only 43 species were unique to a city because some cities adopted similar species (Table S5). In this regard, national policy on tree species conservation programs needs to be strengthened.
In most capital cities of provinces (6 of 10 provinces) and capital cities of regencies/municipalities (32 of 55 cities), iconic FTS were located along roadsides or in city parks (data not shown). The remaining trees were planted in special conservation sites or on farmlands. Interestingly, statues of iconic fruits were built in the absence of living trees in many cities, such as Jakarta, Subang, and Malang Cities, with snake fruit, pineapple, and apple, respectively. The hazardous nature of spiny trees such as snake fruit and pineapple might lead some local governments to plant these particular species at conservation sites. According to Mukhlison [99], Stelechocarpus burahol, as the iconic species in Yogyakarta city, was absent from roadsides and city parks but found in 30% of urban forest sites. Syahadat et al. [109] found that starfruit, the city icon for Depok-West Java, was only found in Pancoran Mas Park and absent from other parks. In the present study, Bogor City was found to contain the iconic canary nut (Canarium vulgare Leenh.) on the roadsides of almost all roads. Approximately 90% of noniconic FTS were found on roadsides, road islands, and city parks. These trees grew large-sized fruits such as avocados, breadfruit, cainitos, coconuts, guavas, jackfruit, mangos, papayas, soursops, and sweetsops (Table S4). In sum, the decision to plant iconic and noniconic species in cities appears to be voluntary.
The presence of large-sized fruits along roadsides was notable in some cities, such as Jakarta and Surabaya (Figure 4). The hazard scores based on criteria for fruit and tree characteristics were classified into three levels (Figure 5). However, the hazard level, as an accumulation of criterion scores, revealed that no species was categorized as a high hazard (Level 4) (Table S2). Based on fruit characteristics, the main hazards were rolling fruit (>2 m), fruit-caused slips, and falling fruit, represented by 67, 49, and 16 species, respectively. There were 70 nonhazardous FTS species (Level 1), 76 low-hazard species (Level 2), and 5 medium-hazard species (Level 3). All species in the Durio genus that produced sharp spiny fruit were grouped into Level 3. Some species belonging to Level 2 had total assessment scores close to Level 3, such as all Arthocarpus and all Mangifera spp., avocados, coconuts, cocoas, pomelos, and snake fruit.
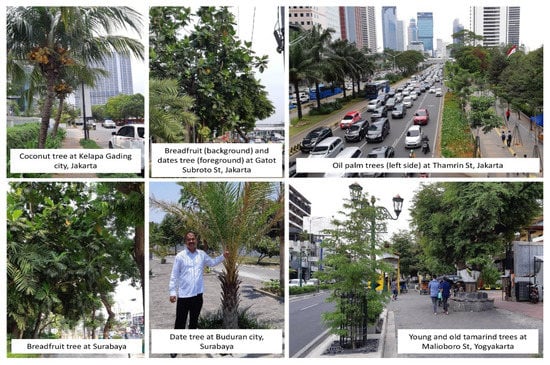
Figure 4.
Examples of fruit tree images in Jakarta, Surabaya, and Yogyakarta.
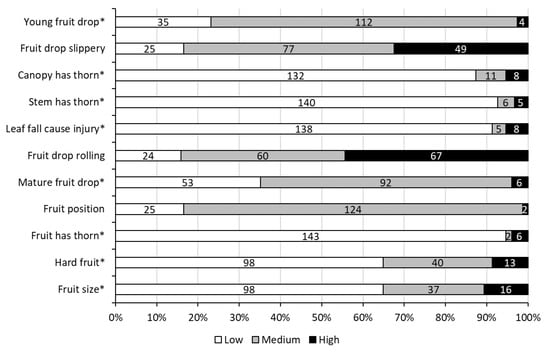
Figure 5.
Hazard scores of fruit species based on criteria. Values in the bars for each criterion represent the actual number of fruit species. Hazards labeled “*” can be minimized through horticultural techniques.
Large-sized fruits can endanger motorbike and car passage, but some citizens take action to minimize the hazards of falling fruit. Fruit drop is stimulated by physiological and environmental factors [112] but can be manipulated [113]. Betawinese residents of South Jakarta harvest young coconuts for beverages before they drop naturally at the mature stage. In Bogor City, the Sundanese use ropes to secure durian fruit, a 1–6 kg fruit with very sharp thorns on the skin, when they are young to protect against free fall. Balinese people in Bangli harvest young jackfruit along Kintamani Street to make lawar, a special Balinese dish similar to gudeg in Yogyakarta; as a result, not many young fruit drop. These practices can explain why trees producing large-sized fruit still exist in some cities. It is unknown how locals protect falling fruits from disease and pests, including fruit-eating rodents [114].
3.2. The Smart City Project and City Characteristics
Indonesian cities vary in the characteristics defined in this study (Table 2), and five out of nine characteristics affected the abundance of FTS (p of F test < 0.05). These characteristics are related to geographic distribution (Java vs. non-Java, Wallace’s Line zone, altitude, island group, and province group). City involvement in the smart project and city vision had no significant correlation with the number of fruit species in the region, although smart cities tended to have a higher number of FTS (p < 0.100). Conversely, involvement in the project increased the number of non-FTS and total tree species planted (p < 0.005). The low correlation between FTS and smart cities needs further study. It is possibly due to the limited number of cities evaluated in the present study (67 of 100 cities), of which 56.71% were located in Java. Limited coverage of the studied road segments in particular cities or diversity in agroecology (precipitation, altitude, flooding, etc.) are other possible factors. Faeth et al. [115] proposed the context of a human-controlled strategy to understand the plant species abundance in urban areas. It would be interesting to evaluate the perceptions of city authorities in terms of FTS abundance in future work.
Table 2.
Average number of tree species in a city according to city characteristics.
Cities located in Java had higher numbers of FTS than those outside Java (28.6 vs. 21.0) (p = 0.000; Table 2), irrespective of their involvement in the smart city project. Cities outside Java, with the exception of those in Sumatera, had 12.4–18.2 fruit species. Cities in Sumatera had 8.2–14.0 FTS, more than the other islands outside Java. Cities in Papua and West Nusa Tenggara islands had low numbers of FTS (13.9 and 12.4 species, respectively).
Cities in the western zone contained higher numbers of tree species (FTS and non-FTS) than those in the eastern zone (Table 2), which agrees with the floristic characterization based on Wallace’s Line described by previous authors [101,102]. Wallace’s Line separates the Indonesian islands into western and eastern zones [102]. In the western zone, high species numbers were identified in Java and Sumatera Islands, which are well known as humid tropical regions [116]. On the other hand, low numbers of tree species in the eastern zone are presumably due to the low precipitation in cities in Sulawesi, Maluku, and West Nusa Tenggara islands. Van Welzen et al. [101] noted that the zone west of Wallace’s Line has a humid climate, in contrast to the dryer eastern zone. Although we hypothesize that Wallace’s zoning has contributed to differences in FTS between cities, it is difficult to determine whether it is the only cause. Indeed, some FTS are native to each bioregion (Table S4). It is well known that FTS, especially those that are exotic or have high economic value, have a strong relationship with human population migration between regions [102], which is exemplified by food crops such as Araceae [104]. However, for horticulturalists, Wallace’s zoning may be one consideration in planting FTS in a city. A more in-depth study of FTS diversity based on Wallace’s zoning would be of interest.
In Indonesia, land suitability for growing perennial crops such as fruit species is usually based on altitude and climatic class. Low altitude means higher average air temperatures [106]. In the present study, cities located at lower altitudes (<600 m above sea level) had a higher number of FTS than those at higher altitudes (23.5 and 16.9 species, respectively; Table 2). Clustering cities based on climatic class yielded no significant relationship with FTS (p = 0.241) but affected the number of non-FTS (p < 0.05) (Table 2), although wetter cities (208 cities) had more FTS than dry cities (16 cities) (Table S3).
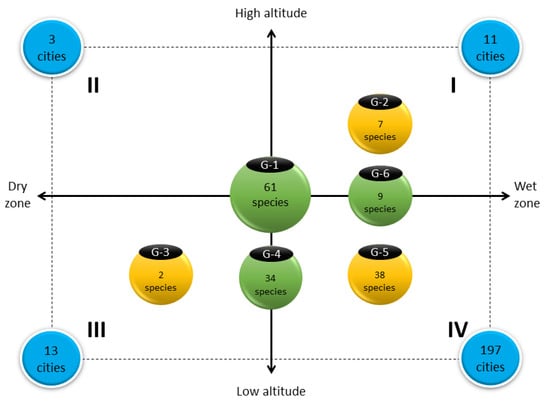
Figure 6 shows the studied cities distributed into four quadrants. Cities with a wet climate at high altitude are in quadrant I, dry cities at high altitude are in quadrant II, dry cities at low altitude are in quadrant III, and wet cities at low altitude are in quadrant IV, corresponding to 11, 3, 13, and 197 cities, respectively. Plotting FTS according to cities’ precipitation and altitude data clustered FTS into six groups. Group 1 contains 61 FTS that grow in the agroclimate of all cities. Group 2 represents 7 FTS that grow in cities of quadrant I. Groups 3 (2 FTS) and 5 (38 FTS) have FTS that are exclusively found in cities in quadrants III and IV, respectively. Group 3 contains Ficus carica (Moraceae) and Ziziphus mauritiana Lam. (Rhamnaceae). Group 4 FTS are suitable for low-altitude cities (quadrants III and IV) irrespective of precipitation, and Group 6 is suitable for wet cities (quadrants I and IV), irrespective of altitude.
This grouping requires further evaluation because, among 224 cities, 55.36% were close to rivers, 55.36% were close to the coastline, and 27.68% (62 cities) were both coastal and close to a river (Table S3). Cities close to water bodies mostly have shallow water tables, for example, Simpangampek-Pasaman Barat Regency, Dumai City, Sendawar-Kutai Barat Regency, Tanjung Selor-Bulungan Regency, and Kwandan-Gorontalo Utara Regency. A combination of low altitude, the presence of a river, and an ocean waterfront rendered some cities prone to flooding during the rainy season, such as Banjarbaru, Bengkayang, Lamongan, Musibanyuasin, Pasuruan, Prabumulih, Samarinda, Singkawang, and Tangerang. These cities contained large numbers of coconuts, mangos, and mangroves (Bruguiera gymnorrhiza Lamk).
The human population size had no correlation with the number of FTS, in contrast to the number of non-FTS, which increased from small to large/metropolitan cities (Table 2). The correlation between city population and FTS number was described by Santosa et al. [117]. If the cities are divided into small to large cities vs. metropolitan/megapolitan, the former contains higher numbers of fruit species than the latter (37–46 vs. 26–34 species). Out of 224 cities, 144, 50, and 17 are small, medium, and large, respectively. Eight metropolitan cities are distributed among four islands: Java (Bandung, Yogyakarta, Semarang, Surabaya), Sumatera (Medan, Palembang), Sulawesi (Makassar), and Bali (Denpasar). All five megapolitan cities are in Greater Jakarta. Our hypothesis predicted that metropolitan and megapolitan cities planted more FTS due to the large problem of food security for the poor [22]. Here, it is noted that the low numbers of FTS in metropolitan/megapolitan areas were not related to any city characteristics, including city vision (p corr. = 0.066). Metropolitan and megapolitan areas are commonly designated as business (58.33% of cities) and touristic cities (25.00% of cities). Limited land space for planting FTS and the risk posed by fruit falling due to the high daily mobility of people are other possible explanatory variables.
Indonesian city visions were classified into nine categories: touristic (29.02%), cultural (17.41%), business (14.73%), agrarian (9.82%), religious (9.38%), heritage (8.93%), educational (4.46%), industrial (3.13%), and unclear vision (3.13%). The city vision tended to determine the number of FTS at p < 0.100 (Table 2). Among these visions, educational cities such as Bogor City and Malang City had the highest numbers of FTS, which accounted for 66% or more of the total species. Educational cities are characterized by economic activity that is stimulated by the high number of students and universities [118]. However, Irwan et al. [32] speculated that the high propensity of academicians for leisure, gathering, and studying in parks contributes to the large number of fruit species in educational cities. However, it is difficult to confirm that educational cities substantially contribute to high FTS abundance. City age could be another deterministic factor, because many educational cities, such as Bogor, Malang, and Yogyakarta, are derived from capital cities of the ancient Javanese Kingdom (around the 16–18th century; https://www.britannica.com (accessed on 5 June 2021). It would be interesting to further evaluate the effect of city age on the abundance of FTS. Industrial and religious cities had a tendency to contain high numbers of tree species, although the total number of FTS was lower than that in educational cities (Table 2). Industrial cities such as Cilacap, Cilegon, and Tangerang had 19–33 FTS (average 25.3 species) or 32.76–37.08% of total tree species. Industrial cities have higher levels of air pollution [119], which is a possible constraint on FTS suitability. Single-factor analysis using p < 0.10 revealed that seven out of nine city characteristics, excluding climatic zone and city population, played an important role in explaining the abundance of FTS in the city (Table 2).
The Pearson test showed 18 bivariate combinations exhibited significant correlation (Table 3, above diagonal). Further evaluation using the Pearson test showed a strong correlation between Java, island, province, and Wallace’s Line categories (p-value ≤ 0.007; p-corr. ≥ 0.344). For the Pearson correlation value (below diagonal), an absolute value of 1 indicates a perfect linear relationship and a correlation close to 0 indicates no linear relationship between the bivariate variables. The strong correlation of the Java, island, province, and Wallace’s Line categories seems the result of a nested effect in statistical analysis. The linkage of these categories derived from the geographical component. Wallace’s Line was the strongest predictor and selected as the primary factor to explain FTS abundance in this study due to its importance from geological and climatic perspectives [101,102,103]. Further information on Wallace’s Line is provided by Van Welzen et al. [101]. In conclusion, the Java, island, and province were considered did not substantially contribute to the number of FTS in this study.
Table 3.
Pearson correlation test between city categories for the number of fruit species in the city.
A multifactorial analysis was conducted to understand the most prominent predictors of the FTS distribution in Indonesian cities. Before the analysis, the city categories that insignificant contribution to the number of FTS by single-factor analysis (e.g., climatic zone and city population) and the nested categories (e.g., Java, island, province) were excluded. Four categories were further tested, i.e., smart city involvement, altitude, city vision, and Wallace’s Line (Table 4). The analysis revealed that city altitude and city position relative to Wallace’s Line were the most prominent predictors of FTS distribution in the city, as indicated by the larger constant value in the regression formula. Wallace’s Line was also an important predictor of the number of non-FTS and total tree species in a particular city. Indeed, the recommendation for selecting FTS based on the relation to Wallace’s Line might provide more benefits for cities in Indonesia. However, given the implications of the classification based on these lines, which also cover broad geological processes in Asia [101,102,103], the benefits of this research are still relevant. In tropical countries, altitude is a limiting factor for the agroecological suitability of FTS, as reported by Junghuhn [106]. In view of these two factors, utilization of FTS identified in the list (Table S4) and agroecological distribution mapping (Figure 6) are key steps to introducing FTS to cities.
Table 4.
Multiple regression analysis of city characteristics on the number of tree species.
Table 4 shows that all predictors contributed independently (VIF = 1.0) and negatively to the number of trees, both FTS and non-FTS. The cause of this trend is still unclear, but it is possibly due to the effect of the weakness in numeric categories during the statistical evaluation. However, the analysis illustrated the general effect of the city category on the number of FTS in the city. Whether a city implemented the smart model did not affect the number of FTS (p = 0.643). Here, a city’s implementation of the smart model is denoted by a smaller numerical order; this means that the smart city contributed to a larger number of non-FTS in the city. This finding was confirmed during the direct survey, where smart cities were visually “greener by various trees” than non-smart ones. Wallace’s Line significantly contributed to the total number of tree species, including FTS, in cities. As the eastern zone was denoted by a larger score in the statistical analysis, cities located to the east of Wallace’s Line consequently had fewer FTS than those in the west. City altitude determined the number of FTS but did not affect the abundance of non-FTS. It is evident that cities at higher altitudes (e.g., more than 600 m above sea level) had fewer FTS. The limiting factor at a high altitude is a lower temperature, which is a disadvantage to flowering induction for most tropical fruits [44,45,46]. In the future, it would be of interest to evaluate fruit species that are suitable for planting in high-altitude cities. Finally, city vision did not significantly contribute to the number of tree species in Indonesian cities, as indicated by the insignificant p-value and low constant value.
Nevertheless, the finding as shown in Table 4 should be adopted with precaution because Durbin-Watson values of the regressions fall below 2. Generally, the value below 2 means the sampling data is non-randomness (https://www.ncss.com (accessed on 16 June 2021)). Adoption in FTS and non-FTS of a particular city is probably affected by neighboring city experience or other spatial city relationships, leading to the presence of positive autocorrelation in Durbin-Watson test.
4. Discussion
4.1. Reviving Cities with Fruit Tree Species
This study reveals that some fruit species are distributed among many cities while others are found only in specific cities. Because no interviews were conducted with city managers, the results of this research cannot explicitly reveal whether the abundance of FTS is part of a planned greenery strategy or just a coincidence. This finding could be a basis for framing the abundance of FTS in a more strategic context, especially in the framework of making the city more friendly to various stakeholder interests. Surprisingly, the recent implementation of the smart city model and establishment of city vision for many cities had little impact on the establishment of multifunctional city greenery, e.g., FTS (Table 2).
Reviving city greenery with fruit tree species requires national and local support as key actors, and this issue arose during focus group discussions. At the national level, it is important to develop indicators for the implementation of the action. Municipalities/regencies and provinces can collaborate to reduce species duplication. For the 514 cities and 34 provinces of Indonesia, promoting one-city-one-iconic fruit tree is an interesting approach. The nativeness of species for conservation and agroclimatic suitability should be part of the discussion. Figure 6 could be used as preliminary information in the city mapping and FTS selection. This approach has traditionally achieved great success in Java, for example, tamarinds on Daendels Road [34].
At the local level, FTS might be introduced as road landmarks with fruit names such as Durian St. (Durio zybethinus L.) and Sawo St. (Manilkara zopota L.) or simply planted for ecological reasons [17]. Another cluster could be designated as site landmarks or toponyms—places that most likely derived from fruit names—such as Gandaria, Kemang, and Menteng Villages in Jakarta, corresponding to the local names of Bouea macrophylla Griffith, Mangifera kamanga Blume, and Baccaurea racemosa (Reinw.) Muell. Arg, respectively. Both national and local actions require landmark mapping and site improvements to favor FTS growth and to ensure safety standards for the passage of traffic.
4.2. FTS and City Services
The present findings indicate the abundance of FTS in cities in the Java region compared to other regions (Table 2). As the cities in Java are more densely populated [3] and food insecure [22], the introduction of FTS may have the potential to enhance city services, especially in Java. Moreover, many cities in Indonesia, including in Java, have allegedly experienced uniformity in city visualization, as noted by Amar [120]. The ecological concept of smart cities in Indonesia focuses on reducing energy consumption, increasing city hospitality, increasing areas with greenery, and reducing air pollution [121,122,123]. Therefore, the introduction of FTS should be framed to enhance the basic smart city concept, because 50% of smart city models in Indonesia are located in Java [5,6], and to some extent the smart city model had a contribution on FTS number (Table 4). Moreover, it may be a step forward in facilitating local knowledge of the economic benefits and realizing the image of tropical beauty as a “paradise”.
The combination of regional and individual city approaches is expected to accelerate FTS adoption. This is supported by the fact that the contribution of geographical factors, namely Java, islands, provinces, and relative position to Wallace’s Line is linked tightly to the number of FTS in a city (Table 3), regardless of nested phenomena. The bias of the regression analysis to estimate the number of FTS based on the selected city categories (Table 4), indicates that there is another factor that has not been revealed in this study such as spatial effect. There is a possibility that the visuals of the nearest city influence other cities in terms of FTS selection. Further study on spatial autocorrelation analysis on the selection of FTS would be interesting.
In a broader context, integrating FTS into the smart city concept could help by, for instance, reducing fuel consumption through increased walking habits. Fruit trees provide diverse eye-level street greenery that is rich in flower color, smell, exotic phenology, plant characteristics, and architectural form [46]. Attractive eye-level street greenery increases walking behavior and walking time [124]. Second, more FTS could help in reducing electrical consumption for air conditioning. Indonesian residential housing consumes 17% of electricity for cooling purposes [125]. Plants are able to reduce air temperatures, especially those with high stomatal conductance and high leaf area indexes [126,127]. Third, FTS could increase the hospitability of cities and the health status of the citizenry. Some studies indicate that proper greenery selection and placement increases citizen hospitability and health status in many countries [122,128,129,130]. Takano et al. [128] noted that the longevity of senior citizens increases if there are walkable green spaces. For Indonesians, listening to bird song is a form of mental healing [31], and FTS directly stimulate bird visitation [23,24,25,27,28,29]. Moreover, FTS such as guavas, jackfruit, mangos, matoas, rambutans, and tamarinds are reliable trees for reducing air pollution [131,132]. Finally, planting FTS stimulates economic activity in a particular community. For example, in Jakarta, some people utilize tree species with medicinal effects; these are planted along the roadside and include velvet tamarinds (Digallium indum), jackfruits, and coconuts [133]. In the present study, Averrhoa bilimbi was found to be a favorite tree among people living in coastal cities, such as Makassar, Jakarta Utara, Banjarmasin, Jayapura, and Kupang, because the A. bilimbi fruit is a useful herb for removing fishy smells in cooking. Similarly, in Bangli City, Bali, the Balinese plant jackfruit trees along the roadside to produce high-quality timber for the construction of pura (Balinese temples), ingredients for lawar dishes, and forages for raising cows.
However, care must be taken, especially if FTS are extensively planted as corridors in regions contiguous with fauna conservation zones, protected wildlife areas, wild forests, and natural reserves. Over time, the corridor might connect the city with wildlife, especially mammals such as monkeys and rodents such as rats, squirrels, and bats, which might invade fruit trees and increase the risk of unexpected fruit fall. In addition, in regions that often experience strong winds such as hurricanes, there is an increased risk that FTS will be knocked down and destroyed [134]. Crane et al. [134] reported that the tropical trees atemoya, avocado, carambola, guava, lime, and mamey sapote are more likely to survive a hurricane (145–175 mph) than longan, lychee, and mango trees. Fortunately, tropical hurricanes are rare in Indonesia [116,135], but maintaining a tree height below 3 m or grafting could reduce the risk of damage by about 40–60% in hurricane-prone regions [134]. Figure 5 shows that 8 out of 11 major risks of FTS can be reduced through horticulture technologies. The adoption of ICT networks in smart city platforms might minimize the FTS risk by evaluating the place, species, and time.
4.3. Challenges for Sustainability
Unlike common trees used as city greenery, introducing FTS to cities requires integrated action. Some FTS present technical problems related to aesthetics, functionality, hazard level, local policy, nurseries, and preference [40,44,45,129]. Acquiring comprehensive data on FTS for such technical requirements, including tree strength during extreme weather conditions such as strong winds and heavy rainfall, a common threat in Indonesian cities, remains challenging.
Developing low-cost FTS maintenance is another challenge. Business cities such as Jakarta and Surabaya generally have moderate numbers of total tree species (Table S3). Compared to Bogor City, Greater Jakarta had 66 fewer tree species in total. The low number of trees in Jakarta (and Surabaya) may be explained by the constraint of altitude because both cities were founded on swampy land (<8 m above sea level); thus, planting trees required additional soil from other cities, in contrast to the highland location of Bogor City. As a result, the Jakarta authorities preferred to select fast-growing trees that could adapt to a shallow water table and had low maintenance costs, such as butun (Baringtonia asiatica), angsana (Pterocarpus indicus Willd.), banyan tree (Ficus benjamina), saman tree (Samanea saman), sea mango (Cerbera manghas), and mahogany (Swietenia macrophylla). FTS technical limitations can be addressed by using advanced technologies such as automatic fertigation systems, tree training, and real-time monitoring, but improving physiological characteristics such as growth rate, fruit size, strength, and litter volume requires genetic manipulation.
In addition to technical considerations, socio-cultural perspectives related to FTS are important. The sustainability of tree species in cities is mainly affected by the trees’ nature and habitat health [136]. However, in Semarang City-Central Java, Roesmanto [33] noted that arenga palms (Arenga pinnata), coconuts, lontar trees, and asam kranji (Pithecellobium dulce), classified as FTS in the present study, were replaced by flowering ornamentals due to the changing preferences of city residents. In Bangkalan City, Madura Island, Setiawan [34] reported that the local government replaced tamarind trees along the roadside with fast-growing angsana and glodokan tiang (Polyalthia longifolia) due to substantial damage by illegal cutting for making bonsai and tree death caused by the posting of election campaign signs. In other cases, trees along roadsides were destroyed following road improvements for handling a higher traffic load [137]. According to Santosa et al. [117], about 40–60% of fruit species in Indonesian cities are located along the roadside. Thus, the socio-cultural perspective is an interesting direction for the study of FTS.
The introduction of FTS to cities requires collective support from ethnic groups to address socio-cultural concerns and businesses to ensure sustainability [117]. It is well known that ethnicity is tightly linked to agriculture preferences [138,139]. Balinese ceremonies use belimbing wuluh (Averrhoa carambola), trijata (Medinilla speciosa Reinw. ex Blume), and bananas. For Javanese, planting papaya trees close to the house causes bad luck. Currently, many city landscapers believe that planting date palms (Phoenix dactylifolia or Phoenix canariensis) in cities and parks close to religious facilities will increase good luck. Santosa et al. [117] noted five tree species emerging in Indonesian cities, i.e., dates palm, sea mango, tabebuya (Tabebuia cassinoides), velvet apple (Diospyros blancoi), and weeping willow (Salix babylonica). Some citizens in Yogyakarta warned that the introduction of FTS to public facilities might lead to injuries in some children because they would compete for fruits and fall because of broken twigs. Continuous advocacy by societal stakeholders, including for cultural corridor development [140], is important to encourage awareness and proper resource sharing. Finally, promoting wider participation by nursery businesses is a must, as this issue was raised in the focus group discussion forum, with city landscapers having specific requirements for trees, such as a minimum height of 3 m for transplanting.
5. Conclusions
Cities can be considered sites of genetic conservation from both national and local perspectives; however, as local resources, fruit tree species are still far from being integrated into the smart city concept. The smart city model can be improved by incorporating fruit species into different city features through a better understanding of local wisdom, hazard mitigation, and citizen preferences. Since city characteristics other than agroclimate and vision have no specific patterns in relation to fruit tree species distribution, a national consensus on genetic conservation indicators may be necessary for integrating FTS into cities to enrich the smart model. This requires support from the government, city landscapers, societies, nursery businesses, and academicians to ensure sustainability.
Supplementary Materials
The following are available online at https://www.mdpi.com/article/10.3390/su13147835/s1, Figure S1: Review process in the first step of the study; Table S1: Road segments and city parks for data collection in each city; Table S2: Scoring values of fruit species for hazard assessment; Table S3: City characteristics in relation to fruit species; Table S4: Distribution of FTS by geographic category and quadrant group member; Table S5: List of FTS designated as city icons and score of availability; Table S6: List of FTS by city and province.
Author Contributions
Conceptualization, E.S., A.D.S., W.D.W. and N.N.; methodology, E.S., A.D.S. and W.D.W.; software, E.S.; validation, W.D.W. and R.S.; formal analysis, E.S., A.D.S. and N.N.; investigation, E.S. and W.D.W.; resources, E.S.; data curation, E.S., W.D.W., I.P.R. and R.S.; writing—original draft preparation, E.S.; writing—review and editing, E.S., A.D.S., W.D.W., N.N. and R.S.; visualization, E.S. and A.D.S.; supervision, A.D.S. and W.D.W.; project administration, E.S.; funding acquisition E.S., A.D.S., W.D.W. and N.N. All authors have read and agreed to the published version of the manuscript.
Funding
This research was funded by the Directorate Research and Community Service, Ministry of Research and Technology, Republic of Indonesia, grant number 3/E1/KP.PTNBH/2019 for Fiscal Year 2019 and grant number 1/E1/KP.PTNBH/2020 for Fiscal Year 2020.
Institutional Review Board Statement
Not applicable.
Informed Consent Statement
Not applicable.
Data Availability Statement
All data are available in Supplementary Materials.
Acknowledgments
The authors thank Ernan Rustiadi as Head of Research and Community Service (LPPM) IPB University for technical support. The authors are also thankful to Sobir, Hadi Susilo Arifin, Bambang Sulistyantara, A.M. Zuhud, Deden D. Matra, Ketty Suketi, Darda Efendi and Siti Nurisjah from IPB University and to Bogor Botanic Garden, Ministry of Forestry and Environment Republic of Indonesia, Major of Bogor City, and Bogor Regency for their contribution during the focus group discussion.
Conflicts of Interest
The authors declare no conflict of interest. The funders had no role in the design of the study; in the collection, analyses, or interpretation of data; in the writing of the manuscript; or in the decision to publish the results.
References
- Zhou, D.; Shi, P.; Wu, X.; Ma, J.; Yu, J. Effects of urbanization expansion on landscape pattern and region ecological risk in Chinese coastal city: A case study of Yantai city. Sci. World J. 2014, 2014, 821781. [Google Scholar] [CrossRef]
- Wowrzeczka, B. City of waste—importance of scale. Sustainability 2021, 13, 3909. [Google Scholar] [CrossRef]
- Wilonoyudho, S.; Rijanta, R.; Keban, Y.T.; Setiawan, B. Urbanization and regional imbalances in Indonesia. Indones. J. Geogr. 2017, 49, 125–132. [Google Scholar] [CrossRef]
- Morena, M.; Cia, G.; Baiardi, L.; Rodríguez Rojas, J.S. Residential property behavior forecasting in the metropolitan city of Milan: Socio-economic characteristics as drivers of residential market value trends. Sustainability 2021, 13, 3612. [Google Scholar] [CrossRef]
- MENKOMINFO [Ministry of Communication and Information]. Step towards “100 Smart Cities”. 2017. Available online: https://kominfo.go.id/content/detail/11656/langkah-menuju-100-smart-city/0/sorotan_media (accessed on 10 November 2019).
- Sanjaya, A.; Krisna, S.A.; Mursito, T.B.; Supriyadi. Research Trends of Smart City in Indonesia: Where Do We Go from Here? 2017. Available online: https://www.researchgate.net/publication/322288301_Research_Trends_of_Smart_City_in_Indonesia_Where_Do_We_Go_from_Here (accessed on 10 November 2019).
- Esabella, S. Towards Smart City Concept. In Paper Presented as Visiting Lecturer at University Cordova Indonesia. 6 February 2016. Available online: https://www.researchgate.net/publication/322303099_Menuju_Konsep_Smart_City (accessed on 10 November 2019).
- Albino, V.; Berardi, U.; Dangelico, R.M. Smart cities: Definitions, dimensions, performance, and initiatives. J. Urban Tech. 2015, 22, 3–21. [Google Scholar] [CrossRef]
- Mora, L.; Bolici, R.; Deakin, M. The first two decades of smart-city research: A bibliometric analysis. J. Urban Tech. 2017, 24, 3–27. [Google Scholar] [CrossRef]
- Bibri, S.E.; Krogstie, J. On the social shaping dimensions of smart sustainable cities: A study in science, technology, and society. Sustain. Cities Soc. 2016, 29, 219–246. [Google Scholar] [CrossRef]
- Utomo, C.E.W.; Hariadi, M. Strategy development smart city and its challenge for urban society. J. Strateg. Bisnis 2016, 4, 159–176. [Google Scholar]
- Colding, J.; Barthel, S. An urban ecology critique on the “Smart City” model. J. Clean. Prod. 2017, 164, 95–101. [Google Scholar] [CrossRef]
- Angelidoua, M.; Karachalioua, E.; Angelidoua, T.; Stylianidisa, E. Cultural heritage in smart city environments. Int. Arch. Photogramm. Remote Sens. Spat. Inf. Sci. 2017, 42, 27–32. [Google Scholar] [CrossRef]
- BAPPENAS. Indonesian Biodiversity Strategy and Action Plan 2015–2020; The Ministry of the National Development Planning/BAPPENAS: Jakarta, Indonesia, 2016; Available online: https://www.bappenas.go.id/files/publikasi_utama/Dokumen_IBSAP_2015-2020.pdf (accessed on 10 November 2019).
- Timmer, P.C. Food security in Indonesia: Current challenges and the long-run outlook. Cent. Glob. Dev. Work. Pap. 2004, 48. [Google Scholar] [CrossRef]
- Asfina, R.; Olivina, R. Be proud of Indonesian cultural heritage richness and be alert of its preservation efforts in the global world. Humanus 2016, 15, 195–206. [Google Scholar] [CrossRef]
- Arifin, H.S.; Nakagoshi, N. Landscape ecology and urban biodiversity in tropical Indonesian cities. Landsc. Ecol. Eng. 2011, 7, 33–43. [Google Scholar] [CrossRef]
- Paramadhyaksa, I.N.W. The concept embodiment of the kingdom of heaven in the centers of kingdom cities in Bali. Forum Arkeol. 2014, 27, 145–154. [Google Scholar]
- Vujanovic, P. Decentralisation to promote regional development in Indonesia. OECD Econ. Dep. Work. Pap. 2017, 1380. [Google Scholar] [CrossRef]
- Esfarjani, F.; Roustaee, R.; Mohammadi-Nasrabadi, F.; Esmaillzadeh, A. Major dietary patterns in relation to stunting among children in Tehran, Iran. J. Health Popul. Nutr. 2013, 31, 202–210. [Google Scholar] [CrossRef][Green Version]
- Nabila, C.A.; Irwan, S.N.F.; Kurniasih, B.; Ambarwati, E. Study on fruit trees for street greenery in urban settlement based on aesthetics level and community response in Rejowinangun District, Yogyakarta. Vegetalika 2018, 7, 13–25. [Google Scholar] [CrossRef]
- Arifin, B.; Achsani, N.A.; Martianto, D.; Sari, L.K.; Firdaus, A.H. The future of Indonesian food consumption. J. Ekon. Indones. 2019, 8, 71–102. [Google Scholar] [CrossRef]
- Ghifari, B.; Hadi, M.; Tarwotjo, U. Diversity and Abundance Bird Species at City Park Semarang City, Central Java. J. Biol. 2016, 5, 24–31. Available online: https://ejournal3.undip.ac.id/index.php/biologi/article/view/19510 (accessed on 10 October 2019).
- Nugroho, J. Structure of birds’ community in Taman Situlembang, Taman Suropati, and Taman Menteng, Jakarta Pusat. BIOMA 2016, 12, 32–39. [Google Scholar] [CrossRef]
- Mabuhay, J.; Isagi, Y.; Nakagoshi, N. Ecological indicators of biodiversity in tropical urban green spaces. WSEAS Trans. Environ. Dev. 2005, 1, 85–91. [Google Scholar]
- Syamdermawan, W.; Surjono, S.; Kurniawan, E.B. The effect of green open space to the quality of environment of upper-middle residence. Teknol. Kejuru. 2012, 35, 81–92. [Google Scholar]
- Fortel, L.; Henry, M.; Guilbaud, L.; Guirao, A.L.; Kuhlmann, M.; Mouret, H.; Rollin, O.; Vaissièr, B.E. Decreasing Abundance, Increasing Diversity and Changing Structure of the Wild Bee Community (Hymenoptera: Anthophila) along an Urbanization Gradient. PLoS ONE 2014, 9, e104679. [Google Scholar] [CrossRef]
- Guénard, B.; Cardinal-De Casas, A.; Dunn, R.R. High diversity in an urban habitat: Are some animal assemblages resilient to long-term anthropogenic change? Urban Ecosys. 2015, 18, 449–463. [Google Scholar] [CrossRef]
- Wahyuni, S.; Syartinilia; Mulyani, Y.A. Effectivity of green open spaces as bird habitats in Bogor city and its surroundings. J. Lanskap Indones. 2018, 10, 29–36. [Google Scholar] [CrossRef]
- Fadrikal, R.; Fadliah, E.; Nugroho, J. Urban bird community: The effect of size area and plant species on bird diversity. Pros. Semin. Nas. Masy. Biodiversitas Indones. 2015, 1, 1842–1846. [Google Scholar] [CrossRef]
- Porath, N. The naturalization of psychiatry in Indonesia and its interaction with indigenous therapeutics. Bijdr. tot taal land en Volkenkd. J. Humanit. Soc. Sci. Southeast Asia 2008, 164, 500–528. [Google Scholar] [CrossRef]
- Irwan, S.N.R.; Kaharuddin, K. A study of comfort for activities in urban forest landscape of UGM, study case: Agro cluster UGM. J. For. Sci. 2010, 4, 98–110. [Google Scholar]
- Roesmanto, T. The lost of Semarang landscape. Riptek 2012, 6, 1–7. [Google Scholar]
- Setiawan, E. Population diversity of tamarind (Tamarindus indica L.) in Socah-Arosbaya Road, Bangkalan Regency and its conservation strategy. J. Ilm. Rekayasa 2018, 11, 95–103. [Google Scholar] [CrossRef]
- Pratama, M.F.; Dwiartama, A.; Rosleine, D.; Abdulharis, R.; Irsyam, A.S.D. Documentation of underutilized fruit trees (UFTs) across indigenous communities in West Java, Indonesia. Biodiversitas 2019, 20, 2603–2611. [Google Scholar] [CrossRef]
- Masripatin, N.; Rimbawanto, A.; Widyatmoko, A.Y.P.B.C.; Purwito, D.; Susanto, M.; Khomsah, N.; Yuliah; Setiadji, T.; Hakim, L. Status of forest genetic resources conservation and management in Indonesia. In Proceedings of the Asia Pacific Forest Genetic Resources Programme (APFORGEN) Inception Workshop: Forest Genetic Resources Conservation and Management, Kepong, Malaysia, 15–18 July 2003; Luoma-aho, T., Hong, L.T., Rao, V.R., Sim, H.C., Eds.; IPGRI-APO: Serdang, Malaysia, 2004; pp. 165–182. [Google Scholar]
- Siregar, M. Review species diversity of local fruit trees in Kalimantan: Problems of conservation and its development. Biodiversitas 2006, 7, 94–99. [Google Scholar]
- von Rintelen, K.; Arida, E.; Häuser, C. A review of biodiversity-related issues and challenges in megadiverse Indonesia and other Southeast Asian countries. Res. Ideas Outcomes 2017, 3, e20860. [Google Scholar] [CrossRef]
- Frank, M.; Bowyer, J.; Stai, S.; Fernholz, K.; Bratkovich, J.; Bratkovich, S.; Howe, J. Utilizing Urban Forests or Fruit Production; Dovetail Partners Inc.: Minnesota, USA, 2011; Available online: http://www.dovetailinc.org/report_pdfs/2011/dovetailurbanfruit0411.pdf (accessed on 20 August 2019).
- Clark, K.H.; Nicholas, K.A. Introducing urban food forestry: A multifunctional approach to increase food security and provide ecosystem services. Landsc. Ecol. 2013, 28, 1649. [Google Scholar] [CrossRef]
- Bakay, L. Fruitmap and falling fruit—Tools for mapping urban fruit trees in the city of Nitra. In Conference: Plants in Urban Areas and Landscape; Slovak University of Agriculture: Nitra, Slovakia, 2014; pp. 68–70. [Google Scholar] [CrossRef]
- Marshall, A. It’s Probably OK to Eat Fruit from City Trees. 2015. Available online: https://www.citylab.com/life/2015/11/its-ok-to-eat-fruit-from-urban-trees/415770/ (accessed on 5 April 2019).
- Colinas, J.; Bush, P.; Manaugh, K. The socio-environmental impacts of public urban fruit trees: A Montreal case-study. Urban For. Urban Green. 2018, 45, 126132. [Google Scholar] [CrossRef]
- Vogt, J.; Gillner, S.; Hofmann, M.; Tharang, A.; Dettmann, S.; Gerstenberg, T.; Schmidt, C.; Gebauer, H.; de Riet, K.V.; Berger, U.; et al. Citree: A database supporting tree selection for urban areas in temperate climate. Landsc. Urban Plan. 2017, 157, 14–25. [Google Scholar] [CrossRef]
- Hirons, A.; Sjöman, H. Tree Species Selection for Green Infrastructure: A Guide for Specifiers; Trees & Design Action Group: Kew Richmond, UK, 2018. [Google Scholar]
- Verheij, E.W.M.; Coronel, R.E. Plant Resources of South-East Asia No 2. Edible Fruits and Nuts; Backhuys Publishers: Leiden, The Netherlands, 1992; 446p. [Google Scholar]
- Stapleton, T. 5 Reasons Why Planting Fruit Trees along Sidewalks is a Terrible Idea. 2015. Available online: https://land8.com/5-reasons-why-planting-fruit-trees-along-sidewalks-is-a-terrible-idea (accessed on 4 March 2019).
- Cariñanos, P.; Adinolfi, C.; de la Guardia, C.D.; de Linares, C.; Casares-Porcel, M. Characterization of allergen emission sources in urban areas. J. Environ. Qual. 2016, 45, 244–252. [Google Scholar] [CrossRef] [PubMed]
- Lepczyk, C.A.; Aronson, M.F.J.; Evans, K.L.; Goddard, M.A.; Lerman, S.B.; Macivor, J.S. Biodiversity in the city: Fundamental questions for understanding the ecology of urban green spaces for biodiversity conservation. BioScience 2017, 67, 799–807. [Google Scholar] [CrossRef]
- Samsoedin, I.; Sisidharmawan, I.W.; Pratiwi; Wahyono, D. Peran Pohon dalam Menjaga Kualitas Udara di Perkotaan; Forda Press: Bogor, Indonesia, 2015; Available online: https://www.forda-mof.org/files/peran_pohon.pdf (accessed on 4 March 2019).
- Husodo, T.; Irawan, B.; Wulandari, I.; Dasanova, W.M. Pohon di Taman Kota Bandung; Badan Pengelola Lingkungan Hidup Kota Bandung: Bandung, Indonesia, 2014; Available online: https://www.academia.edu/33124092/POHON_Taman_Kota_Bandung (accessed on 4 March 2019).
- Hasanudin. Tree architecture model forest Banda Aceh city as supporting practical of plant morphology. J. EduBio Trop. 2013, 1, 38–44. [Google Scholar]
- Navia, Z.I.; Suwardi, A.B.; Saputri, A. Penelusuran ragam jenis tanaman buah pekarangan sebagai sumber nutrisi bagi masyarakat di Kota Langsa, Aceh. In Proceeding of the Semnas Bioeti Ke-4 & Kongres PTTI ke-12, Padang, Indonesia, 15–17 September 2017; p. 774. (In Indonesian). [Google Scholar]
- Iqbar. Tree vegetation diversity in PT Arun NGL housing, Lhokseumawe, Aceh Province. J. Nat. 2016, 16, 1–6. [Google Scholar]
- Wijayanto, N. Species identification and selection to develop agroforestry at Lake Toba Catchment Area (LTCA). Biodiversitas 2011, 12, 52–58. [Google Scholar]
- Latifah, S.; Patana, P.; Rahmawaty, R. Potensi biomassa permukaan tanah pada jalur hijau di Kota Medan. Abdimas Talent. 2016, 1, 70–75. (In Indonesian) [Google Scholar]
- Banurea, I.; Rahmawaty, R.; Afiffudin, Y. Green open space capability analysis on reducing concentration of CO2 from motor vehicles at campus USU Medan. Peronema For. Sci. J. 2013, 2, 122–129. [Google Scholar]
- Putri, N.E.; Kusumawati, A.; Azhar, N.O.; Swasti, E. Exploration and characterization of endangered West Sumatera local fruits. Pros. Semin. Nas. Masy. Biodiversitas Indones. 2017, 3, 117–126. [Google Scholar]
- Dinata, M.; Fitridawati, F.; Putri, L.D. The study trees potential for forest in Pekanbaru Riau. Bio Lect. J. Pend. Biol. 2017, 4, 111–119. [Google Scholar]
- Zurriyati, Y.; Dahono. Genetic resources diversity of exotic fruits in Bintan Regency of Riau Island Province. Bul. Plasma Nutfah 2016, 22, 11–20. [Google Scholar]
- Haryanto, D.A.; Astiani, D.; Manurung, T.F. Analysis on forest inventory at the Mountain Gunung Sari in Singkawang City. J. Hutan Lestari 2015, 3, 217–226. [Google Scholar]
- Annisa, N.; Kurnain, A.; Indrayatie, E.R.; Peran, S.B. Micro Climate and Unpleasant Index City Park in Komet Village, Kota Banjarbaru. EnviroScienteae 2015, 11, 143–151. Available online: https://ppjp.ulm.ac.id/journal/index.php/es/article/view/1104/952 (accessed on 17 July 2019).
- Soendjoto, M.A.; Suyanto, S.; Hafiziannoor, H.; Purnama, A.; Rafiqi, A.; Sjukran, S. Plants diversity of farm forestry in Tanah Laut District, South Kalimantan. Biodiversitas 2008, 9, 142–147. [Google Scholar] [CrossRef]
- Anonymous. Inventarisasi Keanekaragaman Hayati di Gunung Menaliq, Kampung Penarung, Kabupaten Kutai Barat, Kalimantan Timur; KEHATI and Universitas Mulawarman: Kalimantan Timur, Indonesia, 2018; Available online: https://docplayer.info/84025172-Laporan-inventarisasi-keanekaragaman-hayati-di-gunung-menaliq-kampung-penarung-kabupaten-kutai-barat-kalimantan-timur.html (accessed on 5 June 2019).
- Rahayu, S.; Pambudi, S. Tree diversity and carbon stock in three districts of Kutai Timur, Pasir and Berau, East Kalimantan. In Working Paper 266; World Agroforestry Centre: Bogor, Indonesia, 2017. [Google Scholar] [CrossRef]
- Tambaru, E.; Paembonan, S.A.; Ura’, R. Jenis-jenis pohon penghijauan pada beberapa lokasi jalan di Kota Makassar. In Prosiding Seminar Nasional Biologi 2016, Peranan Biologi dalam Peningkatan Konservasi Keragaman Hayati; Jurusan Biologi FMIPA UNHAS: Makassar, Indonesia, 2016; pp. 340–346. [Google Scholar]
- Yanti, C.W.B.; Nurfaida, P.A.K.A. Evaluation of functional and aesthetic value of Park Maccini Sombala of Makassar City as horticultural parks. J. Arsit. Lansek. 2015, 1, 50–57. [Google Scholar]
- Samsoedin, I.; Syahadat, E.; Ariawan, K.; Suryandari, E.Y.; Panjaitan, J.H. Sintesis Penelitian Integratif Pengembangan Hutan Kota pada Lanskap Perkotaan; Kementerian Kehutanan RI: Bogor, Indonesia, 2014; 130p, Available online: http://simlit.puspijak.org/files/buku/BUKU_RPI_HUTAN_KOTA.pdf (accessed on 5 June 2019).
- Zulkarnain, I.; Kasim, S.; Hamid, H. Vegetation Analysis and Visualization of Vegetation Structure Baruga Urban Forest, Kendari City. J. Hutan Trop. 2015, 3, 99–109. Available online: https://ppjp.ulm.ac.id/journal/index.php/jht/article/view/1512/1299 (accessed on 5 June 2019).
- Maryanto, I.; Roemantyo; Noerdjito, M. Profil Keanekaragaman Hayati Provinsi Sulawesi Barat; Kementerian Lingkungan Hidup, Badan Lingkungan Hidup Provinsi Sulawesi Barat, dan Lembaga Ilmu Pengetahuan Indonesia: Sulawesi Barat, Indonesia, 2012; 107p, Available online: https://www.researchgate.net/publication/289745960_PROFIL_KEANEKARAGAMAN_HAYATI_PROVINSI_SULAWESI_BARAT (accessed on 5 June 2019).
- Lahusen, M.H.; Naharuddin, N.; Sustri, S. Keanekaragaman Jenis Vegetasi tePian Sungai Kaili Desa Labuan Kungguma Kecamatan Labuan. War. Rimba 2014, 2, 136–144. Available online: http://jurnal.untad.ac.id/jurnal/index.php/WartaRimba/article/view/3586 (accessed on 5 June 2019).
- Ririhena, R.E. The Integration of susTainable Management of Dusun Agroforestry on the Island of Ambon (Ambon City Case Study). Ph.D. Thesis, Bogor Agricultural University, Bogor, Indonesia, 2015. Available online: https://repository.ipb.ac.id/handle/123456789/88500 (accessed on 5 June 2019).
- Sirappa, M.P.; Matitaputty, P.R. Land Potential for Development Region Pre-Eminent Plantation Commodity, Center Moluccas Regency. J. Peternak. 2010, 7, 52–61. [Google Scholar] [CrossRef]
- Irwanto, M. Analisis Vegetasi Untuk Pengelolaan Kawasan Hutan Lindung Pulau Marsegu, Kabupaten Seram Bagian Barat, Provinsi Maluku. Master’s Thesis, Gadjah Mada University, Yogyakarta, Indonesia, 2007. Available online: http://etd.repository.ugm.ac.id/home/detail_pencarian/34848 (accessed on 6 June 2019).
- Tulalessy, A.H. Flora potential in the District of West Seram. Ekosains 2012, 1, 1–5. [Google Scholar]
- Mirmanto, E. Vegetation analysis of natural forest in Ternate Island, North Maluku. J. Biol. Indones. 2010, 6, 341–351. [Google Scholar]
- Susiarti, S.; Rahayu, M.; Royyani, M.F. Knowledge on medicinal plants of Tobelo Dalam community in North Moluccas. Media Litbangkes 2015, 25, 211–218. [Google Scholar]
- Lekitoo, K.; Batorinding, E.; Dimomonmau, P.A.; Rumbiak, W.F.; Ondi, H.; Heatubun, C.D.; Lekitoo, H.Y. Re-Diversifikasi Pangan di Tanah Papua (Bagian–2): Pemanfaatan Tujuh Jenis Tumbuhan Hutan Penghasil Buah Sebagai Sumber Bahan Pangan di Tanah Papua; Balai Penelitian Kehutanan Manokwari: Manokwari–Papua Barat, Indonesia, 2015; 237p. (In Indonesian) [Google Scholar]
- Arobaya, A.Y.S.; Pattiselanno, F. The useful plants of Dani Ethnics groups at the Baliem valley of Papua. Biota 2007, 12, 192–195. [Google Scholar]
- Lekitoo, K.; Batorinding, E.; Dimomonmau, P.A.; Rumbiak, W.F.; Heatubun, C.D.; Lekitoo, H.Y. Re-Diversifikasi Pangan di Tanah Papua Bagian-1: Pemanfaatan Enam Jenis Tumbuhan Hutan Penghasil Buah sebagai Sumber Bahan Pangan di Tanah Papua; Badan Penelitian dan Pengembangan Kehutanan: Jakarta, Indonesia, 2012; 287p. (In Indonesian) [Google Scholar]
- Kabelen, F.; Warpur, M. Struktur, komposisi jenis pohon dan nilai ekologi vegetasi kawasan hutan di Kampung Sewan Distrik Sarmi, Kabupaten Sarmi. J. Biol. Papua 2009, 1, 72–80. (In Indonesian) [Google Scholar]
- Robiansyah, I. Diversity and biomass of tree species in Tambrauw, West Papua, Indonesia. Biodiversitas 2008, 19, 377–386. [Google Scholar] [CrossRef]
- Pare, H. Tourism Landscape Management in “Pasir Putih Satu” Beach, Fakfak Regency, West Papua. Bachelor’s Thesis, Bogor Agricultural University, Bogor, Indonesia, 2015. [Google Scholar]
- Pranita, I. Identifikasi ruang terbuka hijau di kota-kota pantai Indonesia (Studi kasus Kota Padang, Denpasar, dan Makassar). Bachelor’s Thesis, Bogor Agricultural University, Bogor, Indonesia, 2010. (In Indonesian). [Google Scholar]
- Sujana, I.K.A.; Sukewijaya, I.M.; Wiraatmaja, I.W. Identification and characterization of genetic resources of local fruits in Tabanan. Agrotrop 2016, 6, 146–153. [Google Scholar]
- Purnawijaya, W.A.; Idrus, H.A.A.; Mertha, I.G. Morfologi Spesies Tanaman Peneduh Jalan di Kota Mataram. 2013. Available online: http://www.eprint.unram.ac.id (accessed on 6 June 2019).
- Lestari, I.; Yanuwiadi, B.; Soemarno. The analysis of compatibility for a local vegetation in green open space on the main road at the center of Kupang City. J-PAL 2013, 4, 1–10. [Google Scholar]
- Adjam, R.M.O.; Renoat, E. Landscape vegetations as wind flows reducer in Kupang City, East Nusa Tenggara. J. Lanskap Indones. 2017, 9, 63–72. [Google Scholar] [CrossRef][Green Version]
- Sadili, A. Kajian struktur tegakan vegetasi dan komposisi jenis tumbuhan pada habitat jenis burung paruh bengkok (Psittacidae) di Pulau Alor, Nusa Tenggara Timur. J. Tek. Lingkung. 2012, Special Ed, 97–106. (In Indonesian) [Google Scholar]
- Ariyanti, E.E. Pemanfaatan berbagai jenis tumbuhan sebagai bahan Pangan di Dusun Blidit, Desa Egon, Kecamatan Waigete, Kabupaten Sikka, Provinsi NTT. Hayati 2010, 4, 55–58. (In Indonesian) [Google Scholar]
- Lusiana, B.; Widodo, R.; Mulyoutami, E.; Nugroho, D.A.; van Noordwijk, M. Kajian Kondisi Hidrologis DAS Talau, Kabupaten Belu, Nusa Tenggara Timur. In Working Paper No. 59; World Agroforestry Centre: Bogor, Indonesia, 2008; 71p. [Google Scholar]
- Setiadi, D. The diversity of trees species in Taman Wisata Alam Ruteng, East Nusa Tenggara. Biodiversitas 2005, 6, 118–122. [Google Scholar]
- Iswandono, E. Analysis of utilization and the potency of plant resources in Ruteng Recreation Park, East Nusa Tenggara Province. Ph.D. Thesis, Bogor Agricultural University, Bogor, Indonesia, 2007. [Google Scholar]
- Deus, E.; Silva, J.S.; Catry, F.X.; Rocha, M.; Moreira, F. Google Street View as an alternative method to car surveys in large-scale vegetation assessments. Environ. Monit. Assess. 2016, 188, 560. [Google Scholar] [CrossRef] [PubMed]
- Pandey, S.V.; Lalamentik, L. Road Class Area for Cargo Mobility. Tekno Sipil 2014, 12, 27–37. Available online: https://ejournal.unsrat.ac.id/index.php/tekno/article/view/5596 (accessed on 15 July 2019).
- De Guzman, C.C.; Siemonsma, J.S. Plant Resources of South-East Asia No 13. Spices; Backhuys Publishers: Leiden, The Netherlands, 1999; 400p. [Google Scholar]
- Uji, T. Species diversity of indigenous fruits in Indonesia and its potential. Biodiversitas 2007, 8, 157–167. [Google Scholar] [CrossRef]
- Priyadi, H.; Takao, G.; Rahmawati, I.; Supriyanto, B.; Nursal, W.I.; Rahman, I. Five Hundred Plant Species in Gunung Halimun Salak National Park, West Java: A Checklist Including Sundanese Names, Distribution and Use; CIFOR: Bogor, Indonesia, 2010. [Google Scholar]
- Mukhlison. Tree species selection for urban forest development in Yogyakarta City. J. For. Sci. 2013, 7, 37–47. [Google Scholar] [CrossRef]
- UN [United Nations]. The World’s Cities in 2018, Data Booklet; United Nations–Department of Economic and Social Affairs, Population Division: New York, NY, USA, 2018; Available online: https://www.un.org/en/events/citiesday/assets/pdf/the_worlds_cities_in_2018_data_booklet.pdf (accessed on 10 June 2019).
- Van Welzen, P.C.; Parnel, J.A.N.; Slik, J.W.F. Wallace’s Line and plant distributions: Two or three phytogeographical areas and where to group Java? Biol. J. Linn. Soc. 2011, 103, 531–545. [Google Scholar] [CrossRef]
- Bacon, C.D.; Michonneau, F.; Henderson, A.J.; McKenna, M.J.; Milroy, A.M.; Simmons, M.P. Geographic and taxonomic disparities in species diversity: Dispersal and diversification rates across Wallace’s line. Evolution 2013, 67, 2058–2071. [Google Scholar] [CrossRef] [PubMed]
- Brodie, J.F.; Helmy, O.; Pangau-Adam, M.; Ugiek, G.; Froese, G.; Granados, A.; Mohd-Azlan, J.; Bernard, H.; Giordano, A.J.; Agil, M.; et al. Crossing the (Wallace) line: Local abundance and distribution of mammals across biogeographic barriers. Biotropica 2018, 50, 116–124. [Google Scholar] [CrossRef]
- Santosa, E.; Lian, C.L.; Sugiyama, N.; Misra, R.S.; Boonkorkaew, P.; Thanomchit, K. Population structure of elephant foot yams (Amorphophallus paeoniifolius (Dennst.) Nicolson) in Asia. PLoS ONE 2017, 12, e0180000. [Google Scholar] [CrossRef] [PubMed]
- Siregar, C.A.T.; Trigunasih, N.M.; Dibia, I.N. Land suitability for fruits plants and plantations based on geographic information systems on dry land in Yeh Ho Watershed, Tabanan Regency. J. Trop. Agrotechnology 2020, 9, 153–165. Available online: https://ojs.unud.ac.id/index.php/JAT/article/view/63167/36043 (accessed on 10 September 2020).
- Junghuhn, F.W. Die Topographischen und Naturwissenschaftlichen Reisen Durch Java; Engelmann: Magdeburg, Germany, 1845. [Google Scholar]
- Schmidt, F.H.; Ferguson, J.H.A. Rainfall types based on wet and dry period ratios for Indonesia with Western New Guinea. In Verhandelingen No. 42; Kementerian Perhubungan Djawatan Meteorologi dan Geofisik [Ministry of Transportation Section Meteorology and Geophysics): Jakarta, Indonesia, 1951; 77p. [Google Scholar]
- Khamis, A.; Ismail, Z.; Haron, K.; Mohammed, A.T. Modeling oil palm yield using multiple linear regression and robust M-regression. J. Agron. 2006, 5, 32–36. [Google Scholar] [CrossRef]
- Syahadat, R.M.; Putra, P.T.; Ramadanti, P.; Radnawati, D.; Nurisjah, S. Identification RTH biodiversity in Depok City. Nalars J. Arsit. 2017, 17, 29–38. [Google Scholar] [CrossRef]
- Hill, J.L.; Curran, P.J.; Foody, G.M. The effect of sampling on the species-area curve. Glob. Ecol. Biogeogr. Lett. 1994, 4, 97–106. [Google Scholar] [CrossRef]
- MENDAGRI. Instruction from Ministry of Home Land Affairs No 11 Year 1996 about Guideline for Decision on Flora and Fauna as District and City Identities; Kementerian Dalam Negeri, Jakarta. 1996. Available online: https://peraturan.bkpm.go.id/jdih/userfiles/batang/Insmendagri_11_1996.pdf (accessed on 22 May 2019).
- Racskó, J.; Leite, G.B.; Petri, J.L.; Zhongfu, S.; Wang, Y.; Szabó, Z.; Soltész, M.; Nyéki, J. Fruit drop: The role of inner agents and environmental factors in the drop of flowers and fruits. Intern. J. Hortic. Sci. 2007, 13, 13–23. [Google Scholar] [CrossRef]
- Khandaker, M.M.; Idris, N.S.; Ismail, S.Z.; Majrashi, A.; Alebedi, A.; Mat, N. Causes and prevention of fruit drop of Syzygium samarangense (wax apple): A review. Adv. Environ. Biol. 2016, 10, 112–123. [Google Scholar]
- Krisanti, A.A.; Widiyani, T.; Imron, M.A. Species diversity and population distribution of arboreal mammals in Kemuning Forest, Temanggung, Central Java, Indonesia. Biodiversitas 2017, 18, 1190–1195. [Google Scholar] [CrossRef]
- Faeth, S.H.; Bang, C.; Saari, S. Urban biodiversity: Patterns and mechanisms. Ann. N. Y. Acad. Sci. 2011, 1223, 69–81. [Google Scholar] [CrossRef]
- Sadhotomo, B. Review of environmental features of the Java sea. Indones. Fish. Res. J. 2006, 12, 129–157. [Google Scholar] [CrossRef][Green Version]
- Santosa, E.; Susila, A.D.; Widodo, W.D.; Nasrullah, N. Genetic conservation of tree species in Indonesian cities: Problems and prospects. AIP Conf. Proc. 2020, 2260, 020022. [Google Scholar] [CrossRef]
- Sugiyanto. Yogyakarta education city and alternative economy. Cakrawala Pendidik. 2004, 23, 523–547. [Google Scholar] [CrossRef]
- Rixson, L.; Riani, E.; Santoso, M. Characterization of Long-Term Exposure of Particulate Matter at Puspiptek Serpong South Tangerang. J. Appl. Isot. Radiat. 2015, 11, 51–64. Available online: https://www.researchgate.net/publication/319390448 (accessed on 15 July 2019).
- Amar. City Identity, Phenomenon and Its Problem. J. Ruang 2009, 1, 55–59. Available online: https://media.neliti.com/media/publications/221043 (accessed on 20 May 2019).
- PSPPR UGM. Road Map Kota Yogyakarta towards Smart City; Pusat Studi Perencanaan Pembangunan Regional Universitas Gajah Mada: Yogyakarta, Indonesia, 2016; Available online: https://psppr.ugm.ac.id/wp-content/uploads/sites/49/2017/04/Working-Paper-Smart-City-Yogyakarta_UPLOAD_web-1.pdf (accessed on 25 May 2019).
- DISKOMINFOSTANDI. Book#2: Master Plan Smart City Kota Bogor; Dinas Komunikasi, Informasi, Statistik dan Persandian: Bogor, Indonesia, 2017; Available online: https://kominfo.kotabogor.go.id/asset/images/web/files/buku-2.-masterplan-smart-city-kota-bogor.pdf (accessed on 22 May 2019).
- PEMKOT Malang. Roadmap Smart City Kota Malang; Pemerintah Kota Malang: Malang, Indonesia, 2017; Available online: https://barenlitbang.malangkota.go.id/wp-content/uploads/2019/03/Lapkir-Roadmap-Smart-City-Kota-Malang.pdf (accessed on 22 May 2019).
- Lu, Y.; Sarkar, C.; Xiao, Y. The effect of street-level greenery on walking behavior: Evidence from Hong Kong. Soc. Sci. Med. 2018, 208, 41–49. [Google Scholar] [CrossRef] [PubMed]
- Sukarno, I.; Matsumoto, H.; Susanti, L.; Kimura, R. Urban energy consumption in a city of Indonesia: General overview. Intern. J. Energy Econ. Policy 2015, 5, 360–373. [Google Scholar]
- Dahanayake, K.C.; Chowa, C.L.; Hou, G.L. Selection of suitable plant species for energy-efficient vertical greenery systems (VGS). Energy Procedia 2017, 142, 2473–2478. [Google Scholar] [CrossRef]
- Rahman, M.A.; Moser, A.; Gold, A.; Rötzer, T.; Pauleit, S. Vertical air temperature gradients under the shade of two contrasting urban tree species during different types of summer days. Sci. Total Environ. 2018, 633, 100–111. [Google Scholar] [CrossRef]
- Takano, T.; Nakamura, K.; Watanabe, M. Urban residential environments and senior citizens’ longevity in megacity areas: The importance of walkable green spaces. J. Epidemiol. Community Health 2002, 56, 913–918. [Google Scholar] [CrossRef] [PubMed]
- Larinde, S.L.; Oladele, A.T. Edible fruit trees diversity in a peri-urban center: Implications for food security and urban greening. J. Environ. Ecol. 2014, 5, 234–248. [Google Scholar] [CrossRef]
- Lu, Y. Using google street view to investigate the association between street greenery and physical activity. Landsc. Urban Plan. 2019, 191, 103435. [Google Scholar] [CrossRef]
- Dahlan, E.N. Amount of CO2 emissions and tree selection for high reduction: A case study in Kota Bogor. J. Media Konserv. 2008, 13, 85–89. [Google Scholar]
- Sulistijorini. Effectiveness and Tolerance of Road Green Belt Tree in Pollutant Reduction of NO2 from Transportation Activities. Master’s Thesis, Bogor Agricultural University, Bogor, Indonesia, 2009. [Google Scholar]
- Kemal, R.A.; Yulita, A.; Nufadianti, G.; Rosadi, I.; Muthmainah, S.I. Plants in Indonesia’s urban cities: Biotechnological values and diversity projection in 2050. Pros. Sem. Nas. Masy. Biodiv. Indonisia 2015, 1, 1836–1841. [Google Scholar] [CrossRef]
- Crane, J.H.; Campbell, R.J.; Balerdi, C.F. Effect of hurricane Andrew on tropical fruit trees. Proc. Fla. State Hort. Soc. 1993, 106, 139–144. Available online: http://www.avocadosource.com/Journals/FSHSP/FSHSP_VOL_106_PG_139-144_1993.pdf (accessed on 15 May 2021).
- Lee, H.S. General rainfall patterns in Indonesia and the potential impacts of local seas on rainfall intensity. Water 2015, 7, 1751–1768. [Google Scholar] [CrossRef]
- Duncan, R.P.; Clemants, S.E.; Corlett, R.T.; Hahs, A.K.; McCarthy, M.A.; McDonnell, M.J.; Schwartz, M.W.; Thompson, K.; Vesk, P.A.; Williams, N.S.G. Plant traits and extinction in urban areas: A meta-analysis of 11 cities. Glob. Ecol. Biogeogr. 2011, 20, 509–519. [Google Scholar] [CrossRef]
- Puspasari, N. Effect of road segment improvement on changing of road capacity and environment. Media Ilm. Tek. Ling. 2016, 1, 25–34. [Google Scholar] [CrossRef]
- Colfer, C.J.P.; Newton, B.J.; Herman. Ethnicity: An important consideration in Indonesian agriculture. Agric. Hum. Values 1989, 6, 52–67. [Google Scholar] [CrossRef]
- Mavridis, D. Ethnic diversity and social capital in Indonesia. World Dev. 2015, 67, 376–395. [Google Scholar] [CrossRef]
- Li, Y.; Wang, X.; Dong, X. Delineating an integrated ecological and cultural corridor network: A case study in Beijing, China. Sustainability 2021, 13, 412. [Google Scholar] [CrossRef]
Publisher’s Note: MDPI stays neutral with regard to jurisdictional claims in published maps and institutional affiliations. |
© 2021 by the authors. Licensee MDPI, Basel, Switzerland. This article is an open access article distributed under the terms and conditions of the Creative Commons Attribution (CC BY) license (https://creativecommons.org/licenses/by/4.0/).