Abstract
In this paper, the grid-connected photovoltaic system in Tochigi prefecture, Japan, is presented, and its technical and economic performance after eight years is evaluated. The system has a peak power of 40.1 kWp and has been in operation since 2012. The entire electricity generated by the system was fed into the state grid. The system is suitably monitored for one year (2019) and analyzed using the parameters developed and defined in the standard IEC 61724-1 by the International Electrotechnical Commission. The system’s different parameters included array yield, final yield, capacity utilization factor, and performance ratio of the system. An analytical model with solar irradiation obtained from Power Data Access Viewer was developed to investigate and evaluate the efficiency of the system monthly and annual energy generation by comparing the simulated and measured energy acquired from the inverter. A positive linear relationship is observed between solar irradiation data obtained from Power Data Access Viewer and the grid-connected photovoltaic system energy injected into the utility grid. While an annual total of 48,521 kWh of energy was expected to be generated, 38,071 kWh was generated and injected into the utility in 2019. This study also introduces and explains the mechanism of the Feed-In-Tariff system in Japan. The performance of the grid-connected photovoltaic system under this study was compared with that of other systems installed across the globe.
1. Introduction
For the last few decades, global energy demand has been slowly increasing. Although fossil fuel resources are reducing, global energy demand is rising rapidly. The use of renewable energies is a thoughtful approach and solution to the energy demand. Renewable energy is one source of sustainable and alternative energy that has grown in popularity in today’s world. Solar, wind, hydro, geothermal, and biomass are only a few examples of renewable energies. Solar energy is one of the most effective and important renewable energies [1]. Solar energy is abundant in almost every region of the planet and has been used to generate energy for several years. Using PV modules, solar energy can be converted into a valuable source of electricity [2]. Since it is reliable and environment-friendly, PV systems have been installed for energy generation in different parts of the world. Additionally, due to the continuous reduction of fossil fuels, PV systems have the ability to become a significant source of energy generation in the future. Energy generation from PV systems has grown rapidly across the world, with a total annual of 50 GW in 2015 [3]. The amount of PV energy generated depends on many factors. Solar radiation, PV cell or module technology, and outside temperature are considered the main factors that influence energy generation. Japan is one of the PV energy producers in the world.
The capacity of PV systems installed in Japan till 2017 is 42 MW [4]. PV energy has been increased in Japan in response to the global trend of growing environmental awareness. The new Feed-In-Tariff (FIT) system of Japan was released in July 2012 [5] to accelerate the promotion of renewable energy sources such as solar power generation, wind power generation, geothermal power generation. Since then, grid-connected photovoltaic (GCPV) systems have increased rapidly. Recently, various literature studied the feasibility of the GCPV system using simulation software. The study [6] compared different simulation software such as PV SOL, PV GIS, Solar GIS, and SISIFO to analyze the performance of a grid-connected PV system. The study [7] uses PVsys software to analyze the performance of an 8.2 kWp GCPV in the Patagonia Region.
The PV module manufacturers report the performance of their PV modules in datasheets. These documents rely on the data that are collected under standard testing conditions (STC): 1000 W/, 25 °C cell temperature, and Air Mass 1.5 (AM1.5) [8]. This cannot be trusted in real PV systems, as most of the time, temperature and air mass differ from one location to another, and PV cell temperatures could reach much higher values. However, STC does not give any information about the actual performance of a particular PV system in real life and under actual weather conditions [9]. To better evaluate the actual performance of the GCPV system, the impact of different parameters such as temperature, shading [10], solar irradiance [11], dust [12], solar tracking system [13], inverter efficiency [14], and panel material [15] have been investigated. In the study [16], the influence of different PV cell spacings on the performance of the photovoltaic system was identified. The energy, environmental, and economic performance of an urban community hybrid distributed energy system was investigated [17]. The paper [18] studied the role of energy and environmental indicators for the power grid. In the study [19], a photovoltaic array cleaning system design and evaluation were discussed. The result shows that using a cleaning system could increase the PV array energy generation by about 15%. Understanding the effect of weather conditions in outdoor exposure provides valuable input to PV energy projects at the planning and financing stages [20].
Since the performance of the GCPV system under STC cannot be trusted, this paper aims to evaluate the GCPV system performance under actual weather conditions. The results show a significant decrease in energy generation. In 2019, while a total annual of 48,521 kWh of energy was expected to be generated, 38,071 kWh was generated and injected into the utility.
The main contribution in this study as follows:
- Measure the actual energy generation acquired from the inverter of the GCPV system installed in Tochigi prefecture, Japan, over the year 2019.
- An analytical model with solar irradiation obtained from Power Data Access Viewer (PDAV) was developed to investigate and evaluate the efficiency of the GCPV system monthly and annual energy generation by comparing the simulated and measured energy acquired from the inverter.
- Analyze the techno-economic performance of the GCPV system after eight years of energy generation under actual weather conditions.
The structure of this paper is as follows:
The second section presents the current status of the FIT system in Japan, changing the rate over the years. Section 3 describes the GCPV system location, data collection, and PV system configuration. Section 4 presents descriptions and definitions of the technical and economic performance analysis of the GCPV. Section 5 shows the technical and economic performance analysis results of the GCPV system. The correlation coefficient between the simulated and measured energy together with a comparison of the performance parameters with results from the literature is presented in Section 6. Finally, the conclusions are presented in Section 7.
2. Photovoltaic (PV) Energy in Japan
2.1. The Feed-In-Tariff (FIT) System in Japan
Japan set in July 2008 a national target of increasing the installed PV systems capacity to 28 GW and 53 GW by 2020 and 2030, respectively, to meet the country’s renewable energy mix share [21], making Japan 4th place in the world for the cumulative solar PV installed capacity [22]. The Feed-In-Tariff (FIT) system was introduced first in 2009, but because of the Great East Japan Earthquake and nuclear disaster, the Japanese government accelerated the promotion of renewable energy sources and released a new (FIT) scheme in July 2012 [5]. The target renewable energies are solar power generation, wind power generation, geothermal power generation, small and medium-sized hydropower generation, and biomass. In the new FIT system, the electric power companies are obliged to purchase electricity generated from renewable energy sources at a fixed price on a fixed-period contract, 10 years for projects under 10 kW (>10 kW) and residential systems, and 20 years for projects over 10 kW [23]. PV power generation has two types of purchase price categories: 10 kW or more for industrial use and less than 10 kW for residential use. Figure 1 shows the basic mechanism of the Feed-In-Tariff (FIT) system in Japan [24].
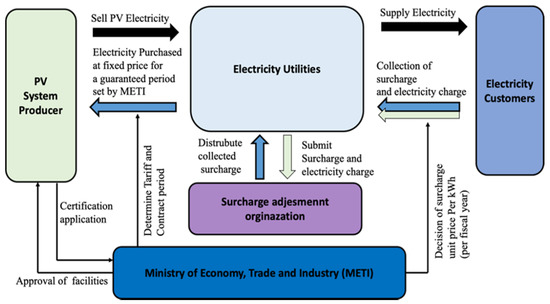
Figure 1.
The basic mechanism of the FIT system in Japan.
2.2. The Rate of Feed-In-Tariff (FIT) Over the Years in Japan
The FIT system was designed to stimulate investment in renewable energy generation by guaranteeing the purchase of electricity over the long term. When the FIT system was introduced, the initial feed-in-tariff was 40 JPY/kWh (for plants larger than 10 kW). In fact, the PV energy FIT rate is reduced every year. For example, it was 42 JPY/kWh in 2012, but it decreased year by year to 24 JPY/kWh in 2019 for projects less than 10 kW and 14 JPY/kWh for projects more than 10 kW. Table 1 shows the FIT rate changes over the years in Japan [25].

Table 1.
Changes in the FIT rate under Japan’s FIT scheme, 2012–2019.
3. GCPV System Description and Data Collection
3.1. GCPV System Location
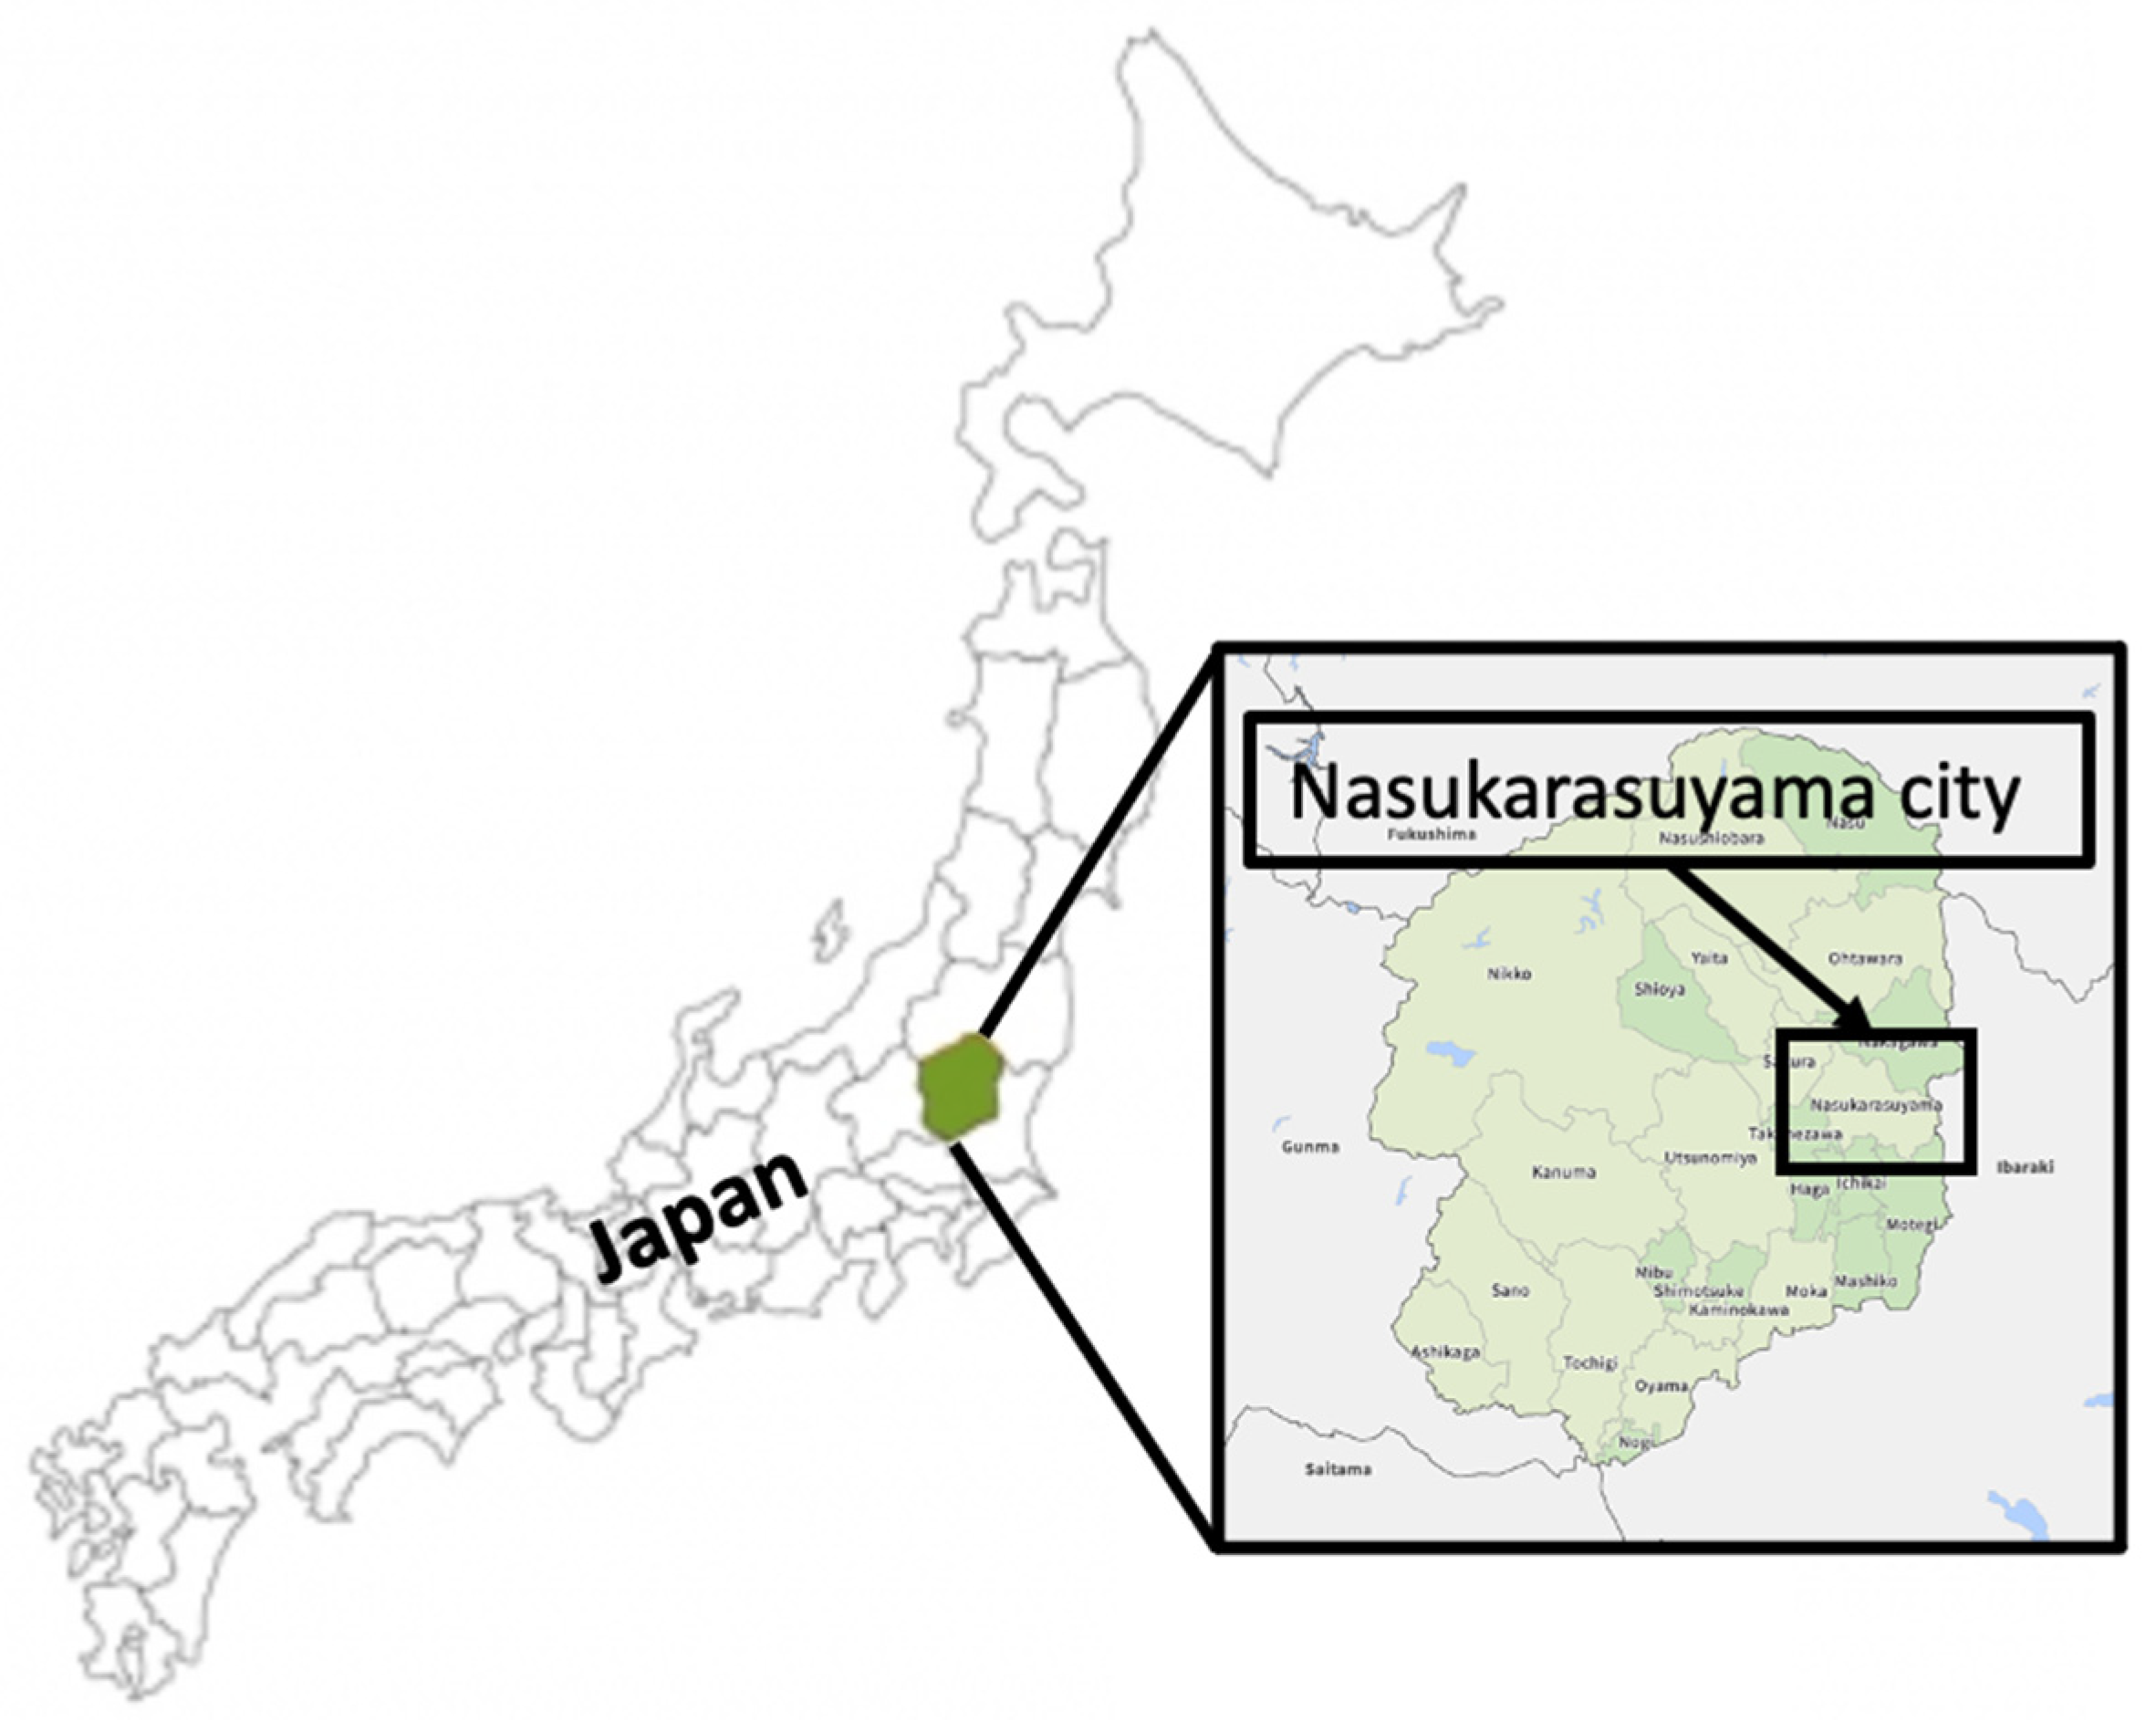
The GCPV system is installed in Tochigi prefecture, Japan (36.651949, 140.116528), with an installed capacity of 40.16 kWp. Tochigi prefecture is located in the Kanto region of Tohoku and is known for its warm, muggy, wet, and mostly cloudy summer. Winters are very cold and mostly clear. Figure 2 shows the location of the test sites in the Tochigi prefecture of Japan [26].
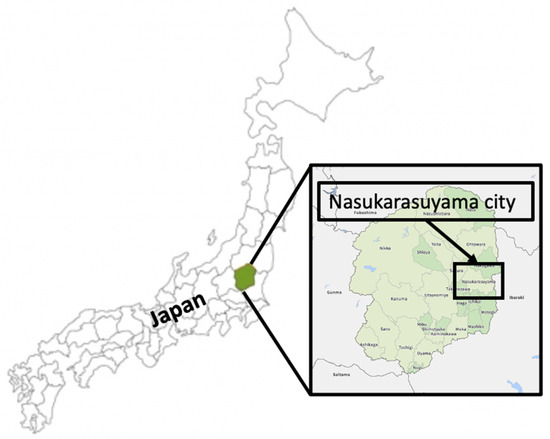
Figure 2.
The location of the GCPVS in the Tochigi prefecture of Japan.
3.2. Data Collection
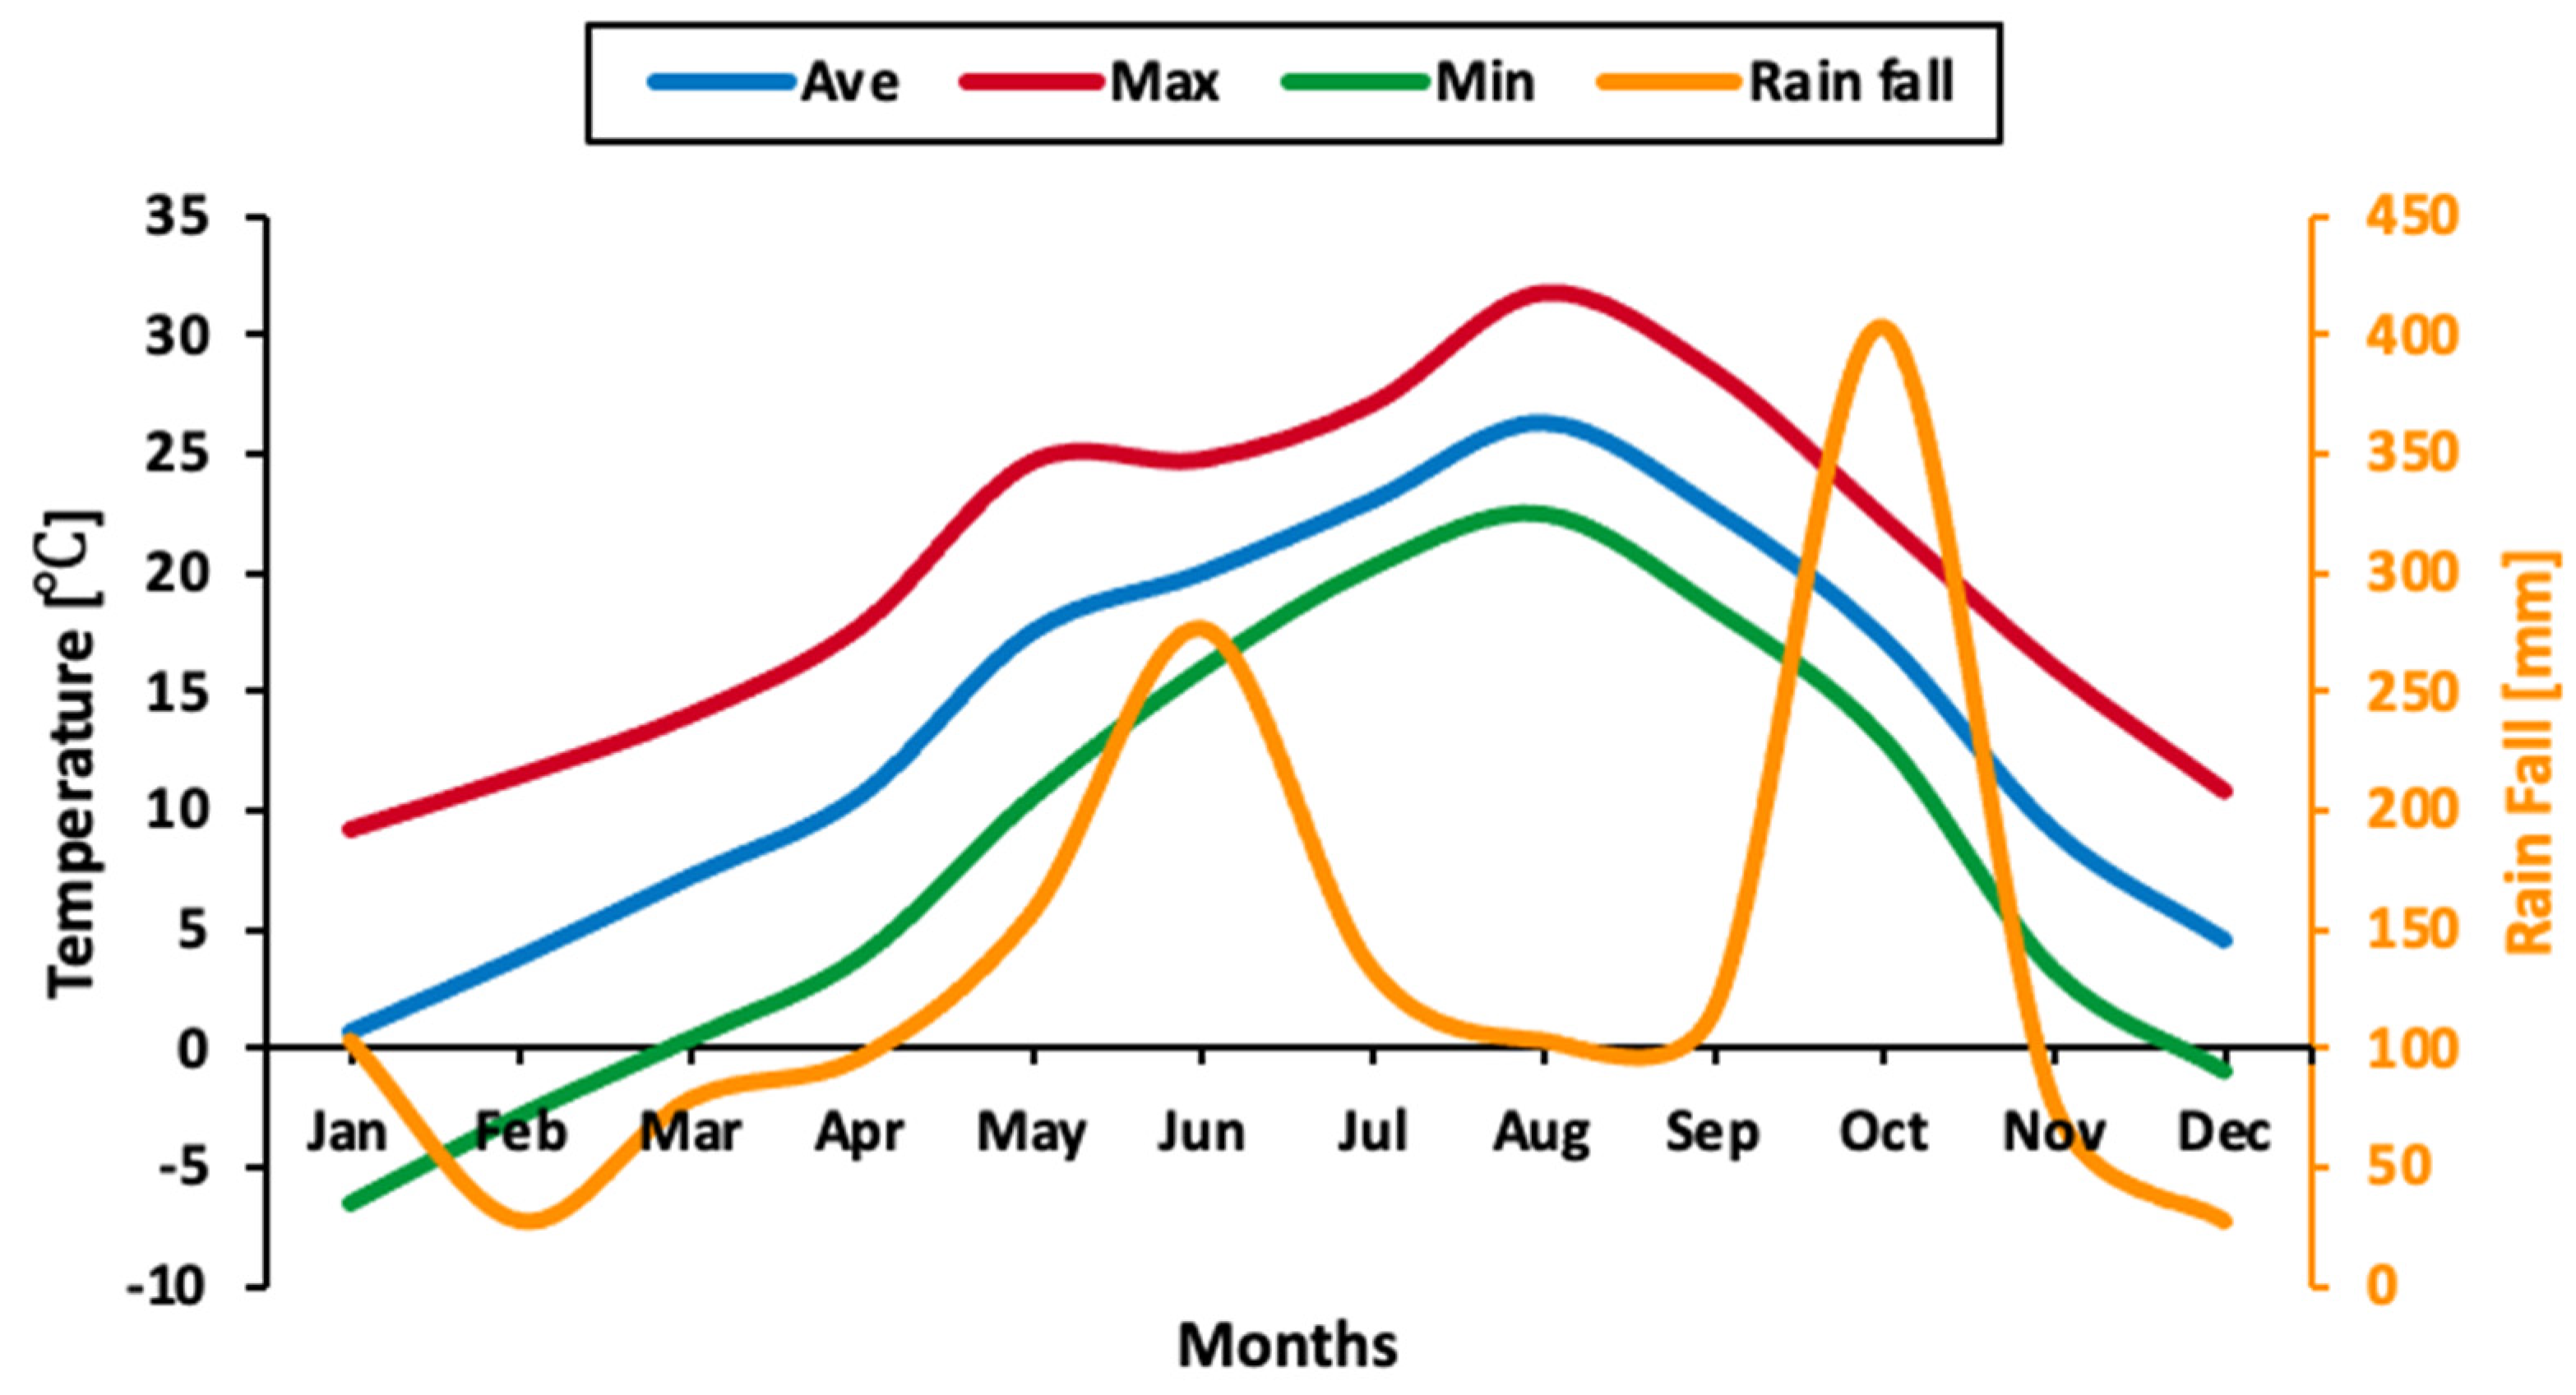
Solar irradiation is the most highly fluctuating and sensitive parameter for the PV system. Therefore, to confirm the model concept for simulating the energy generation and the efficiency of the GCPV system under evaluation in this study, we examined the solar irradiation data acquired from PDAV, which is NASA’s project for the prediction of worldwide energy resources [27], and identified their suitability for evaluating the efficiency of GCPV energy generation by comparing simulated results with actual measured values acquired from the PV system inverter. The energy generation was calculated from the proposed equations and then compared with the energy generation of the PV system on a monthly and yearly basis. The ambient temperature was recorded using a thermometer. Other meteorological data such as rainfall and the number of rainy days were collected from meteorological observatories [28,29]. The monthly temperature (average, maximum, and minimum), rainfall, and number of rainy days during the monitored period from January 2019 to December 2019 are presented in Figure 3 and Table 2. The maximum temperature is observed from June to August 2019. The highest rainfall occurred during October (403.5 mm), followed by June and May 2019.

Figure 3.
The monthly temperature (average, maximum, and minimum) and rainfall during the monitored period from January 2019 to December 2019.
Table 2.
The monthly average solar irradiation and the number of rainy days during the monitored period from January 2019 to December 2019.
3.3. The GCPV System Description
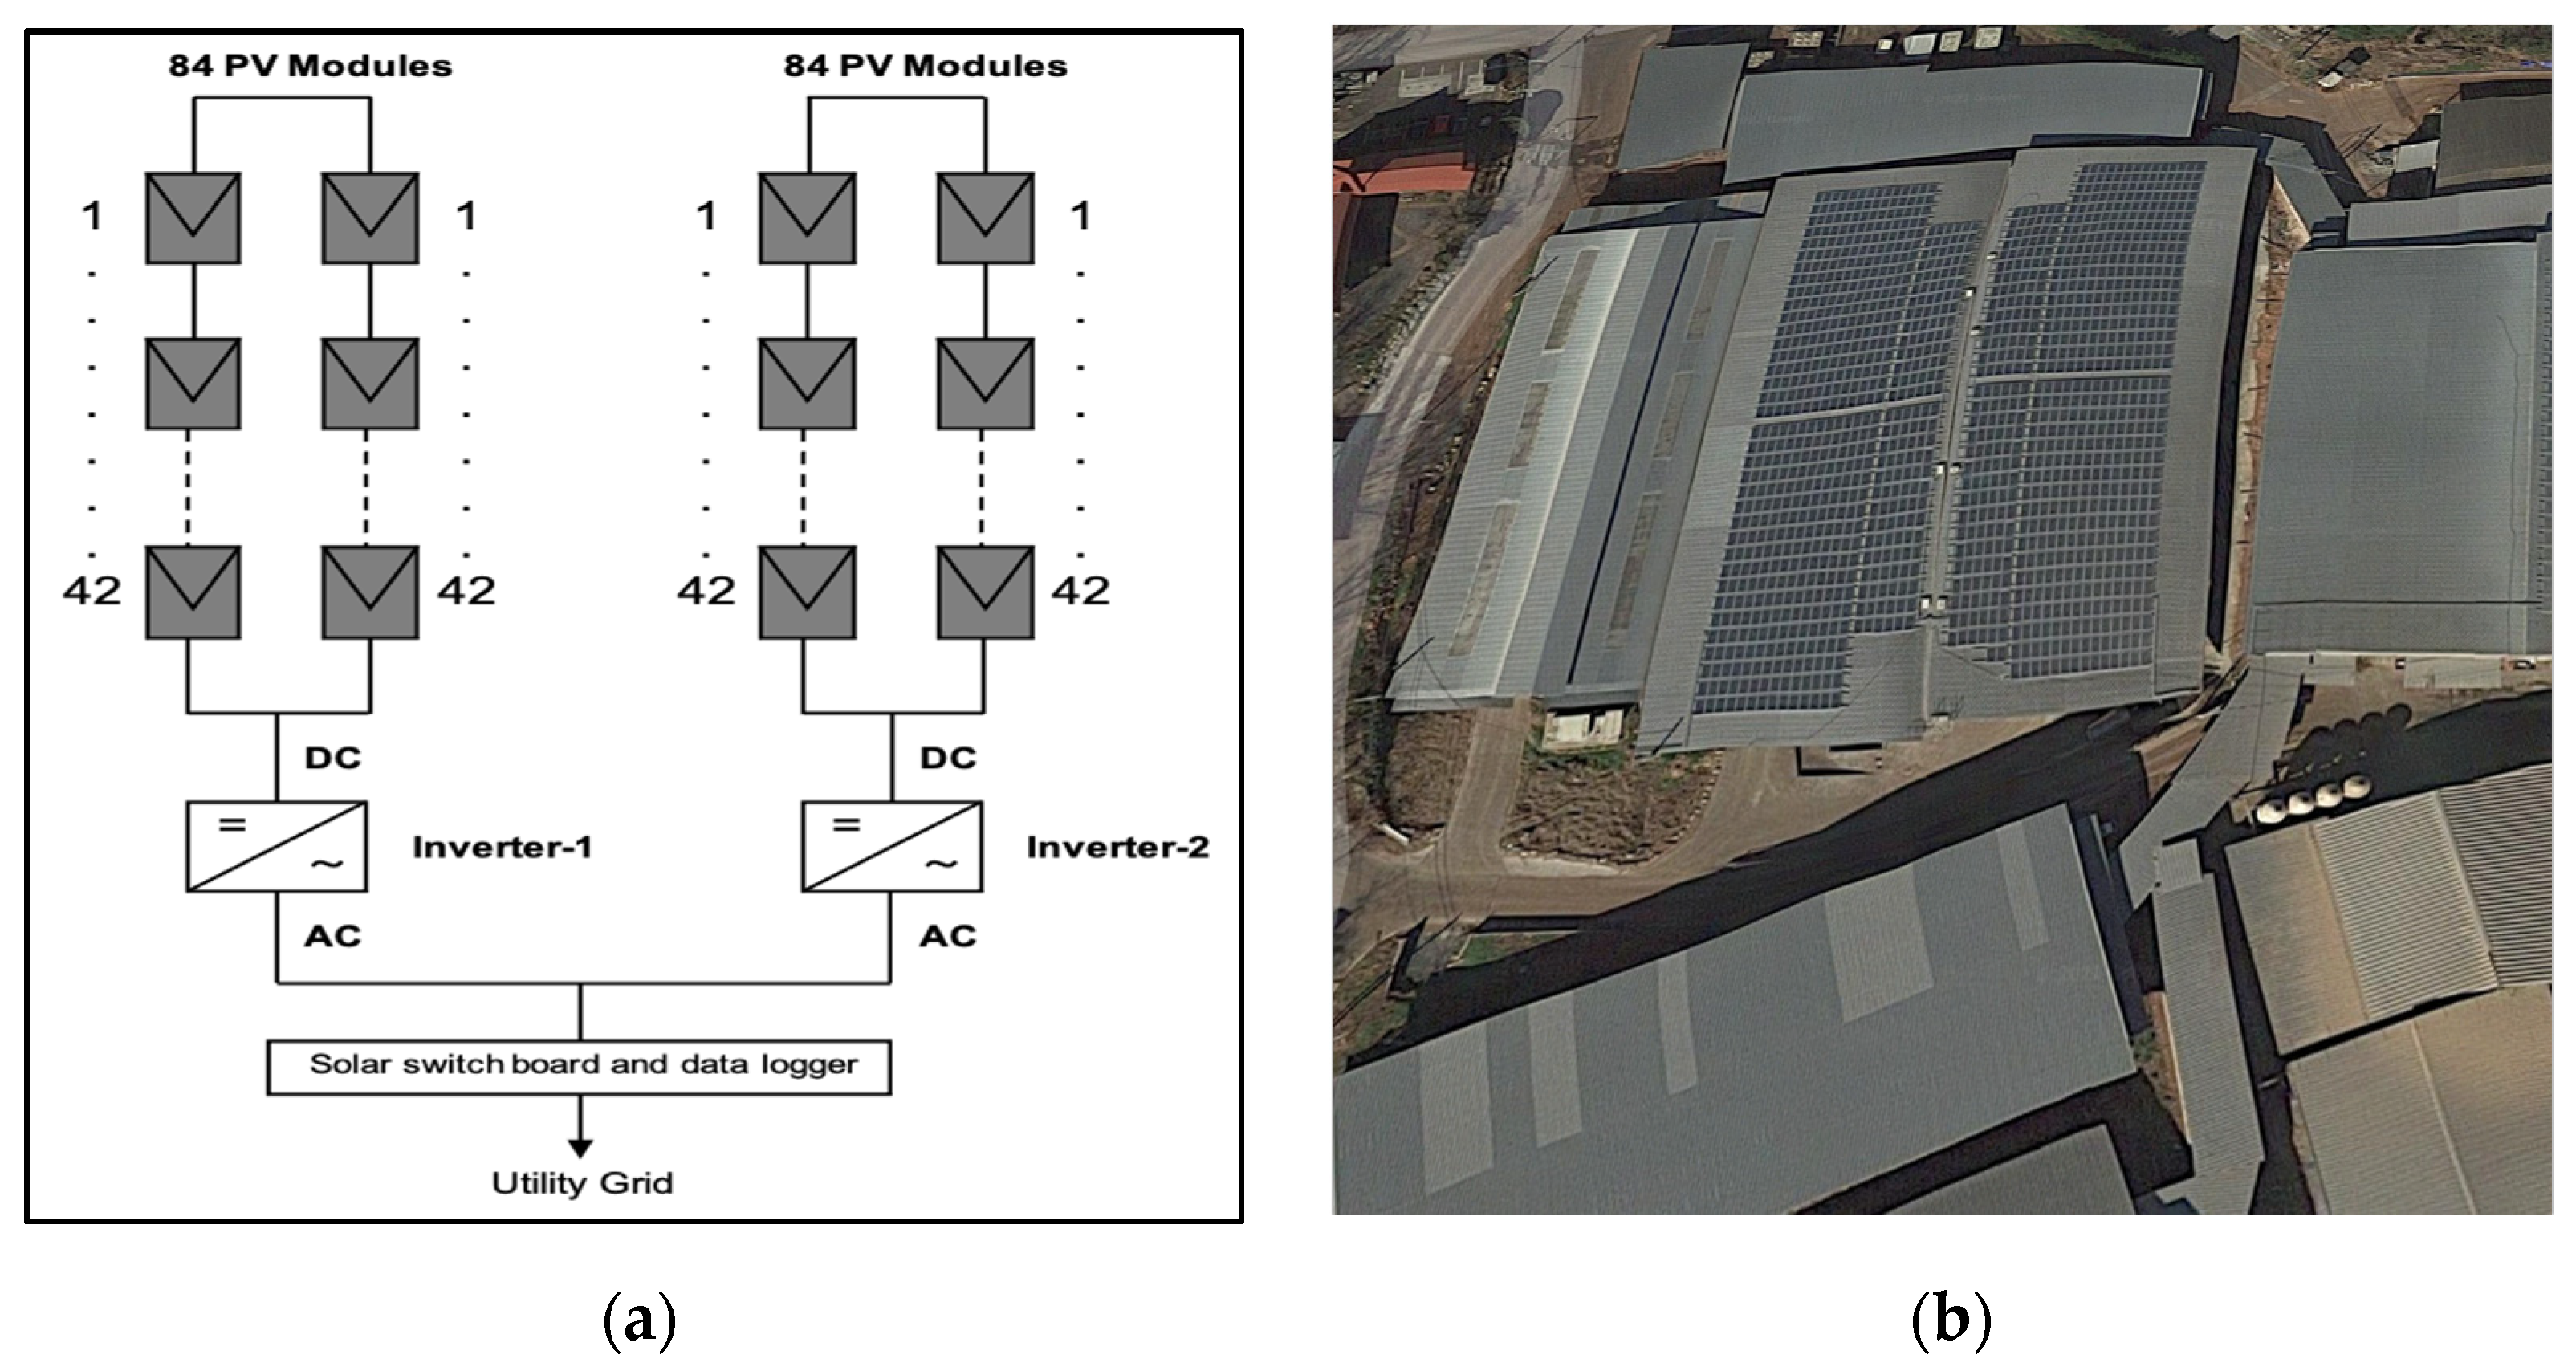
In a PV system, there are different PV array configurations to extract as much as more power output and improve efficiency. The PV array configuration of this study is a series configuration and consists of 168 PV modules with 245 W (each of 245 W capacity). The installation is equipped with two inverters and a data logger that continuously monitor, collect, and store data (voltage, current, and energy generation) at a logging interval of five minutes from inverters. Each inverter is connected to 84 PV modules, and the data is then transmitted from inverters and uploaded to a communication receiver. The energy of the system from inverters is fed into the utility grid and consistently recorded through the data logger over the year 2019. The PV modules are free from any effect of shading and subjected to cleaning twice monthly starting from the beginning of February 2019. The PV modules are fixed with a tilt angle of 30 facing south. The entire PV systems are mounted on metal frames supported by concrete pillars. The PV array specification is shown in Table 3. Figure 4 shows the schematic diagram and a view of the GCPV system in Tochigi, Japan.
Table 3.
PV array specification.
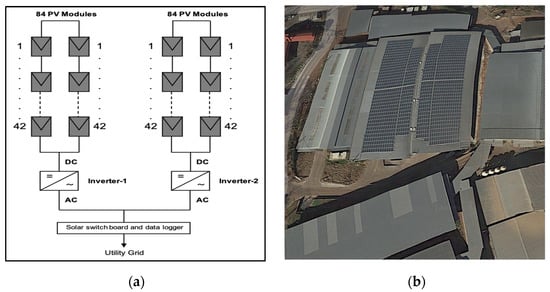
Figure 4.
(a) A GCPV system schematic diagram; (b) A view of the GCPV system in Tochigi, Japan.
4. GCPV System Performance Analysis Parameters Description and Definition
4.1. Technical Analysis Parameters of GCPVS Performance: Description and Definition
To analyze the technical performance of the present GCPV system, parameters developed and defined in IEC 61724-1, which have been used in various works [30,31,32,33,34] such as array yield, final yield, reference yield, capture loss, system loss, performance ratio, and capacity utilization factor, were discussed by computing the actual measured values collected during the assessment period of 12 months from January 2019 to December 2019 with simulated values using the proposed equations.
4.1.1. Simulated Energy ()
To monitor the performance of the GCPV system under actual weather conditions, measurements of the actual energy values from the inverter were made continuously.
The simulated AC energy is calculated based on Equation (1) as [2]
where is the installed capacity power output ) of the PV system under STC conditions, is peak sunshine hours, is the deration factor of energy, and is the efficiency of the PV subsystem.
The can be calculated by Equation (2) as [2]
where is the solar irradiation (kWh/ and is the solar irradiation under STC (kWh/.
Daily , monthly , and annual energy simulated by the PV system can be calculated using Equations (3)–(5):
where is the energy generation from the PV system in the hour of the day, is the energy generation from the PV system in a day, and is the day count of the month.
An example of detailed deration and losses that affect the performance of the GCPV system are: inverter losses (4–10%), temperature losses (5–20%), DC cables losses (1–3%), AC cables losses (1–3%), shadings (0–80%), losses at weak irradiation (3–7%), losses due to dust and snow (2%), and loss due to aging of the PV module [2]. These degradations, losses, and inefficiencies are usually depending on the PV system site, the PV cell technology, and the sizing of the system.
PV system energy generation estimate is done by using a variable multiplied by the power output of the PV system in kW. is different from the hours of sunlight, which is the total hours from sunrise to sunset. is the average solar irradiation ) a certain location receives per day. In this study calculation, to compare the measured and simulated energy generation using Equations (1)–(5), the values of 40.16 (kWp), 0.9 [2], and 0.932 [2] remain near constant. However, the value of changes daily and monthly with the changing levels of solar irradiation that was obtained from the PDAV.
4.1.2. Array Yield ()
The array yield is defined as the DC energy output from a PV array over a defined period (day, month, or year) divided by its rated power and can be calculated using Equation (6) as given in [14,35]
4.1.3. Final Yield ()
The final yield is defined as the daily, monthly, and annual AC energy output of the system injected into the utility grid divided by the rated power of the installed PV array at standard test conditions (STC) of 1 solar irradiance and 25 cell temperature. The final annual yield () can be calculated using Equation (7) as given in [33]:
4.1.4. Reference Yield ()
The reference yield () is the total in-plane solar insolation () divided by the array reference irradiance and can be calculated using Equation (8) as given in [33]:
4.1.5. Performance Ratio ()
The performance ratio () measures the ability of a PV system to generate energy. is calculated as the ratio of the actual to the theoretical energy generation during a reference period. The gap between theoretical and actual values of the energy generation is originating from the cumulative losses of the different components and devices that compose the PV system. Therefore, it indicates the percentage of energy really available after deducting energy losses [36]. can be calculated as a ratio of the final yield divided by the reference yield, and it represents the total losses in the PV system when converting from DC electricity to AC electricity. The is expressed as [7]:
4.1.6. Capacity Utilization Factor ()
Another performance parameter is the capacity utilization factor (). This parameter corresponds to the ratio between the current energy output and the energy that the PV system would produce if operated for 24 h at full rated power per day [7]. This factor is expressed by the following Equation as given in [37]:
where is the expected number of hours of operation in a given period for a regular month, which consists of 31 days, 744 h, or for a regular year consisting of 365 days, 8760 h, and is the final generated energy in kWh.
4.1.7. Array Capture Losses ()
Array capture losses are due to the PV array losses and can be calculated using Equation (11) as given in [14]:
4.1.8. System Losses ()
System losses are due to the conversion of a direct current into an alternative current by inverter and can be calculated using Equation (12) as given in [14]:
4.2. Economic Analysis Parameters of GCPVS Performance: Description and Definition
4.2.1. Levelized Cost of Energy ()
In this section, the indicator used for the economic analysis of GCPVS performance is described. The most common indicator to determine the profitability and financial aspects of the GCPV system is the Levelized Cost of Energy, which is used in this study to evaluate the economic feasibility of the GCPV system under this study. The is the present value of the price of the generated electrical energy, considering the economic life of the plant and the costs of construction, operation, and maintenance. The is given as Equation (13) [37]:
where is the initial or investment cost, is the annual operation and maintenance cost, is the annual electricity generated by the GCPVsystem installation, and is the capital recovery factor, which is given as:
where k is the payment period (in years), and n is the interest rate.
4.2.2. Energy Generation Sold Back to the Grid at Given FIT Rate
The electricity generated from the GCPV system under this study is sold back to the grid, at the FIT rate of 40 JPY/kWh excluding taxes, for 20 years. As the GCPV system under investigation in this study was established in 2012, the FIT sales price was calculated based on the FIT rate of 40 JPY/kWh (Table 1) and can be simulated based on Equation (15):
where is the simulated FIT sales price of the PV system, and is the simulated energy. Daily, monthly, and annual FIT sales price by the system can be calculated using Equations (16)–(18):
where is the FIT sales rate of the system in hour of the day, is the FIT sales price of the system in a day, and is the day count of the month.
The PV array sales price was also calculated based on the values of energy measured and injected into the utility grid at a FIT rate of 40 JPY/kWh and can be calculated based on Equation (19):
where is the FIT sales price of the GCPV system, and is the energy measured and injected into the utility grid.
5. Technical and Economic Performance Analysis Results
5.1. Technical Analysis Performance Results
5.1.1. The Annual Energy
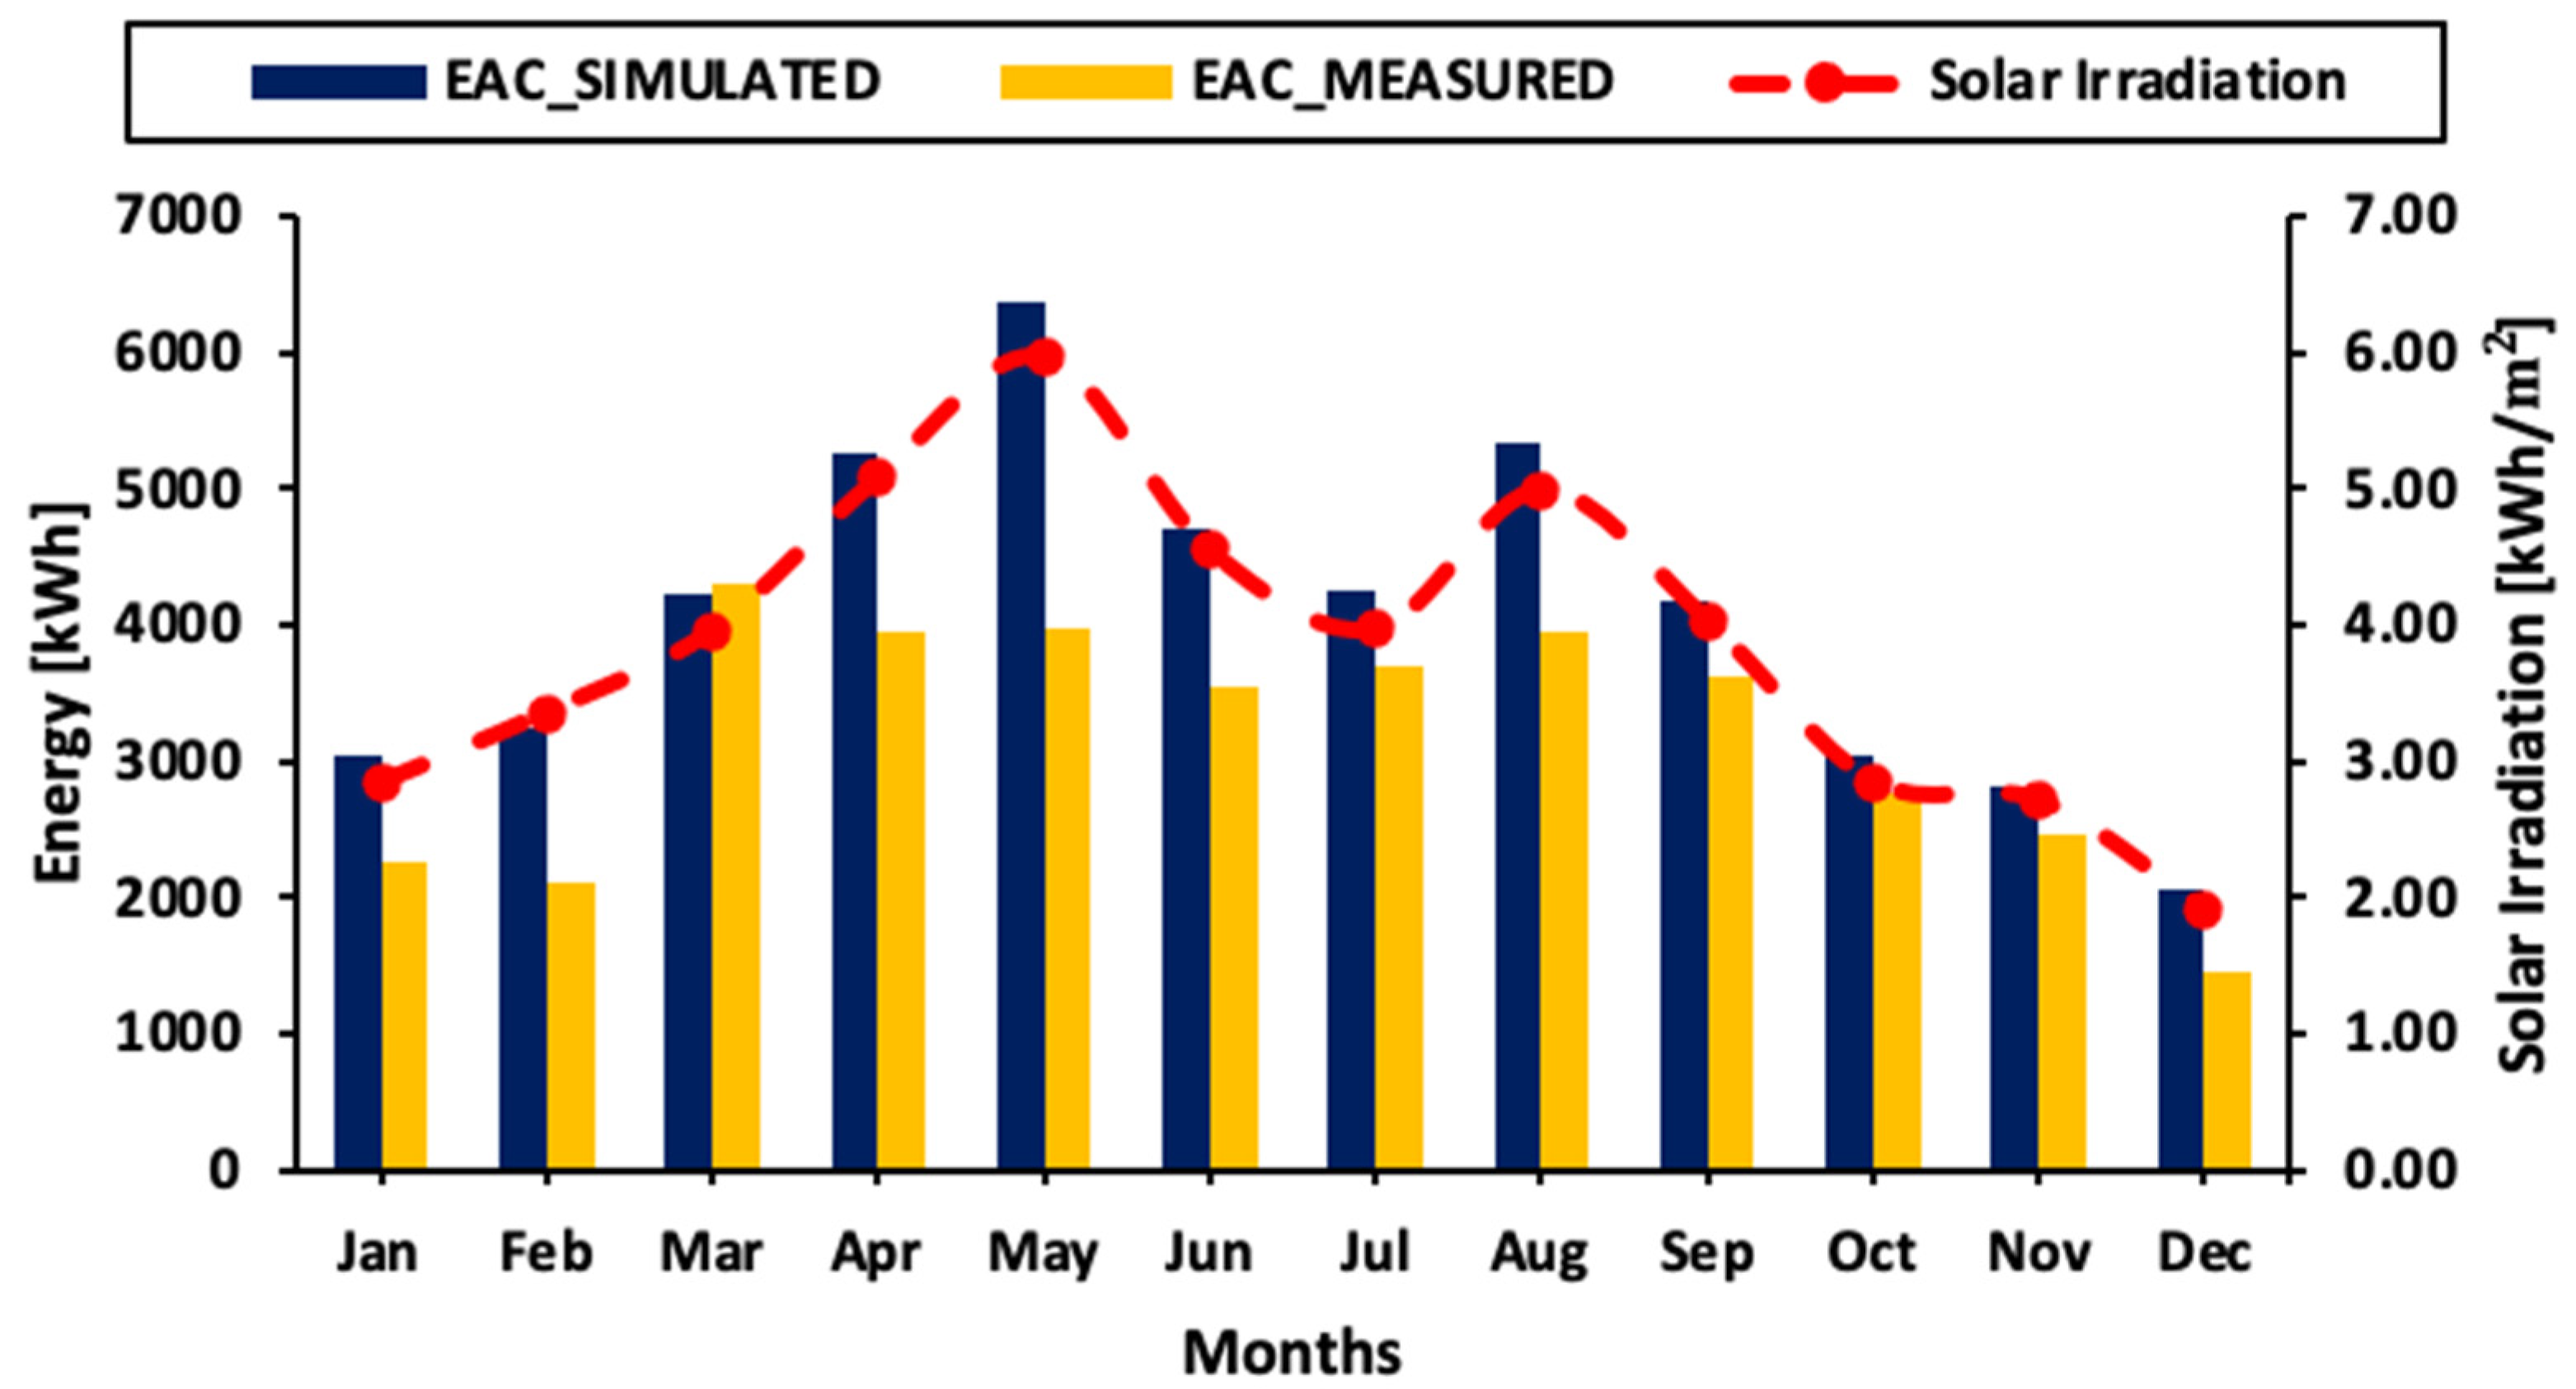
Figure 5 shows the simulated and measured energy of the GCPV system for each month in the year 2019 in correlation with solar irradiation. The analytical model proposed using Equations (1)–(5) described in Section 4 and solar irradiation acquired from PDAV were employed to simulate the energy generation of the PV system.
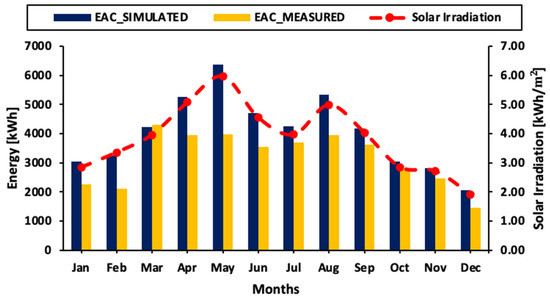
Figure 5.
The simulated and measured energy of the PV system for each month in the year 2019 in correlation with solar irradiation.
Each solar irradiation index showed a similar trend every month. Interestingly, when comparing simulated energy generation results using the solar irradiation index obtained from the PDAV with the measured actual energy generation, the simulated energy generation trend moved in the same direction as the measured actual energy generation. Comparing the actual energy generation data and simulated energy generation using the PDAV showed no statistically significant differences and provided a reliable result for the reference areas.
As a result of the simulation made by considering all system components’ efficiency and considering that the PV system is old that installed in 2012, the result shows a significant decrease in the energy generation. While a total annual of 48,521 kWh of energy was expected to be generated with a 260 W module, 38,071 kWh was generated and injected into the utility in 2019. The difference between simulated and measured energy is attributed to assumptions such as the use of hourly average solar irradiation intensity by the model, different PV module (PV cell) temperatures, and real-life conditions. The annual percentage of reduction in the energy generated was 22%. As can be seen from Figure 5, there is a reduction in the energy from September 2019 to December 2019, and this can be explained since the amount of solar irradiation drops as it is considered winter in Japan. The highest and the lowest average monthly energy generation of the PV system was 6376 kWh in May and 2052 kWh in December, respectively.
5.1.2. The Monthly Energy
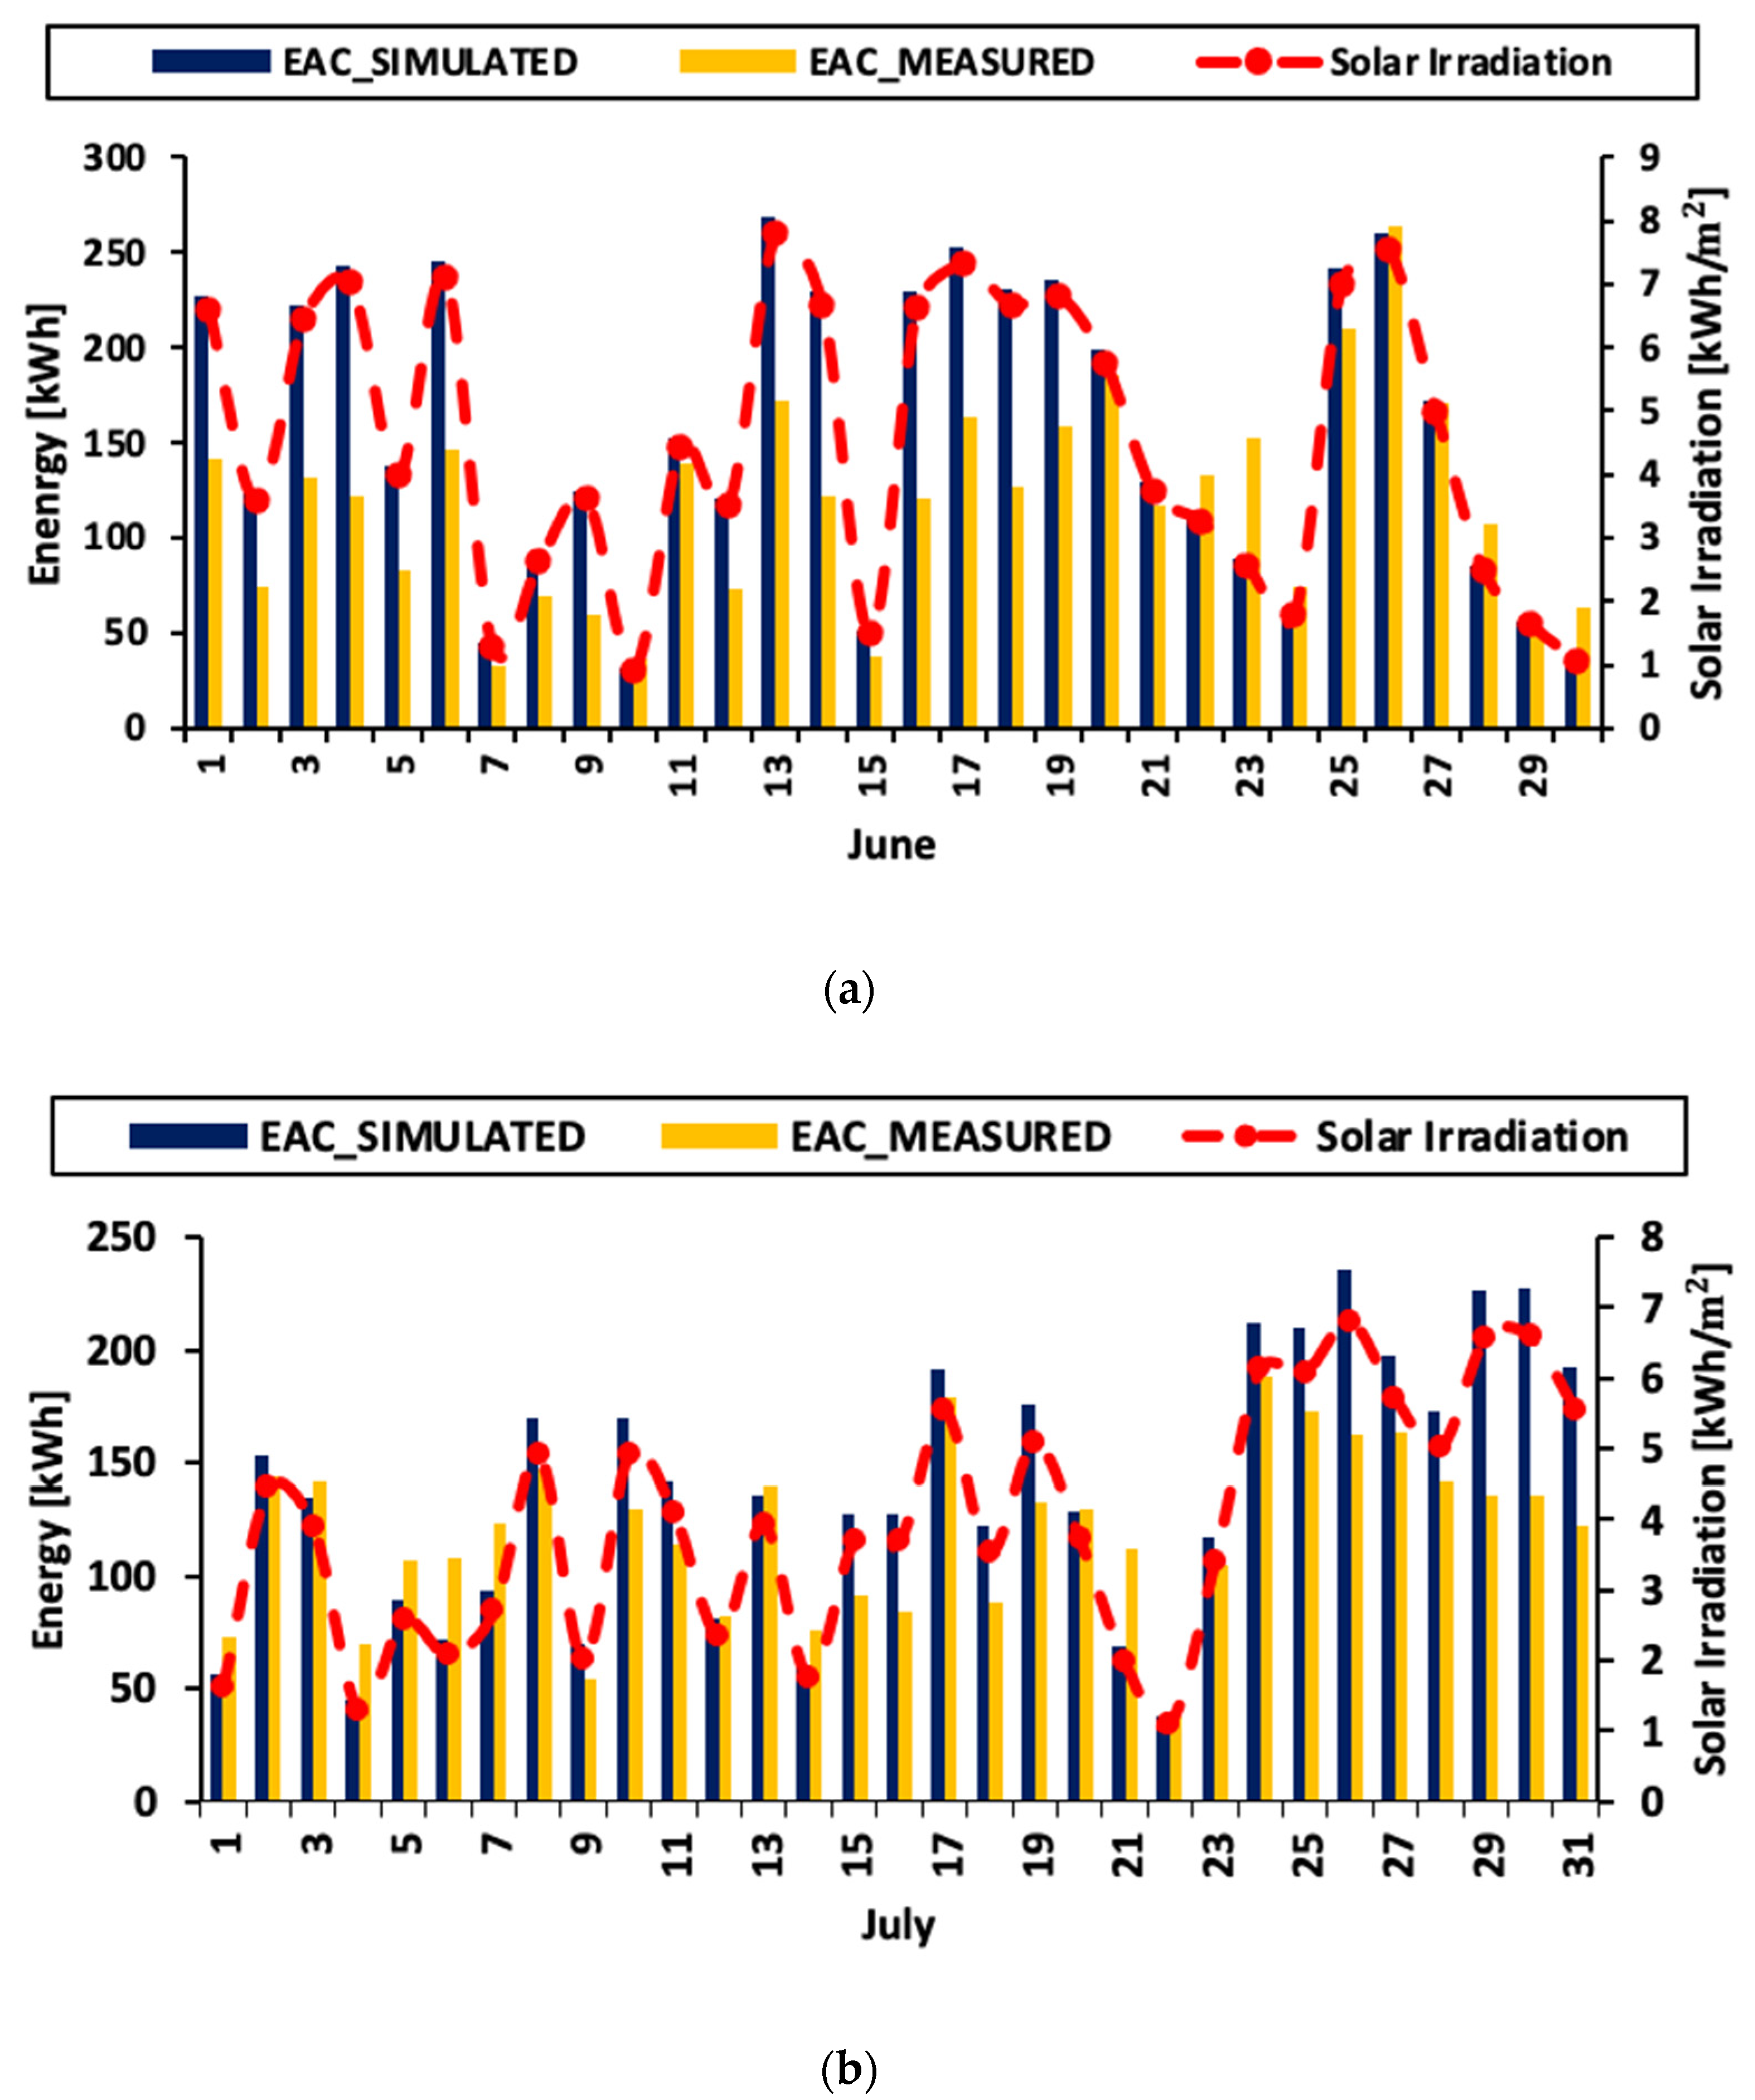
To validate the proposed analytical model, its simulated values were compared with measured values. For example, see Figure 6, which shows the PV system energy generation for the summer season in Japan (June, July, and August). The graph shows that the two sets of results are very close to each other most of the time. However, as shown in Figure 6c, from 1 to 9 August, due to the summer season with a high temperature of more than 35 °C, the simulated and measured values show a significant difference. Taking into account the PV module degradation losses, temperature losses, soiling losses, internal network losses, and inverter losses, the experimental studies show more real data for the system under actual weather conditions. In July 2019, while a total monthly of 4243 kWh of energy was expected to be generated with a 260 W module, 3693 kWh was generated and injected into the utility grid. In August 2019, while a total monthly of 5334 kWh of energy was expected to be generated, 3951 kWh was generated and injected into the utility grid. The highest energy generation was observed during March 2019. This differs from the study [34], where the highest energy generation was observed during July. Table 4 shows the Average monthly performance parameters of the 40.16 kWp GCPV system from January to December 2019.
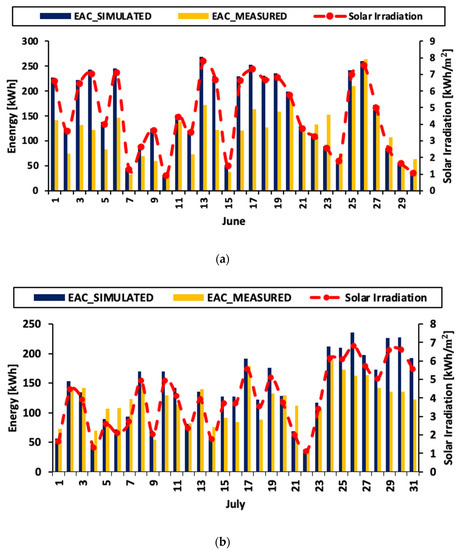
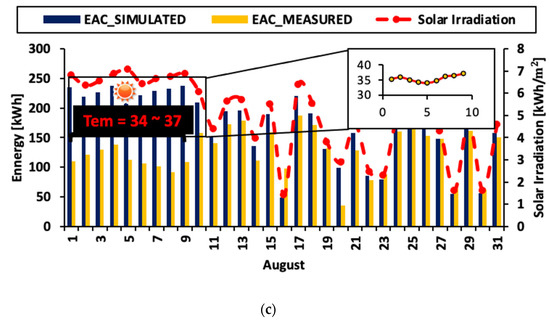
Figure 6.
The simulated and measured energy of the PV system for the summer season in Japan in the year 2019 in relation to solar irradiation: (a) June, (b) July, and (c) August.
Table 4.
Average monthly performance parameters of the 40.16 kWp GCPV system from January to December 2019.
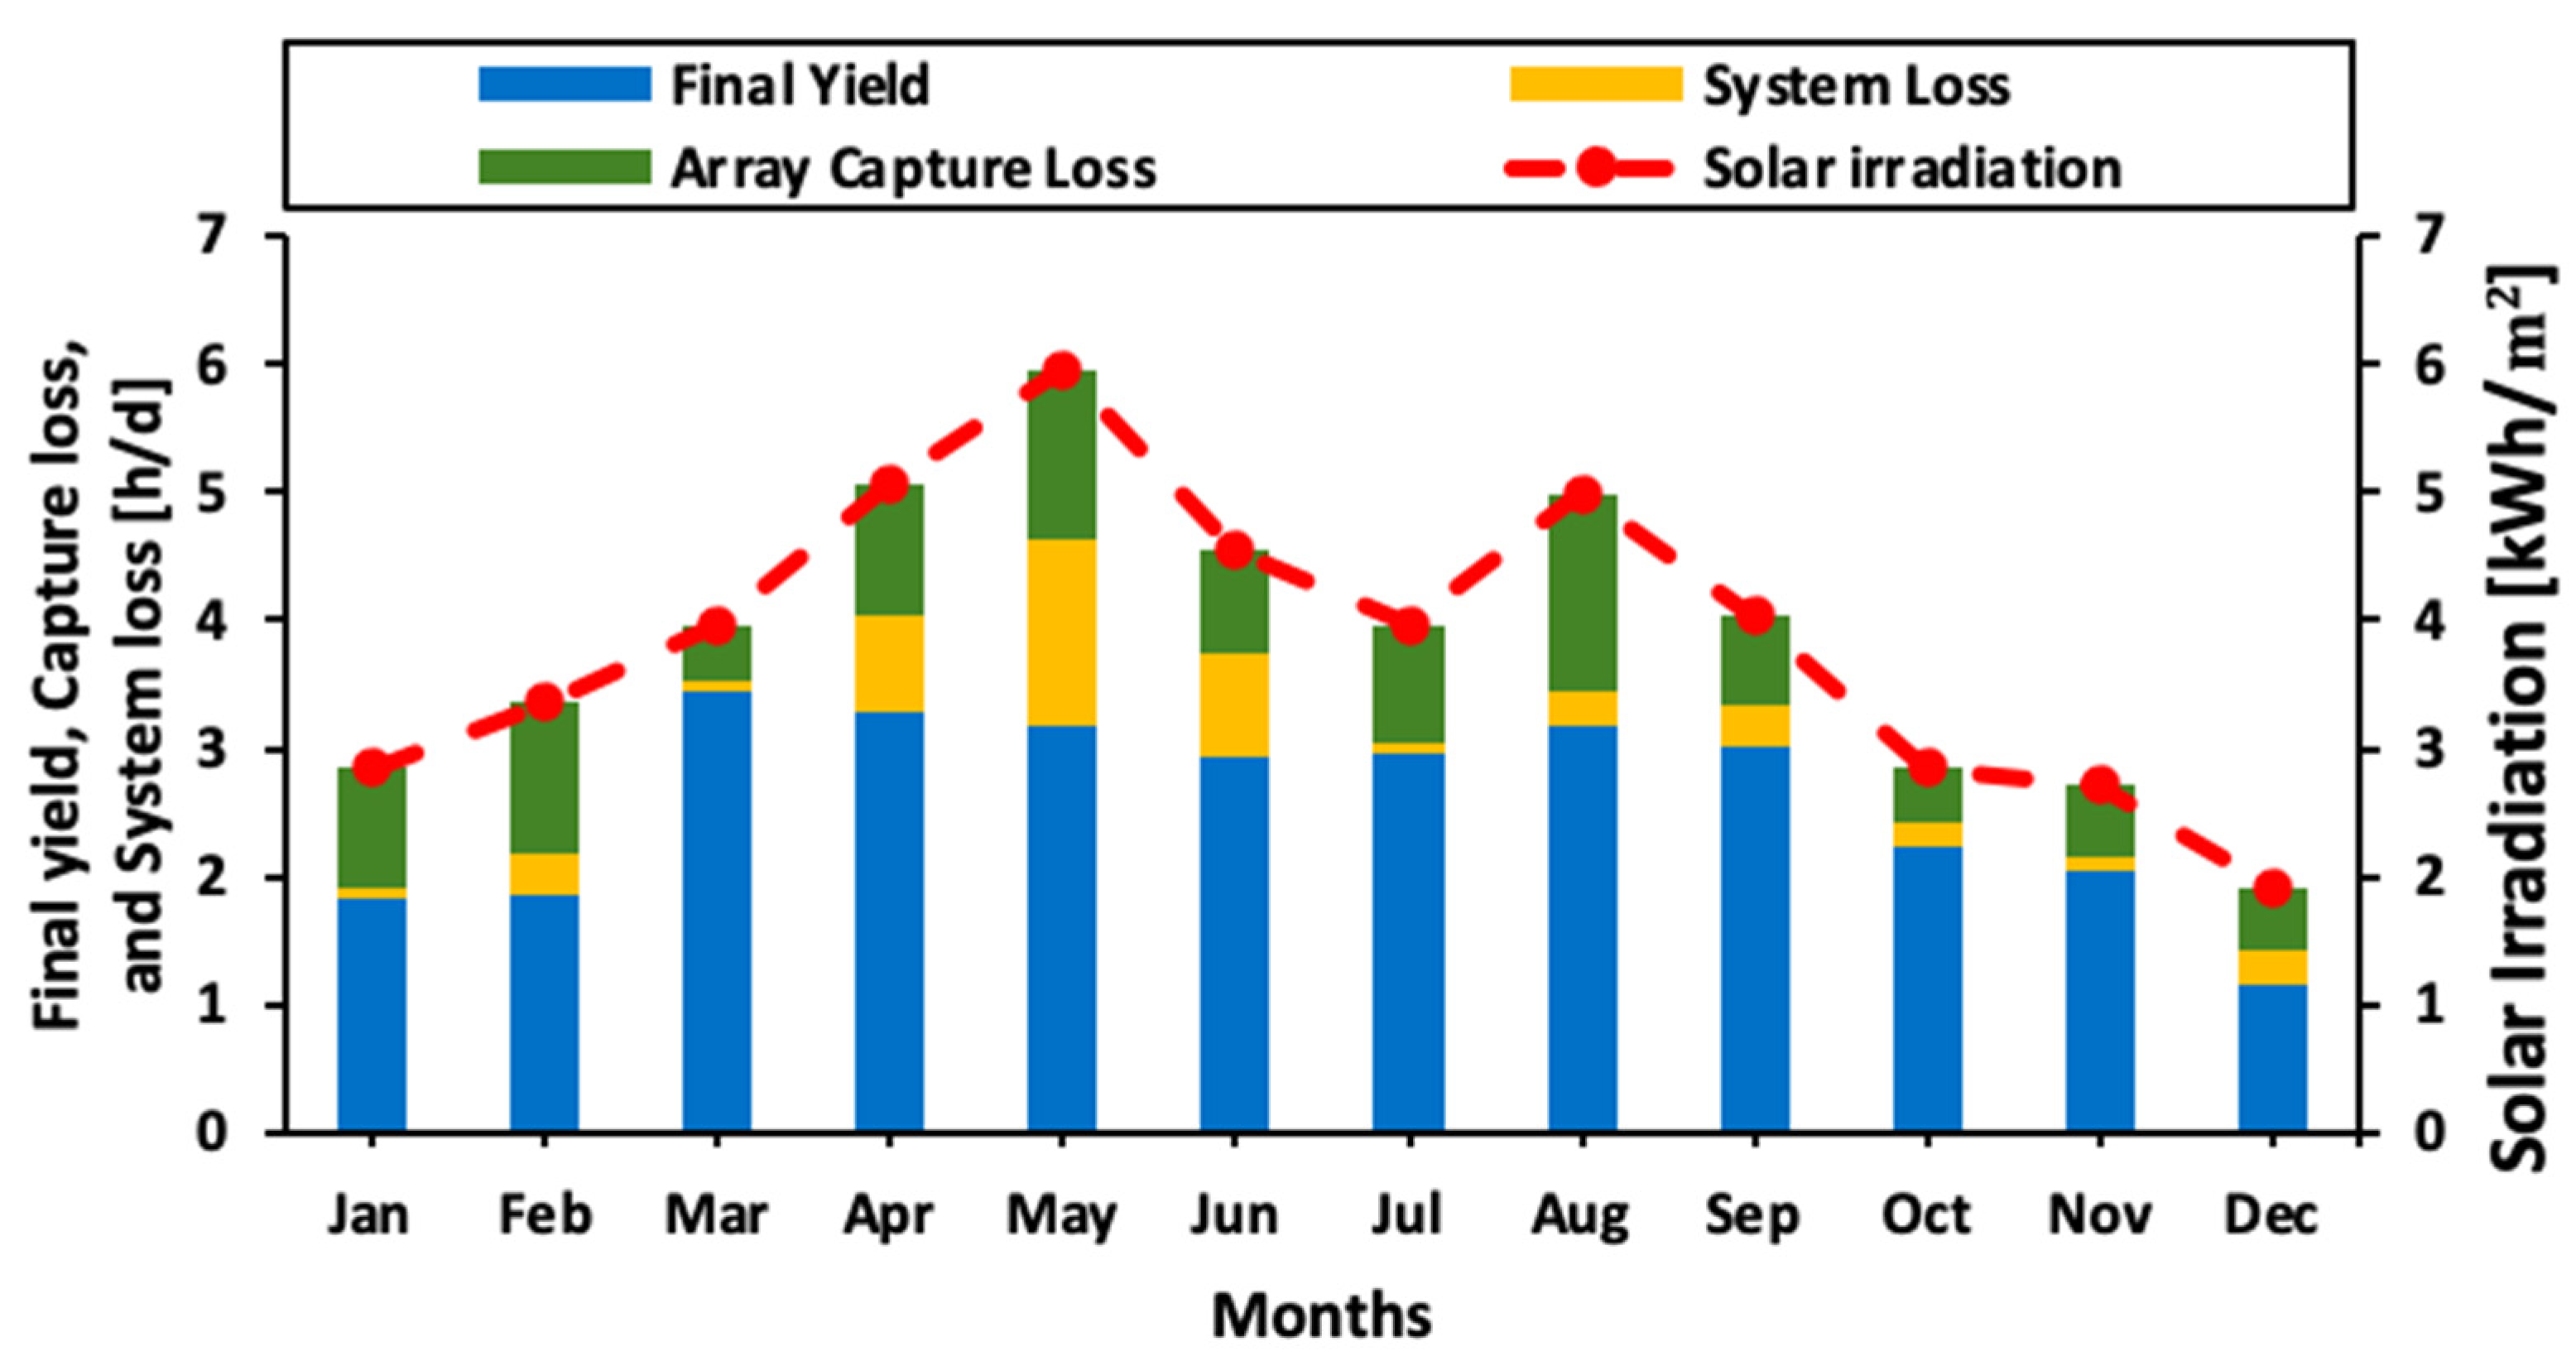
5.1.3. Yields and Losses
The performance results of the GCPV system are discussed in this section. Figure 7 shows the monthly averaged daily final yield, array capture losses and system losses. The final yield ranged from 1.16 (December) to 3.34 (March) h/d. The monthly averaged daily array losses ranged from 0.43 (March and October) to 1.53 (August) h/d, and the system losses ranged from 0.06 (January) to 1.54 (May) h/d. Figure 8 shows the monthly average daily GCPV system’s final, reference, and array yields over the monitored period. The monthly average daily final, reference, and array yields varied between 1.83 and 1.16 h/d, 2.8 and 1.9 h/d, and 1.9 and 1.4 h/d in January and December, respectively. The annual average daily final, reference, and array yields were 2.59 h/d, 1.91 h/d, and 2.98 h/d, respectively. In general, both reference and final yields are directly proportional to solar irradiation, and a higher reference yield means more solar irradiation.
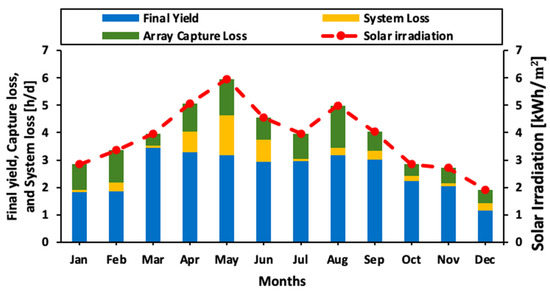
Figure 7.
The monthly averaged daily final yield, array capture losses, and system losses over the monitored period (2019).
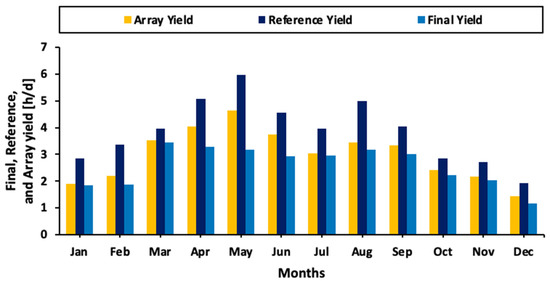
Figure 8.
The monthly average daily PV system’s final, reference, and array yields over the monitored period (2019).
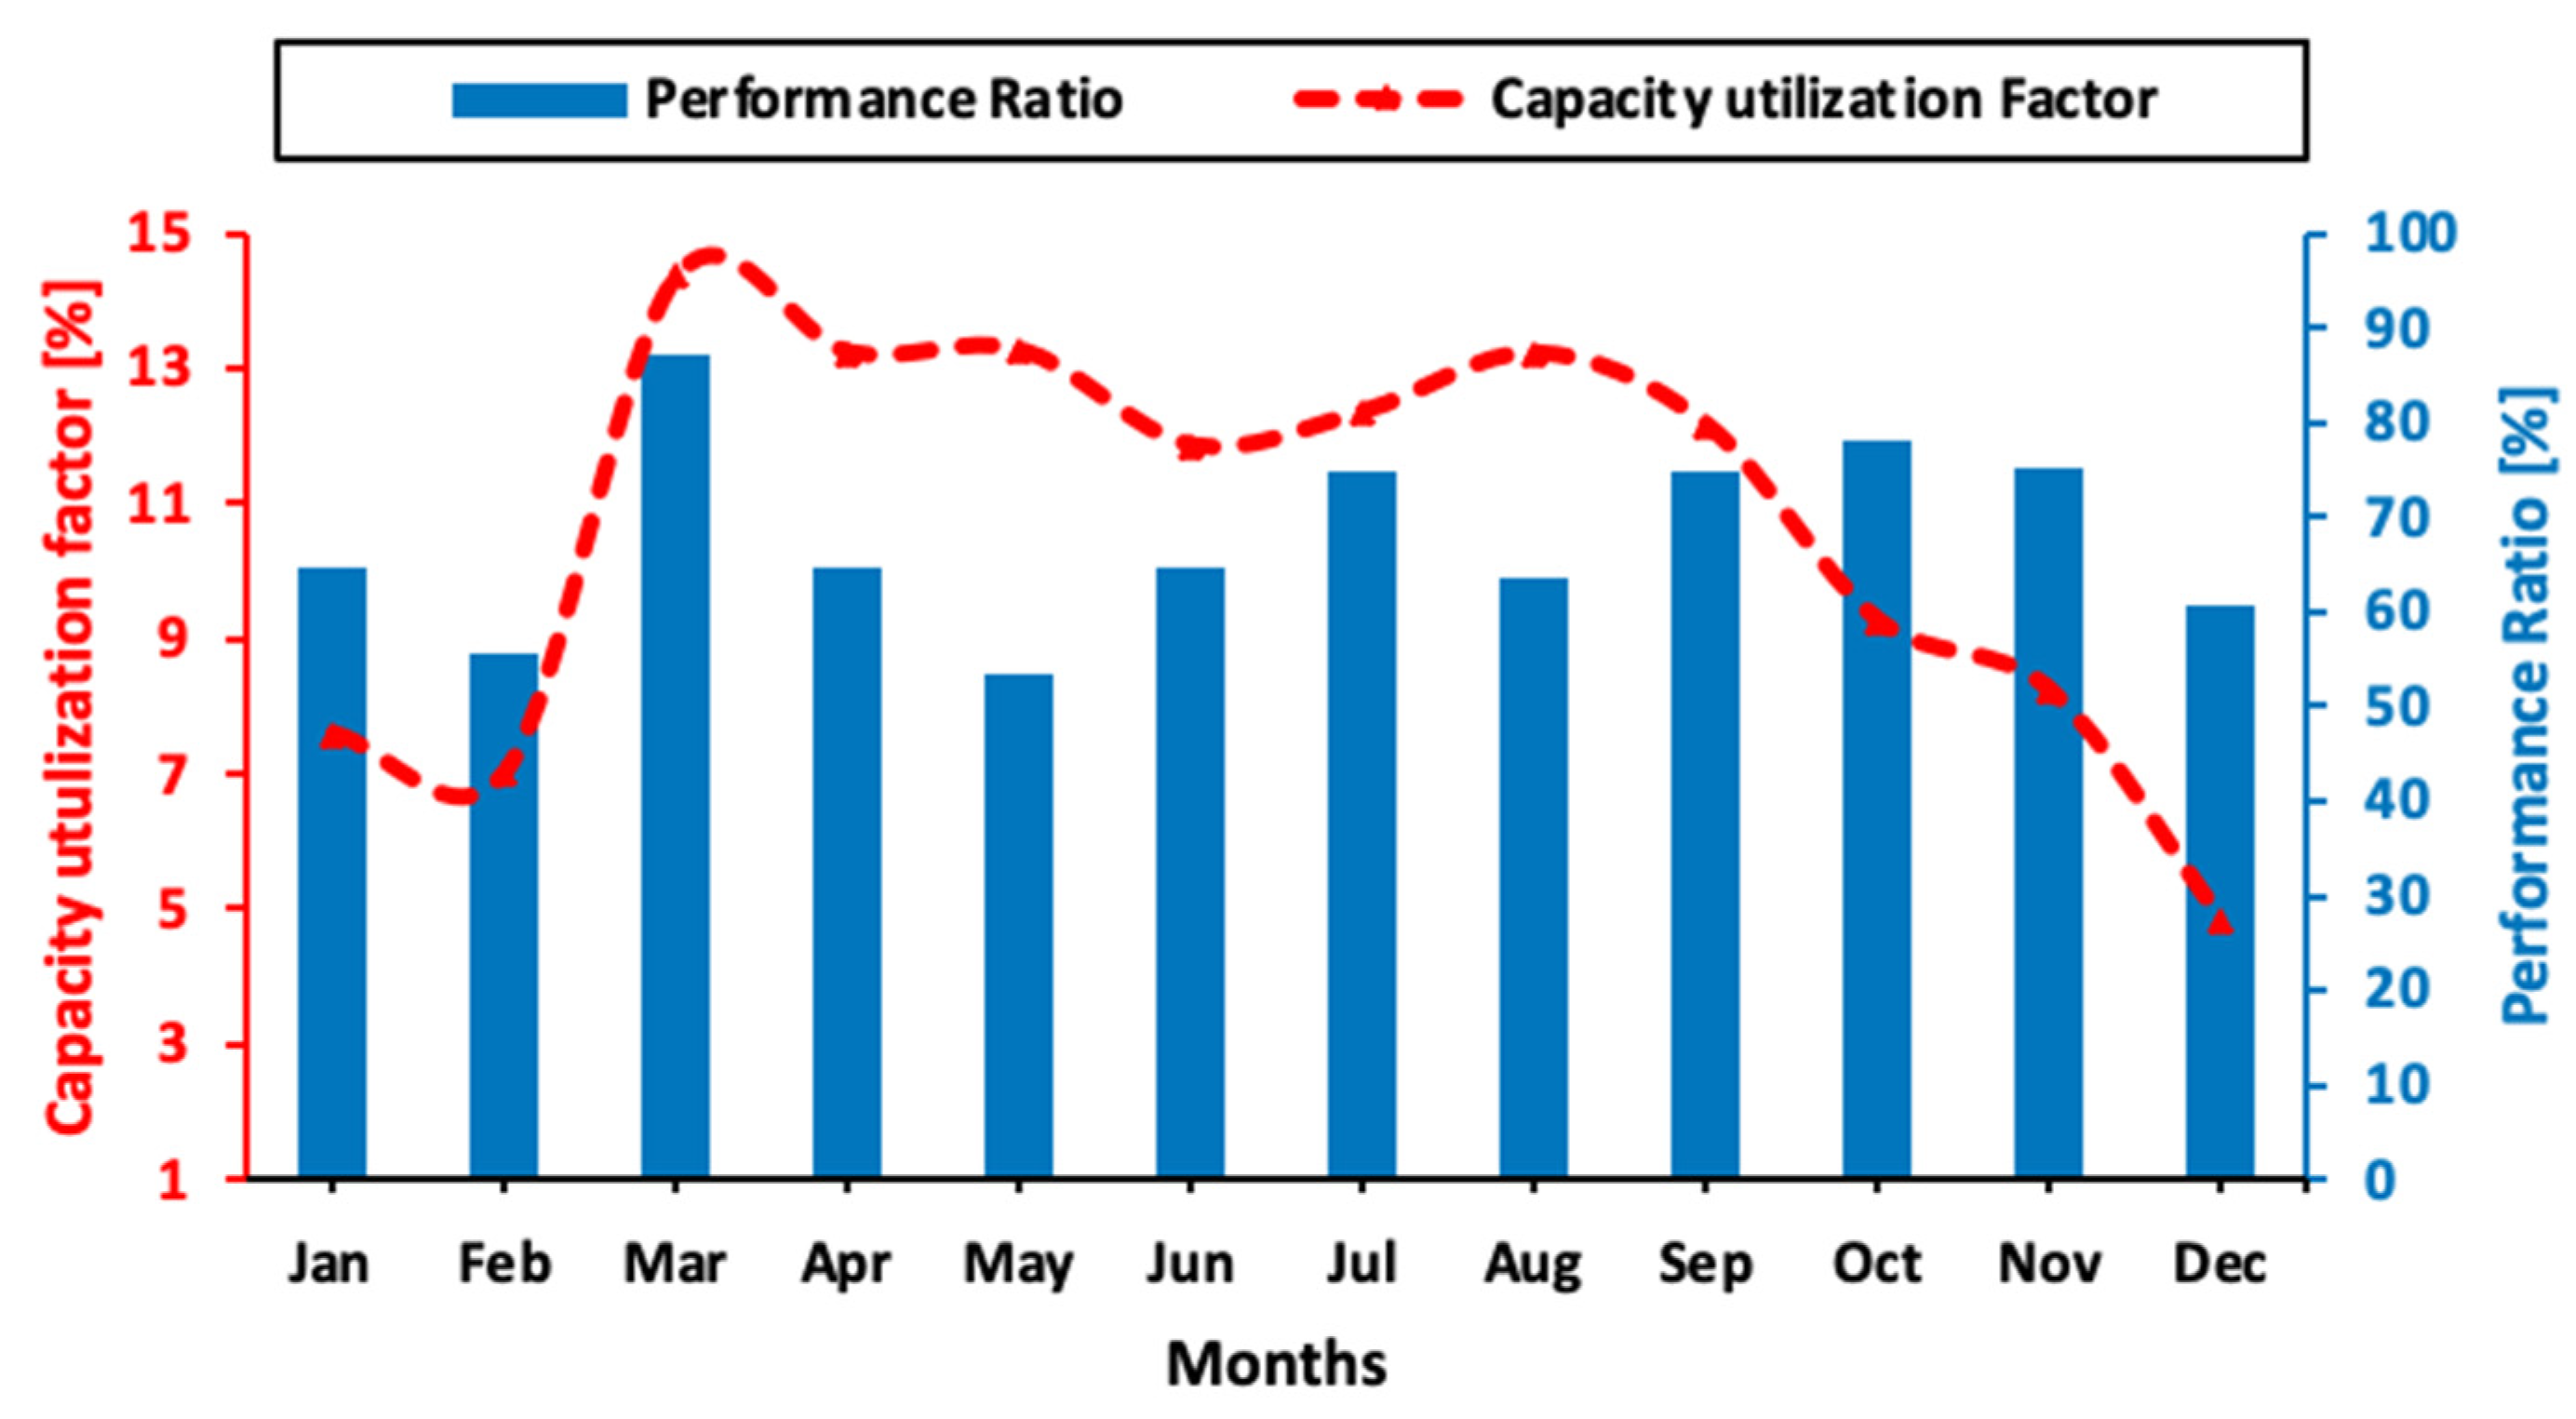
5.1.4. Capacity Utilization Factor () and Performance Ratio ()
Figure 9 shows the PV system capacity utilization factor and performance ratio over one year. The varied between 7.59% in January and 4.83% in December, with an annual average of 10.61%. The average annual value of (10.61%) is compared with the average of other PV systems, as shown in the last table.

Figure 9.
The average monthly capacity utilization factor () and performance ratio ( ) over one year (2019).
The performance ratio varied between 64.6% in January and 60.5% in December, and the annual average is 68.1%. The values of the is relatively low, especially in summer, with a drop to 53.4% in July. This could be attributed to the increase in PV module temperatures which result in high capture losses. values are higher in Spring (87.1% in March) than in summer owing to the cooling of PV module surfaces by the wind. The performance ratio was distributed within the range of 53.4–87.1%, and the annual mean value was 68.1%.
5.1.5. System Loss () and Array Capture Loss ()
Figure 10 shows the average monthly system loss () and array capture loss (). vary from a minimum of 0.06 h/d in January while a maximum of 1.44 h/d in May 2019. vary from a minimum of 0.43 h/d in September while a maximum of 1.53 h/d in August 2019. The and in winter (October to January) are lower than in summer (July to August). The change from 0.43 h/d to 0.85 h/d in winter and from 0.69 h/d to 1.53 h/d in summer. This confirms the effect of a high temperature on the capture energy losses during the summer months (June, July, and August).
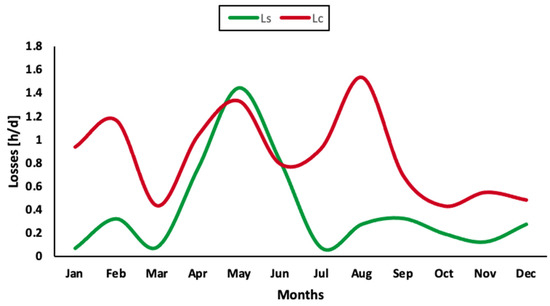
Figure 10.
Energy losses over the monitored period (2019).
5.2. Economic Analysis Performance Results
5.2.1. LCOE
The cost of energy per unit kWh () was estimated based on the following assumptions:
- The payment period (k) of a GCPVS installation in Japan is 20 years [36].
- The current interest rate (n) of 3.03% in Japan [38,39].
- The GCPV system installation’s annual average energy output (38,071 kWh/year) is assumed to be constant over the project life.
- The initial or investment cost is 420,000 JPY/kW (5135,088 $/kW) [25], which means 16,867.200 JPY/kW (206,225 $/kW) for the GCPV system under this study (40.16 kWp).
- The annual operation and maintenance ( cost is estimated as 200,000 JPY/year (2445 $/year) [25], and this is assumed to be constant for 20 years.
Based on these assumptions and data, and using Equations (13) and (14), the for this installation is estimated as 35.03 JPY/kWh (0.336 $/kWh).
5.2.2. Energy Generation Sold Back to the Grid at a Given FIT Rate
The analytical model proposed using Equations (1)–(5) described in Section 4 and solar irradiation acquired from PDAV were employed to simulate the FIT price of the PV system. As a result of the simulation made by considering the FIT rate of 40 JPY/kWh, the result shows a significant decrease in the FIT rate of the measured values. Figure 11 shows the FIT relation with the energy over the year 2019. The measured FIT is slightly lower than the simulated value. However, the result is still almost the same as the simulated value. As can be seen from Figure 11 and Table 5, there is a reduction in the FIT price from September 2019 to December 2019. This can be explained by the amount of solar irradiation and energy drops as it is considered winter in Japan. While a total annual of 1,940,858 JPY/kWh of the FIT price was expected to be gained with the PV system, 1,522,840 JPY/kWh was sold to the utility in 2019. The highest and the lowest average monthly FIT price of the PV system was 90,720 JPY/kWh in May and 57,840 JPY/kWh in December, respectively. In most cases, the amount of FIT price is closer to or higher than that of the simulation throughout the year. The annual difference between simulated and measured FIT was 418,018 JPY/kWh.
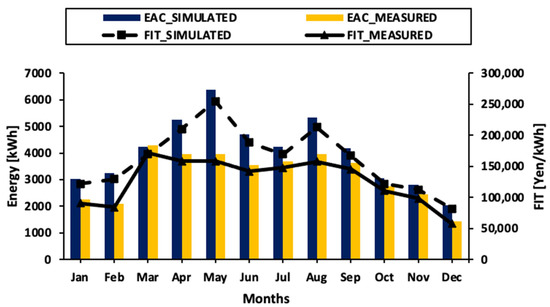
Figure 11.
The FIT sales in relation to the energy over the year of 2019.
Table 5.
The FIT sales in relation to the energy over the year of 2019.
6. Discussion
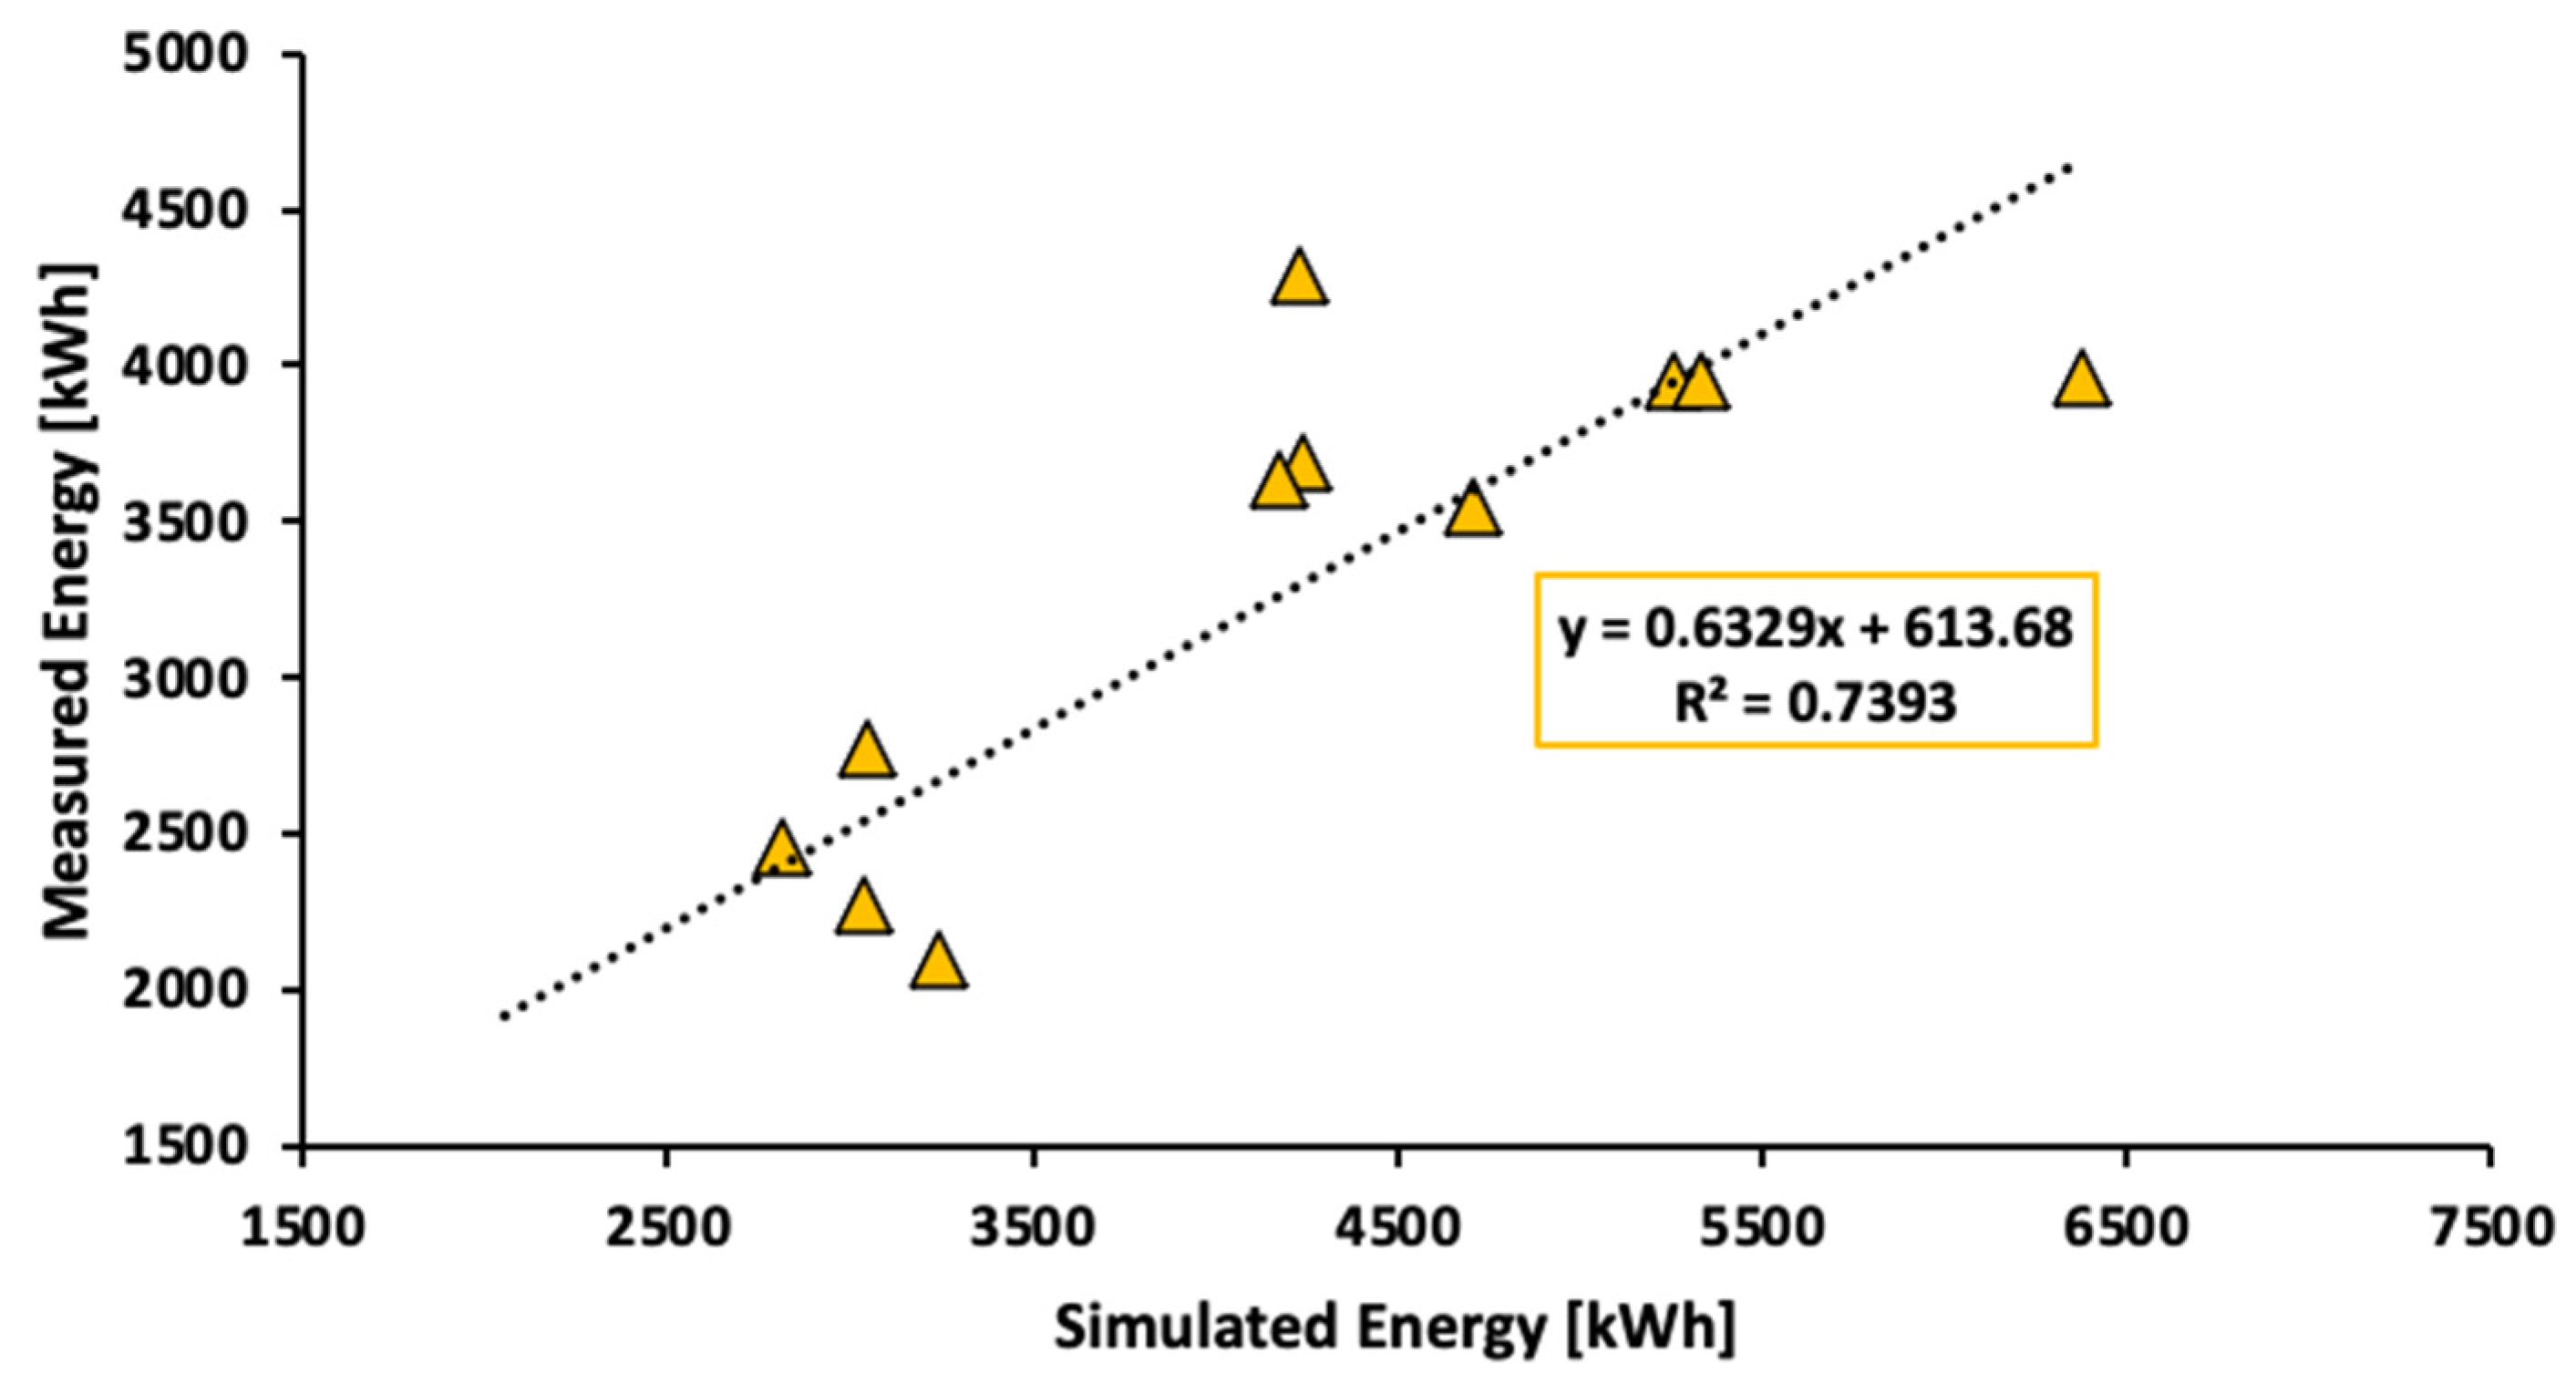
6.1. Correlation Coefficient
To evaluate the differences between the measured and simulated energy from PDAV, the correlation coefficient () has been introduced. As shown in Figure 12, the correlation coefficient between the simulated and measured energy values was calculated using Equation (20) as 0.7393.
where is the measured average energy, and is the simulated average energy of the PV system.
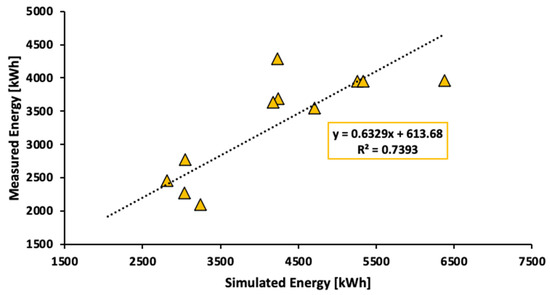
Figure 12.
The correlation between the measured and simulated energy values.
The simulation results are in excellent agreement with the measured values. A relatively strong positive linear association between the measured and simulated energy is observed.
6.2. Comparative GCPV Systems Performance
To be able to compare operating results from different PV systems, performance parameters and other different characteristics of GCPV systems are analyzed. The install capacity (kWp), monitored period, final yield (h/d), capacity utilization factor (%), as well as the performance ratio (%) are presented in Table 6. The measured annual daily final yield of the PV system obtained in this study was 2.59 (h/d), which is very close to the number reported in Dublin (Ireland). The capacity utilization factor was 10.6, which is considered the lowest comparing with other systems. This is because the GCPV system in this study has been under operation since 2012. The performance ratio was 68.1, which is very close to the number reported in Crete (Greece). The annual average final yield of other monitored GCPVS reported include: Greece, 3.66 h/d; Chile, 3.6 h/d; Ireland, 2.40 h/d; India, 3.67 h/d; and Oman, 2.59 h/d. The annual average daily final yield of the PV system in this study was 2.4 h/d/
Table 6.
Comparison of performance parameters of different GCPV systems in the literature.
7. Conclusions
The present study provides a detailed analysis of the performance of a 40.16 kWp GCPV system located in Tochigi prefecture, Japan, after 8 years of energy generation. A monitoring period of 12 months, ranging from January 2019 to December 2019, has been considered in the study. A proposed analytical model with solar irradiation obtained from PDAV was developed to simulate and evaluate the performance of the GCPV system energy generation by comparing the simulated and actual measured energy acquired from the inverter. Interestingly, analysis results confirmed that the solar irradiation data obtained from PDAV is reliable and can be used to evaluate the energy of other GCPV systems. Based on the PDAV data, the results revealed that the monthly solar irradiation trends moved in the same direction with the measured energy through the inverter and showed no statistically significant differences and provided a reliable result for the other areas.
The technical performance of the present GCPV system was analyzed using the parameters developed and defined in the standard IEC 61724-1 by the International Electrotechnical Commission (IEC). The main outcome of the technical analysis is presented below:
- The annual reference yield ( ), array yield () and final yield () of the GCPV system calculated 3.84 h/d, 2.98 h/d, and 2.59 h/d, respectively.
- The annual average of the GCPV system is characterized at 68.1 %. The annual average of the GCPV system is 10.61%. Table 6 shows that the performance of the present system is entirely satisfactory, and the value of and is comparable to other plants installed in India
- The GCPV system installation’s annual average energy output (38,071 kWh/year) is assumed to be constant over the project life with an average of 0.85 capture losses () and 0.39 system losses ().
Based on the economic data, the of this GCPV system was US$0.336/kWh, which agrees with the data presented by METI [25]. The findings and method used in this study clearly show how a GCPV system performs under real weather conditions in relation to the targeted energy and can be applied around the world. The performance of the GCPV system was compared with that of other GCPV systems installed across the globe. This approach would benefit PV systems service companies, consumers, and other stakeholders.
Author Contributions
Conceptualization, G.A.; data curation, G.A.; formal analysis, G.A.; investigation, G.A.; methodology, G.A.; project administration, H.N.; resources, G.A.; software, G.A.; supervision, H.N.; validation, G.A.; visualization, G.A.; writing—original draft, G.A.; writing—review and editing, H.N. All authors have read and agreed to the published version of the manuscript.
Funding
This study received no external funding.
Institutional Review Board Statement
Not applicable.
Informed Consent Statement
Not applicable.
Data Availability Statement
Data is contained within the article.
Acknowledgments
We express our deepest respect to the government of the Kingdom of Saudi Arabia, represented by the Ministry of Education for the Overseas Scholarship Programs and their support and cooperation.
Conflicts of Interest
The authors declare no conflict of interest regarding the publication of this paper.
Abbreviations
Nomenclature
| IEC | International |
| FIT | Feed-In Tariff |
| STC | Standard Test Conditions |
| DC | Direct Current |
| k | The payment period (in years) |
| GCPV | Grid-connected Photovoltaic |
| PDAV | Power Data Access Viewer |
| PV | Photovoltaic |
| AC | Alternative Current |
| n | The interest rate |
Greek Symbols
| The efficiency of the PV subsystem |
Superscripts and Acronyms
| The Simulated AC Energy | |
| The Peak Sunshine Hours | |
| The Solar Irradiation | |
| The Daily Simulated Energy | |
| The Annual Simulated Energy | |
| The DC energy output from a PV array | |
| The expected number of hours of operation in a given period for regular month | |
| The performance Ratio | |
| The Array Yield | |
| The Reference Yield | |
| The Array Capture Losses | |
| The capital recovery factor | |
| The Annual Operation and Maintenance Cost | |
| The simulated Daily FIT Sales Price | |
| The simulated Annual FIT Sales Price | |
| The Correlation Coefficient | |
| The Measured Average Energy of the PV System | |
| The Installed Capacity Power Output | |
| The Deration Factor of Energy | |
| The Solar Irradiation Under STC | |
| The Monthly Simulated Energy | |
| The day count of the month | |
| The Annual AC Energy Output of the System Injected to the Utility Grid | |
| The Rated Power | |
| The Capacity Utilization Factor | |
| The Final Yield | |
| The System Loss | |
| The Levelized Cost of Energy | |
| The Initial Cost | |
| The simulated FIT Sales Price | |
| The simulated Monthly FIT Sales Price | |
| The FIT Sales Price of the GCPV System | |
| The Simulated Average Energy of the PV System |
References
- Narkwatchara, P.; Ratanatamskul, C.; Chandrachai, A. Performance Analysis of Electricity Generation from Grid-Connected Photovoltaic System Using All-Sky Index for Smart City Projects in Thailand. Renew. Energy 2021, 171, 315–327. [Google Scholar] [CrossRef]
- Saleheen, M.Z.; Salema, A.A.; Mominul Islam, S.M.; Sarimuthu, C.R.; Hasan, M.Z. A Target-Oriented Performance Assessment and Model Development of a Grid-Connected Solar PV (GCPV) System for a Commercial Building in Malaysia. Renew. Energy 2021, 71, 371–382. [Google Scholar] [CrossRef]
- Zervos, A.; Lins, C. Renewables 2016 Global Status Report; REN21: Paris, France, 2016; ISBN 978-3-9818107-0-7. [Google Scholar]
- Zsiborács, H.; Hegedűsné Baranyai, N.; Csányi, S.; Vincze, A.; Pintér, G. Economic Analysis of Grid-Connected PV System Regulations: A Hungarian Case Study. Electronics 2019, 8, 149. [Google Scholar] [CrossRef] [Green Version]
- Tanaka, Y.; Chapman, A.; Sakurai, S.; Tezuka, T. Feed-in Tariff Pricing and Social Burden in Japan: Evaluating International Learning through a Policy Transfer Approach. Soc. Sci. 2017, 6, 127. [Google Scholar] [CrossRef] [Green Version]
- Dondariya, C.; Porwal, D.; Awasthi, A.; Shukla, A.K.; Sudhakar, K.; SR, M.M.; Bhimte, A. Performance Simulation of Grid Connected Roof Top Solar PV System for Small House Holds A Case Study of Ujjain, India. Energy Rep. 2018, 4, 546–553. [Google Scholar] [CrossRef]
- Vidal, H.; Rivera, M.; Wheeler, P.; Vicencio, N. The Analysis Performance of a Grid-Connected 8.2 KWp Photovoltaic System in the Patagonia Region. Sustainability 2020, 12, 9227. [Google Scholar] [CrossRef]
- Measurement Principles for Terrestrial Photovoltaic (PV) Solar Devices With Reference Spectral Irradiance Data. Available online: https://webstore.iec.ch/publication/61084 (accessed on 25 February 2021).
- Fouad, M.M.; Shihata, L.A.; Morgan, E.I. An Integrated Review of Factors Influencing the Perfomance of Photovoltaic Panels. Renew. Sustain. Energy Rev. 2017, 80, 1499–1511. [Google Scholar] [CrossRef]
- Abdullah, G.; Nishimura, H.; Fujita, T. An Experimental Investigation on Photovoltaic Array Power Output Affected by the Different Partial Shading Conditions. Energies 2021, 14, 2344. [Google Scholar] [CrossRef]
- Ibrahim, H.; Anani, N. Variations of PV Module Parameters with Irradiance and Temperature. Energy Procedia 2017, 134, 276–285. [Google Scholar] [CrossRef]
- Sarver, T.; Al-Qaraghuli, A.; Kazmerski, L.L. A Comprehensive Review of the Impact of Dust on the Use of Solar Energy: History, Investigations, Results, Literature, and Mitigation Approaches. Renew. Sustain. Energy Rev. 2013, 22, 698–733. [Google Scholar] [CrossRef]
- Marrasso, E.; Roselli, C.; Tariello, F. Comparison of Two Solar PV-Driven Air Conditioning Systems with Different Tracking Modes. Energies 2020, 13, 3585. [Google Scholar] [CrossRef]
- Kymakis, E.; Kalykakis, S.; Papazoglou, T.M. Performance Analysis of a Grid Connected Photovoltaic Park on the Island of Crete. Energy Convers. Manag. 2009, 50, 433–438. [Google Scholar] [CrossRef]
- Viitanen, J. Energy Efficient Lighting Systems in Buildings with Integrated Photovoltaics. Ph.D. Thesis, Aalto University, Espoo, Finland, 2015. [Google Scholar]
- Mariano, J.R.L.; Lin, Y.-C.; Liao, M.; Ay, H. Analysis of Power Generation for Solar Photovoltaic Module with Various Internal Cell Spacing. Sustainability 2021, 13, 6364. [Google Scholar] [CrossRef]
- Fichera, A.; Marrasso, E.; Sasso, M.; Volpe, R. Energy, Environmental and Economic Performance of an Urban Community Hybrid Distributed Energy System. Energies 2020, 13, 2545. [Google Scholar] [CrossRef]
- Ceglia, F.; Marrasso, E.; Roselli, C.; Sasso, M. Small Renewable Energy Community: The Role of Energy and Environmental Indicators for Power Grid. Sustainability 2021, 13, 2137. [Google Scholar] [CrossRef]
- Abdullah, G.; Nishimura, H. Photovoltaic Array Cleaning System Design and Evaluation. J. Energy Power Eng. 2021, 15, 248–251. [Google Scholar]
- Ustun, T.S.; Nakamura, Y.; Hashimoto, J.; Otani, K. Performance Analysis of PV Panels Based on Different Technologies after Two Years of Outdoor Exposure in Fukushima, Japan. Renew. Energy 2019, 136, 159–178. [Google Scholar] [CrossRef]
- New Energy and Industrial Technology Development Organization. Available online: https://www.nedo.go.jp/english/ (accessed on 9 April 2021).
- Earth Policy Institute–Building a Sustainable Future|Home. Available online: http://www.earth-policy.org/ (accessed on 5 April 2021).
- Arias, J. Solar Energy, Energy Storage and Virtual Power Plants in Japan. p. 172p. Available online: https://www.eu-japan.eu/sites/default/files/publications/docs/min18_1_arias_solarenergy-energystorageandvirtualpowerplantsinjapan.pdf (accessed on 31 January 2021).
- Tokyo Electric Power Company (TEPCO)|HOME. Available online: https://www.tepco.co.jp/en/hd/index-e.html (accessed on 3 March 2021).
- Agency for Natural Resources and Energy. Available online: https://www.enecho.meti.go.jp/en/ (accessed on 2 April 2021).
- Map-It|Japan Map Site. Available online: https://map-it.azurewebsites.net/en (accessed on 1 April 2021).
- POWER Data Access Viewer. Available online: https://power.larc.nasa.gov/data-access-viewer/ (accessed on 8 March 2021).
- Japan Meteorological Agency. Available online: https://www.jma.go.jp/jma/indexe.html (accessed on 11 March 2021).
- Nasukarasuyama Monthly Climate Averages. Available online: https://www.worldweatheronline.com/nasukarasuyama-weather/tochigi/jp.aspx (accessed on 3 March 2021).
- Elhadj Sidi, C.E.B.; Ndiaye, M.L.; El Bah, M.; Mbodji, A.; Ndiaye, A.; Ndiaye, P.A. Performance Analysis of the First Large-Scale (15 MWp) Grid-Connected Photovoltaic Plant in Mauritania. Energy Convers. Manag. 2016, 119, 411–421. [Google Scholar] [CrossRef]
- Malvoni, M.; Leggieri, A.; Maggiotto, G.; Congedo, P.M.; De Giorgi, M.G. Long Term Performance, Losses and Efficiency Analysis of a 960 KW P Photovoltaic System in the Mediterranean Climate. Energy Convers. Manag. 2017, 145, 169–181. [Google Scholar] [CrossRef]
- Kumar, N.M.; Yadav, S.K.; Chopra, S.S.; Bajpai, U.; Gupta, R.P.; Padmanaban, S.; Blaabjerg, F. Operational Performance of On-Grid Solar Photovoltaic System Integrated into Pre-Fabricated Portable Cabin Buildings in Warm and Temperate Climates. Energy Sustain. Dev. 2020, 57, 109–118. [Google Scholar] [CrossRef]
- Sharma, R.; Goel, S. Performance Analysis of a 11.2 KWp Roof Top Grid-Connected PV System in Eastern India. Energy Rep. 2017, 3, 76–84. [Google Scholar] [CrossRef]
- Murat Ates, A.; Singh, H. Rooftop Solar Photovoltaic (PV) Plant–One Year Measured Performance and Simulations. J. King Saud Univ. Sci. 2021, 33, 101361. [Google Scholar] [CrossRef]
- Ayompe, L.M. Measured Performance of a 1.72 kW Rooftop Grid Connected Photovoltaic System in Ireland. Energy Convers. Manag. 2011, 52, 816–825. [Google Scholar] [CrossRef] [Green Version]
- Congedo, P.M.; Malvoni, M.; Mele, M.; De Giorgi, M.G. Performance Measurements of Monocrystalline Silicon PV Modules in South-Eastern Italy. Energy Convers. Manag. 2013, 68, 1–10. [Google Scholar] [CrossRef]
- Mensah, L.D.; Yamoah, J.O.; Adaramola, M.S. Performance Evaluation of a Utility-Scale Grid-Tied Solar Photovoltaic (PV) Installation in Ghana. Energy Sustain. Dev. 2019, 48, 82–87. [Google Scholar] [CrossRef]
- Home: Bank of Japan. Available online: https://www.boj.or.jp/en/index.htm/ (accessed on 8 April 2021).
- Al-Badi, A.H. Measured Performance Evaluation of a 1.4 KW Grid Connected Desert Type PV in Oman. Energy Sustain. Dev. 2018, 47, 107–113. [Google Scholar] [CrossRef]


Publisher’s Note: MDPI stays neutral with regard to jurisdictional claims in published maps and institutional affiliations. |
© 2021 by the authors. Licensee MDPI, Basel, Switzerland. This article is an open access article distributed under the terms and conditions of the Creative Commons Attribution (CC BY) license (https://creativecommons.org/licenses/by/4.0/).