1. Introduction
Economic activity leads to an increase in the thermal pollution of the atmosphere. The increasing concentration of greenhouse gas (GHG) emissions enhances the natural greenhouse effect and determines the increase in global air temperature. GHG emissions are largely generated by the burning of fossil fuel and the growth of industrial and agricultural production followed by increased waste.
The European Union (EU) is expected to meet its 2020 GHG emission reduction target of 20% compared with 1990. In 2018, GHG emissions in the EU including the United Kingdom (EU-28) were 26% lower than 1990 levels. The decade’s sharpest emissions cut was then observed in 2019, with a 3.6% reduction in the EU-28 in just 1 year. In 2018, GHG emissions in the EU-28 were 23.2% lower than the 1990 levels, totaling 4392 million tons (Mt) of carbon dioxide equivalent (CO2). According to preliminary national estimates, EU-28 emissions fell by 3.6% from 2018 to 2019. With these latest values, the EU-28’s emissions were 26% below the 1990 levels in 2019 (Eurostat DB information).
Progress towards 2020 targets is more diverse at the national level. In 2018, 11 member states (Austria, Belgium, Bulgaria, Cyprus, Estonia, Finland, Germany, Ireland, Luxembourg, Malta and Poland) had emission levels in effort-sharing sectors higher than their respective annual targets. Preliminary estimates indicate that, in 2019, these same 11 countries, as well as Czechia, had emission levels higher than their 2019 targets. To reach their national 2030 emission reductions targets in the Effort Sharing legislation sectors, a total of 21 member states will have to increase the pace of their average annual reductions in GHG emissions compared with the pace that they achieved between 2005 and 2018. Notably, Greece and Hungary already reported emission levels in 2018 that were below their national 2030 targets [
1].
The EU has its sights set on 1990. The EU’s total GHG emissions exclude emissions from land use, land use change and forestry, and include all emissions from aviation [
2].
Hence, the statistical data suggest that the EU’s GHG emission trends differ from country to country. To manage this process, relevant treaties were signed: the Paris Agreement on climate change, the European Green Deal, etc. However, these international treaties do not specify the measures to be used by countries in order to reach these goals and countries determine these measures independently. According to researchers, economic measures for pollution management include environmental taxes, emission allowance system and subsidies. Environmental taxes are targeted at consumers and producers and are seen as improving environmental protection, dispersing sources of pollution, and a significant source of government revenue. An emission allowance system is a system that takes advantage of the market when reducing emissions, where one interested party sells an emission allowance to another interested party; it is seen as an alternative to pollution taxes. Subsidies aim to improve environmental protection by encouraging less production, reducing pollution costs and encouraging innovation. However, subsidies, unlike environmental taxes, do not generate additional revenue, that is, government expenditure [
3,
4,
5,
6,
7,
8].
The research studies show differences among the effectiveness of the climate-change-related measures employed by different countries. Research shows that the initial EU countries with more developed, but also more polluting industries seek a more rapid reduction of GHG emissions. These countries allocate more financial resources for climate transition to non-polluting technologies, have implemented environmental tax reform (ETR) and have been introducing new environmental taxes.
Environmental taxes are considered to be one possible way of addressing the GHG issue, with a particular focus on a carbon dioxide tax [
8,
9,
10,
11,
12].
The majority of the research studies are focused on energy taxes, as these taxes contribute considerably to a reduction of pollution by the energy sector polluters. Researchers Ekins and Speck [
5] have noticed that, as a result of the increase of the fuel prices caused by the taxes, it was primarily the energy demand, followed by GHG emissions, that reduced in the analyzed countries. GHG emissions reduced more than the demand, as the taxes contributed largely to the reduced use of the carbon fuel. It is also important that the countries which had implemented the environmental tax reforms saw slight growth in the national GDP and reduction of environmental pollution [
5,
13]. The findings of research studies on the topic have suggested the following trends in individual countries: the European researchersprioritize environmental taxes over other methods of reducing environmental pollution, for example support. Meanwhile, in the U.S. and China, researchers give preference to increasing support for addressing climate-change-related issues [
14,
15,
16]. Nonetheless, the majority of the studies show that financial support and environmental taxes are the most effective measures for the reduction of the negative consequences of climate change.
The aim of the present study is to compare the effectiveness of the environmental support measures of the EU countries with the effectiveness of the environmental taxes in relation to reduction of GHG emissions.
2. Literature Review
To avoid the irreversible negative consequences of climate change, the world’s countries entered the Paris Agreement on climate change. The treaty establishes a global action plan to keep the increase in global average temperature to well below 2 °C and to pursue efforts to limit the increase to 1.5 °C above pre-industrial levels (of 1750).
In 2019, the European Council encouraged the countries to put more efforts into the fight against climate change and requested the Commission to accelerate the work in the pursuit of a neutral effect of the EU on climate pursuant to the EU’s international commitments under the Paris Agreement. As a result, the Communication on the European Green Deal was passed and set out a goal of ensuring climate neutrality by 2050. The EU countries agreed to pursue a 55% reduction of GHG emissions by 2030.
The EU countries have made climate mitigation one of the three main priorities in its COVID-19 recovery. In 2020, the leaders of member countries agreed that at least 30% of its multi-annual budget and recovery fund agreed in July 2020 is to be spent on achieving the EU’s climate neutrality goal by 2050 and meeting its increased 2030 emissions reduction goal. However, the EU has still not agreed on the exact level of that goal. In the framework of the European Green Deal the EU is planning to revamp almost all of its climate legislation and complement it with additional measures. This includes strengthening the role of the European institutions, especially the EC, in setting the EU’s emissions trajectories post-2030.
The measures chosen in the pursuit of the EU’s climate neutrality goal should be sufficiently efficient and effectively lead to a reduction of GHG emissions. To curb the pollution, specific economic measures have been undertaken. The environmental policy measures, namely environmental taxes; environmental incentives, such as subsidies and trade permits; and other regulatory instruments, are considered to be a considerable contribution to environmental protection and economic growth [
7,
17,
18]. Pinglin He et al. have identified three environmental tax development stages in the OECD countries. In the first period, between 1970 and 1980, the OECD proposed implementing the “polluter pays” principle and internalizing external costs. In the second period, from 1980 and mid-1990, a considerable share of the OECD countries implemented pollution and energy taxes aimed at protecting the environment and changing consumers’ behavior. In the third stage, from mid-1990, environmental taxes developed into environmental tax systems in the OECD countries. According to Aydin and Esen [
19], policy measures influencing the market have recently been gained an increasingly strong position. They are considered to be more cost-effective compared to other measures and to promote the spread of environmentally friendly technologies and innovations in this area.
A number of research studies analyzing the effect of environmental taxes have been conducted in the light of the emerging need to assess the effect of various environmental policy measures given the wide diversity of environmental policy measures and the growth of environmental issues. Due to conflicting research findings, they aimed to explain the factors that influence environmental degradation. A study was conducted by Onofrei, Vintilă, Dascalu, Roman & Firtescu [
20] to empirically assess the effects of environmental taxes on GHG emissions in ten European countries in the period 1994–2012. The study was aimed at identifying the direct effect of environmental taxes on GHG emission and assessing the effect of the environmental costs. The results of this study were in line with an earlier study including the EU members and Norway in the period 1995–2006 by Morley [
21] and showed that the environmental taxes had a strong effect on reducing pollution, i.e., GHG emissions. Meanwhile, the study by Onofrei et al. [
20] did not confirm that environmental costs would have a significant effect on GHG emissions reduction. These results were not consistent with the opposite, i.e., the significant effect of environmental costs on pollution reduction identified by other authors [
22]. These studies also assessed the effect of the redistribution of the environmental tax revenues on economic growth. The introduced environmental taxes may be combined with a reduction of the tax burden, whether that be reducing the corporate profit or personal income tax rate, thereby contributing to economic growth. In their study, Pinglin He et al. [
18] explored the link between an environmental tax, gross domestic product (GDP), the unemployment rate, GHG emissions, nitrogen oxide emissions and sulfur oxide emissions, and analyzed the environmental and economic effect of environmental tax reform in the 36 OECD countries in the period 1994–2014. The authors also aimed at substantiating the “double-dividend” effect of environmental taxes. The “green dividend” effect emerges as environmental taxes influence polluting behavior and lead to greater costs for the polluter, thereby promoting environmental protection. The “blue dividend” effect appears as the environmental taxes influence the growth of the gross domestic product, promote employment and greater economic efficiency. The authors have conducted a comprehensive analysis of the previous studies on the “double dividend” effect. The majority of the studies have supported the position that an environmental tax can improve the environment and that there is a green dividend. They have also shown a trend whereby the green dividend effect of environmental taxes is more significant than the blue dividend effect. In a few studies, the blue dividend effect is viewed as a non-obvious effect, as it promotes employment, but does not provide sufficient evidence about its effect in terms of promotion of economic growth. In general, the analysis conducted by the authors has suggested that, where the study covers a period of more advanced environmental tax systems with a share of the countries having already implemented environmental tax reform (ETR), fewer studies manage to support the considerable effect of environmental taxes on the reduction of pollution. According to research data by Pinglin He et al. [
18], environmental taxes contribute significantly to the reduction of nitrogen oxide emissions in the long run, while significantly reducing sulfur oxide emissions in the short run. However, contrary to Onofrei et al. [
20] or Morley [
21], the researchers did not provide substantiation for a significant positive effect on the reduction of GHG emissions during their studies. However, this research conclusion, namely, that environmental taxes are an insufficiently effective measure in terms of changing polluters’ behavior and promoting environmental protection, was supported by Silajdzic and Mehic [
23]. This study also partially supports the blue dividend effect in 36 OECD countries, as environmental taxes positively influence economic growth; however, no such effect has been identified for the promotion of employment. It should be noted that no studies on the effect of environmental taxes have been found for individual countries, although the proportion of environmental tax revenue in the total tax revenue of OECD countries is quite different. There are no studies on the effect of different environmental incentives chosen by the countries independently.
In the efforts to promote the convergence of the two pillars of sustainable development, namely, environmental protection and economic growth, discussions and controversies caused by divergent research results have been emerging. Hence, researchers have also explored the opposite relationship, i.e., the environmental effect of economic growth. Silajdzic and Mehic [
23] sought to assess the Environmental Kuznets Curve (EKC) hypothesis claiming that there is an inverted U-shaped relationship between economic growth and environmental degradation. Economic growth and industrialization are gradually degrading the environment up to a certain moment (usually referred to as the threshold income level), followed by a stage of improvement in environmental quality. This study analyzed the 1995–2015 Eurostat data and assessed the effect of environmental taxes on CO
2 emissions and the link between economic development and environmental degradation in 15 countries of Central and Eastern Europe (referred to as the “emerging market economies”). The fully-modified least squares (FM-OLS) model showed the presence of an inverted U-shaped relationship between economic growth and environmental degradation. This is partly due to a technological effect stemming from the use of more effective, environmentally friendly innovations and growing efficiency. It was also determined that the scale effect was most evident on environmental degradation, when it is considered that an economic activity is always environmentally damaging, as an increase in production and consumption means more intensive use of environmental resources. In particular, this supports the role of technological progress with the view towards the more efficient use of energy in industrial sectors. The key reason behind the limited effectiveness of environmental taxes was claimed to be not effective enough energy taxes and their link to former GHG emissions. This means that energy taxes are not effective for the majority of the industrial activities that either do not have or have limited alternatives of shifting to lower energy consumption [
23]. Although transport taxes have been found to have a negative effect on GHG emissions, their effect in terms of the reduction of GHG emissions is insignificant. As a result, transport taxes predominantly have an effect on individual consumption behavior. This leaves open the question of which market measures, including environmental taxes, are the best policy measures for the more effective reduction of pollution. According to the researchers, the effect of environmental taxes is likely to depend on the industry structure and its diversity, modernization, the level of industrial development and the accessibility of technological solutions.
The question of how environmental taxes could be turned into an effective pollution mitigation measure is raised. According to Aydin and Esen [
19], the effectiveness of environmental taxes may be related to fuel-price elasticity of demand, where inelastic demand leads to a reduction in tax effectiveness. The review of studies by other researchers also shows that significant tax incentives, including those afforded to the energy-intensive sectors, have demonstrated the limited effect of a carbon tax on GHG emissions. With the majority of the studies employing a linear assessment of results, in 2010 Lopez and Palacios noticed a highly non-linear link between energy taxes and pollution. Aydin and Esen [
19] chose to employ a nonlinear perspective for the period of 1995–2013 in order to determine the impact of environmentally related taxes on carbon dioxide (CO
2) emissions in 15 EU member states. According to data from the World Bank, Eurostat and EIA, and by applying the dynamic panel threshold regression (PTR) model, the presence of an asymmetric dependence between environmental taxes and their effect on pollution reduction was found, meaning that after exceeding the threshold level, the effect of environmentally related taxes (excluding transport taxes) on CO
2 emissions would change from insignificantly positive to significantly negative [
19]. This meant that environmental taxes would not have a significant effect on the growth of CO
2 emissions until a certain threshold, above which they would contribute considerably to the mitigation of environmental pollution. According to the empirical findings, environmental taxes help improve the quality of the environment after they have exceeded a certain critical value. The taxation of GHG emissions signals additional emerging costs to the polluters and the incentive to opt for more environmentally sustainable solutions. This research also showed that urbanization and GDP per capita had a statistically significant and positive effect on CO
2 emissions. The researchers identified the lack of a more significant effect of the transport tax on the CO
2 emissions, as the transport tax remained insignificant both below and above the threshold. As a result, the researchers made the assumption that the taxation was too low and did not have an effect on the polluters’ behavior. Environmental taxes are among the most prominent tools that can be adopted in the fight against environmental pollution and climate change [
19,
22], and are highly important in the reduction of pollution and improvement of environmental quality in the EU countries [
20]. It was concluded that the effectiveness of environmental taxes could be increased by considering the reasons for ineffectiveness in certain areas of pollution. This would involve the selection of an appropriate tax rate from which the tax would become effective, and the combination of the tax object with other economic pollution mitigation measures, i.e., subsidies.
With the types of subsidies and provision tools becoming increasingly diverse in the last two decades, the issue of the definition of subsidies remains open. Subsidies, including tax relief, are chosen as an alternative to environmental taxes with the same goals of improving environmental protection by promoting lower production and pollution, and more innovation. Within the last two decades following the introduction of special energy and carbon dioxide taxes in the EU, the EU member countries provided special partial tax relief to relevant industries with a view towards maintaining their competitiveness. However, tax relief measures and other special tax provisions reduce the efficiency and effectiveness of environmental taxes aimed at reducing CO
2 emissions [
19]. The environmental effect of subsidies manifests itself through their effect on output volumes, the composition of the economy and the level of production and consumption. Fossil fuel, agricultural and fisheries subsidies have been claimed to artificially increase production output, reduce global prices, distort international markets and international trade and reduce economic efficiency [
3,
8,
24,
25,
26,
27].
With the types of subsidies and provision tools becoming increasingly diverse in the last two decades, the issue of definition of subsidies remains open [
27,
28,
29,
30]. International organizations have not reached a consensus on a single definition of an energy subsidy and the most appropriate measurement methodology for energy subsidies. It is also not agreed as to whether the value of non-internalized externalities should be included in subsidy accounting. As a result, there are considerable differences in the calculations of energy subsidy values, making it even more difficult to identify whether the subsidies reach the anticipated goals.
One of the key commitments under the Paris Agreement is to mitigate GHG emissions by reducing carbon dioxide (CO
2) emissions from fossil fuels. The recent efforts by international organizations have been aimed at abandoning fossil fuel subsidies on a global scale. According to Coady et al. [
24], abandonment of fuel price support based on the 2015 level would lead to a CO
2 decrease by up to 22% and a decrease in premature air pollution deaths in emerging and developing Europe. A reduction in carbon use would account for the major share of the reduction. The assessment and monitoring of energy subsidies is aggravated by the complexity of such subsidies. According to Wooders et al. [
27], the majority of countries possess the data on direct fund transfer subsidies and have the capacity to assess their complexity. Meanwhile, the data on price support, tax relief, revenue loss or risk transfer subsidies are more difficult or complicated to assess, or difficult to obtain in general. In research studies, the assessment of the environmental effect of energy subsidies is usually limited to the assessment of the effect of the consumed fossil fuel [
24], as the complexity of energy subsidies, the overlap of their effects and the issue of the inclusion of subsidy externality [
30] prevent researchers from performing a reliable assessment of their effect on GHG emissions and the environment in general.
In the studies reviewed, the researchers tend to emphasize the combination of governmental measures applied for effective reduction of emissions and the costs of measures [
31,
32,
33]. According to Lopez and Palacios [
22], 1% growth in public expenditure on public services may result in an up to 1.4% reduction in SO
2 and an up to 0.6% reduction in the NO
2 concentration. Meanwhile, a 1% growth in energy taxes also results in reduced SO
2 and NO
2 emissions. Cilinskis et al. [
31] used the example of Latvia for the assessment of the effect of the following three regulation measures on CO
2 emissions: a CO
2 tax, subsidies for renewable energy technologies and energy efficiency measures. The study has revealed that, with a view towards effective emissions reduction in the non-ETS (Emission Trading System) sector, and towards supporting the energy efficiency and biodiversity goals, government should use a policy mix that includes taxation, solar technology subsidies and the promotion of energy efficiency. According to Gillingham and Stock [
32], the reduction of GHG emissions becomes most effective at the point that the marginal benefits of the reduction equal its marginal costs. Analysis of the research data has shown that the costs of the reduction of one metric ton of GHG emissions depend on the dedicated measures and comprise 10 to 1000 USD. It should be noted that there are certain measures characterized by negative costs in terms of emission reduction, i.e., whether the emissions reduce as a result of changing consumption habits or increasing octane number of the fuel by using ethanol of vegetable origin. It is reasonable to apply the emission reduction measures that would result in a permanent reduction of emissions rather than just postponing them. Investing in long-living capital that has a large emissions-reduction potential will ensure future low-cost alternatives with zero- or low carbon emissions. According to Santos [
33], decarbonization of the transport sector could be accelerated by ensuring more accessible and competitive cleaner transport technologies. However, clean technologies are more expensive than high-carbon technologies, in particular in the transport sector. The authors therefore advocate the use of taxes and subsidies until clean technologies become more accessible. Where carbon pricing is not sufficient to substantially reduce GHG emissions, subsidies should support clean technologies and increased investments in clean infrastructure, and these regulations would have a synergic effect.
3. Materials and Methods
In order to analyze environmental pollution and the processes related to this phenomenon happening around us, it is necessary to understand the cause-and-effect relationships between the environmental condition and processes acting on it, have reliable indicators and know how to apply environmental measures. The research is based on the cause-and-effect relationship, where the factors affecting environmental pollution, environmental taxes and subsidies, are the cause, and GHG emissions are the effect.
In this study, 27 EU member states from 2009 to 2018 were selected as research samples. The data for the research was gathered from EUROSTAT database. The panel included all member states that joined EU up to 2007 as a sample group and included the UK.
The variables used in this research were used to produce the ratio of the variable per capita (dividing value of the variable by population) in order to distinguish the relationship of the cause and effect and the trends and obtain comparable analysis results. This method of analysis has been supported by Jobert et al. [
34] and applied in studies by Aydin & Esen [
19] and Silajdzic & Mehic [
23] for the assessment of the effect of environmental measures.
Based on theoretical insights and previous GHG-related studies, the following indicators were analyzed in the study: dependent variable, i.e., GHG emissions (total greenhouse gases per capita); GDP (gross domestic product at market prices per capita); EP_Transfers, i.e., total environmental protection activities (current and capital transfers for environmental protection paid) per capita; TE_Taxes (total environmental taxes per capita); and subsidies (total subsidies per capita).
Statistical research methods were used in the empirical study. First, descriptive statistics was applied, calculating the mean and standard deviation by countries. To test the assumption of normality, the Shapiro–Wilk test was applied. Then, the one-way analysis of variance (ANOVA) was used to determine whether there were any statistically significant differences between the means of variables over time. Boxplots allowed the researchers to compare and view the dispersion, outliers and spread in data. Afterwards, simple regression was used to estimate the linear trend. Additionally, the semilog model ln(Y) = α + βY∙t (where the explanatory variable t is the time) was used for estimating growth rates. The slope coefficient in this model measures the relative change in Y for a given absolute change in the explanatory variable. If the relative change is multiplied by 100, we obtain the percentage change, or the growth rate. Finally, cluster analysis was used to identify structures within the data.
Clustering is a common exploratory tool for pattern recognition in large samples in various fields of science, such as electro-electronics [
35], medicine [
36], cleaner-production research [
37], management [
38], and ecology [
39]. According to Kaufmann and Rousseeuw [
40], the choice of a clustering algorithm depends both on the type of data available and on the particular purpose to which they are put. In view of the formulated purpose and relatively small database within the cluster analysis methodology, traditional hierarchical cluster methods and non-hierarchical cluster methods could be used.
The majority of the clustering algorithms are based on two popular techniques known as hierarchical and partitional clustering [
41,
42,
43]. In the present research, two clustering methods were used: hierarchical clustering and k-means clustering. The hierarchical cluster analysis enables grouping of subjects across multiple dimensions, characterizing them by the same distinguishing elements, but maximizing the differences between clusters. A hierarchical procedure in cluster analysis is characterized by the development of a tree-like structure. The k-means clustering algorithms divide the data set into a specified number of clusters. Using distance as the metric and given the K classes in the data set, the distance mean is calculated and provided the initial centroid, with each class described by the centroid. The procedure enables the researchers to classify a given data set through a certain number of clusters fixed a priori. In practice, the K value is generally difficult to define. The number of clusters was chosen using the silhouette method. It enables finding the optimal number of clusters and interpreting and validating the consistency within the clusters of data [
44,
45,
46]. The silhouette method combines two clustering criteria, namely, compactness and separation.
The data were analyzed using a packages rcmdr, cluster, stats, factoextra of the R software version 4.0.3 [
47].
4. Results and Discussion
The empirical study was performed for the EU countries with the aim of addressing the research problem and substantiating the theoretical insights. During the analysis of the descriptive statistical data on GHG emissions and their links to the employed environmental measures for the mitigation of environmental pollution, Luxembourg was different from all the EU countries. As a result, this country was not included in the study.
As suggested by GHG emission values, pollution was the lowest in Sweden and Latvia in the period analyzed. The largest amount of subsidies was allocated in Belgium; the smallest in Romania. The largest amount of environmental taxes was collected in Denmark; the smallest in Romania.
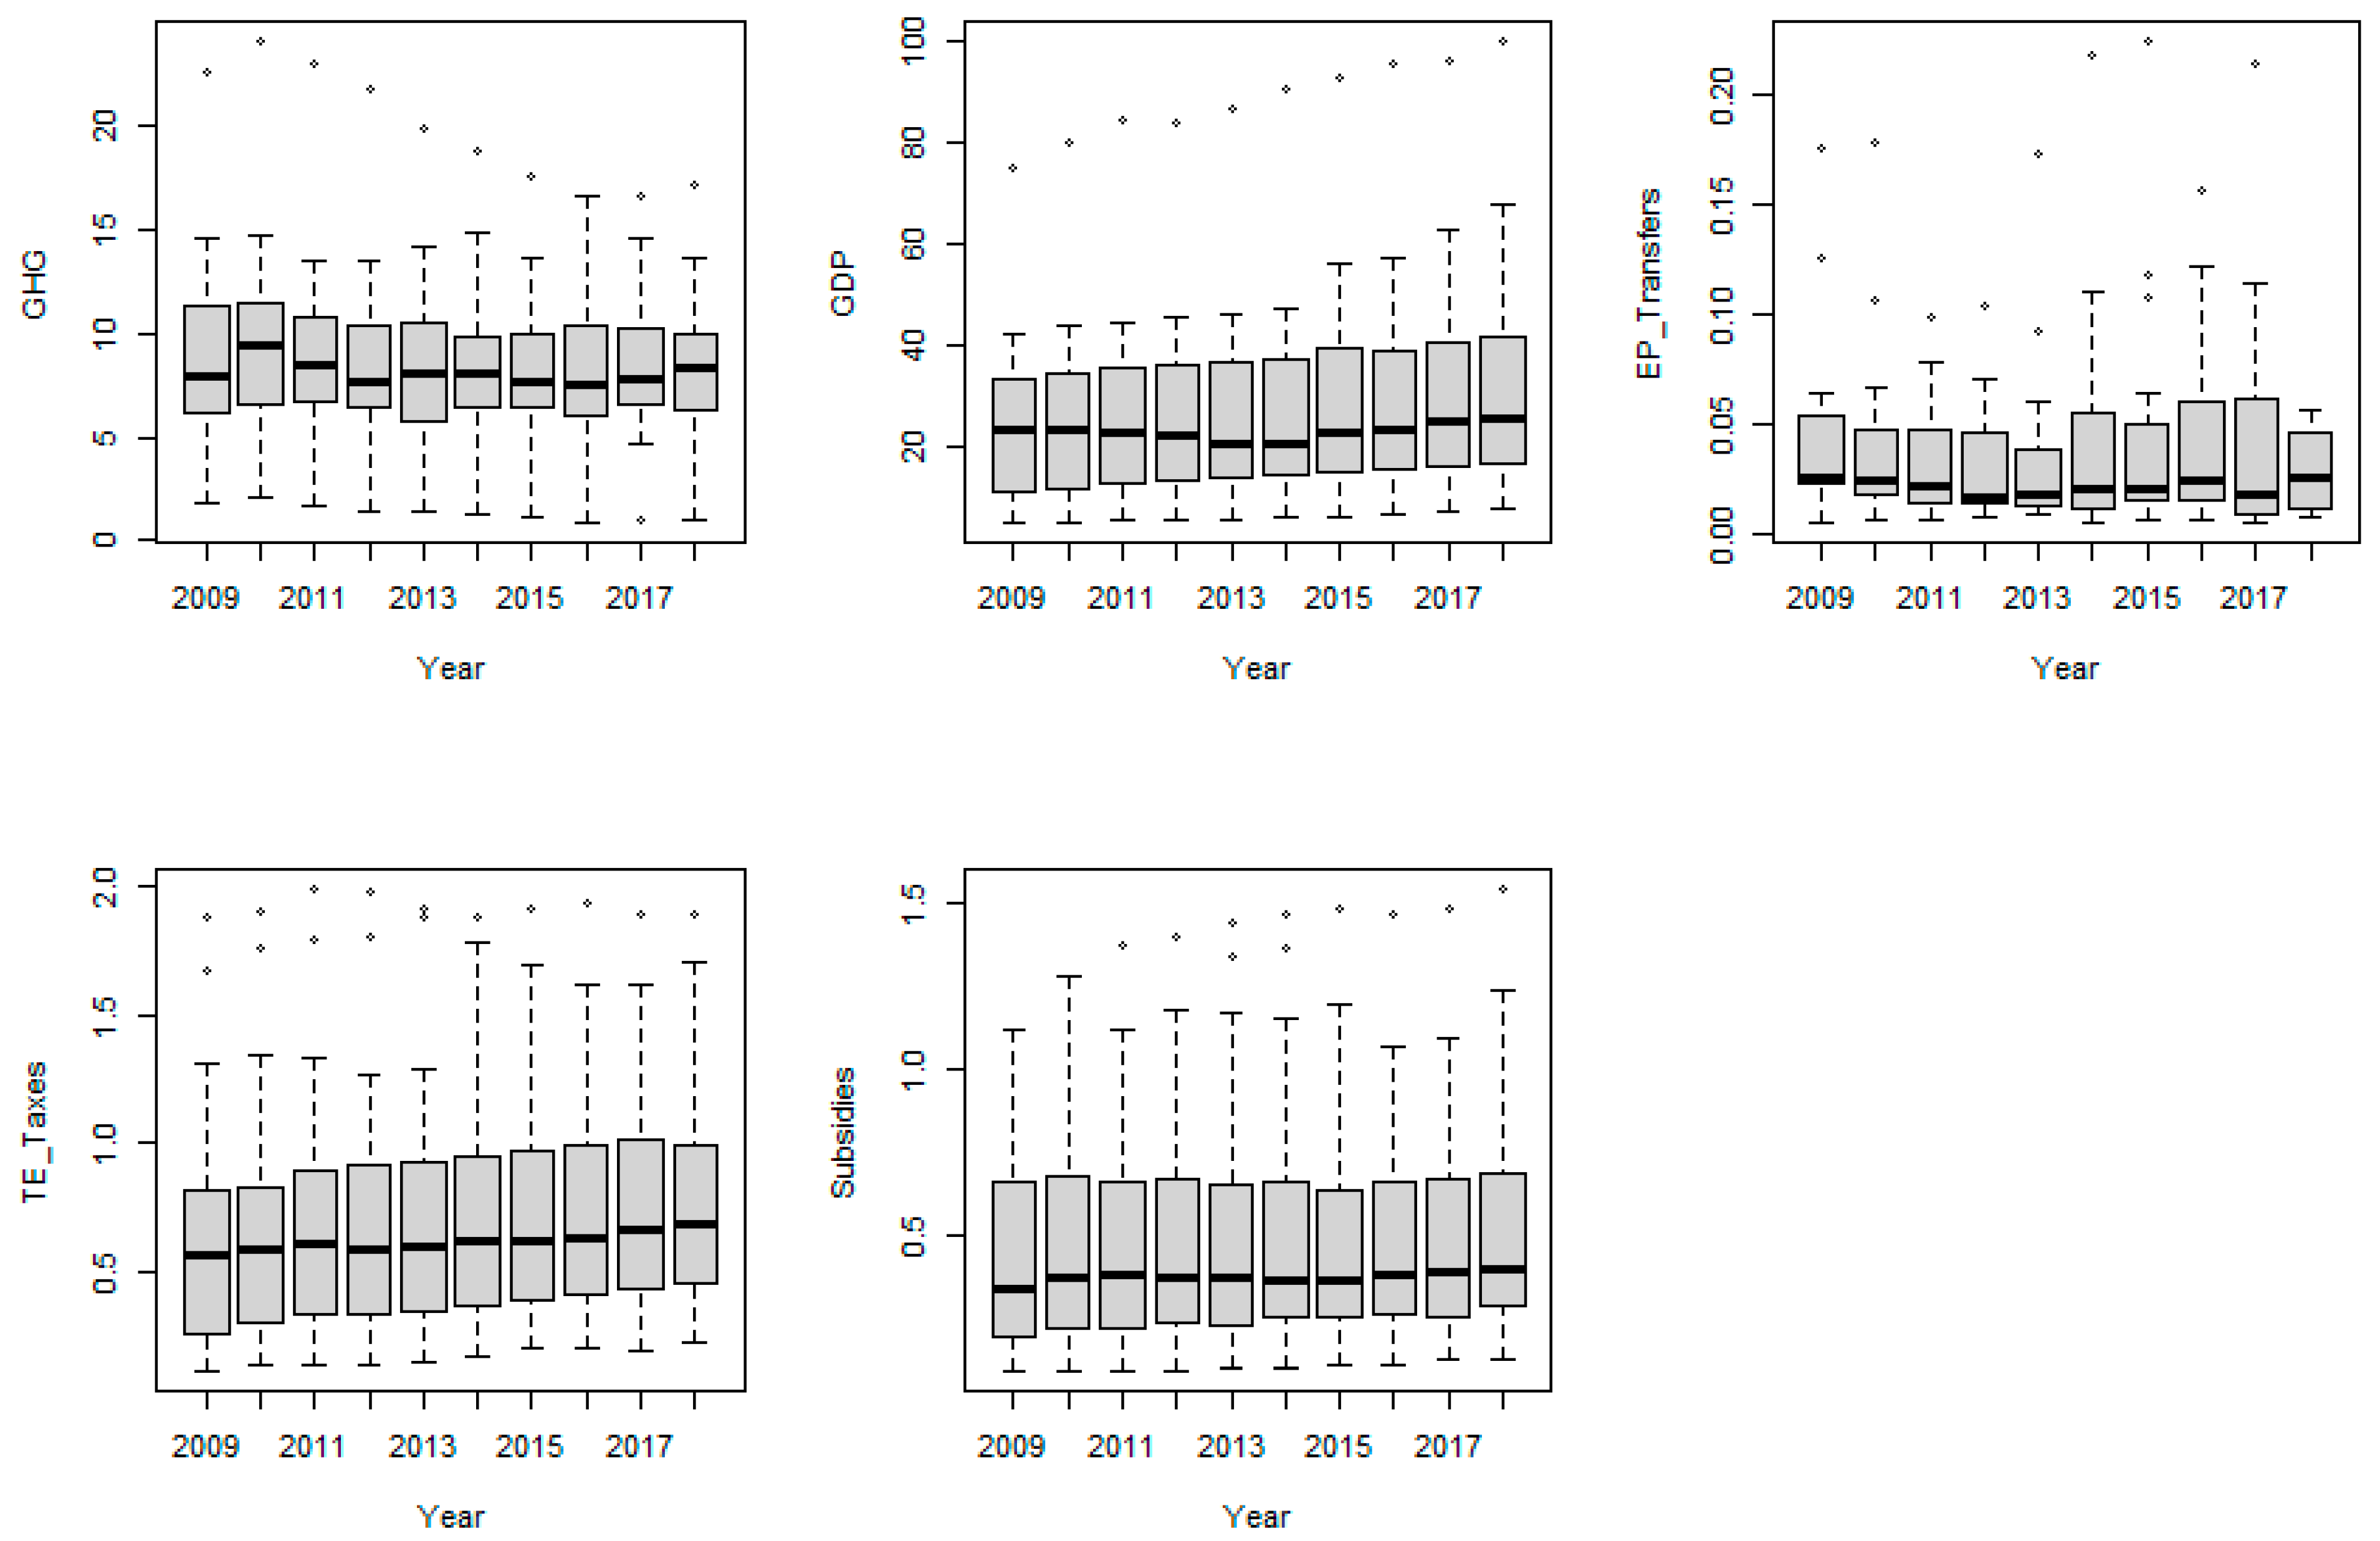
Analysis of the mean values of GHG emissions, environmental tax, subsidy and environmental protection transfers was performed using one-way ANOVA and graphic analysis (
Figure 1). Boxplots allowed group comparison and the viewing of dispersion and spread in data. They also helped highlight outliers. The performed analysis revealed that in 2017, the indicator of GHG emissions was exceptionally low in Sweden. The analysis of the values of environmental protection transfers, environmental taxes and subsidies showed considerable distribution and asymmetry of the data. Although in certain cases minor trends of increase in the mean values (environmental taxes) could be observed, the ANOVA by time (alpha = 0.05) results showed that the differences were statistically insignificant.
The summarized data did not enable viewing the changes in individual countries or country groups. It would therefore be relevant to analyze the trends of change of the variable values in individual countries
Figure 1.
Simple linear regression is most commonly used to estimate the linear trend and statistical significance. The slope coefficient in semilog model, multiplied by 100, gives the instantaneous growth rate [
48].
Table 1 presents the cooefficients of the models ln (GHG) = α + β
GHG∙t, ln (EP_Transfers) = α + β
EP_Transfers∙t, ln (TE_Taxes) = α + β
TE_Taxes∙t, ln (GDP) = α + β
GDP∙t, ln (Subsidies) = α + β
Subsidies∙t.
The analysis performed showed that GHG values reduced in the majority of countries in the period 2009–2018. Certain increases could be observed in Latvia and Lithuania. The changes were statistically insignificant in Estonia, Bulgaria, Poland, Hungary, Ireland and Portugal.
The GDP varied in the downward direction in Greece only. In other countries, the upward trend in the values of the indicator could be observed. In the case of Cyprus, GDP decreased before 2014, followed by an increase in the subsequent periods.
An assessment of the variation trends of the environmental protection transfers would be incorrect due to the insufficient amount of data.
The analysis of the change of the environmental taxes showed the prevalence of upward trends of the values. In terms of time dependence, the downward trend identified for Germany, Czechia, Sweden and Cyprus was statistically insignificant. The Luxembourg data showed a downward trend.
The subsidy values decreased in Portugal, Ireland, Estonia, Spain, Germany, Austria, Netherlands, Sweden, Cyprus, Denmark, Finland and Luxembourg, but statistically reliable linear time dependence was not determined.
These analysis results gave rise to the question of whether it was possible to identify the country groups by assessing all the analyzed variables to reflect similarity by the variables analyzed. Cluster analysis of the countries was performed for that purpose.
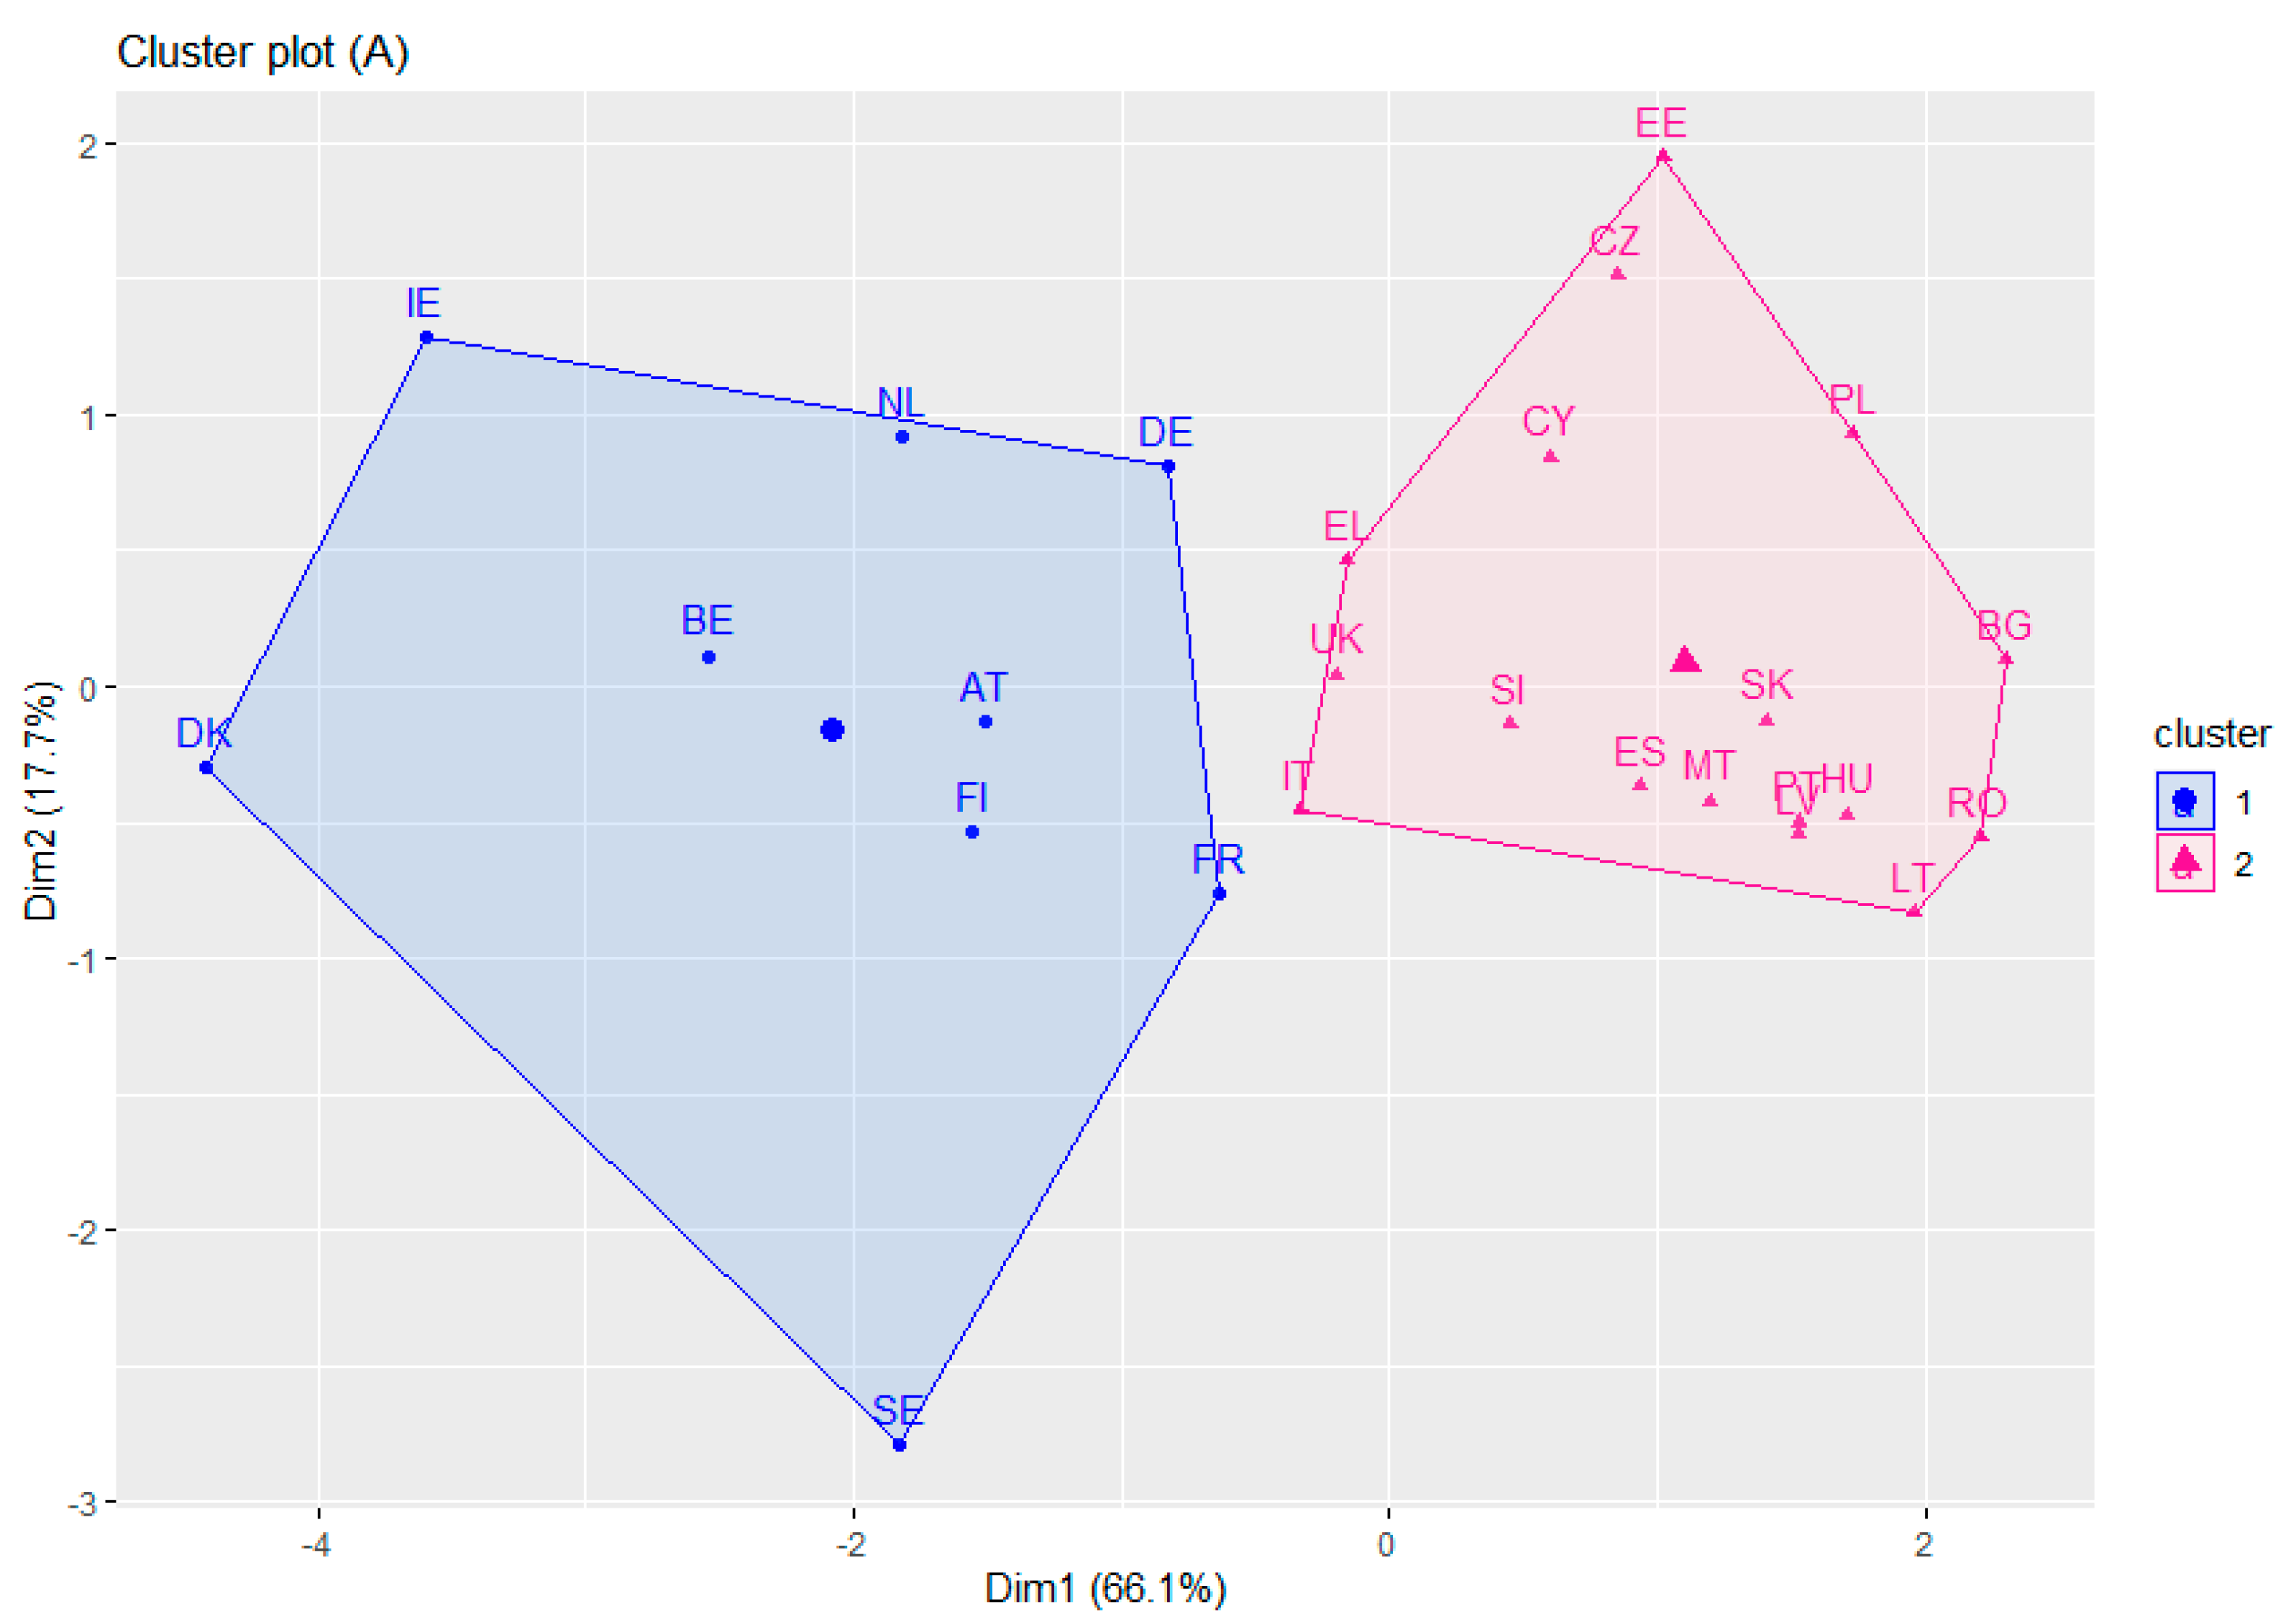
The cluster analysis was performed on the basis of the mean values of data for the period 2009–2018. Standardization of the data was performed during the cluster analysis. The cluster analysis was conducted using the hierarchical analysis and k-means methods by testing several variants. Ward’s method was chosen for the hierarchical analysis. The dendrogram used in the hierarchical analysis enabled the preliminary assessment of the differences between countries. The k-means analysis helped assess the distance of countries from the centroid
Figure 2.
The two clusters look satisfactorily separated. The cluster groups are plotted against the first two principal components (Dim1 and Dim2). The first principal component explains 66.1% of the variance in the data, the second principal component explains 17.1% of the variance. During the analysis, the data for Sweden were noticed to differ considerably from the other countries. Hence, one of the tested cases involved the elimination of Sweden’s data (
Figure 3).
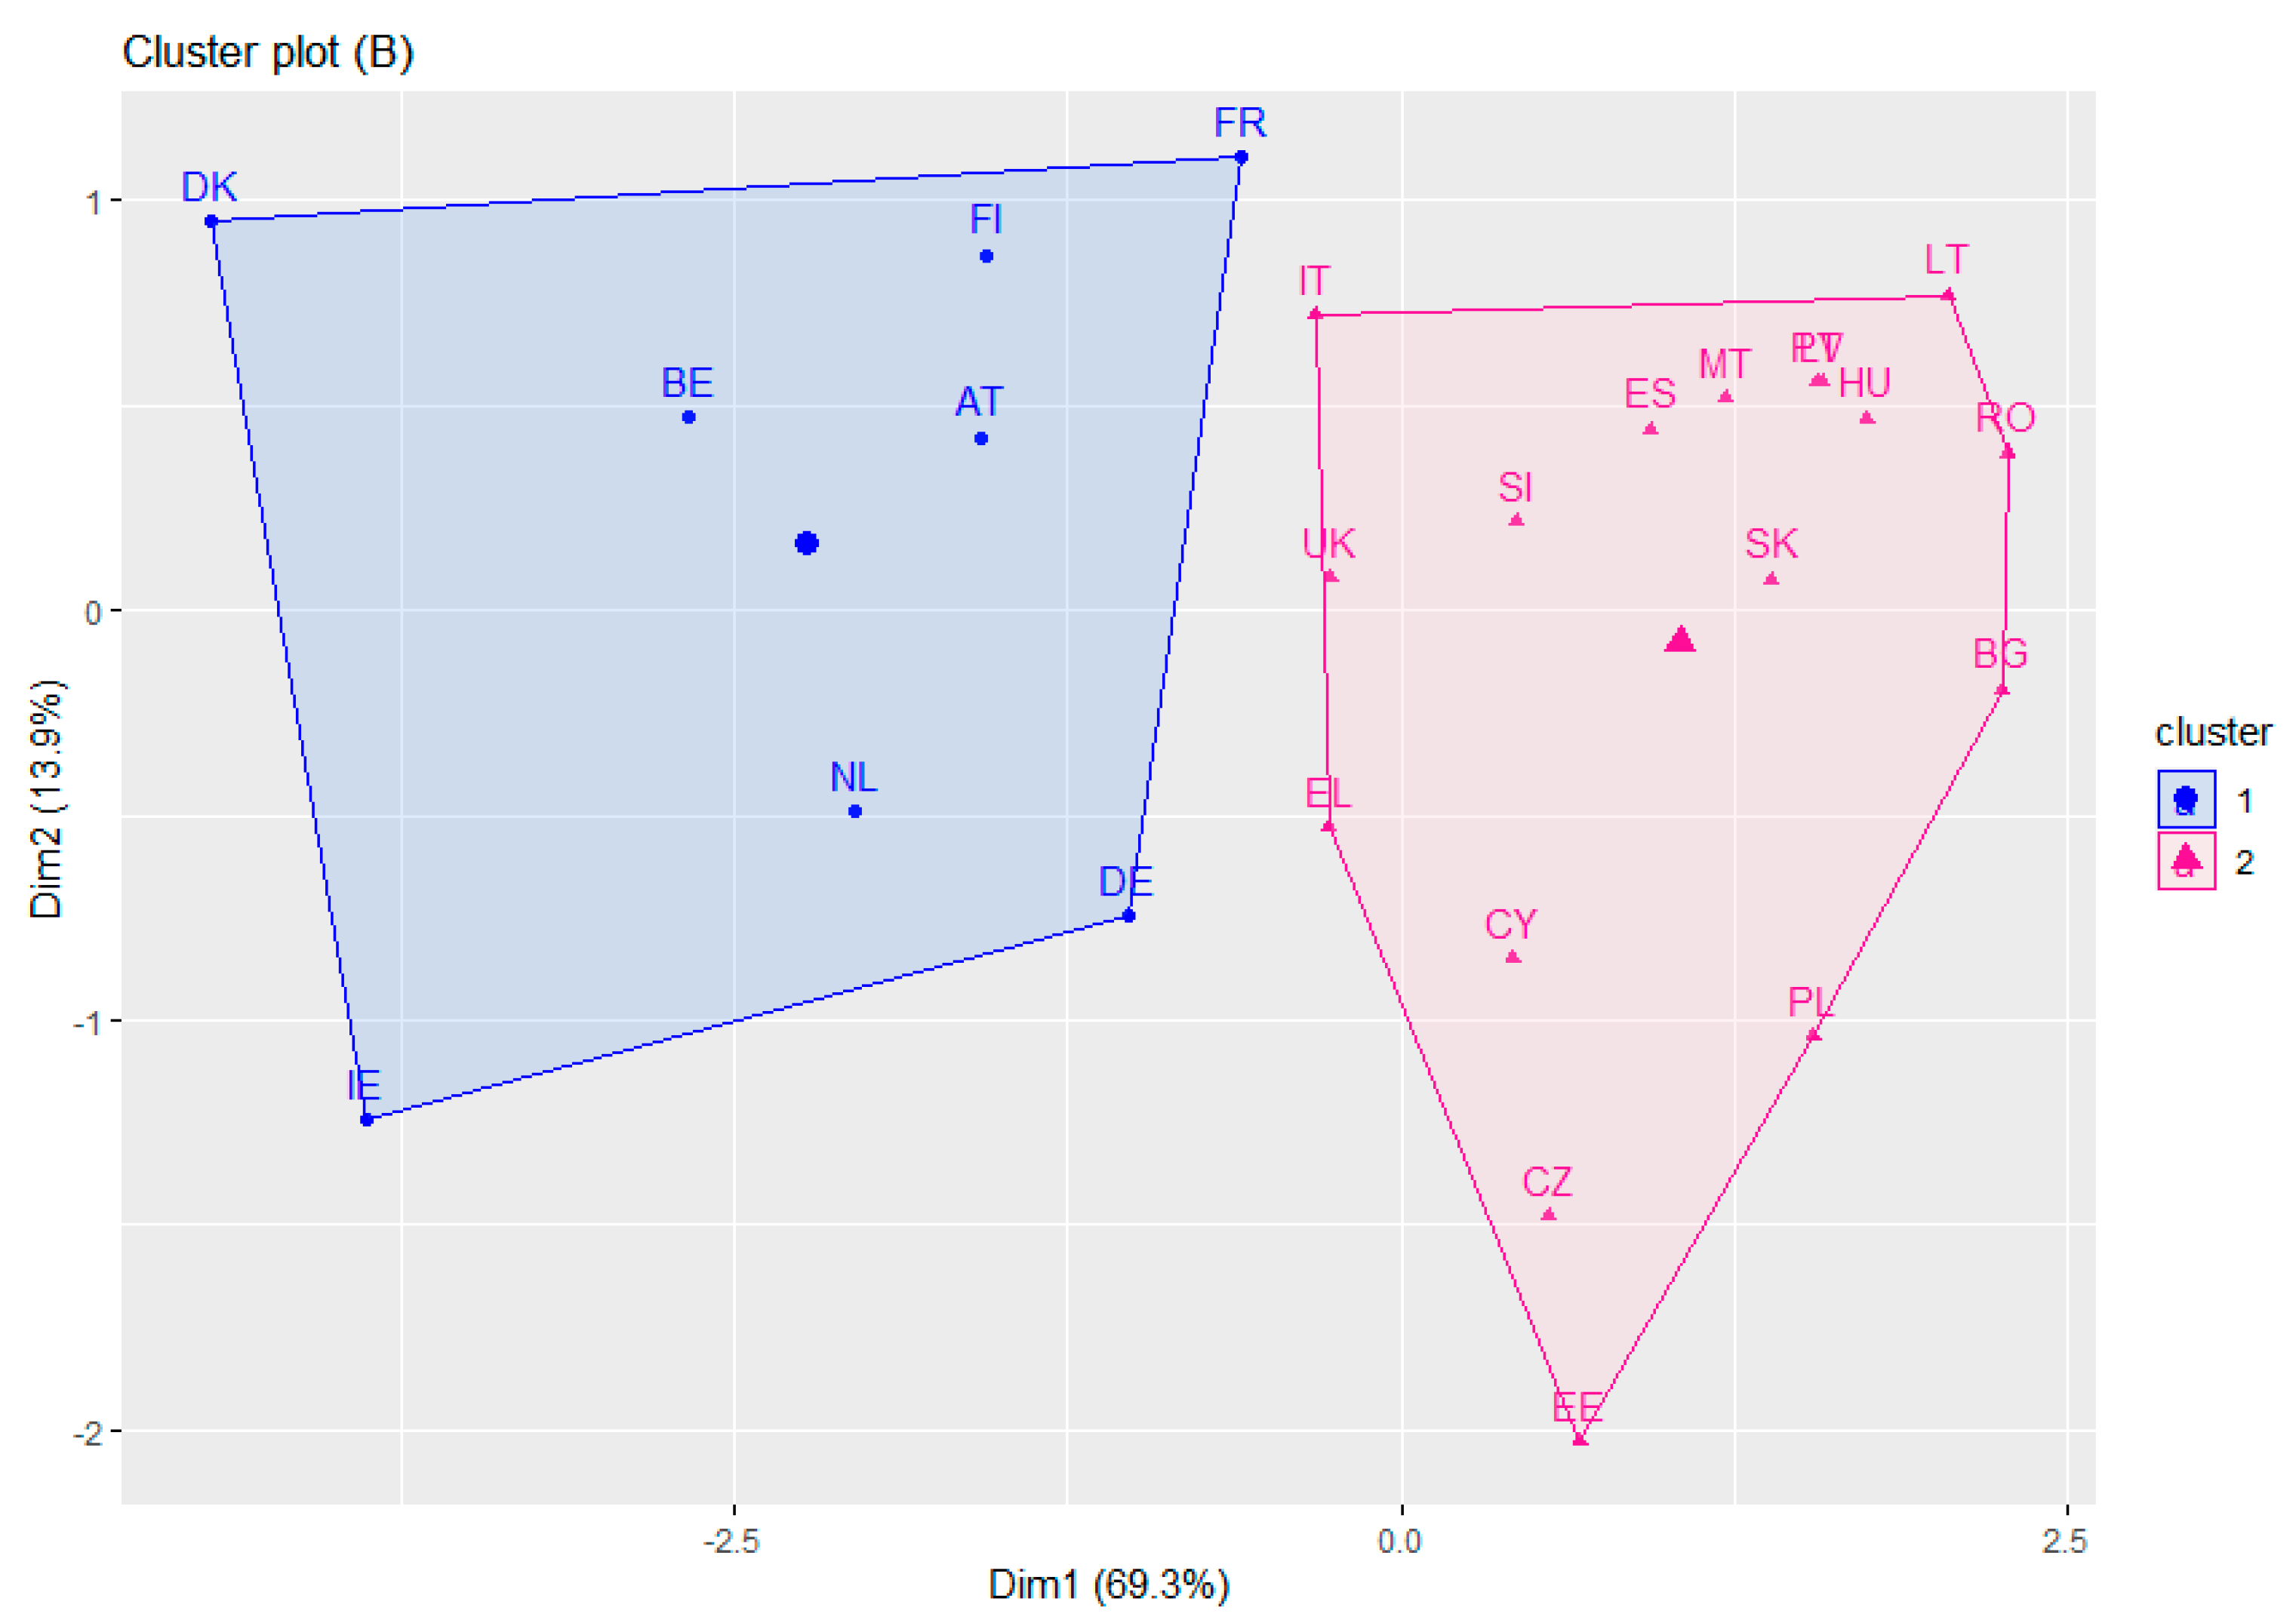
The two clusters appear slightly better separated. The first principal component (Dim1) explains 69.3% of the variance in the data, the second principal component explains 13.9% of the variance. Two models were designed on the basis of the results generated: (A) data excluding Luxembourg and (B) data excluding Luxembourg and Sweden. The silhouette method determined that the optimal number of clusters was two. Involvement of other countries remained stable either with or without Sweden’s data. The k-means and hierarchical analysis methods gave rise to the question of the classification of Germany under one of the groups. Compactness (between_SS/total_SS) of the clustering in case A was 48.2%; in case B 49.1%. Hence, the separation was not significant.
Whereas separability was slightly higher in the B case, B case clusters are further analyzed in
Table 2.
Cluster 1 was comprised of the initial EU countries. Differences between the indicators of the initial countries compared to the new member countries can be found in other studies as well. The former are the countries placing considerable focus on environmental protection characterized by comprehensive support to environmental projects and technological innovations. According to Speck and Paleari [
49], the Northern European countries introduced carbon tax schemes besides the energy taxes, as the energy taxes are intended to reduce energy consumption, while carbon taxes are aimed at shifting the energy mix away from carbon-intensive energy sources. In Finland and Sweden, carbon taxes were introduced in 1990, Denmark 1992, Ireland 2009, while in Germany, the ETR was introduced in 1999, furthered in 2000, and its provisions were partly modified in 2003.
Cluster 2 was comprised of all the Central and Eastern European countries (CEEC) and a few initial member countries. Formation of the cluster was also substantiated by Siljadzic and Mehic [
23], who chose 10 CEEC countries for their study aiming at answering a question regarding the environmental policy impact on the relationship between economic development and environmental degradation. Their choice was based on existing income disparities between the CEECs and the EU-15 countries, and differences in the institutional capabilities, economic structures and levels of technological development.
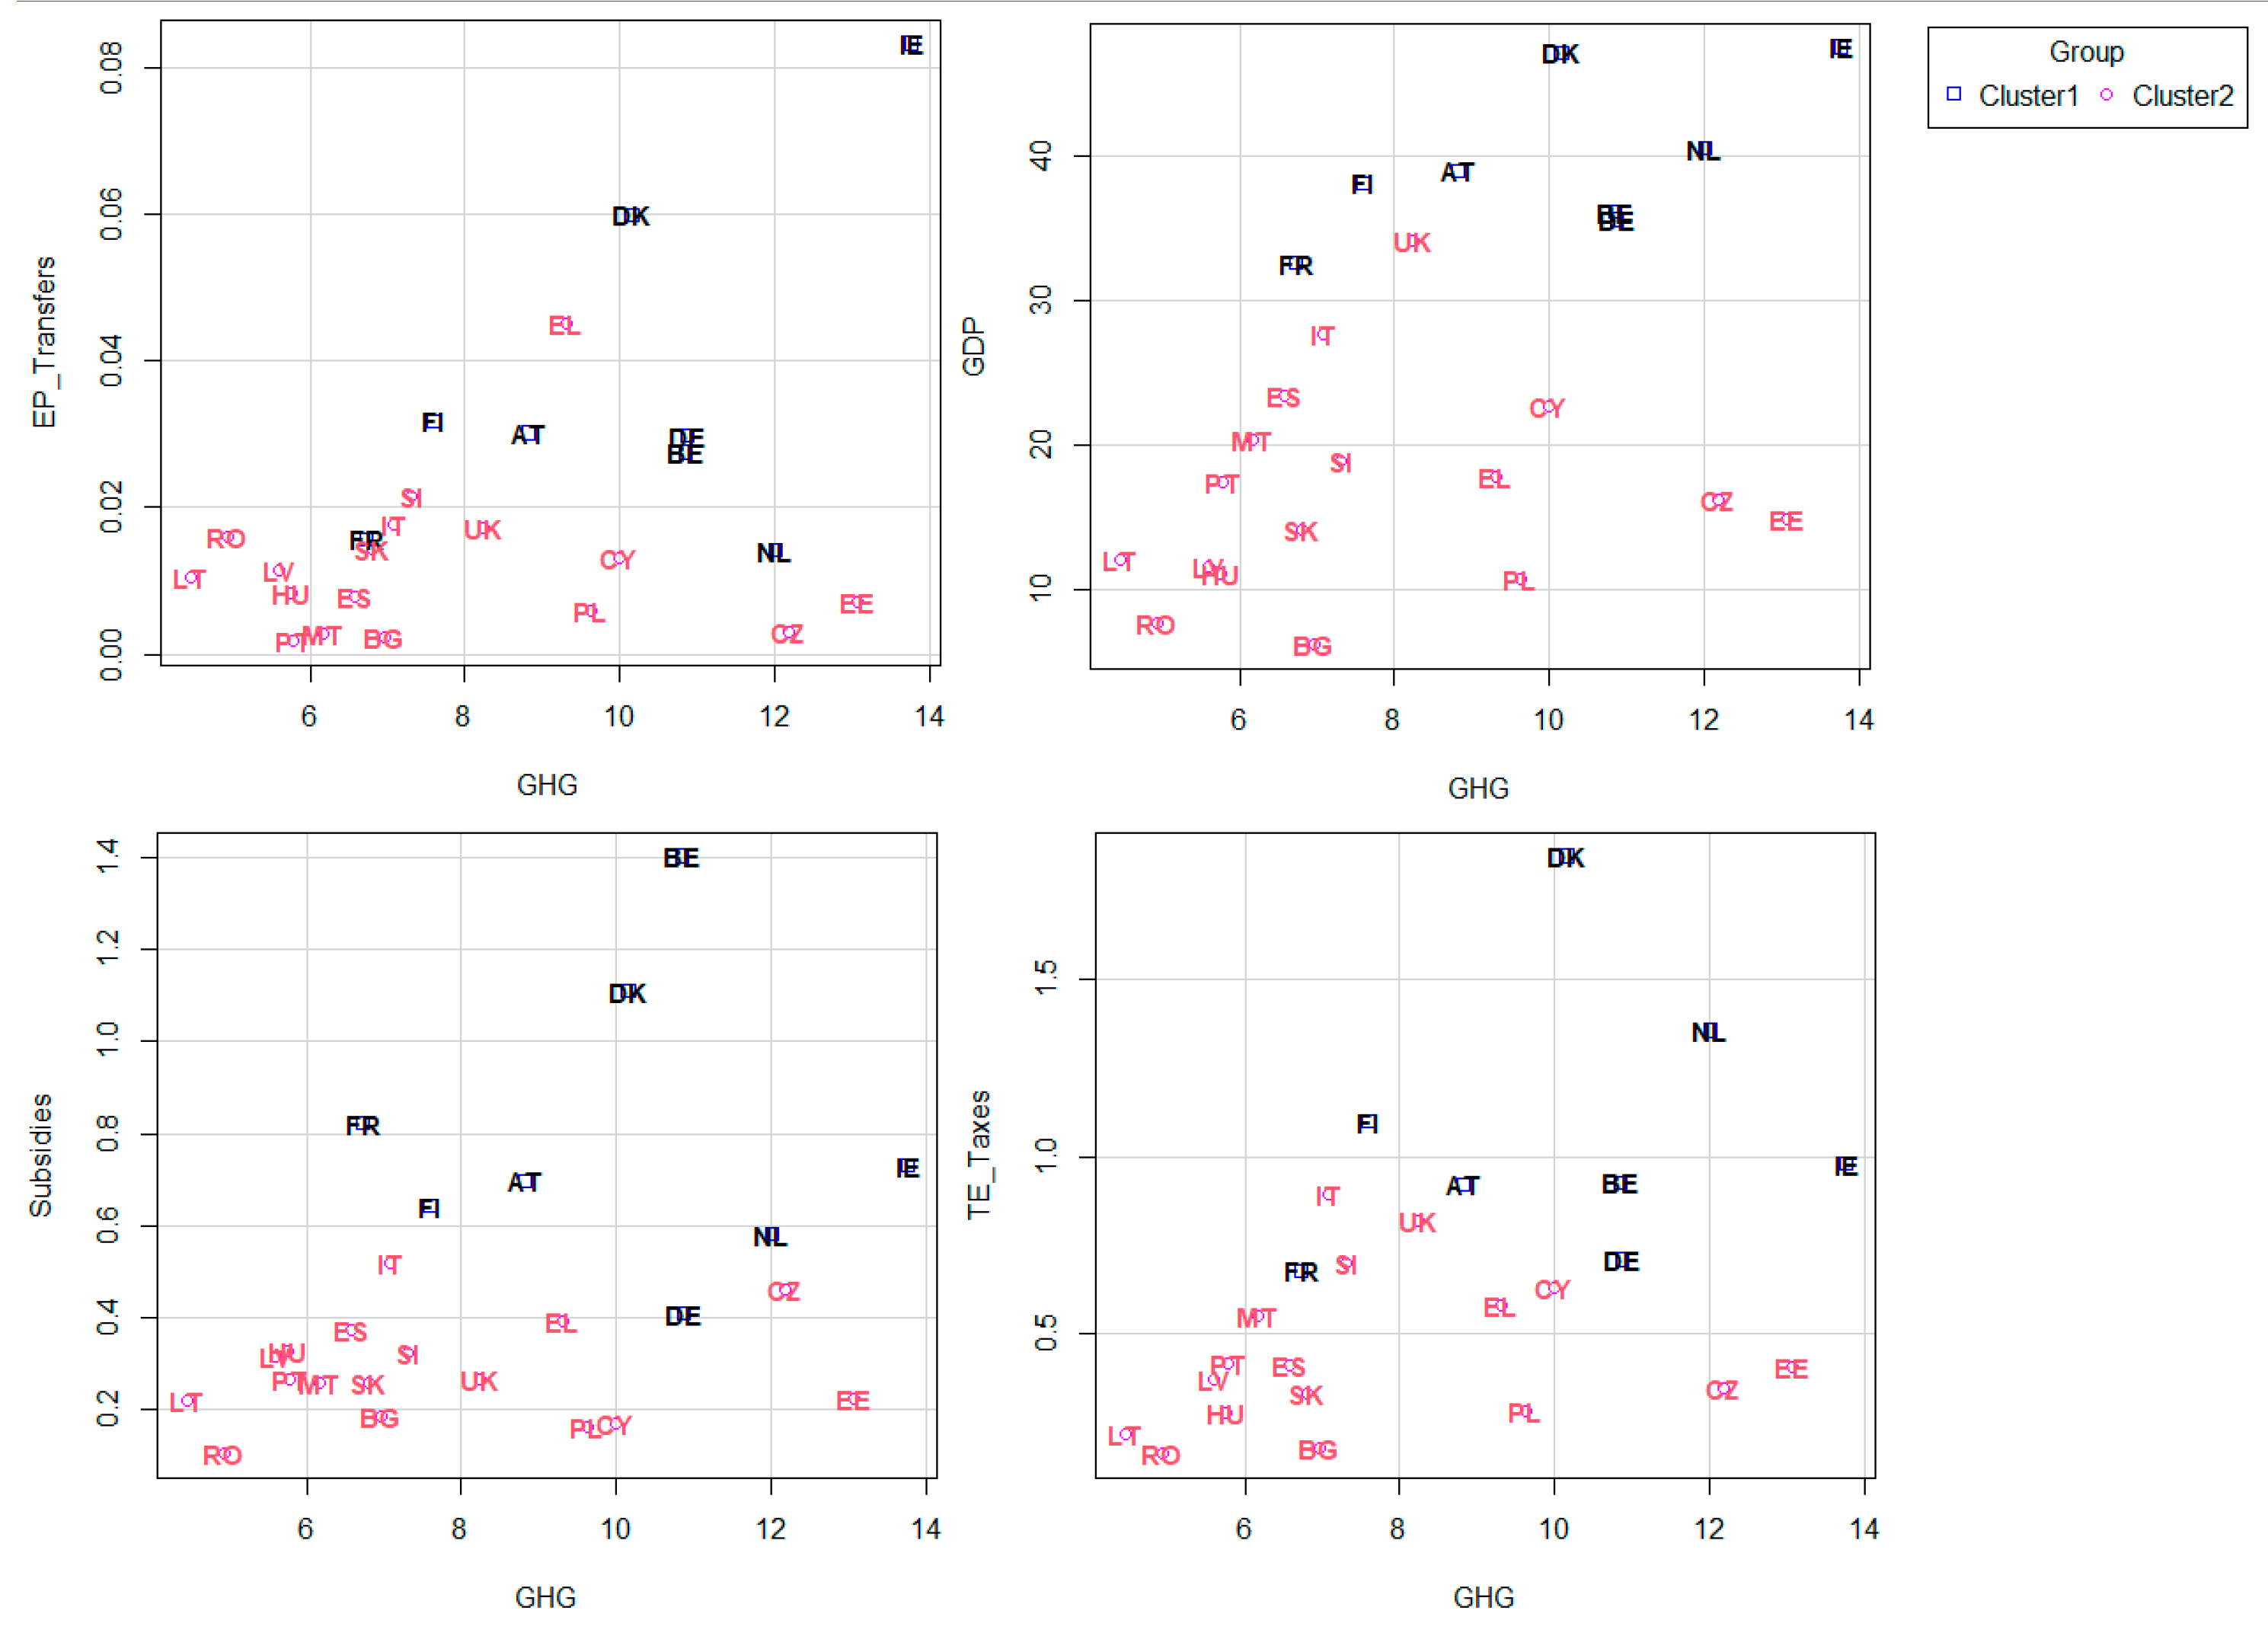
A more detailed pair variable analysis was then performed.
Figure 4 shows the links between GHG emission values and the values of environmental protection transfers, GDP, subsidies and environmental taxes. Although the groups differ more clearly in the cases of GDP and environmental taxes (high GDP and environmental tax values vs. low values), due to high distribution of GHG, more detailed comparison of individual countries from different groups could be the object for further research. GDP and environmental taxes provide the best identification of the groups, but the two indicators also correlate strongly to each other.
The results of the study suggest that the countries which implemented the environmental tax reforms had lower GHG emission indicators due to the effect of the “polluter pays” principle. The countries placing particular focus on environmental protection aim at reducing pollution and promoting rational use of natural resources by subjecting them to higher environmental tax rates. A few countries of the EU (Austria, Belgium, Denmark, Finland, France, Germany, Ireland, Netherlands) had already established environmental measures—such as renewable energy, energy efficiency, the development of renewable energy sources, waste management and biodiversity preservation—in their national environmental policy plans in the analysis period. Hence, they allocated more financial resources to environmental protection, including greater environmental tax revenues. Here, it was not only the GDP per capital, but also the expenditure allocated to environmental protection that had a considerable effect on GHG emissions.
GHG emissions are greater in the countries with higher GDP per capita compared to those with lower GDP per capita. This is associated with greater consumption and energy use, which in turn increases waste.
The CEEC countries that mostly comprise the second cluster are characterized by lower environmental fees and lower expenditure on environmental protection. The majority of these countries have minimal environmental taxes of narrow scope and have started giving more attention to saving energy and investments in environmentally friendly technologies in their environmental policies only recently.
The present study is characterized by the broad scope of its data analysis and its systematic approach towards EU environmental policy measures. The previous studies focused more on the broad analysis of the environmental tax effects for the period 1994–2015, involving the data of 20 EU countries, 36 OECD countries, 15 EU countries and 10 CEEC countries.


