Abstract
Autonomous vehicles (AVs) may significantly impact people’s choice of residential locations and spatial structures. The impact may vary across different countries, but few studies have focused on it. This study drew on China and the United States (US) as two cases to study car drivers’ knowledge of AVs and willingness to move farther if AVs were available by estimating ordered logistic regression models. The results showed that 42.3% of Chinese and 29.8% of US respondents were likely to consider moving farther away from the nearest city or the destination for the most frequent trip if they had an AV. The Chinese sample had less knowledge of AVs than the US sample, but they were more likely to consider a move. AVs may lead to a new round of urban sprawl, but the challenge may be greater for China. We captured the socio-economic and transport factors that affected this result.
1. Introduction
As autonomous vehicle technologies continue to develop rapidly, it is expected that autonomous vehicles (AVs) will be available to the public soon [1,2,3,4]. Some researchers argue that AVs will lead to significant influences on transportation, just as the widespread adoption of the automobile did in decades past, affecting individuals’ travel behaviors, the overall development of the transportation system, urban development, and national strategies and policies [4,5,6,7]. Mobility, transportation and land use patterns in urban areas are closely related to each other [8,9,10]. Thus, should autonomous transportation modes affect transportation patterns, they have the potential to influence when households and businesses make mobility decisions and, to a considerable degree, land-use and urban planning [4]. As a result, considering the novel travel mode choices, we focus on the potential effects that AVs may have on urban spatial structure, land use, and individuals’ moving farther likelihood in this research
There is little research in this filed, and there is even less that is comparative. For example, we know little about the following: (1) do people in different countries have similar levels of knowledge about AVs? If knowledge gaps do exist, what factors account for the differences across countries or contexts? (2) Given their present levels of knowledge about AVs, would residents in different countries prefer to change their residential living area (location) farther if they had access to AVs? What factors affect people’s willingness to consider a move to a different residential location, and do the factors differ across countries or contexts? This study aims to address these questions in a comparative context, providing insights into whether a broader adoption of AVs yields different implications for growing urban sprawl in different areas.
To answer these questions, we chose China and the United States (US) as comparative cases. There are several reasons why this comparison is appropriate. First, China and the US are comparable in the global influence and national status of both countries, such as the two countries’ territorial areas ranking as third- or fourth-largest country by total area; the US’s territorial area is 3,700,000 square miles, and China’s territorial area is 3,800,000 square miles [11]. Both China and the US have considerable populations: as of 2018, there are 322 million people in the US and more than 1.39 billion in China [12,13]. Compared with other countries globally, both the US and China have relatively high GDPs: in 2020, there were 20 trillion dollars in the US and 14 trillion dollars in China [14]. These factors demonstrate that the United States and China may be two of the largest markets for autonomous vehicles. Therefore, it can be said that the future influences of autonomous vehicles on both countries are similarly significant. Second, there are a lot of distinctions between the United States and China, such as the two countries being in notably different developmental stages and urbanization processes, with different governmental power structures, policy regulations and modes of implementation. For example, the US has a separation of executive, legislative and judicial powers as well as 50 individual states, each of which has the authority to draft regulations. As a result, it may be challenging in the US to develop a national standard to regulate AVs in a bottom-to-top approach. In contrast, China has a much higher degree of policy centralization and often uses top-down approaches. While the national government often sets uniform guidelines for local governments and companies in China, in the case of AVs, nearly 10 additional ministries and departments may have jurisdiction over some aspect of them [15,16]. Due to these differences, exploring the potentially similar and different impacts of AVs across these cases may yield interesting insights into the effects of this new and potentially disruptive technology.
In this paper, we focus on level 4 automated vehicles [17], and label them autonomous vehicles (AVs) in this paper. We define vehicles as AVs if they meet the following criteria: (1) no driver attention is required during the autonomous vehicle trip; (2) AVs are allowed to drive themselves in a limited area; (3) we assume that AVs are safer than regular vehicles; and 4) AVs know their locations, and AVs can park themselves without humans’ supervision. In this study, we focus on a comparison of the US and China to understand people’s levels of knowledge of AVs, examine the effects of AVs on likelihood of moving farther, and explore whether the factors that affect outcomes are similar across China and the US. To address these questions, we collected data simultaneously in China and in the US, using an online survey and draw on statistical analysis and logistic regression models. Following a brief literature review and description of the methodology, the analysis and a discussion of the similarities and differences across cases are presented with a discussion about the potential broader effects of the results on spatial structure and land use across cases.
2. Literature Review
Many previous studies have explored the impacts of AVs from urban transportation engineering and planning perspectives. Some aimed to understand AVs’ impacts on traffic flow and infrastructure design [18,19,20,21]. Others have examined how AVs might affect travel demand and future transportation forecasts; for example, some have focused on AVs’ effects on various aspects of travel behavior (e.g., vehicle ownership, vehicle miles traveled, travel frequency), including trip generation [22,23,24], travel mode choice [25,26,27,28,29,30,31,32,33,34,35] and overall condition with four-step, activity-based, or other simulation models [5,6,31,36].
Past research about people’s knowledge of AVs, i.e., how much individuals say that they know about autonomous vehicles, showed that the concept of automated driving was not equally known across countries [37]. In both China and the US, a majority of respondents had previously heard of autonomous or self-driving vehicles, had a positive initial opinion of the technology, and had expectations about the benefits of the technology [38], although people in China (64%) were more aware of automated driving developments [37]. Eighty-seven percent of respondents in China and 71% of respondents in US had heard of AVs [38,39]. In specific areas in the US and China, there were some variations; for example, population-weighted statistics showed that 80% of people in Austin, Texas, had heard of Google’s self-driving car [40], and 72.6% of a sample in Tianjin, China, had heard of fully automated driving [41]. More recent studies in this domain, however, have focused more heavily on the US than on China [42] and we have not found any in-depth US and China comparative analysis about factors that influence people’s knowledge of AVs.
A few studies in the US have examined the potential impacts of AVs on residential location choice, urban spatial structure, and land use. Michael et al. examined the effect of AVs on residential/work relocation and commute choices in the Dallas-Fort Worth Metropolitan Area (DFW); they found a 30% or so decrease in VTTS and a rather large extent of urban sprawl due to privately-owned AVs, and they predicted that horizontal spread in cities such as Dallas-Fort Worth would increase by 68% [43]. Zhang and Guhathakurta considered shared autonomous vehicles (SAVs) as well as AVs to analyze residents’ preferences for residential location in Atlanta, Georgia, in the US. They found that SAVs might increase residents’ vehicle kilometers travelled for commuting across all considered market segments [44]. Bansal and Kockelman found that 81.5% of Texas residents in the US would not change their residential location if AVs became available [36]. To identify the factors that influence people’s preferences for a change of residential location with AVs and SAVs, Bansal et al. analyzed data from a survey of 347 residents from Austin, Texas, in the US and developed an ordered probit model [40]. They found that when AVs and SAVs became available, respondents who had more children, lived in denser residential neighborhoods, and had already obtained a bachelor’s degree were more likely to move farther away from central areas; in contrast, those with more limited knowledge of smart phones and car sharing were more likely to move closer to central areas.
These early studies suggest that in the US, the broader introduction of AVs may bring another wave of urban sprawl and suburbanization by affecting people’s residential location choices to move farther away from central areas. To date, few studies have focused on these questions in the context of China, and we have not seen any comparative studies between the US and China that examine the potential impacts of AVs on people’s residential location changes or choices, urban spatial structure, and land use. To begin to fill this gap, this study focuses on comparing two cases around people’s knowledge of AVs and the possible effects of AVs on people’s residential choices and resulting spatial structures.
3. Methodology
Stated preference was used to measure individuals’ preferences because level 4 automated vehicles [17], which we label autonomous vehicles (AVs) in this paper, were not yet widely available to the public. We used the term “self-driving car” instead of the more technical term “autonomous vehicle” in the questionnaire to make it easier for people to understand the key study concept.
3.1. Survey Design
An online questionnaire survey was conducted using Qualtrics [45] (US-based online survey website) in October 2018 to April 2019, which can be organized without time and space constraints and with wide radiation population and scope. We simultaneously distributed it in the US and China on a large scale. The survey-targeted group was car-oriented adults (18 years old and above) by screening. The sample was stratified by age, with 100 to 200 cases in each country in each of the following periods: born before or in 1945; 1946–1955; 1956–1964; 1965–1980; 1981–1990; and 1991–1999. The sample was balanced by gender within each age stratum.
In the questionnaire, respondents were first asked about the travel mode for their most-frequent trip. If the answer was “drive in my personal vehicle”, they met the criterion for being car-oriented and were able to continue to the survey. We chose to focus on participants whose most-frequent travel mode was driving a personal vehicle as these people may be among those most affected by broader availability of AVs. We aim to compare these car-oriented populations in US to those in China.
To ensure that all respondents understood what we meant by a self-driving car—the level 4 AVs we used in this study—they had to watch a video about level 4 AVs and read a definition of what we meant by a “self-driving car”. To ensure that people had paid some attention to this definition, they had to answer four “true or false” questions correctly about how we defined “self-driving cars” within two attempts. If they failed to answer the questions correctly, they were dropped out of the survey. If they succeeded, they could continue with the survey. This design was used to ensure respondents fully understood the meaning of level 4 AVs as we defined them in this study. It is worth noting that to the understand the respondent’s original familiarity of AVs and the maximum level of automation that the respondent would be comfortable with in a personal vehicle, they were asked these two questions before being shown the AV definition and video.
The survey consisted of five sections:
- (1)
- Questions regarding respondents’ knowledge of and preferences for AVs. We asked the following: “How much would you say that you know about self-driving cars?” and “Suppose you had a self-driving car that would let you move from your current home farther away from the nearest city or farther away from the destination for your most-frequent trip. In the self-driving car, even if you were farther away, the amount of time the trip would take would be the same, and you might be able to do other things when in the self-driving car. How likely would you be to consider moving farther away?” Responses were captured using five-point Likert scale. These two items were dependent variables in this analysis.
- (2)
- Socio-economic and demographic questions to describe respondents included age, gender, country, employment status, family situation, health, education level, residential location and annual household income level.
- (3)
- Questions about features in people’s current cars. These questions included vehicle cost, car purchasing time, new or pre-owned when bought, and the presence of different technologies that could take on the automatic functions of the driving task (e.g., automated lane keeping, pilot assist, parking assist, automatic cruise control).
- (4)
- Questions about the characteristics of the most-frequent trip. These included importance of the vehicle for people, respondents’ travel time in vehicles, access time to vehicle form start point and parking issues.
- (5)
- Attitudinal statements about people’s preferences for AVs. Statements included overall attitudes toward AVs, the transportation environment, driving flexibility, and new technologies. Responses were measured with a five-point Likert scale. For the analysis, items were coded into dummy variables to avoid a heterogeneity problem: respondents’ preference choices of 1, 2 or 3 were coded as 0 (more negative attitude toward), and 4 and 5 were coded as 1 (more positive attitude toward).
We embedded quality-checks throughout the questionnaire. For example, we asked respondents to choose one designated answer among other options; if they failed to do so, we recorded this and asked them to re-answer the attitude-statement questions.
3.2. Survey Data
After initial data cleaning and removing respondents who did not complete the full survey, we had a valid sample size of 1796 respondents, with 555 respondents from China and 1241 from the US. Due to limited time and funding, we were not able to collect a larger sample in China. The more limited sample size in China is also likely an artifact of the sample requirements. In the US, car-oriented individuals are relatively common; from the 1960s to the present, National Household Travel Surveys show that over 80% of daily trips and over 80% of people in the US typically commute to work using personal vehicles [46]. This percentage in China is much lower because car drivers only account for 26.45% of the total population [13,47]. However, with a population weighting methodology, we do not believe that the disparity in sample sizes will greatly affect our study results.
To try to ensure more representative survey results, sample proportions were scaled by the car-driver populations in the two countries. The Chinese data were weighted using data from the Ministry of Public Security of the People’s Republic of China [47]; the US data were weighted using data from Statista [48,49]. Weights were calculated based on gender and age using an iterative proportional fitting approach [50], and data were weighted for all analyses.
Table 1 shows the individual demographic characteristics for the samples, including gender, age, marital status, whether they had any children, home and car ownership, physical challenges that make it difficult to travel outside of the home, residential location, employment status, education level, and annual household income level. We were not able to collect data from any Chinese car drivers born before 1945, because drivers over 75 are banned from driving in China. The percentage of respondents born in 1946–1955 who chose “drive in my personal vehicle” as the travel mode for their most-frequent trip is small, but it accords with reality because Chinese drivers over 60 only make up 2.74% of the total drivers [47]. For similar reasons, there is a small percentage of respondents who have physical challenges in both countries, especially China.

Table 1.
Demographic characteristics of the Chinese and US samples.
Most Chinese respondents live in mid-sized cities, as shown in Table 1, whereas a plurality of American respondents live in suburban areas. The majority of participants in both countries own their own home and car, but fewer Chinese respondents bought a pre-owned car compared with the US respondents. Levels of education are relatively similar across the two samples. Fewer American respondents were married, reported having children or were employed compared with the Chinese samples.
Considering the obvious differences in the overall economic level of countries at two different stages of development, it is not possible to compare household income directly in the modeling, so it is reasonable to use the distribution of household income of residents to compare the impacts of economic conditions on residents’ cognition and behavior in different countries. We divided annual household income into four levels for each country: income level 1 means <¥105,000 in China and <$35,000 in the US; income level 2 means ¥105,000–¥349,999 in China and $35,000–$74,999 in the US; income level 3 means ¥350,000–¥874,999 in China and $75,000–$124,999 in the US; and income level 4 means ¥875,000 and above in China and $125,000 and above in the US. Table 1 shows that respondents from both countries have similar levels of income, and most of them have level 2 or 3 annual household income.
3.3. Ordered Logistic Regression Model
Due to the ordered characteristics of the variables used in the study, logistic regression was employed for analysis. Since the dependent variables and respondents’ attitudes toward autonomous vehicles were ordinal variables with a five-point scale, we used an ordered logistic regression model. Data analysis was conducted in Stata SE version 14.
4. Results and Discussions
In this section, we first present a descriptive analysis of the key dependent variables: (1) people’s knowledge of AVs and (2) moving farther likelihood if AVs were available. The results from the two logistic-regression models are showed in Table 2 and Table 3, respectively, to analyze the factors that affected people’s levels of knowledge about AVs and likelihood of moving farther if AVs were available.
Table 2.
People’s levels of knowledge of AVs model results.
Table 3.
Moving farther likelihood model results.
4.1. Descriptive Analysis
Figure 1 shows that there are significant differences between the Chinese and US samples in relation to drivers’ knowledge of AVs and their likelihood of considering moving farther if AVs were available. The average scores of “knowledge of AVs” in China and the US were 2.43 and 2.59, respectively, and these differ significantly based on a t-test at the 93.94% confidence level. Chinese respondents think that they have less knowledge of AVs compared with American respondents. In terms of the likelihood of considering a moving farther if AVs were available, the mean scores for the Chinese and US samples were 3.08 and 2.67, respectively, and this difference is significant at the 99.99% confidence level with a t-test. This result suggests that Chinese respondents would be more likely to consider moving farther away from the nearest city or from the destination for their most-frequent trip if they had an AV. Only 29.8% Americans reported that they would be likely to consider moving farther if they had an AV, compared with 42.3% of Chinese respondents who were likely to consider moving farther. Note that in this survey, we had respondents assume that the amount of time their most-frequent trip would take would be the same as it was presently, even if they moved farther away, and we indicated that respondents might be able to do things other than driving when traveling in an AV. These data suggest that the advent and widespread adoption of AVs in the future may lead to a new round of urban sprawl, particularly in China.
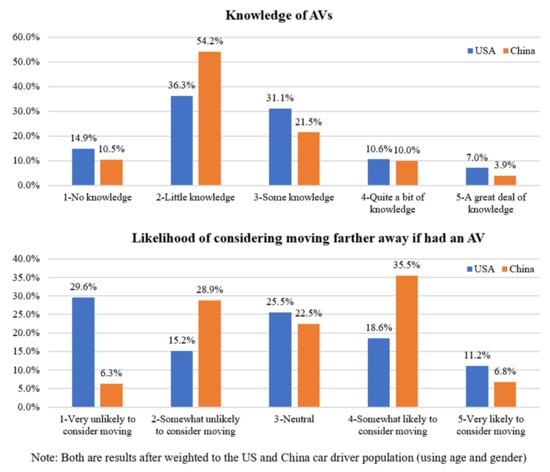
Figure 1.
Knowledge of AVs and likelihood of considering moving farther away if had an AV in China and the US.
4.2. Ordered Logistic Regression Model Results and Analysis: Knowledge of AVs
To understand the factors that influence people’s knowledge of AVs, three ordered logistic regression models were estimated, with individuals’ level of knowledge of AVs as the dependent variables. The first model was jointly estimated by combining two samples, and the other two models were estimated on a single sample. Results are shown in Table 2.
Table 2 shows that socio-economic characteristics have significant influence on people’s levels of knowledge about AVs in both China and the US. In both countries, men are more likely to report that they know more about AVs, and individuals with private cars report greater levels of knowledge of AVs compared with people who rent cars or commute in other ways. By comparing the coefficient sizes of the first model, we found that car ownership plays a bigger role in knowledge of AVs among Chinese respondents than among US respondents, while gender plays a bigger role in the US than in China. In the US sample, respondents who were young, unmarried or had children reported higher levels of knowledge of AVs. In China, respondents who do not own their home or who had physical challenges were more likely to indicate higher levels of knowledge of AVs. These results are reasonable, as people who do not own their homes may be more willing to move generally and thus would more actively consider both residential location and travel mode choices, so they may be paying more attention to new travel technology such as AVs. In the US but not in China, individuals with level 4 household income were more likely to report greater knowledge of AVs than people with other income levels. People at a high-income level may have more time and better access to information about new technologies such as AVs, so they may in turn know more about AVs than others.
One interesting finding is that respondents’ living area plays a role in their reported levels of knowledge about AVs in both countries. The model results suggest that, compared with respondents living in rural areas, respondents who live in a large city have more knowledge about AVs in both China and the US. The effect in China is more significant. These effects, however, may be related to the fact that overall higher levels of education or income in large cities exist in both countries, and thus respondents who live in large cities may have more opportunities to learn about new technologies such as AVs. Both results, estimated jointly and separately, show that, in China, people living in rural areas report having less knowledge of AVs than people in other areas, and people who live in suburban areas have the highest level of knowledge of AVs among all areas. This can be explained by the fact that long-distance commutes from the suburbs to large cities have stimulated interest in self-driving technologies.
Table 2 also suggests that individuals whose current vehicles had more automatic features were also more likely to report greater knowledge of AVs. Having automated lane-keeping features on vehicles in China and pilot assist in the US were significantly related to knowledge, but these effects for automated lane keeping in the US and pilot assist in China were not significant. In addition, in the US sample, individuals who purchased used cars knew less about AVs than those who bought new cars.
The characteristics of travelers’ daily trips (especially their most-frequent trip) also affect their knowledge of AVs. In the US, travelers who had a long access time to their vehicle by walking knew more about AVs. Additionally, the more important a private car was to American travelers’ daily trips, the less travelers knew about AVs. Perhaps the more important a private car is to individuals, the more dependent on and trustful they are of their vehicles. As a result, they may be less interested in knowing more about AVs. Among Chinese drivers, those who have longer travel times and who have a longer driving distance weekly tended to be more aware of AVs.
Attitudes also affect individuals’ knowledge of AVs. The results in Table 2 show that in the US, individuals who are more willing to purchase a car with a self-driving feature if one were available in the future have more knowledge about AVs. In both China and the US, people who have greater confidence in learning about new vehicle technologies and who have more experience with automated driving technologies (such as adaptive cruise control, automated lane keeping, automated parking, etc.) know more about AVs. People’s satisfaction with the technology features in their current vehicles was only significantly related to knowledge of AVs in China: among Chinese participants, the more satisfied they were with the technology on their current vehicle, the less they would know about AVs. This may be because people who are satisfied with “what they have” tend to focus on and enjoy the present situation and pay less attention to new matters.
4.3. Impact of AVs on People’s Likelihood of Moving Farther
To understand the factors that affect people’s willingness to move farther if AVs were available, ordered logistic regression models were estimated jointly or separately. The first model was jointly estimated by combining two samples, and the other two models were estimated on a single sample. With the dependent variable of an individual’s willingness to move farther, the results are shown in Table 3.
Figure 1 showed that people in China and the US differed with respect to “the likelihood of moving farther if had an AV”. To study the factors that affect residential location if AVs were available, individuals’ knowledge of AVs was added into the ordered logistic regression model as an independent variable. The result of the models in Table 3 indicated that Americans with greater knowledge of AVs were more likely to consider moving farther away from the nearest city or the destination for their most-frequent trip if AVs were available. However, the relationship between knowledge and likelihood of moving farther was not significant in China, although, as shown previously in Figure 1, Chinese people were more likely to report that they would move farther away from central areas.
Socio-economic characteristics were related to the likelihood of moving farther in the US (Table 3). First, those who were men, were young or who owned cars were more likely to move farther away from the nearest city or the destination of their most-frequent trip in the US. Second, if AVs were available, people in the US who were married or employed also reported that they were more willing to choose to live farther away than those who were the single or unemployed. This may be because AVs could offer more benefits for the married or employed to live farther away more comfortably; for instance, people who are employed could conduct business matters during the time spent traveling by AV, and unmarried people who might be looking for a romantic partner may prefer to live in more densely populated areas. Third, people who did not own their homes reported that they would be more likely to move farther. It is possible that these people could change their residential locations farther more easily than people who own their own homes. It may also be that those who do not own their own homes might be more likely to consider a move farther away in order to be able to afford homes that may currently be less expensive than those closer to an urban center. Finally, Americans who live in the downtown areas of large cities are more willing to move farther away than people who live in rural areas. This suggests that AVs may make commuting acceptable to people, so they may give up living in downtown areas where housing costs, crime rates and air pollution may be greater. In China, respondents who were living in mid-sized or small cities reported that they would be more likely to move farther away than those who lived in rural areas. However, age, gender, car and house ownership, marital and employment status and living location were not significantly related to respondents’ moving farther likelihood in China.
Travelers’ trip characteristics were also significant predictors of willingness to move farther if AVs were available. Chinese and Americans who had longer travel times were more likely to consider moving farther if AVs were available; travel time affected Chinese respondents slightly more than Americans when their coefficients were compared. In the US, people seemed to be more sensitive to access time to their vehicles. Americans who spent more time gaining access to their vehicles were more likely to be willing to move farther. In China, weekly driving distance had a significant negative effect on respondents’ decisions to move farther from central cities. Given the assumption that travel time for one trip is the same as it was in the past, Chinese respondents who drove more miles weekly did not want to move farther. It may be that these people travel frequently and prefer to live in a place with convenient transportation [51,52,53], and as such, the benefits of AVs may be limited for them.
Finally, the likelihood of moving farther if AVs were available was affected in both China and the US by people’s attitudes and perceptions of AVs. In both countries, the higher the maximum level of automation that people were comfortable with in their private vehicles, the more likely they were to be willing to move farther. In both countries, people who had the following attitudes or perceptions were more inclined to be willing to move farther: (1) more willing to purchase a car with a self-driving feature if AVs were available; (2) greater confidence in learning new technologies in a new vehicle; (3) more experience with automated driving technologies; and (4) more dissatisfaction with the technology features on their current vehicles. These attitudes all have a bigger impact in US than in China, except for confidence in learning new technologies in a new vehicle—this variable has a larger effect for China than for the US sample when their coefficient sizes are compared. The effect magnitudes of these variables are all shown in Table 3.
5. Conclusions
Recent technological advances in the field of autonomous vehicles indicate that such vehicles will be available to consumers in the foreseeable future. Yet, AVs may have vastly different futures and impacts in different countries. This paper explores the potential effects of AVs in China and the US through a comparative analysis; in addition to other differences, these countries represent ones that are developing and developed, respectively. In both countries, we focus on drivers’ knowledge of AVs and their moving farther likelihood if AVs were available, as well as the factors that might affect knowledge and willingness to relocate. This unique comparative analysis makes three significant contributions to the knowledge around people’s attitudes toward AVs and the potential effects the technology may have on spatial structure.
First, the results suggest that Americans have greater knowledge of AVs than Chinese. However, the factors that affect people’s knowledge of AVs are complex and differ somewhat between China and the US. Many factors that affect people’s knowledge of AVs are significant in both countries; people who were male, owned private cars or lived in downtown areas of large cities were more likely to report greater knowledge of AVs. Greater confidence in learning new technologies in a new vehicle and more experience with automated driving technologies were attitudes also associated with more knowledge of AVs. Gender, confidence in learning new technologies in a new vehicle and experience with automated driving technologies play a bigger role in knowledge of AVs in the US than in China. Conversely, car ownership and living in downtown areas of large cities had a larger influence on Chinese car drivers’ knowledge of AVs compared with those in the US.
The results suggest that different stakeholders—such as automakers, mobility-on-demand providers, and governments—might be better served by focusing on different factors or segments in different countries when it comes to trying to increase people’s knowledge of AVs. While this analysis focused on the US and China, it would be helpful to extend the analysis more broadly to explore how factors that affect knowledge of AVs may be related to national, geographic and cultural contexts.
Second, the results suggest that new mobility modes, such as AVs, may have major impacts on urban spatial structure, land use, residential location choice, and urban sprawl. In the surveys, we asked respondents about their likelihood of moving farther if they had an AV. We told respondents to assume that their total travel time would be same when using AVs as their current conventional vehicles, and they could use this time to do other things during the AVs’ trips. Under this assumption, compared with Americans, Chinese people were more likely to report that they were willing to move farther away from city centers or the destinations of their most-frequent trips. This may be related to China’s development status, as respondents may be more likely to be willing relocate than in a more developed country like the US.
Several factors affecting respondents’ likelihood of moving farther were significant in both countries. People in both China and the US were more likely to report that they were willing to move their residential locations farther if they: (1) had longer travel times, (2) were more willing to accept higher automation levels in their vehicles, (3) were more dissatisfied with the technology features in their current vehicles, (4) were more confident in learning new technologies in a new vehicle, (5) were more experienced with automated driving technologies (such as adaptive cruise control, automated lane keeping, automated parking, etc.) in a vehicle, and (6) were more willing to purchase a car with self-driving features. In addition, travel time and confidence in learning new technologies in a new vehicle had more significant effects on willingness to move within the Chinese sample than in the American one. Conversely, acceptance of maximum automation level, willingness to purchase a car with self-driving features, and experience with automated driving technologies had more significant effects in the American sample than in the Chinese one. We also found that Americans who were younger, male, had private cars, were married, were employed, were renting houses, were living in downtown areas of a large cities, and were taking more time to access their vehicles were more likely to be willing to move farther. In China, drivers who drove more miles weekly are less likely to consider moving farther away than those who drove less miles.
The results suggest that the advent of AVs may lead to a new round of urban sprawl: 42.3% of Chinese and 29.8% of American drivers were likely to consider moving farther if they had an AV. Thus, if policy makers wish to control or prevent the growth of additional urban sprawl spurred by AVs, they should focus on those Chinese drivers who have the characteristics mentioned above; drivers who live in mid-sized and small cities are worthy of more attention in China. In the US, effective land regulation could be laid down, especially in large cities. We need to consider AVs’ use on highways as part of people’s trips and continue to develop polycentric urban built environments that account for AV use to prevent or limit possible new rounds of urban sprawl spurred by AVs.
Finally, this comparative analysis shows that there are connections between knowledge of AVs and willingness to move farther if AVs were available. The logistic regression results show that in the US, Americans with a greater knowledge of AVs were more likely to consider moving farther away from the nearest city or the destination of their most-frequent trip if they had AVs. No similarly significant result was found in the Chinese sample in this context. Combined with previous analysis, the results suggest that Chinese drivers were more likely to move farther away than American drivers if AVs were available, even if they had less knowledge of AVs. This indicated that, compared with a developed country like US, AVs may present a bigger threat for greater urban sprawl in developing counties like China. With AVs becoming available to drivers globally, developing countries should be particularly attentive to the potential these technologies pose in relation to urban sprawl.
This paper has several limitations. First, we only focus on drivers in this study. In the future, broader swaths of the population should be studied. Second, because the percentage of Chinese drivers who took “drive in my personal vehicle” as the travel mode for their most-frequent trip is small—especially those who were older, physically challenged or who lived in rural areas and could not finish the online survey by themselves—the sample size in China was less than that in US. More Chinese data must be collected, and thus, in the future, data from people who are older or physically challenged will be collected. Third, we rely on stated preference measures for our dependent variable around willingness to move farther; it may be that if AVs were available, people in either location might be more—or less—willing to consider a move. Finally, in order to analyze the effects of AVs on willingness to move residential location farther, other additional factors should be included in the model in future studies to better capture people’s living situation, such as surrounding service facilities and amenities, living environments, and the nature and quality of the current residence.
Author Contributions
All authors have read and agreed to the published version of the manuscript. Conceptualization, J.G., S.Z., L.A.D., K.Z. and J.F.C.; Data curation, J.G.; Formal analysis, J.G.; Funding acquisition, J.G., K.Z. and J.F.C.; Investigation, J.G. and S.Z.; Methodology, J.G., S.Z. and L.A.D.; Project administration, K.Z. and J.F.C.; Supervision, K.Z., L.A.D. and J.F.C.; Validation, S.Z. and L.A.D.; Visualization, S.Z.; Writing—original draft, J.G. and S.Z.; Writing—review & editing, J.G., S.Z., L.A.D., K.Z. and J.F.C.
Funding
This research was supported in part by AARP in the United States, Science and Technology Planning Project of the Ministry of Housing and Urban-Rural Development of P. R. China (2018-K8-019, 2019-K-172), and “Industry R & D Center of Intelligent Vehicle Infrastructure Cooperative Key Technology and Equipment”, project of Ministry of Transport of China ([2017] No. 832).
Institutional Review Board Statement
The study was conducted according to the guidelines of the Declaration of Helsinki, and approved by the Institutional Review Board of MIT COMMITTEE ON THE USE OF HUMAN AS EXPERMENTAL SUBJECTS (protocol code 1806425935 and 07/03/2018, exemption granted).
Informed Consent Statement
Informed consent was obtained from all subjects involved in the study.
Data Availability Statement
Data will be available on suitable demand.
Acknowledgments
The authors thank Mazen Salah Danaf and the AgeLab at Massachusetts Institute of Technology for their comments and suggestions on the survey design and their support in conducting the survey.
Conflicts of Interest
The authors declare no conflict of interest.
References
- Gurumurthy, K.M.; Kockelman, K.M. Modeling Americans’ autonomous vehicle preferences: A Focus on Dynamic Ride-Sharing, Privacy & Long-Distance Mode Choices. In Proceedings of the 98th Annual Meeting of the Transportation Research Board, Washington, DC, USA, 13 January 2019. [Google Scholar]
- Stocker, A.; Shaheen, S. Shared automated vehicle (SAV) pilots and automated vehicle policy in the U.S.: Current and future developments. In Road Vehicle Automation 5, Lecture Notes in Mobility; Meyer, G., Beiker, S., Eds.; Springer International Publishing: Berlin/Heidelberg, Germany, 2019; pp. 131–147. [Google Scholar]
- Wadud, Z.; MacKenzie, D.; Leiby, P. Help or hindrance? The travel, energy and carbon impacts of highly auto-mated vehicles. Transp. Res. Part A Policy Prac. 2016, 86, 1–18. [Google Scholar] [CrossRef] [Green Version]
- Heinrichs, D. Autonomous Driving and Urban Land Use. In Autonomous Driving; Maurer, M., Gerdes, J., Lenz, B., Winner, H., Eds.; Springer: Berlin/Heidelberg, Germany, 2016. [Google Scholar]
- Gucwa, M. The Mobility and Energy Impacts of Automated Cars. Master’s Thesis, Stanford University, Standford, CA, USA, 2014. [Google Scholar]
- Childress, S.; Nichols, B.; Coe, S. Using an activity-based model to explore possible impacts of automated vehicles. Transportation Research Record. J. Transp. Res. Board 2015, 2493, 99–106. [Google Scholar] [CrossRef]
- Fagnant, D.J.; Kockelman, K. Preparing a nation for autonomous vehicles: Opportunities, barriers and policy recommendations. Transp. Res. Part A Policy Pract. 2015, 77, 167–181. [Google Scholar] [CrossRef]
- Cervero, R.; Kockelman, K. Travel demand and the 3Ds: Density, diversity, and design. Transp. Res. Part D Transp. Environ. 1997, 2, 199–219. [Google Scholar] [CrossRef]
- Guan, J.; Yang, D. Residents’ Characteristics and Transport Policy Analysis in Large-Scale Residential Areas on a City Pe-riphery: Case Study of Jinhexincheng, Shanghai, China. Transp. Res. Rec. J. Transp. Res. Board 2015, 2512, 11–21. [Google Scholar] [CrossRef]
- Guan, J.; Xu, C. Are relocatees different from others? Relocatee’s travel mode choice and travel equity analysis in large-scale residential areas on the periphery of megacity Shanghai, China. Transp. Res. Part A: Policy Pr. 2018, 111, 162–173. [Google Scholar] [CrossRef]
- Center Intelligence Agency. Country Area Comparison. 2019. Available online: https://www.cia.gov/library/publications/the-world-factbook/rankorder/2147rank.html (accessed on 1 August 2019).
- United States Census Bureau. 2018 US National Population. 2019. Available online: https://www.census.gov/library/visualizations/interactive/population-increase-2018.html (accessed on 1 August 2019).
- National Data of National Bureau of Statistics. Population Age Structure in China 2019. Available online: https://data.stats.gov.cn/easyquery.htm?cn=C01 (accessed on 30 September 2020).
- Statistics Times. 2021. Available online: https://statisticstimes.com/economy/united-states-vs-china-economy.php (accessed on 1 July 2021).
- West, D.M. Moving Forward: Self-Driving Vehicles in China, Europe, Japan, Korea, and The United States; Center for Technology Innovation at Brookings: Washington, DC, USA, 2016. [Google Scholar]
- Trommer, S.; Kolarova, V.; Fraedrich, E.; Kröger, L.; Kickhöfer, B.; Kuhnimhof, T.; Phleps, P. Autonomous Driving—The Impact of Vehicle Automation on Mobility Behavior Techincal Report. 2016. Available online: https://elib.dlr.de/110337/1/ifmo_2016_Autonomous_Driving_2035_en.pdf (accessed on 1 July 2021).
- SAE International. Taxonomy and Definitions for Terms Related to Driving Automation Systems for On-Road Motor Vehicles; SAE International: Warrendale, PA, USA, 2016. [Google Scholar]
- Talebpour, A.; Mahmassani, H.S. Influence of connected and autonomous vehicles on traffic flow stability and throughput. Transp. Res. Part C: Emerg. Technol. 2016, 71, 143–163. [Google Scholar] [CrossRef]
- Cui, S.; Seibold, B.; Stern, R.; Work, D. Stabilizing traffic flow via a single autonomous vehicle: Possibilities and limitations. In Proceedings of the 2017 IEEE Intelligent Vehicles Symposium (IV); Institute of Electrical and Electronics Engineers (IEEE), Redondo Beach, CA, USA, 11–14 June 2017; pp. 1336–1341. [Google Scholar]
- Ma, K.; Wang, H. Influence of Exclusive Lanes for Connected and Autonomous Vehicles on Freeway Traffic Flow. IEEE Access 2019, 7, 50168–50178. [Google Scholar] [CrossRef]
- Zheng, Y.; Wang, J.; Li, K. Smoothing Traffic Flow via Control of Autonomous Vehicles. IEEE Internet Things J. 2020, 7, 3882–3896. [Google Scholar] [CrossRef] [Green Version]
- Harper, C.D.; Hendrickson, C.T.; Mangones, S.; Samaras, C. Estimating potential increases in travel with autonomous vehicles for the non-driving, elderly and people with travel-restrictive medical conditions. Transp. Res. Part C Emerg. Technol. 2016, 72, 1–9. [Google Scholar] [CrossRef]
- Moreno, A.T.; Michalski, A.; Llorca, C.; Moeckel, R. Autonomous Taxis Effect on Vehicle-Km Traveled and Average Trip 4 Duration in the Greater Munich Metropolitan Area. In Proceedings of the 97th Annual Meeting of the Transportation Re-search Board, Washington, DC, USA, 7–11 January 2018. [Google Scholar]
- Harb, M.; Xiao, Y.; Circella, G.; Mokhtarian, P.L.; Walker, J.L. Projecting Travelers into a World of Self-Driving Vehicles: Naturalistic Experiment for Travel Behavior Implications. Transportation 2018, 45, 1671–1685. [Google Scholar] [CrossRef]
- Krueger, R.; Rashidi, T.H.; Rose, J.M. Preferences for shared autonomous vehicles. Transp. Res. Part C: Emerg. Technol. 2016, 69, 343–355. [Google Scholar] [CrossRef]
- Haboucha, C.J.; Ishaq, R.; Shiftan, Y. User preferences regarding autonomous vehicles. Transp. Res. Part C: Emerg. Technol. 2017, 78, 37–49. [Google Scholar] [CrossRef]
- Winter, K.; Cats, O.; Martens, K.; van Arem, B. A Stated-Choice Experiment on Mode Choice in an Era of Free-Floating Carsharing and Shared Autonomous Vehicles. In Proceedings of the 96th Annual Meeting of the Transportation Research Board, Washington, DC, USA, 8–12 January 2017; pp. 1–17. [Google Scholar]
- Steck, F.; Kolarova, V.; Bahamonde-Birke, F.; Trommer, S.; Lenz, B. How Autonomous Driving May Affect the Value of Travel Time Savings for Commuting. Transp. Res. Rec. J. Transp. Res. Board 2018, 2672, 11–20. [Google Scholar] [CrossRef] [Green Version]
- Nazari, F.; Noruzoliaee, M.; Mohammadian, A. Shared Mobility Versus Private Car Ownership: A Multivariate Analysis of Public Interest in Autonomous Vehicles. In Proceedings of the 97th Annual Meeting of the Transportation Research Board, Washington, DC, USA, 7–11 January 2018. [Google Scholar]
- Chen, T.D.; Kockelman, K.M. Management of a Shared Autonomous Electric Vehicle Fleet: Implications of Pricing Schemes. Transp. Res. Rec. J. Transp. Res. Board 2016, 2572, 37–46. [Google Scholar] [CrossRef]
- Levin, M.W.; Boyles, S.D. Effects of Autonomous Vehicle Ownership on Trip, Mode, and Route Choice. Transp. Res. Rec. J. Transp. Res. Board 2015, 2493, 29–38. [Google Scholar] [CrossRef]
- Milakis, D.; van Arem, B.; Van Wee, B. Policy and society related implications of automated driving: A review of literature and directions for future research. J. Intell. Transp. Syst. 2017, 21, 324–348. [Google Scholar] [CrossRef]
- Barbour, N.; Menon, N.; Zhang, Y.; Mannering, F. Shared automated vehicles: A statistical analysis of consumer use likelihoods and concerns. Transp. Policy 2019, 80, 86–93. [Google Scholar] [CrossRef]
- Jing, P.; Huang, H.; Ran, B.; Zhan, F.; Shi, Y. Exploring the Factors Affecting Mode Choice Intention of Autonomous Vehicle Based on an Extended Theory of Planned Behavior—A Case Study in China. Sustainability 2019, 11, 1155. [Google Scholar] [CrossRef] [Green Version]
- Saeed, T.U.; Burris, M.; Labi, S.; Sinha, K.C. An empirical discourse on forecasting the use of autonomous vehicles using consumers’ preferences. Technol. Forecast. Soc. Chang. 2020, 158, 120130. [Google Scholar] [CrossRef]
- Bansal, P.; Kockelman, K.M. Forecasting Americans’ long-term adoption of Gconnected and autonomous vehicle technologies. Transp. Res. Part A Policy Prac. 2017, 95, 49–63. [Google Scholar] [CrossRef]
- Sommer, K. Continental Mobility Study. 2013. Available online: https://www.continental.com/en/press/initiatives-surveys/continental-mobility-studies/mobility-study-2013 (accessed on 1 August 2019).
- Schoettle, B.; Sivak, M. Public Opinion about Self-Driving Vehicles in China, India, Japan, the U.S., the U.K., and Australia. The University of Michigan Transportation Research Institute: Ann Arbor, MI, USA. 2014. Available online: http://deepblue.lib.umich.edu/bitstream/handle/2027.42/109433/103139.pdf?sequence=1&isAllowed=y (accessed on 1 July 2021).
- Schoettle, B.; Sivak, M. A Survey of Public Opinion about Autonomous and Self-Driving Vehicles in the U.S., the U.K., and Australia; UMTRI-2014-21; The University of Michigan Transportation Research Institute: Ann Arbor, MI, USA, 2014. [Google Scholar]
- Bansal, P.; Kockelman, K.M.; Singh, A. Assessing public opinions of and interest in new vehicle technologies: An Austin perspective. Transp. Res. Part C: Emerg. Technol. 2016, 67, 1–14. [Google Scholar] [CrossRef]
- Liu, P.; Yang, R.; Xu, Z. Public Acceptance of Fully Automated Driving: Effects of Social Trust and Risk/Benefit Perceptions. Risk Anal. 2018, 39, 326–341. [Google Scholar] [CrossRef] [PubMed]
- Raue, M.; D’Ambrosio, L.A.; Ward, C.; Lee, C.; Jacquillat, C.; Coughlin, J.F. The Influence of Feelings While Driving Regular Cars on the Perception and Acceptance of Self-Driving Cars. Risk Anal. 2019, 39, 358–374. [Google Scholar] [CrossRef]
- Moore, M.; Lavieri, P.S.; Dias, F.F.; Bhat, C.R. On investigating the potential effects of private autonomous vehicle use on home/work relocations and commute times. Transp. Res. Part C: Emerg. Technol. 2020, 110, 166–185. [Google Scholar] [CrossRef]
- Zhang, W.; Guhathakurta, S. Residential Location Choice in the Era of Shared Autonomous Vehicles. J. Plan. Educ. Res. 2021, 41, 135–148. [Google Scholar] [CrossRef] [Green Version]
- Qualtrics, Provo, UT. Available online: http://www.qualtrics.com (accessed on 1 July 2021).
- U.S. Department of Transportation, Federal Highway Administration, National Household Travel Survey. 2017. Available online: http://nhts.ornl.gov (accessed on 1 August 2019).
- Ministry of Public Security of the People’s Republic of China. China’s Car Ownership Exceeded 200 Million for the First Time in 2018. 2019. Available online: http://www.mps.gov.cn/n2254098/n4904352/c6354939/content.html (accessed on 1 August 2019).
- Statista. Licensed Drivers in the United States from 2013 to 2017, by Age. 2018. Available online: https://www.statista.com/statistics/206311/total-number-of-us-licensed-drivers-in-2010-by-age/ (accessed on 1 August 2019).
- Statista. Total Number of Licensed Drivers in the United States in 2017, by Gender. 2018. Available online: https://www.statista.com/statistics/198017/total-number-of-us-licensed-drivers-in-2009-by-gender/ (accessed on 1 August 2019).
- Norman, P. Putting Iterative Proportional Fitting on the researcher’s desk. Sch. Geogr. Work. Pap. 1999, 99, 1–32. [Google Scholar]
- Guan, J.; Zhang, K.; Shen, Q.; He, Y. Dynamic Modal Accessibility Gap: Measurement and Application Using Travel Routes Data. Transp. Res. Part D: Transp. Environ. 2020, 81, 102272. [Google Scholar] [CrossRef]
- Guan, J.; Zhang, K.; Zhang, S.; Chen, Y. How is public transit in the megacity peripheral relocatees’ area in China? Captive transit rider and dynamic modal accessibility gap analytics in a peripheral large-scale residential area in Shanghai, China. J. Transp. Land Use 2020, 13, 1–21. [Google Scholar] [CrossRef]
- Mao, H.; Fan, X.; Guan, J.; Chen, Y.-C.; Su, H.; Shi, W.; Zhao, Y.; Wang, Y.; Xu, C. Customer attractiveness evaluation and classification of urban commercial centers by crowd intelligence. Comput. Hum. Behav. 2019, 100, 218–230. [Google Scholar] [CrossRef]

Publisher’s Note: MDPI stays neutral with regard to jurisdictional claims in published maps and institutional affiliations. |
© 2021 by the authors. Licensee MDPI, Basel, Switzerland. This article is an open access article distributed under the terms and conditions of the Creative Commons Attribution (CC BY) license (https://creativecommons.org/licenses/by/4.0/).