Abstract
In the last decade, technological advancements in the cyber-physical system have set the basis for real-time and context-aware services to ease human lives. The citizens, especially travelers, want to experience a safe, healthy, and timely journey to their destination. Smart and on-ground real-time traffic analysis helps authorities further improve decision-making to ensure safe and convenient traveling. In this paper, we proposed a transport-control model that exploits cyber-physical systems (CPS) and sensor-technology to continuously monitor and mine the big city data for smart decision-making. The system makes use of travel-time, traffic intensity, vehicle’s speed, and current road conditions to construct a weighted city graph representing the road network. Traditional graph algorithms with efficient implementation technologies are employed to respond to commuters’ and authorities’ needs in order to achieve a smart and optimum transportation system. To efficiently process the incoming big data streams, the proposed architecture uses the Apache GraphX tool with several parallel processing nodes, along with Spark and Hadoop that ultimately provide better performance against various state-of-the-art solutions. The system is thoroughly evaluated in terms of system throughput and processing time, revealing that the proposed system is efficient, robust, and scalable.
1. Introduction
Currently, billions of heterogeneous devices and smart objects are interconnected over the Internet. Integrating these smart objects and devices on interconnected networks establishes a smart system, termed as a cyber-physical system (CPS). The number of interconnected devices is substantially increasing day by day. For instance, one of the recent CISCO reports [1] stated that the total number of connecting devices around the globe would outnumber the human population by more than three to one with a total of 29.3 billion networked devices in 2023. This figure is substantially higher as compared to 18.4 billion in 2018. The significant increase in the number of CPS devices laid the basis of the digital world. CPS lifts humans’ quality of life in terms of their health, transportation, emergency response, safety, and security, and much more. Numerous developed countries have started to invest their efforts and resources to implement CPS to propose innovative services to enrich the human experience. Smart planning and development in the urban areas have a crucial impact on inhabitants’ life quality [2]. This impact can be in terms of their security, safety, health, pollution safety, and so on so forth. In developed countries, various smart planning and development projects are undergoing that make use of the city data collected from distinct kinds of sensors deployed within a city. They provide the monitoring services for the cyclist, automobiles, air pollution, car parking regions, noise, surveillance, and others by utilizing the CPS infrastructure [3]. As an example, Japan launched broadband communication between individuals (people to people), machines (machine to machine), and possessions (things to things) through the deployment of CPS to make the world smarter [4]. On the other hand, South Korea launched CPS enabled Smart Manufacturing System for enhancing the regular operations of the manufacturing industry [5]. These indicated initiatives served as the groundwork for CPS technologies.
A cyber-physical system consists of embedded systems installed on billions of smart objects. Thus, the size and scope of CPS are increasing immensely that bring new opportunities and challenges [6,7]. Such systems yield thousands of bytes per second with a diverse nature of the information that results in massive data, termed big data. In the same way, big data also brings a lot of challenges as well as opportunities. Thus, the suitable and worthwhile analytics on the big data conveys the advancement in information and communications technology (ICT) and enriches the city traffic with smart decisions [8]. Hence, big data analytics give a deeper understanding and insight knowledge of the data with useful future predictions that can be used for decision-making in planning and development [9,10,11]. Conversely, owing to the large volume of data generated by CPS devices, the challenges to handle it for smart and intelligent decisions have also increased. These challenges are mainly related to data storage, management, processing, and analysis.
The development of any city mainly relies on the transportation system’s condition and its facilities to the citizens. A smart transportation system, with real-time information to citizens, provides safe and convenient traveling options that can be worked on promptly [12]. These facilities affect citizens’ lives in terms of their rapid movement and provide many other remunerations to a society, such as pollution avoidance, economic boost up, speedy development, better health, and much more. Various studies [13,14,15,16] have proposed different techniques and systems to handle big data generated by smart cities to generate smarter, intelligent, and sustainable results. However, these systems do not solely focus on the real-time smart transportation management component with a big data perspective. Analysts predicted that seventy percent of the earth’s population, which is larger than six billion, would move to urban and adjacent areas by 2050 [17]. As a result, it will significantly increase the volume of traffic in the city. This massive growth in the city traffic intensity will cause overwhelming communication between vehicles and road sensors in the CPS environment, producing high-velocity big data. Moreover, this overwhelming increase in traffic intensity may lead to a proportional rise in on-road traffic accidents. Consequently, citizens will face the problems of traffic jams and being delayed to reach their destinations. With the growing evolution of technology, people might want to access any information, anytime and anywhere regarding on-road city traffic. Simultaneously, the authorities might also require distributing the city traffic to avoid traffic congestion by intelligently diverting traffic to less crowded roads in real-time. This distribution also reduces air pollution that makes inhabitants healthier. In a nutshell, there is a need for traffic authorities to control the traffic system smartly with minimal human interventions and resources. This smart management of the traffic facilitates real-time transportation statistics to the resident and leaves a significant influence on citizens’ lifestyles. The main contributions of this research include:
- A smart transport control model is proposed that is able to harvest the real-time data from road sensors and provides data aggregation and data processing facilitates over huge datasets to generate smart transportation management related decisions.
- Traditional graph algorithms are employed in a parallel environment of the Hadoop ecosystem where the big graph is split into mutually node-exclusive sub-graphs, which are individually run on distributed Hadoop and Apache Spark nodes. The road network is represented as a weighted graph with various basic-weights, including vehicle count, vehicles’ speed, and distance. The final weight is computed for each road-link (graph edge) from basic-weights depending on the given commuter or authority’s use-case.
- The proposed system is practically implemented using Apache Spark GraphX on top of the Hadoop ecosystem by replaying city traffic datasets to imitate as a real environment. The system is evaluated concerning efficiency by considering its throughput and response time with various aspects.
The rest of the paper is organized as follows. Section 2 presents the background study on the related existing work. Section 3 describes the proposed system’s details, which includes the proposed system architecture, implementation model, details of graph-based approach, and the data analysis. Section 4 presents the implementation environment and evaluates the system in terms of efficiency. Finally, in Section 5, the conclusive remarks are presented.
2. Related Work
The recent research findings are limited in the field of smart transportation and CPS. Furthermore, they lack big data processing technologies while working with real-time transportation data. Furthermore, the current intelligent transportation systems widely depend on historical data and human findings that do not consider real-time traffic information and its velocity into account. For instance, Van Lint [18] redesigned the existing learning model that takes knowledge from historic and complex data for traffic dynamics to establish an intelligent transportation system. With different approaches, Van Lint [18,19,20] only considered a specific traffic problem, which determines the short-term travel time based on traffic-history on a freeway. Similarly, Lin and Liu [21] upgraded the existing analytical system called the optimal dynamic traffic assignment model, which was based on linear programming in order to merge junctions. Zhao et al. [22] used linear programming and proposed a searching algorithm based on a greedy approach for fast, optimal, and single-cycle signal timing at distinct oversaturated junctions.
On the other hand, researchers also worked on various safety issues for the transportation systems. For example, Mulder et al. [23] proposed a support system design for drivers to control the manual longitudinal of a car when following a car. Their main aim was to build a system that cooperates with the car driver while maintaining a safe distance from the leading vehicle. Furthermore, as a part of an intelligent transportation system, some researchers proposed an electronic-toll-collection system [24] by using infrared technology with extended communication areas and performance of data transmission. Alonso-Ayuso et al. [25] worked on airspace transportation management to avoid accidents and collisions among a large number of planes. For this purpose, they used geometric transformations along with mixed a binary linear optimization model. Basically, they worked on deciding the best configuration for a new aircraft, such as its velocity and altitude, to avoid airspace conflicts. Besides, Ondrej Pribyl [26] used the entropy measure as an objective function in order to establish an intelligent and smart level. Similarly, Fenghua Zhu [27] proposed architecture for parallel transportation management and control systems (PTMS) to contribute to smart city establishment. Furthermore, a parallel spatio-temporal database approach [28] was proposed by enabling smart transportation while considering the GPS data of vehicles, cyclists, and pedestrians.
With the increasing urban population growth, the overwhelming traffic management-related issues are getting more challenging to solve. As a result, traffic congestion and the number of accidents escalate. Several traffic management methods and technologies within the Internet of Vehicles (IoV) based on 5G are designed to reduce road accidents, congestion, and pollution. The authors in [29] presented a thorough examination of 5G about road traffic management and revealed various issues during resource allocation. The integration of vehicular ad hoc networks with long-term evolution (LTE) creates a heterogeneous network capable of delivering seamless connectivity and meeting the communication needs of intelligent transportation systems. Vehicle clustering on the IoV is essential for reducing data and better LTE network utilization. Similarly, authors in [30] highlighted challenges in sharing expensive data collected from the IoV non-cooperation in the clustering process and within a cluster. The study proposed two algorithms for a dominant strategy to accept the request of the cluster head. The implementation of the proposed algorithms shows promising results for vehicular applications for road traffic management with heterogeneous network infrastructure. In [31], a resource allocation algorithm was proposed called ACORA scheme to manage connected vehicles based on a nature-inspired algorithm that is ant colony optimization. The authors use a swarm intelligence algorithm for the purpose to reduce computation complexity during resource allocation.
In the IoV applications, sustainability can be achieved by deploying pollution-free vehicles, preserving road traffic safety, and avoiding accidents or collisions. The authors [32] conducted a brief review of existing sustainable transportation techniques in the IoV and numerous sustainability features and the benefits and drawbacks of existing transportation systems to develop an effective, sustainable transportation planning system. Based on the survey results, it is clear that several current approaches are geared towards achieving varied sustainability features in terms of transportation. Existing techniques for pollution control, carbon emission reduction, and energy conservation do not include road traffic safety. In contrast, road traffic safety and driver/passenger safety methodologies do not include pollutant control, carbon emission reduction, or energy conservation. The authors in [33] highlight the set of ideal characteristics related to traffic circumstances that could be determined based on the traffic data distribution and then utilized to forecast future traffic running conditions.
In heterogeneous vehicular clusters, vehicle synchronization is critical for effective data sharing. To assist drivers on the roadways, roadside unit clusters in vehicular networks play a vital role. In [34], the role of roadside unit clusters to predict road traffic patterns is presented. The study performed data processing at the vehicle cluster level to improve the capabilities of roadside units with the help of deep learning. However, signal interruption from the global positioning system (GPS), particularly in metropolitan areas, significantly affects the loss of synchronization among the vehicles, leading to cluster instability. The inability to design cost-effective solutions for obtaining assistance and route planning applications is hampered by the instability of connections. The authors discuss the use-case where connected vehicles that depend on GPS perform poorly in urban areas. The findings suggest that the proposed mechanism enhances vehicular network capabilities, allowing the IoV to function better in complicated (heterogeneous network) network scenarios. Similarly, authors in [35] discuss QoS techniques in vehicle-to-vehicle (V2V) communication that is based on dedicated short-range communication (DSRC). Vehicles exchange information on route choices, congestions, and traffic and decide by selecting the best option with the help of a QoS mechanism based on the data aggregation technique.
Vehicular Cloud Computing (VCC) is a new paradigm in the IoV that has revolutionized vehicle communication and traffic control applications. Vehicles’ underused resources can be shared with other vehicles via the VANET to improve road traffic management. The ability of cloud computing to integrate and share resources has the potential to play a role in the development of traffic management systems (TMSs). In [36], the authors present a taxonomy of vehicular clouds to identify and differentiate the type of vehicular cloud integration. The VCC is expected to play a vital role in the future development of the intelligent transportation system. The VCC and its evolving form of IoVs offer much potential for generating more efficient autonomous vehicles.
The increase in vehicular traffic in metropolitan areas makes it difficult for authorities to manage city traffic. Due to a scarcity of human resources, authorities turn to intelligent and automated traffic management technologies to handle the growing traffic volume. In [37], the authors emphasize the importance of vehicular cameras in reporting traffic violations on the road and proposes a system for analyzing collected video for illegal behavior and reporting breaches to traffic authorities. The Single Shot MultiBox Detector (SSD) is used to identify front cars, while the Hough transform is deployed to identify road lanes. The violations are then recognized with the help of the violation-detection algorithm, which detects traffic offenses such as making an incorrect U-turn or driving on a yellow or center dividing line to help the fog/edge IoT devices.
The restrained adoption of wireless technology in CPS is partly due to a lack of knowledge of the real impact of wireless deployment on physical processes, particularly in circumstances where low latency and high-reliability communications are required. The authors in [38] proposed a method for merging wireless network traffic statistics with physical process data to evaluate the impact of wireless communications on the functioning of a manufacturing industrial work-cell. The authors presented a novel method for capturing network and operational event data from a factory work-cell, with the goals of capturing and storing network and active events, calculating network performance metrics, and identifying performance dependencies between the network and the physical assembly of the work-cell. With the help of a graph database, the authors implemented a use case with an emulated robotic manufacturing factory work-cell approach with two collaborative grade robot arms for a pick-and-place task. Results show that wireless transaction latency has a minimal impact on the physical actions processing time. Furthermore, the authors suggested that the findings be applied directly in the control domain, with control loops reacting to changes in physical parameters by adjusting wireless network settings.
However, all of these approaches did not consider real-time traffic data and use state-of-the-art streaming APIs such as Spark to facilitate users based on real-time traffic scenarios. For example, in finding the suitable path to the given destination based on the user query, Google makes decisions based on offline data, which do not always convey satisfactory real-time results. Their results only use the distance measure to find the route, not the current traffic parameters, such as the real-time traffic intensity, the speed of vehicles, and road condition. However, when we talk about getting the real-time traffic information through IoT devices, billions of IoT objects work together to produce big data gigabytes in concise time chunks. These objects might work as a part of a vehicular network or can be a road sensor network. Thus, processing and analyzing such a big volume of high-speed data aimed at making intelligent transportation decisions is the main challenge to be countered. Therefore, by examining all the citizens’ and authorities’ current needs, we focused on establishing a smart city through the provision of smart transportation while utilizing real-time traffic analysis and graph processing techniques as road segments connectivity lend themselves easily to a graph structure.
3. Smart Transport System
This section discusses the proposed smart transportation system and presents its general layered architecture, the smart transportation building model through a implementation model, the data analytics procedure, and graph algorithms used along with their applications.
3.1. System Architecture
Smart transportation assures to deliver the right information at the right time at the right place and on the right device to facilitate the citizens while making any transport-related decision. To present CPS for the smart transportation system, we propose two main subsystems shown in Figure 1. These two subsystems include the vehicular network and the road sensors system. The road sensors are installed at each intersection of the road to collect information along with a small computing device to calculate the traffic information, including the number of vehicles, average speed of vehicles, and current traffic intensity. On the other hand, the vehicular network system is used to get the individual vehicle information such as location and speed. The proposed system counts on relay nodes, coordinators, gateways, aggregators, and classifiers to link both subsystems. For coherently processing the generated big data, parallel processing servers such as Hadoop and Spark are employed.
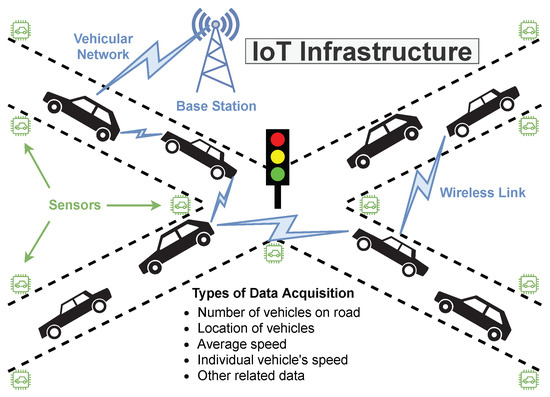
Figure 1.
The system deployment of IoT-based vehicular network.
The proposed system’s layered architectural view is presented in Figure 2. The proposed system generates and efficiently processes large graphs from vehicular based big data. The complete system is divided into seven layers, i.e., the data source layer, communication layer, graph building and processing layer, result layer, interpretation layer, and application layer. Each layer is different from another, having a diverse functionality. The layer within the algorithm which generates data is the first layer in the proposed system, known as a data source layer. In order to develop a vehicular network for the disposition of road sensors, this data generation layer integrates all the features necessary to gather traffic-related information within a real-time basis. This data source layer uses relay nodes, coordinators, and gateways to transmit the data generated over the Internet.
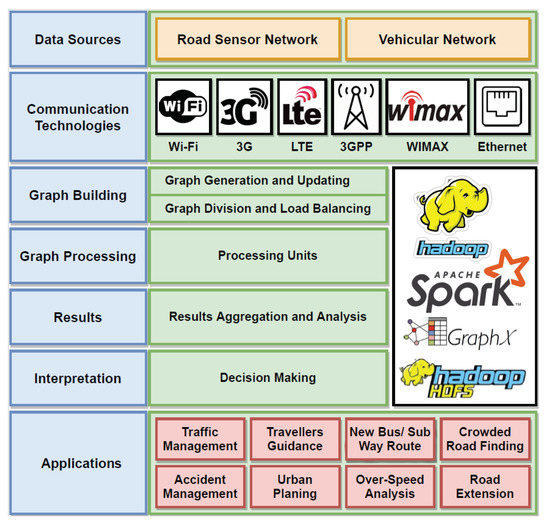
Figure 2.
Layered architecture for the proposed smart transportation system.
The second layer, represented as a communication layer, ensures data delivery between vehicles to the main analysis system, sensors to the analysis system, and subunits of the analysis system. This layer proposes cellular technology, such as 4G/LTE, 3G, GPRS to transmit data from vehicles to the Internet. Additionally, it can use Wi-Fi or Bluetooth technology to transfer data from road sensors to the Internet. Ethernet is proposed for all the communication within the subunits of the data analytic system.
The graph building layer is the key layer of our system, which generates and updates the graphs based on the real-time streaming vehicular data. In the first step, the city road graph is constructed that is scalable when a new road is built. The graph weights are updated only once any change happens in the traffic scenario, such as a sudden rise in traffic intensity or vehicle speed. Hence, the smart transportation system eludes the overhead of creating new nodes and edges or regenerating the whole graph repeatedly. In the case of weight appraisal, it employs an indexing mechanism to search a particular edge for updating. With a high velocity of data on roads, the indexing mechanism remarkably minimizes the searching and weight updating cost. Furthermore, to further enhance the system efficiency, it employs parallel processing of a single graph using multiple nodes while dividing the graph into numerous mutually exclusive sub-graphs. Afterward, when processing is required, it forwards all the independent sub-graphs to the processing server; hence it balances the system load.
The graph processing layer assists in processing the sub-graphs by accessing and distributing the load on multiple parallel servers. Among others, every processing server hosts various graph algorithms based on the user’s request or the authorities’ requirements. Each sub-graph within the main graph in this layer has a server output corresponding to each sub-graph algorithm. The data processing layer’s output is in pieces or segments, where each piece/segment corresponds to results on each sub-graph. The chunks are therefore aggregated for final analysis. The analysis is performed in the result layer. The results from each server are then aggregated into the next layer. At the last two layers, the decision-making process is initiated on the basis of the results generated. The mandated user or the intended audience is then notified about the results. These results can be used to map efficient alternative routes to the destination or can be used to inform the authorities regarding road obstructions, road jams (high-intensity traffic), accidents, etc.
3.2. Implementation Model
A detailed implementation model of the overall system application is presented in Figure 3. The analysis system known as smart transportation building (STB) is the core basis of the proposed approach for developing the city’s smart transportation network. Collection unit, filtration and classification unit, graph generation and updating unit, storage units, and processing unit are some main components of the proposed system’s sub-units. Routed over the Internet, data from the sensors mounted on vehicles and roads reach STB via various relay nodes, coordinators, and gateways. A distinct collection unit for traffic collection is used to avoid loss of network data arising out of exceedingly high speed and velocity of the network traffic. To achieve this purpose, the distinct collection unit is coupled with a network acquiring data from the hardware and the driver at high-speed. In the next step, the data is filtered in the ‘filtration stage’, where the data is cleaned from noise, meta-data, and repeated data. This is an important step that directly affects the quality of the analytics downstream. We used Spark for removing noise utilizing a single base classifier over a partitioning of the training set. In the third stage, in the header of the packet, the data is categorized based on the metadata field. Additionally, preliminary decisions at this stage identify conditions with traffic situations on the road, which can result in fatalities from accidents, inadvertent road obstructions, etc. The baseline data is used to analyze existing conditions with the values/data for severe traffic using vehicle count, speed, and location information. Having the capability to process massive graphs, using Apache Spark GraphX Tool, the data generated is then plotted as graphs. Hadoop ecosystem with Spark is utilized to perform real-time processing on data for graph’s parallel processing. Graphs were reassessed using GraphX as it is the most feasible method for processing graphs, unlike the default programming model of Hadoop, i.e., MapReduce, which is comparatively inefficient.
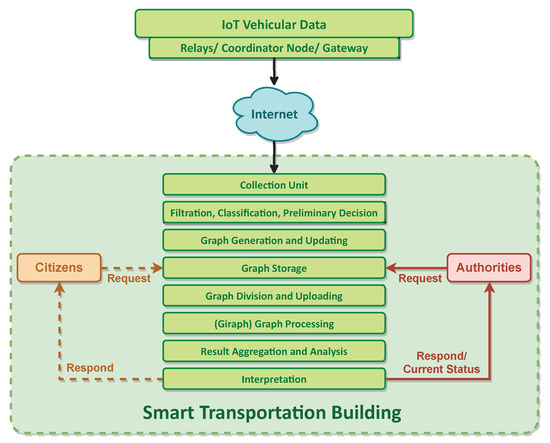
Figure 3.
The proposed system’s implementation design for smart transportation building model.
Hadoop distributed file system (HDFS)’s capability to store data in the form of graphs is utilized. Timely modifications in the graph are required for all the rapid changes in the current traffic situations. Measured in segments of time, the changes in traffic are routed to central smart transportation building. The graph requires the addition of new nodes and edges for the new roads. If not, the traffic rate changes are updated in the form of weights in the graph. Figure 3 shows that citizens’ access to the system is limited as represented by dots. Information related to the least time taking a path to the endpoint and all notifications are presented in the traveler’s dashboard. Notifications pertaining to information about the current traffic scenario on roads and other severe commuters/road traffic situations are all directed for action to the related departments. Furthermore, full control of the system is with the authorities, and they can acquire any kind of current information. On receiving requests from commuters or authorities (actors), the system through using Spark GraphX and the current graph status, provides the result to the actors by processes the implemented graph algorithm.
3.3. Use of Graph Technology in Smart Transportation
To execute smart transportation decisions, pre-developed algorithms for graphs with fluctuating weights are proposed. An explanation of some set of circumstances where pre-developed graph algorithms can be used for smart transportation decisions is provided in this section. For transport related decisions to citizens, Algorithm 1 presents the pseudocode of overall use-cases developed. The assessment is not restricted only to the listed situation; it can also be used for taking various other transportation-related complex decisions by modifying the graph technologies and required algorithms. This section explains the generation of graphs from vehicular data and some different outcomes that can be established by using real-time vehicular data for achieving smart transportation. These are not limited to decisions such as finding express routes to desired locations, identifying road blockages and traffic jams, finding the express traffic-free quick routes for multiple destinations, etc.
| Algorithm 1 Basic transportation decision making. |
Inputs:
|
Graph Building
The city traffic is represented as a set of vertices and weighted edges, denoted by a graph , i.e., , whereas vertex of represents intersection i of the road network and is the link between intersection i and intersection j. Each link stores three types of weights portraying current traffic conditions on that link. These three weights express the number of vehicles (), distance (), and average speed of vehicles () between intersections and . Figure 4 presents a sample graph showing the road network of a small portion of the city. The road from intersection to and from to is shown by undirected edges. Figure 5 shows that the graph is processed by its division into reciprocally exclusive N sub-graphs, i.e., such that . It is more feasible to segment the graph as per the city’s infrastructure setting, i.e., splitting graphs on the basis of bridges present throughout the city. Figure 6 shows the graph of a road in the suburbs of Rome, segmented based on the bridges into two sub-graphs. Individual Hadoop-node processes each one of the sub-graphs , whereas, at the data collection level, the results are aggregated. Subsequent decisions are processed via parallel processing of the sub-graphs using numerous graph algorithms.
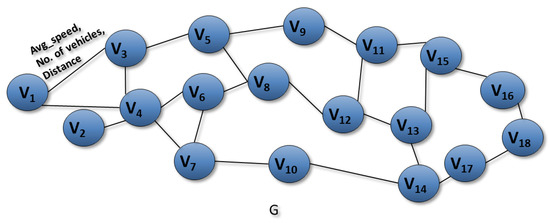
Figure 4.
A graph developed for a road network with weights information.
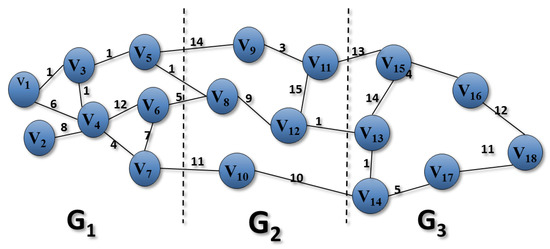
Figure 5.
The division of a road graph into partitions based on the geographical area in road-network.
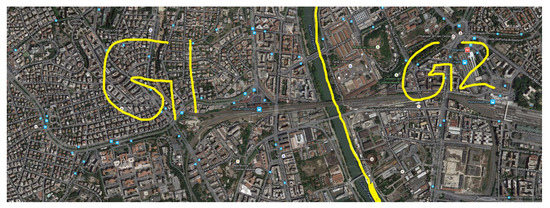
Figure 6.
The illustration of graph-division for smart suburbs of Rome City.
Fastest route: The system’s main objective is to assist people in getting to their destinations in a timely manner by letting them know the fastest possible route. Most of the traditional methods only used distance as a parameter for the express route. Even so, due to crowded roads at peak hours, the shortest path might result into the slowest route. Thus, the proposed system considers the current traffic condition along with the distance measurements. Current traffic intensity along with vehicles speed is used by the proposed method to find the quickest route. To solve a commuter’s problem, the use of the shortest-path spanning tree (SPST) is acclaimed. Dijkstra’s algorithm, which assesses the direct express route to the destination, is a widely used graph algorithm for SPST. In the first case, when we only need to attain the shortest route irrespective of the time, the distance is used as a weight of the edge to find SPST. In this case, the overall distance is calculated by Equation (1).
The second case is the most widely required scenario, where the commuter needs the quickest route to their destination. Hence, in this case, current traffic conditions such as the average vehicles’ speed (), along with the distance (), are used as weights on each edge. However, the weight on each edge is calculated by Equation (2) at the time of computing SPST. While the overall time to get to the destination is measured using Equation (3).
Crowded roads: The traffic control authorities, on the other hand, are interested in observing over-used or crowded roads at different time-spans. With this measurement, they can divert traffic from over-crowded roads to barely-used roads. In such scenario, the road condition and the traffic intensity are major parameters to be considered. Accordingly, the traffic intensity (), distance (), and the number of lanes () are used as basic weights for each edge, whereas the final weight for every edge is calculated as stated by Equation (4). Maximum spanning tree (MxST) algorithm is deployed by inputting final weights to determine all crowded links covering each intersection of the city road network. Prim’s algorithm and Kruskal’s algorithm are the two best options for MxST. The complexity of both of these algorithms is almost the same, which is and , respectively.
Extremely-Intense or blocked link: Finding blocked or over loaded roads is another possible need of traffic authorities. By the use of the blockage statistics, they can plan construction of new roads or widening of existing roads. In addition, real-time detection of blocked or overloaded roads can help authorities to take urgent actions to cater the situation. In this case, the weights are computing by Equation (4) and matched with a particular threshold using Equation (5). In case of crossing the threshold by a particular edge, the authorities are alerted by sending a blocked-road signal.
Quickest route with more than one destination: For daily commuters or delivery companies, traveling with multiple destinations with minimum possible time is a major challenge. Using real-time traffic conditions with the graph approach resolved their challenge by the proposed model. In this scenario, the final weights for each edge are computed in a similar way as we did in the case of finding the fastest passage by Equation (2). This challenge directly relates to the popular traveler salesman problem that can be resolved by various algorithms, such as Hamiltonian circuit.
Patrolling or cleaning problem: The patrolling police and cleaning or sanitation authorities need to visit all city roads in their jurisdiction. They can do it in a faster and more convenient way by using current traffic information and road network. Euler circuit and pathfinding algorithms are used for such problems. Euler circuit algorithm has algorithm complexity with E of edges.
3.4. City Traffic Data Analysis
Real-time data analysis is a crucial challenge in the smart transportation development system to take instant actions. Enabling smart transportation facilitates the official authorities and the people living in the city with various aspects, for example, it helps travelers avoid over-consumption of the fuel by efficiently selecting the best direction to get to their destinations. The robust smart transportation also ensures protection from air pollution by reducing traffic from congested areas. At this point, CPS technologies and big data analytics are utilized to analyze various kinds of vehicular data providing authorities with strategies to transform the city’s transportation system to be well-organized, efficient, and smart.
3.4.1. Datasets
We acquired real-time large size vehicular traffic generated datasets from various reliable resources. The Aarhus city located in Denmark traffic datasets [39,40,41] along with the Madrid, Spain highway vehicular traffic dataset [42] and vehicular mobility traces [43] of Cologne city of Germany are used for city traffic analysis. Aarhus city of Denmark dataset is generated by employing sensors at two endpoints of source and destination on numerous roads in the urban area to examine the vehicles’ movement between these points. Different parameters are collected in which few of them are related to the individual vehicle, such as the vehicle’s geo-position, the timestamp, and its speed. At the same time, other parameters represent the overall road current state such as traffic intensity on the road, the average speed of all the vehicles on the road, the distance of the road, number of lanes, etc. The Madrid Highway vehicular traffic dataset also covers the same information across two points of the highway. In Cologne, a city of Germany, vehicular mobility traces are produced by one of the institutes of the German Aerospace Center (ITS-DLR) as a part of the transportation project called TAPAS Cologne. It holds the mobility information of 700 cars moving within the 400 square km area of Cologne city within 24 h. A short summary of the datasets we have used in our study are presented in Table 1.

Table 1.
Datasets information.
3.4.2. Traffic Analysis
Initially, the traffic dataset acquired from Aarhus city, the second-largest city by population in Denmark, is analyzed by the proposed system. Figure 7 represents an analysis of the effect of traffic intensity on the vehicles’ speed. Between any two road segments with a granularity of 500 m, when the traffic intensity is more, i.e., (high number of vehicles between two points on the road), the typical vehicular speed is observed to be significantly low. Similarly, the opposite is observed, i.e., the average speed increases when fewer vehicles are on the road. As shown through the empty circle line on the graph, during various times of the day when the cars are significant (25–30) in number, the average speed becomes exceptionally low. However, as represented by the filled circle line on the graph, at the time when there are few cars, i.e., 0–10, the observed vehicular average speed is high. However, these scenarios do not always exist, and some anomalies are also observable, such as low average seed despite low car intensity. These scenarios mainly attribute to causes such as roads under construction or any accidents or weather situations such as rain, fog, etc.
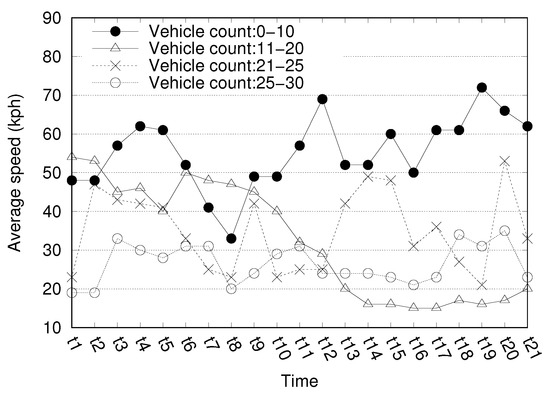
Figure 7.
The average speed of the vehicles between two locations with regards to traffic intensity.
On the other hand, the average speed and the road congestion/vehicle intensity on the road also impact the time it takes to reach the destination. Figure 8 represents the analysis of how the traffic intensity affects the time it takes to reach a destination and traffic’s impact on the overall journey time. It is, therefore, readily observable that the time taken to arrive at the endpoint increases with the increasing intensity of cars on the road. More number of vehicles means longer bottlenecks, thereby resulting in more time to reach the desired location as the vehicles’ average speed becomes low. Consequently, rather than only the distance information, we also account for the current time’s traffic information to compute the express distance between the source and its assigned destination.
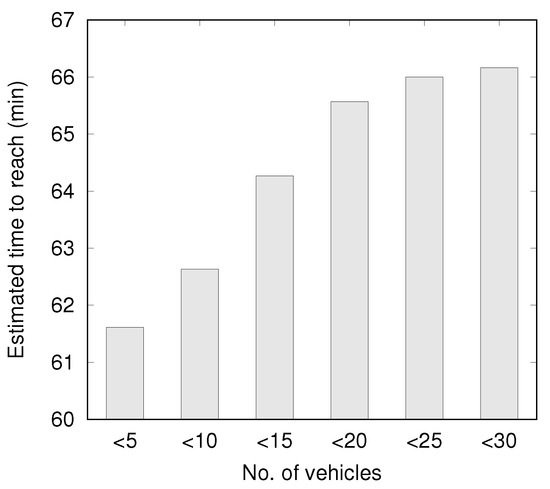
Figure 8.
Time estimation to reach a destination at distinct traffic intensity levels.
It can be noticed that, at times, the traffic intensity occasionally varies on the same road. Analysis of traffic scenarios throughout the various times of the day allows the authorities to develop a time-specific traffic management plan to manage traffic at particular times. The state of traffic intensity at one of Aarhus city roads for two specified locations with a distance of 500 m on various timings is presented in Figure 9. The figure shows that the typical traffic-intensive hours within the day to be early morning 8:00–9:30 and noontime 11:25–12:30. Some possible explanations for this scenario include the start of office and school hours in the morning and end time at noon for the schools. The proposed traffic management system can, therefore, assist in notifying the designated departments of the time when the intensity of the traffic increases on a particular road, at various instances during the day. Additionally, the proposed system also has the capability to assess traffic information in real-time for recognizing obstructions on the road. The average speed and the number of automobiles on a particular road help identify a roadblock. Roadblock is denoted by a high number of automobiles with low average speed. Road obstruction on one of the roads in Aarhus city is presented in Figure 10. The figure clearly exhibits that even when the number of cars is less, the average vehicular speed is also low. A series of noticeable roadblocks can be observed to be occurring on different weekdays in the morning times. This scenario is due to the hindrances caused by the ongoing road construction and morning time office rush hours. After small chunks of time, the current traffic situations are stored in the form of a graph and updated in real-time. The suggestion on the use of traffic information in real-time is based on the above-mentioned analysis. Smart decisions arising out of graph-development and various weight calculation mechanisms via existing graph algorithms help achieve smart transportation in the city.
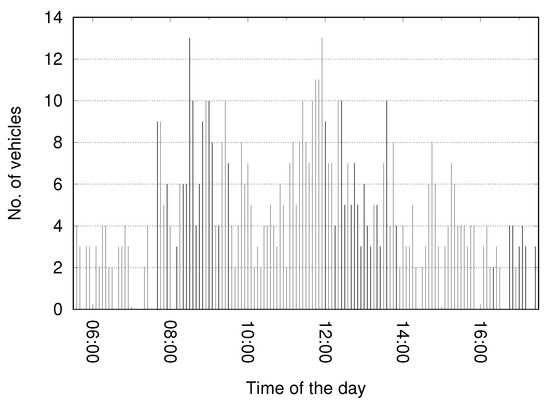
Figure 9.
The state of traffic intensity between two locations on various timings of the day.
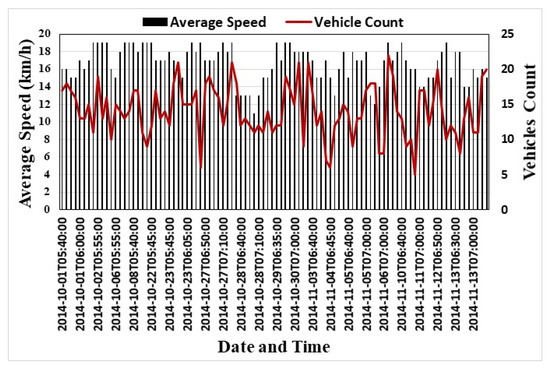
Figure 10.
The analysis road blockages on various time and date.
4. System Simulation and Evaluation
Since the proposed system involves the processing of large volume of datasets and graph processing, it is evaluated in terms of throughput and processing time.
4.1. Simulation Environment
The system is implemented on a Core TM i5 machine with a 3.2 GHz processor and a 8 GB RAM. Data are processed on both single and dual node Hadoop server along with Apache Spark GraphX for graph processing in Ubuntu 14.04 LTS operating system. The hardware and software configuration for the implementation of the system is also provided in Table 2. To evaluate the performance and efficiency of the proposed solution, comparison is made with a couple of systems, including (1) a dual node Hadoop cluster with traditional and (2) Apache Spark implemented on a single Hadoop data-node.
Table 2.
Hardware and software configurations of the system.
The system is tested in real-time by generating real-time traffic information and encapsulating it within the pcap packets provided by Wireshark libraries. The captured packets are transmitted towards the server, which processes the network packets and generates sequence files in Hadoop readable form using pcap-lib, Hadoop-pcap-serde, and Hadoop pcap input libraries. The resulting sequence files are processed by Hadoop and GraphX to generate graphs and analyze them to provide smart decisions for transportation. The dataset referred in Section 3 are used to perform the efficiency evaluation of the system.
4.2. Simulation Results
To show the major impact of algorithms processing large graphs and the performance of the proposed system, the efficiency for accomplishing smart transportation is evaluated in terms of throughput in Mbps (megabytes/sec) and response time. As represented in Figure 11a, it is observable that the upsurge in the dataset also led to an increase in the system’s throughput, maintaining a directly proportional relationship. We increased the dataset size in order to analyze the system’s proficiency in terms of throughput effectively and observed its effect on the system’s throughput. This is possible due to the Hadoop ecosystem’s ability to undertake parallel processing of large graphs. When a huge dataset is involved, the Hadoop system divides the data into segments and analyzes it simultaneously in parallel. As compared to other systems, throughput is relatively better for this dataset, i.e., 5345 MB. It is a significant accomplishment of the system that with the increasing dataset, the throughput (Mbps) also surges. In cases where the dataset is small, i.e., less than 100 MB, HDFS is not well suited to efficiently access a larger number of files with sizes less than its block size, mostly 128 MB. The performance of a single processor provides a constant throughput since it is unable to divide tasks for parallel execution. However, the architecture of Hadoop differs in a way that it follows parallelism at the lowest level, i.e., it divides the task parallel on the available multiple cores of the single processor. This ability of Hadoop is responsible for increasing the throughput even with an increase in the datasets. It is noticeable that the throughput level becomes constant when the computing capacity reaches maximum occupancy. It can be noted from Figure 11a,b that single node Apache Spark deployment provides better results for throughput and processing time when compared to dual node -based Hadoop implementation. This shows the strength of Apache Spark (GrpahX) deployment–even on a single datanode– as compare to traditional -based implementation. Using a single node Apache Spark deployment, the proposed system increased the throughput by 14.9% and decreased the processing time by 19.8%. Hence, by using Apache Spark, the system can be implemented on multiple single node that can save time and resources.
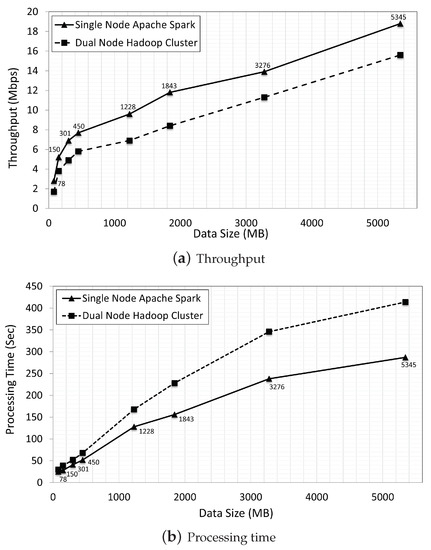
Figure 11.
The proposed system’s performance with varying data size.
The effect of processing time is also studied in terms of the graph size, since increasing datasets causes an increase in the number of nodes and edges in the graph. As represented in Figure 12a,b, we examined the system by intensifying the nodes and edges from 0 to 1000. While building the graph, a continuing increase in the processing time was observed, as when the number of edges and nodes was massively increased. On the contrary, the proposed system has a very fast processing time even for one hundred thousand nodes and edges, i.e., less than one thousand milliseconds. Hence, the processing results reasonably conclude that the system’s performance is adequate in real-time if Spark and GraphX are used in system development on the Hadoop ecosystem. The increase in processing time with the increasing dataset is expected. However, this increase in processing time is lower in comparison to other systems where the processing times are much higher.
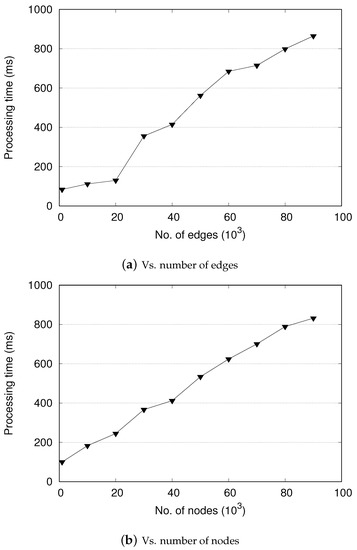
Figure 12.
Processing time for graph generation.
5. Conclusions
A commuter’s social life and the country’s economy are significantly influenced by smart transportation. In this paper, a prospective proposed system centered on state-of-the-art big data and graph generation technology and its parallel processing is suggested. To accomplish smart transportation, the graph-oriented approach is adopted, as the graph denotes transportation infrastructure effectively. The data analyzed for vehicular traffic is accessed online from different world cities, including Denmark, Spain, and Germany. To powerfully process big data collected from vehicular traffic, the recommended system is divided into various layers. The system is implemented on a single and dual node Hadoop and Spark setup server environment. To achieve real-time efficiency, Spark Streaming and Spark with GraphX tool is used to process large graphs. The results conclude that the overall system’s efficiency can be intensely made effective by integrating Spark GraphX and the Hadoop ecosystem.
Author Contributions
Conceptualization and methodology, M.M.R., S.A.S. and A.P.; software, M.M.R. and S.A.S.; validation, D.S. and A.P.; formal analysis, M.M.R., S.A.S. and A.P.; investigation and data curation, M.M.R. and S.V.; writing—original draft preparation, M.M.R. and S.A.S.; writing—review and editing, M.M.R. and A.A.; visualization, D.S.; supervision, A.P. and A.A.; project administration, A.P. and A.A.; funding acquisition, S.A.S. and A.A. All authors have read and agreed to the published version of the manuscript.
Funding
This work is also solely supported by the European Regional Development Funds via the Mobilitas Plus programme (grant MOBTT75).
Institutional Review Board Statement
Not applicable.
Informed Consent Statement
Not applicable.
Data Availability Statement
Not applicable.
Conflicts of Interest
The authors declare no conflict of interest.
References
- Cisco. White Paper: Cisco Annual Internet Report (2018–2023). 2020. Available online: https://www.cisco.com/c/en/us/solutions/collateral/executive-perspectives/annual-internet-report/white-paper-c11-741490.html (accessed on 4 July 2021).
- Stratigea, A.; Papadopoulou, C.A.; Panagiotopoulou, M. Tools and technologies for planning the development of smart cities. J. Urban Technol. 2015, 22, 43–62. [Google Scholar] [CrossRef]
- Rathore, M.M.; Ahmad, A.; Paul, A.; Rho, S. Urban planning and building smart cities based on the internet of things using big data analytics. Comput. Netw. 2016, 101, 63–80. [Google Scholar] [CrossRef]
- Srivastava, L. Japan’s ubiquitous mobile information society. Info 2004, 6, 234–251. [Google Scholar] [CrossRef]
- Tao, F.; Qi, Q. New IT driven service-oriented smart manufacturing: Framework and characteristics. IEEE Trans. Syst. Man Cybern. Syst. 2017, 49, 81–91. [Google Scholar] [CrossRef]
- Streitz, N.; Charitos, D.; Kaptein, M.; Böhlen, M. Grand challenges for ambient intelligence and implications for design contexts and smart societies. J. Ambient. Intell. Smart Environ. 2019, 11, 87–107. [Google Scholar] [CrossRef] [Green Version]
- Zeng, D.; Guo, S.; Cheng, Z. The Web of Things: A Survey. J. Commun. 2011, 6, 424–438. [Google Scholar] [CrossRef] [Green Version]
- Guan, S.; Yun, J.; Zhang, Q.; Aurora, A. Intelligent transportation system contributions to the operating efficiency of Urban traffic. J. Intell. Fuzzy Syst. 2016, 31, 2213–2220. [Google Scholar] [CrossRef]
- Saggi, M.K.; Jain, S. A survey towards an integration of big data analytics to big insights for value-creation. Inf. Process. Manag. 2018, 54, 758–790. [Google Scholar] [CrossRef]
- Shah, S.A.; Seker, D.Z.; Hameed, S.; Draheim, D. The rising role of big data analytics and IoT in disaster management: Recent advances, taxonomy and prospects. IEEE Access 2019, 7, 54595–54614. [Google Scholar] [CrossRef]
- Fiore, S.; Elia, D.; Pires, C.E.; Mestre, D.G.; Cappiello, C.; Vitali, M.; Andrade, N.; Braz, T.; Lezzi, D.; Moraes, R.; et al. An integrated big and fast data analytics platform for smart urban transportation management. IEEE Access 2019, 7, 117652–117677. [Google Scholar] [CrossRef]
- Chen, J.; Liu, H. Intelligent traffic control system based on open IoT and machine learning. J. Intell. Fuzzy Syst. 2021, 1–12. [Google Scholar] [CrossRef]
- Nathali Silva, B.; Khan, M.; Han, K. Big data analytics embedded smart city architecture for performance enhancement through real-time data processing and decision-making. Wirel. Commun. Mob. Comput. 2017, 2017, 9429676. [Google Scholar] [CrossRef] [Green Version]
- Ahmad, A.; Paul, A.; Rathore, M.M.; Chang, H. Smart cyber society: Integration of capillary devices with high usability based on Cyber–Physical System. Future Gener. Comput. Syst. 2016, 56, 493–503. [Google Scholar] [CrossRef]
- Shah, S.A.; Seker, D.Z.; Rathore, M.M.; Hameed, S.; Yahia, S.B.; Draheim, D. Towards disaster resilient smart cities: Can internet of things and big data analytics be the game changers? IEEE Access 2019, 7, 91885–91903. [Google Scholar] [CrossRef]
- Ahmad, A.; Rathore, M.M.U.; Paul, A. Integration of Capillary Devices in the Smart Society based on Web of Things. In Proceedings of the 3rd International Conference on Human-Agent Interaction, Daegu, Korea, 21 October 2015; pp. 269–272. [Google Scholar]
- Jin, J.; Gubbi, J.; Marusic, S.; Palaniswami, M. An information framework for creating a smart city through internet of things. IEEE Internet Things J. 2014, 1, 112–121. [Google Scholar] [CrossRef]
- Van Lint, J. Online learning solutions for freeway travel time prediction. IEEE Trans. Intell. Transp. Syst. 2008, 9, 38–47. [Google Scholar] [CrossRef]
- Van Lint, J. Reliable real-time framework for short-term freeway travel time prediction. J. Transp. Eng. 2006, 132, 921–932. [Google Scholar] [CrossRef]
- Van Lint, J.; Hoogendoorn, S.; van Zuylen, H.J. Accurate freeway travel time prediction with state-space neural networks under missing data. Transp. Res. Part Emerg. Technol. 2005, 13, 347–369. [Google Scholar] [CrossRef]
- Lin, W.H.; Liu, H. Enhancing realism in modeling merge junctions in analytical models for system-optimal dynamic traffic assignment. IEEE Trans. Intell. Transp. Syst. 2010, 11, 838–845. [Google Scholar] [CrossRef]
- Zhao, L.; Peng, X.; Li, L.; Li, Z. A fast signal timing algorithm for individual oversaturated intersections. IEEE Trans. Intell. Transp. Syst. 2010, 12, 280–283. [Google Scholar] [CrossRef]
- Mulder, M.; Abbink, D.A.; Van Paassen, M.M.; Mulder, M. Design of a haptic gas pedal for active car-following support. IEEE Trans. Intell. Transp. Syst. 2010, 12, 268–279. [Google Scholar] [CrossRef]
- Shieh, W.Y.; Hsu, C.C.; Tung, S.L.; Lu, P.W.; Wang, T.H.; Chang, S.L. Design of infrared electronic-toll-collection systems with extended communication areas and performance of data transmission. IEEE Trans. Intell. Transp. Syst. 2010, 12, 25–35. [Google Scholar] [CrossRef]
- Alonso-Ayuso, A.; Escudero, L.F.; Martín-Campo, F.J. Collision avoidance in air traffic management: A mixed-integer linear optimization approach. IEEE Trans. Intell. Transp. Syst. 2010, 12, 47–57. [Google Scholar] [CrossRef]
- Přibyl, O. Transportation, intelligent or smart? On the usage of entropy as an objective function. In Proceedings of the 2015 Smart Cities Symposium Prague (SCSP), Prague, Czech Republic, 24–25 June 2015; pp. 1–5. [Google Scholar]
- Zhu, F.; Li, Z.; Chen, S.; Xiong, G. Parallel transportation management and control system and its applications in building smart cities. IEEE Trans. Intell. Transp. Syst. 2016, 17, 1576–1585. [Google Scholar] [CrossRef]
- Ding, Z.; Yang, B.; Chi, Y.; Guo, L. Enabling smart transportation systems: A parallel spatio-temporal database approach. IEEE Trans. Comput. 2015, 65, 1377–1391. [Google Scholar] [CrossRef]
- Ahmad, I.; Alroobaea, R.; Raza, M.A.; Khalid, S.; Ahmed, Z.; Ali, I. Architecture for Resource Allocation in the Internet of Vehicles for Cooperating Driving System. J. Adv. Transp. 2021, 2021, 6637568. [Google Scholar]
- Ahmad, I.; Noor, R.M.; Zaba, M.R.; Qureshi, M.A.; Imran, M.; Shoaib, M. A cooperative heterogeneous vehicular clustering mechanism for road traffic management. Int. J. Parallel Program. 2020, 48, 870–889. [Google Scholar] [CrossRef]
- Feki, S.; Belghith, A.; Zarai, F. Ant Colony Optimization-based Resource Allocation and Resource Sharing Scheme for V2V Communication. J. Inf. Sci. Eng. 2019, 35, 507–519. [Google Scholar]
- Balasubramaniam, A.; Paul, A.; Hong, W.H.; Seo, H.; Kim, J.H. Comparative analysis of intelligent transportation systems for sustainable environment in smart cities. Sustainability 2017, 9, 1120. [Google Scholar] [CrossRef] [Green Version]
- Gupta, A.; Gupta, H.P.; Biswas, B.; Dutta, T. An early classification approach for multivariate time series of on-vehicle sensors in transportation. IEEE Trans. Intell. Transp. Syst. 2020, 21, 5316–5327. [Google Scholar] [CrossRef]
- Ahmad, I.; Md Noor, R.; Alroobaea, R.; Talha, M.; Ahmed, Z.; Habiba, U.E.; Ali, I. Aiding Traffic Prediction Servers through Self-Localization to Increase Stability in Complex Vehicular Clustering. Complexity 2021, 2021, 6627539. [Google Scholar] [CrossRef]
- Ramakrishnan, B.; Nishanth, R.B.; Joe, M.M.; Selvi, M. Cluster based emergency message broadcasting technique for vehicular ad hoc network. Wirel. Netw. 2017, 23, 233–248. [Google Scholar] [CrossRef]
- Ahmad, I.; Noor, R.M.; Ali, I.; Qureshi, M.A. The role of vehicular cloud computing in road traffic management: A survey. In Proceedings of the International Conference on Future Intelligent Vehicular Technologies, Porto, Portugal, 15 September 2016; Springer: Berlin/Heidelberg, Germany, 2016; pp. 123–131. [Google Scholar]
- Rathore, M.M.; Paul, A.; Rho, S.; Khan, M.; Vimal, S.; Shah, S.A. Smart traffic control: Identifying driving-violations using fog devices with vehicular cameras in smart cities. Sustain. Cities Soc. 2021, 71, 102986. [Google Scholar] [CrossRef]
- Kashef, M.; Liu, Y.; Montgomery, K.; Candell, R. Wireless Cyber-Physical System Performance Evaluation Through a Graph Database Approach. J. Comput. Inf. Sci. Eng. 2021, 21, 021009. [Google Scholar] [CrossRef] [PubMed]
- Bischof, S.; Karapantelakis, A.; Nechifor, C.S.; Sheth, A.P.; Mileo, A.; Barnaghi, P. Semantic modelling of Smart City Data. Position Paper in W3C Workshop on the Web of Things: Enablers and Services for an Open Web of Devices. 2014. Available online: https://www.w3.org/2014/02/wot/papers/karapantelakis.pdf (accessed on 4 July 2021).
- Tönjes, R.; Barnaghi, P.; Ali, M.; Mileo, A.; Hauswirth, M.; Ganz, F.; Ganea, S.; Kjærgaard, B.; Kuemper, D.; Nechifor, S.; et al. Real time iot stream processing and large-scale data analytics for smart city applications. In Proceedings of the Poster Session, European Conference on Networks and Communications, Berlin, Germany, 25–26 June 2014. [Google Scholar]
- Kolozali, S.; Bermudez-Edo, M.; Puschmann, D.; Ganz, F.; Barnaghi, P. A knowledge-based approach for real-time iot data stream annotation and processing. In Proceedings of the 2014 IEEE International Conference on Internet of Things (iThings), and IEEE Green Computing and Communications (GreenCom) and IEEE Cyber, Physical and Social Computing (CPSCom), Taipei, Taiwan, 1–3 September 2014; pp. 215–222. [Google Scholar]
- Gramaglia, M.; Trullols-Cruces, O.; Naboulsi, D.; Fiore, M.; Calderon, M. Vehicular networks on two Madrid highways. In Proceedings of the 2014 Eleventh Annual IEEE International Conference on Sensing, Communication, and Networking (SECON), Singapore, 30 June–3 July 2014; pp. 423–431. [Google Scholar]
- Uppoor, S.; Trullols-Cruces, O.; Fiore, M.; Barcelo-Ordinas, J.M. Generation and analysis of a large-scale urban vehicular mobility dataset. IEEE Trans. Mob. Comput. 2013, 13, 1061–1075. [Google Scholar] [CrossRef] [Green Version]
Short Biography of Authors
 | Muhammad Mazhar Ullah Rathore received their Ph.D. degree in Computer Science and Engineering from Kyungpook National University, South Korea, in 2018, and their Master’s degree in Computer and Communication Security from the National University of Sciences and Technology, Pakistan, in 2012. Currently, he is working as a post-doctorate researcher at the College of Science and Engineering, Hamad Bin Khalifa University, Qatar. His research interests include Big Data Analytics, Internet of Things, Smart Systems, Network Traffic Analysis and Monitoring, Remote Sensing, Smart City, Urban Planning, Intrusion Detection, and Information Security and Privacy. He is an IEEE and ACM professional member. He received the best project/paper award in the 2016 Qualcomm Innovation Award at Kyungpook National University, Korea, for their paper “IoT-Based Smart City Development using Big Data Analytical Approach”. He was also a nominee for the Best Project Award in the 2015 IEEE Communications Society Student Competition, for their project “IoT based Smart City”. He is serving frequently as a reviewer for various IEEE, ACM, Springer, and Elsevier journals. |
 | Syed Attique Shah received the Ph.D. degree from the Institute of Informatics, Istanbul Technical University, Istanbul Turkey. During their Ph.D., he studied as a Visiting Scholar with the National Chiao Tung University, Taiwan, University of Tokyo, Japan, and Tallinn University of Technology, Estonia, where he completed the major content of their thesis. He worked as Assistant Professor and Chairperson at the Department of Computer Science, BUITEMS, Quetta, Pakistan. He is engaged as a Lecturer at the Data Systems Group, Institute of Computer Science, University of Tartu, Estonia. His research interests include big data analytics, Internet of Things, and information management and security. |
 | Ahmed Awad is a professor of Big Data at the institute of computer science, university of Tartu Estonia. Formerly, Dr. Awad was an associate professor of Information Systems at the faculty of computers and artificial intelligence, Cairo university, Egypt. He is also an adjunct professor with the school of information technology and computer science, Nile university, Egypt. Ahmed got their PhD from Hasso-Plattner institute, Potsdam University, Germany on 2010. Before that, he got their B.Sc. and M.Sc. degrees from Cairo University on 2000 and 2003, respectively. Ahmed’s research interests are in big streams processing, complex event processing, online machine learning, edge-computing and applications thereof, especially in business process management. Dr. Awad has more than 60 publications in international journals, conferences and workshops. |
 | Dhirendra Shukla is Professor and the Dr J Herbert Smith ACOA Chair in Technology Management and Entrepreneurship at the University of New Brunswick (UNB), Canada. Dhirendra utilizes their expertise from the telecom sector and extensive academic background in the areas of entrepreneurial finance, masters of business administration, and engineering, to promote a bright future for New Brunswick. Recognition of their tireless efforts and vision are demonstrated through UNB’s 2014 award from Startup Canada as “Most Entrepreneurial Post-Secondary Institution of the Year”, their nomination as a finalist for Industry Champion by KIRA, and their nomination as a finalist for Progress Media’s Innovation in Practice award. Dhirendra was nominated for the RBC Top 25 Canadian Immigrant Award and selected by a panel of judges as a Top 75 finalist. Most recently, he received the Entrepreneur Promotion Award by Startup Canada (2017), as well as the Outstanding Educator Award by the Association of Professional Engineers and Geoscientists of New Brunswick in 2018. |
 | Dr. S. Vimal is working in Department of Computer Science and Engineering, Ramco Institute of Technology, Tamilnadu, India. He has around Fourteen years of teaching experience, EMC certified Data science Associate and CCNA certified professional too. He holds a Ph.D in Information and Communication Engineering from Anna University Chennai and he received Masters Degree from Anna University Coimbatore. He is a member of various professional bodies and organized various funded workshops and seminars. He has wide publications in the highly impact journals in the area of Data Analytics, Networking and Security issues and published 04 book chapters. He has hosted two special session for IEEE sponsored conference in Osaka, Japan and Thailand. He has acted as Session chairs, organizing committee member, advisory committee and outreach committee member in various international conferences in IEEE and Other prestiguos Conferences. His areas of interest include Game Modelling, Artificial Intelligence, Cognitive radio networks, Network security, Machine Learning and Big data Analytics. He is a Senior member in IEEE and holds membership in various professional bodies. He has served as reviewer for Springer, Elsevier and Wiley journals. He has hosted 21 special issues in Elsevier, Springer and CMC tech science journals. He has served as Guest editor for SCI journals and editored 3 books in scopus indexed. He is a Senior Member in IEEE and IEEE Brand Ambassador. He has 2 australian patent, 1 korean patent and 1 indian patent. |
 | Anand Paul received the Ph.D. degree in electrical engineering from the National Cheng Kung University, Tainan, Taiwan, in 2010. He is currently working as an Associate Professor with the School of Computer Science and Engineering, Kyungpook National University, Daegu, Korea. He is a delegate representing Korea for M2M focus group and for MPEG. His research interests include algorithm and architecture re- configurable embedded computing. Prof. Paul has Guest Edited various international journals and he is also part of Editorial Team for Journal of Platform Technology and Cyber Physical Systems. He serves as a Reviewer for various IEEE/IET journals. He is the track Chair for smart human computer interaction in ACMSAC 2015, 2014. He was the recipient of the Outstanding International Student Scholarship Award in 20042010, the Best Paper Award in National Computer Symposium, Taipei, Taiwan, in 2009, and UWSS 2015, in Beijing, China. He is also IEEE Senior Member. |
Publisher’s Note: MDPI stays neutral with regard to jurisdictional claims in published maps and institutional affiliations. |
© 2021 by the authors. Licensee MDPI, Basel, Switzerland. This article is an open access article distributed under the terms and conditions of the Creative Commons Attribution (CC BY) license (https://creativecommons.org/licenses/by/4.0/).