
Assessing Impact, Performance and Sustainability Potential of Smart City Projects: Towards a Case Agnostic Evaluation Framework

 , , , and
Abstract
:1. Introduction and Motivation
- What are the main frameworks used to evaluate cities in terms of sustainability and smartness and which are their attributes and shortcomings?
- How a SCC project can evaluate its performance against pre-defined targets?
- How a SCC project can holistically evaluate its contribution and impact towards the sustainable goals of a city?
- How results achieved by each smart city can be comparable against other ones, on a common basis, accounting though that for each city there are specificities
- How can one evaluate in a fair and transparent way multiple SCC projects, as well as cities as whole promoting comparability and replication potential?
2. Review of Urban Sustainability and Smartness Evaluation Frameworks and Indices
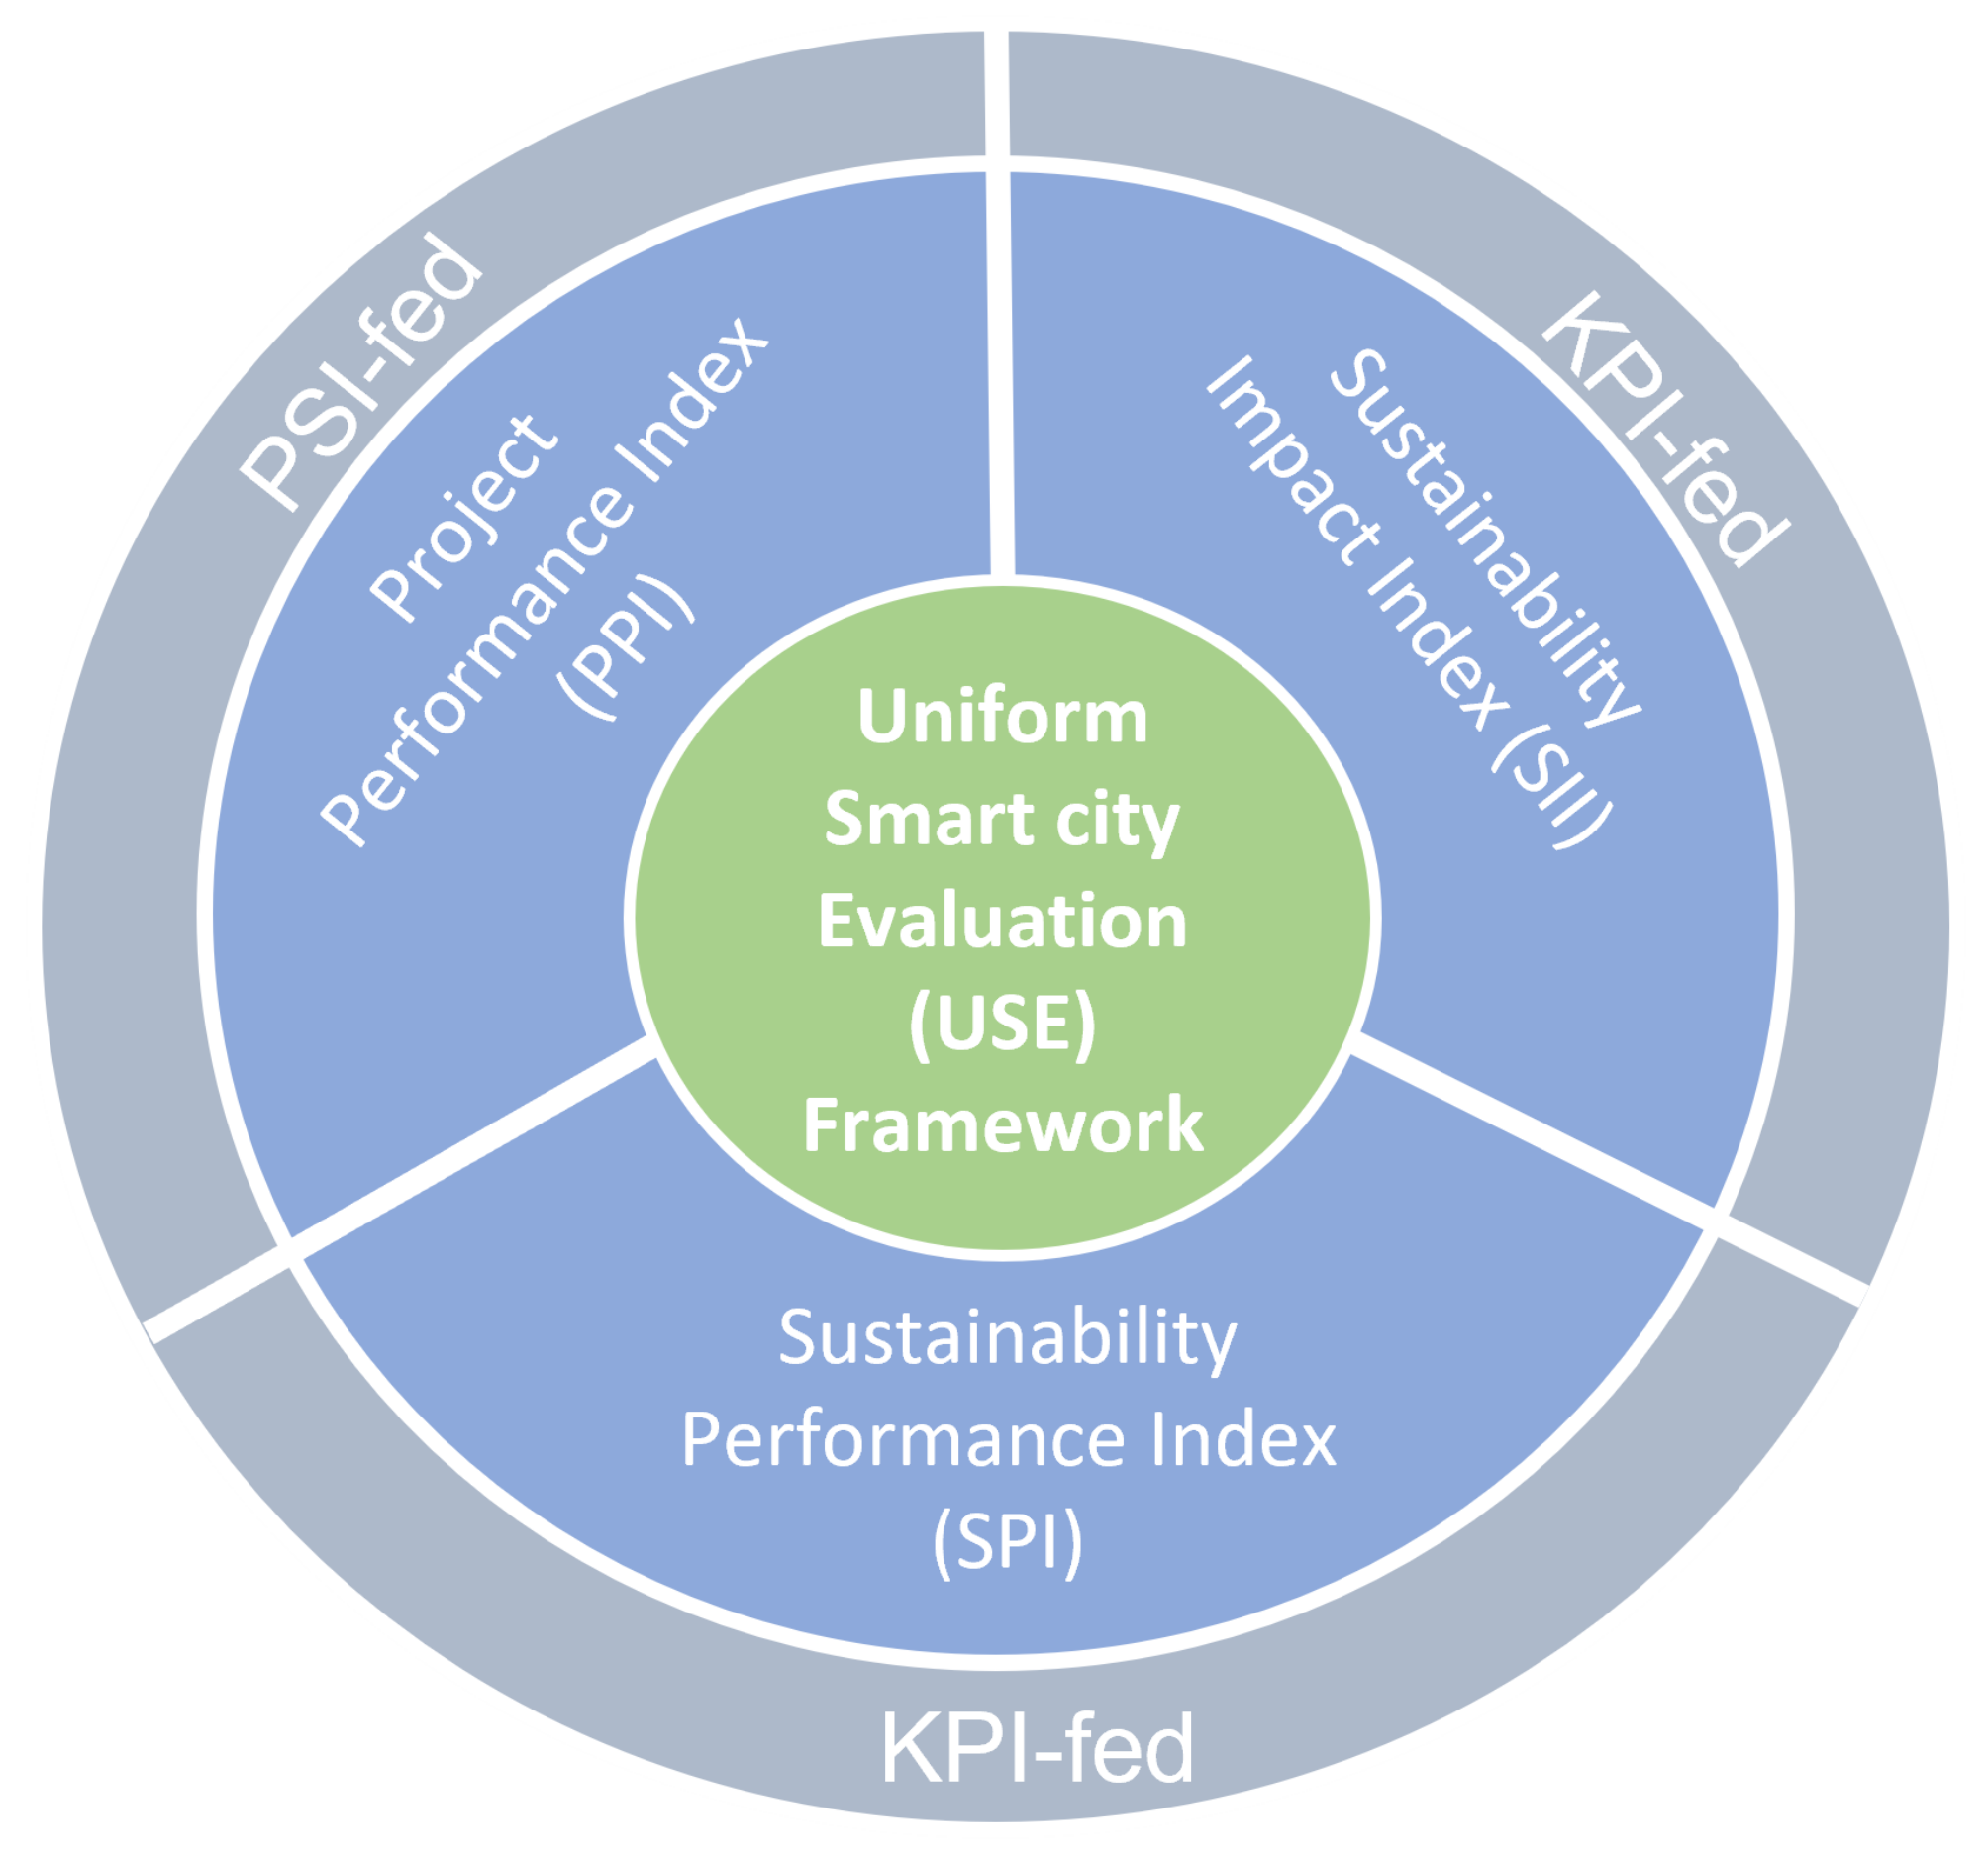
3. The Uniform Smart City Evaluation (USE) Framework—A Common Framework for SCC Projects and Cities
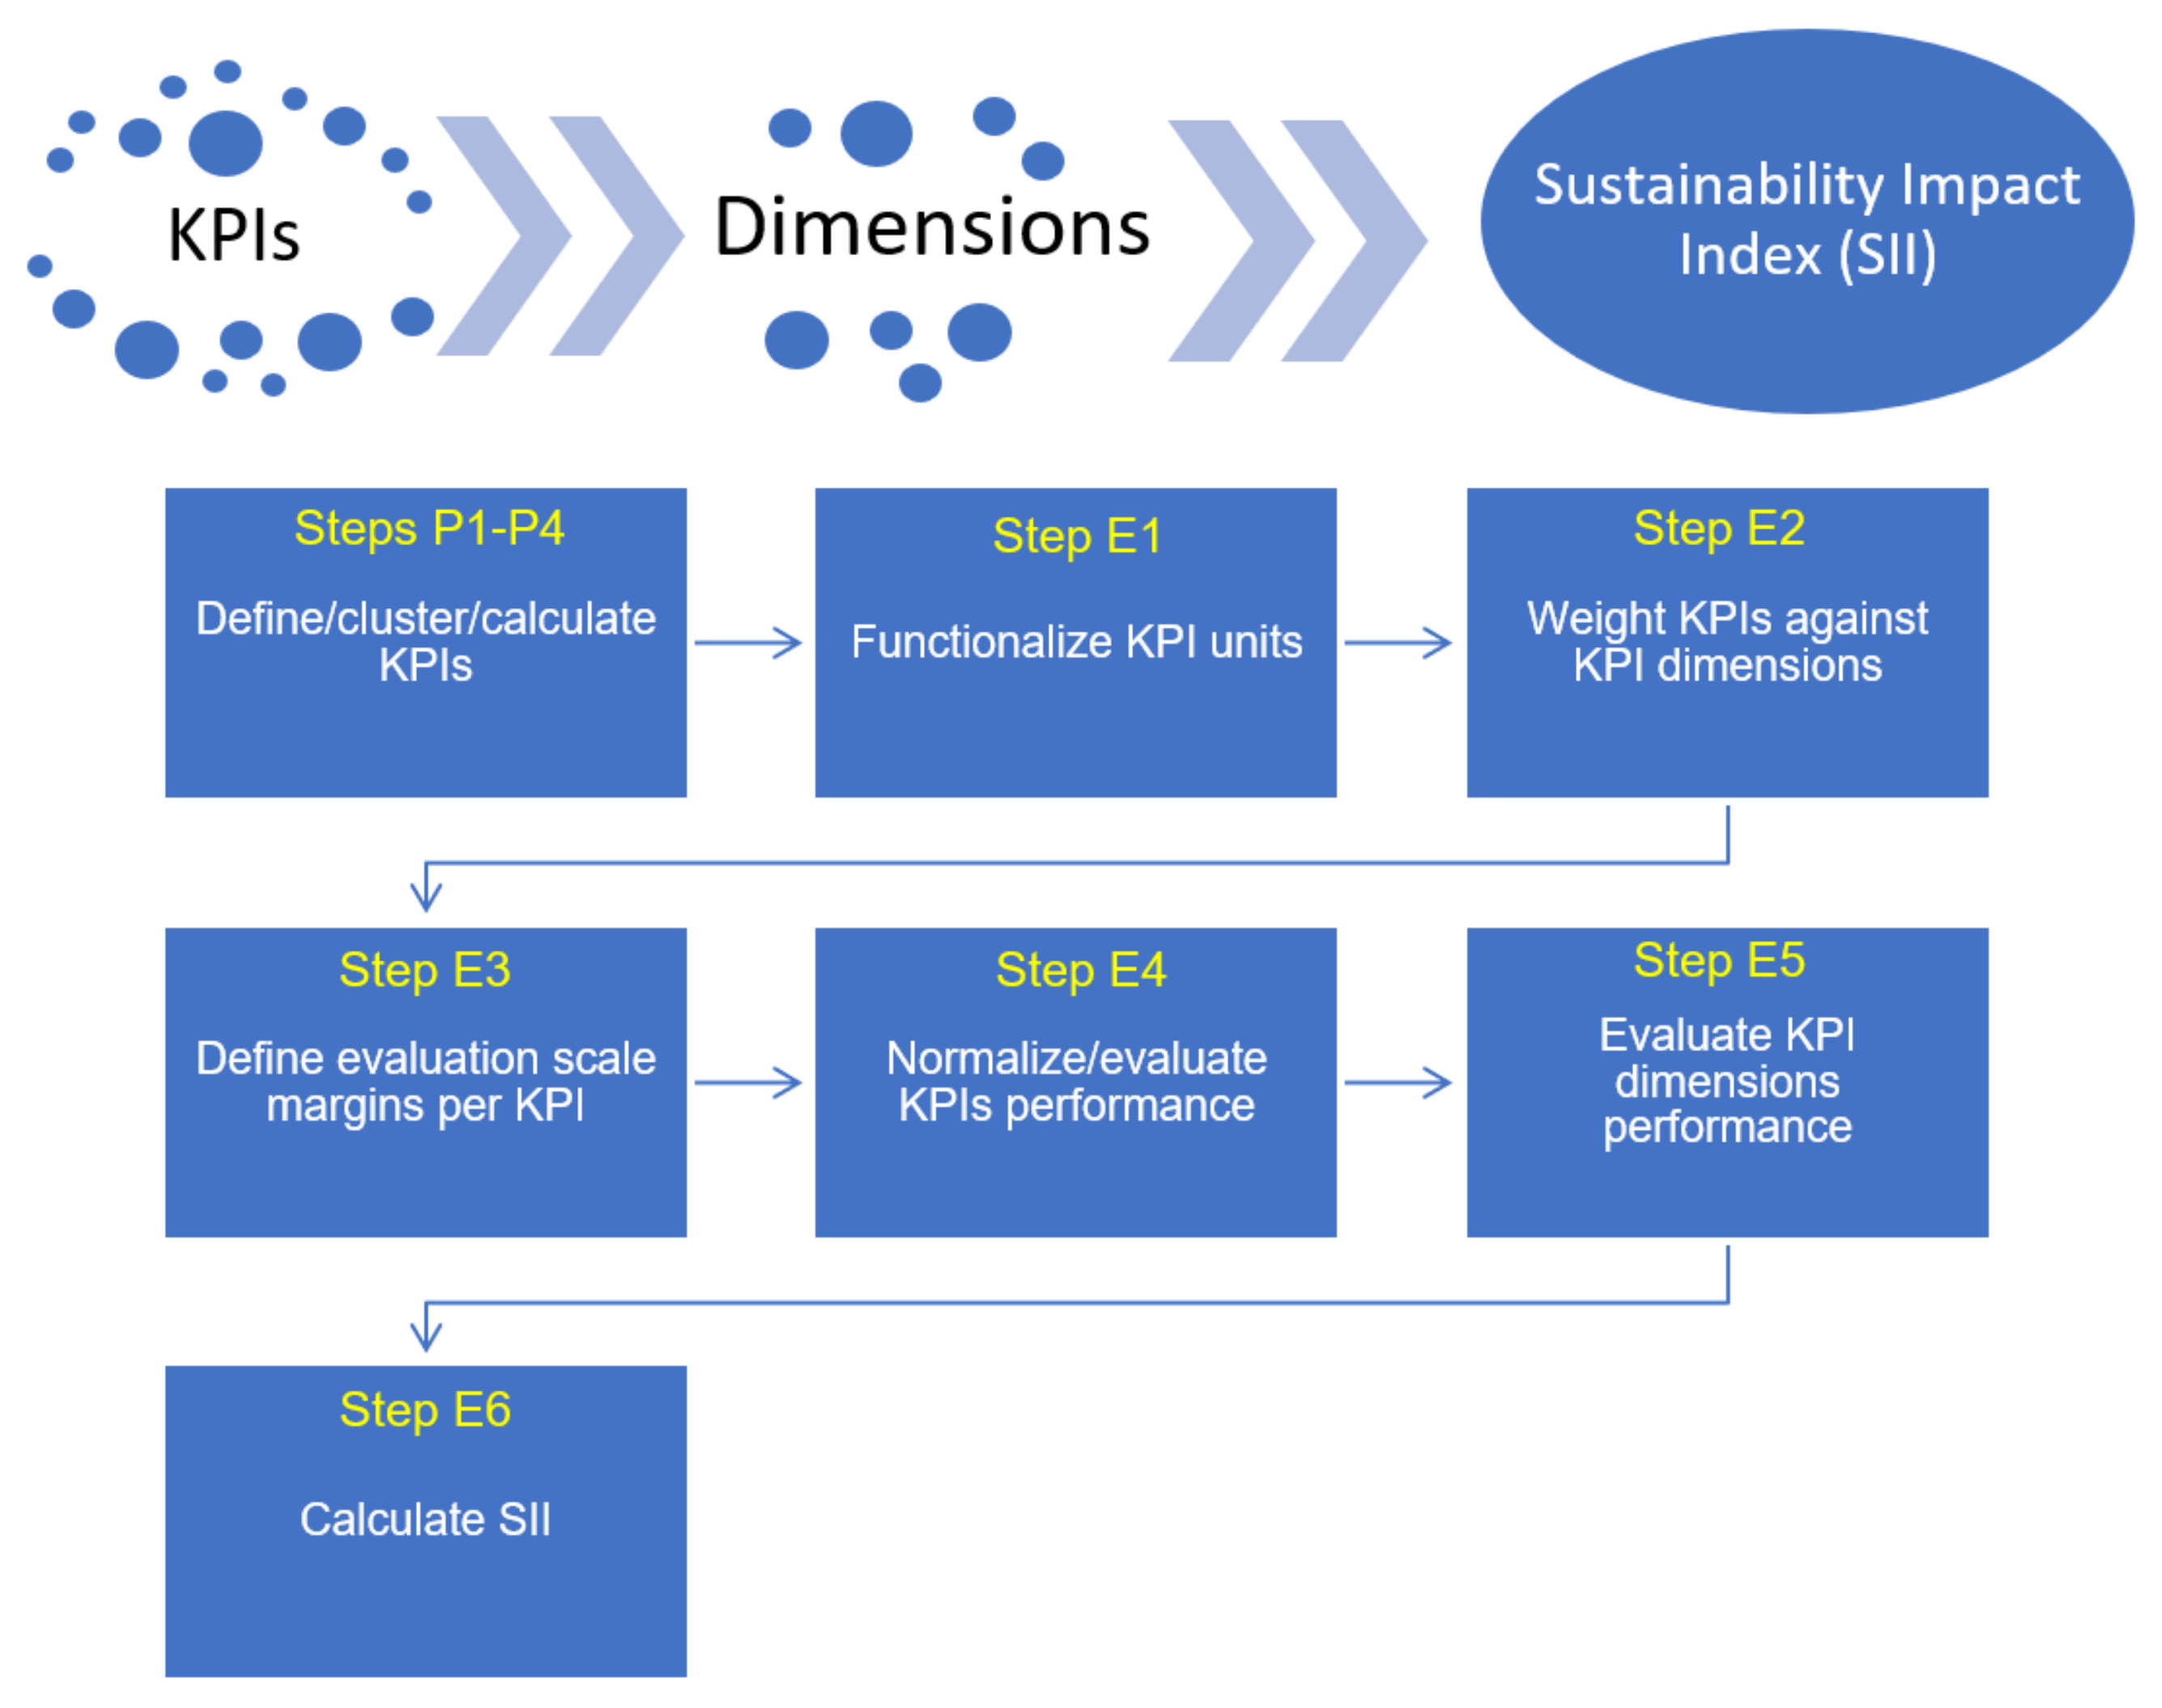
- The SSI is based on all the key performance indicators (KPI) defined in a SCC project in contrast to the PPI which incorporates only the (limited in number) PSIs. The KPIs are commonly linked to different dimensions (also called domains or categories depending on the project) such as energy, economic, social, ICT, mobility, etc. The SSI can thus assess the multi-dimensional performance of the project providing an inclusive evaluation while also providing the possibility of sub-indexing per project’s KPI dimension;
- Each KPI target value is defined based on sustainability goals as proposed by national or international goals and policies/best available practices;
- The KPIs are assessed against actual baseline values (monitored before the project’s start) and can, thus, directly showcase the progress of a city compared to the business as usual (BaU) scenario.
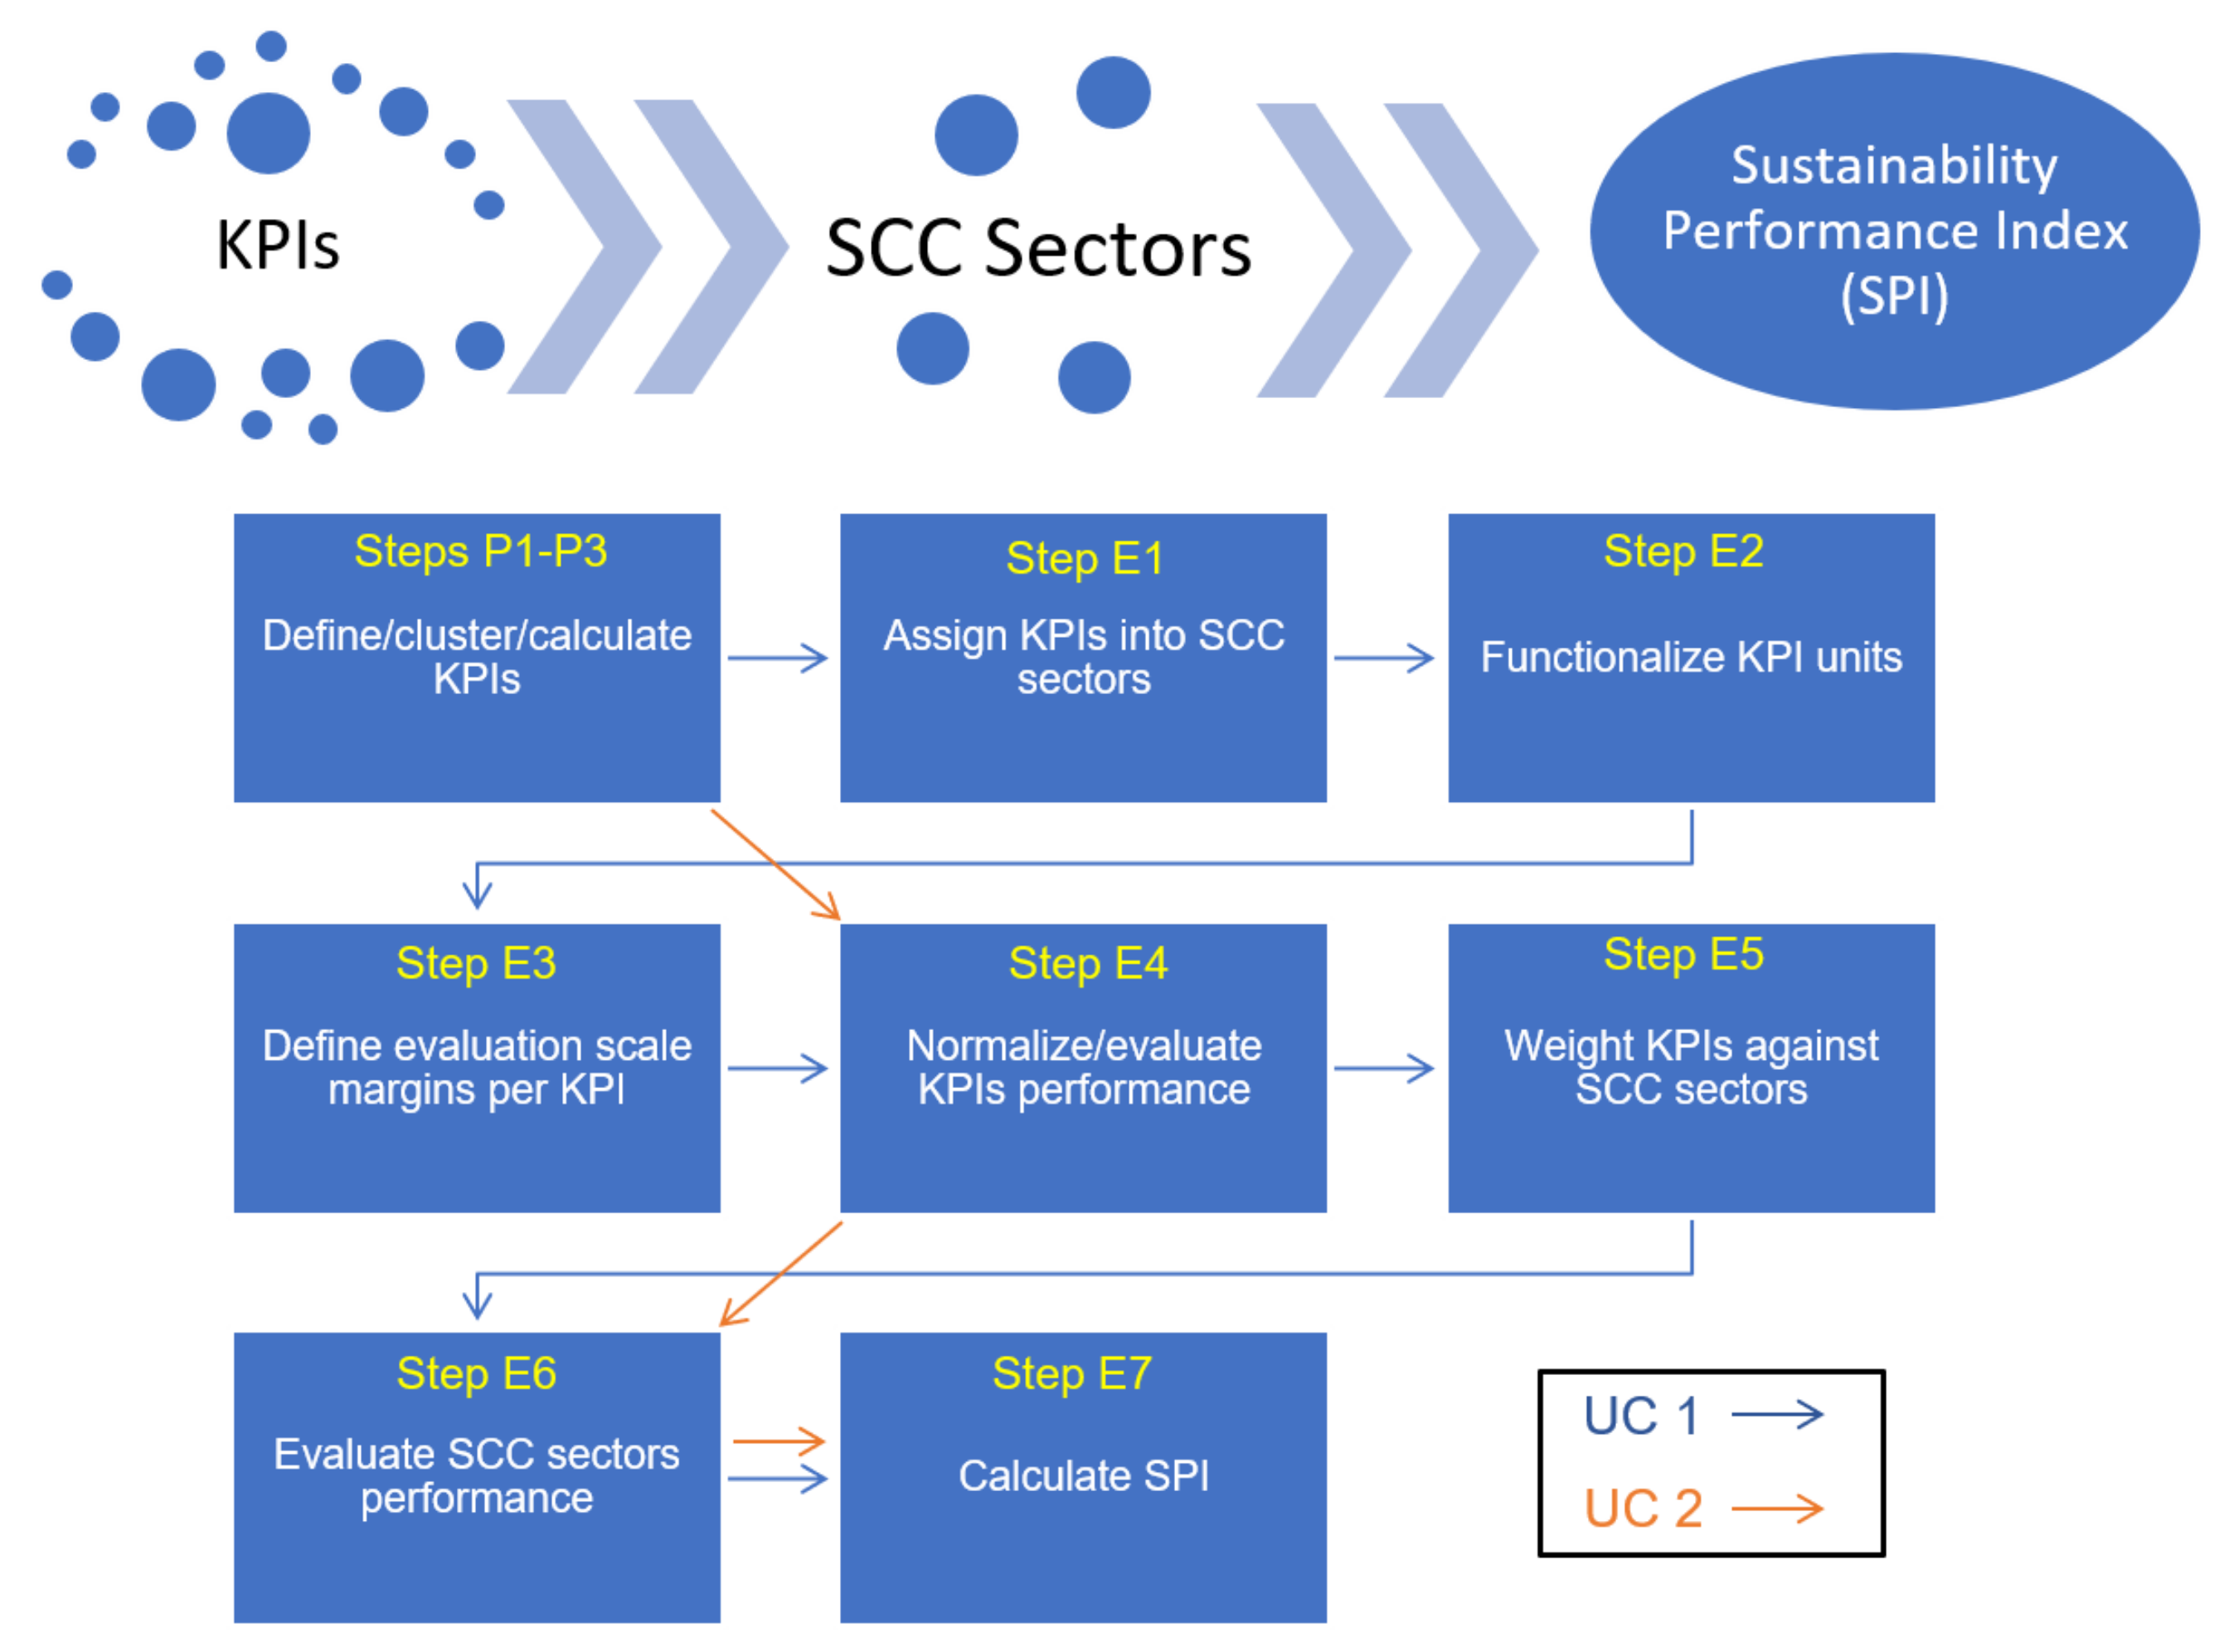
- UC1: The first use-case deals with on-going SCC projects that are currently in the development-implementation-evaluation phase and have already identified the necessary KPIs to be monitored. Herein, the SPI aims to provide a cross-dimensional evaluation under four pre-defined overarching sectors. Each sector (see Section 5.3 for more details on the definition of each sector) encompasses the most important KPIs of the project extracted from all the KPI dimensions. In contrast to the SII which clusters the KPIs under each dimension, this clustering allows for a more holistic but also targeted evaluation of each project’s results into the specific sectors of interest, leading to a cross-dimensional evaluation. For example, consider again a SCC project which focuses on e-mobility. It is straight-forward to conclude that this particular project aims to achieve impact in terms of sustainable urban transport (e.g., EV integration and adoption, car sharing schemes) urban infrastructure (e.g., EV chargers, V2G technology), climate change (e.g., reducing urban transport related emissions) in addition to any socio-economic benefits for the districts or cities of application. The categorization and evaluation including all project’s KPIs and under KPI dimensions (as performed by the SII) although extremely important, might not be easily interpreted by the citizens and city authorities: KPIs can be quite technical depending on the particular focus of the project (e.g., a KPI on battery degradation rate is an important aspect for any EV charging system), hindering a straight-forward and layman-oriented understanding of the project’s impact to the overall sustainability of the area. Moreover, KPI dimensions are not inclusive per-se, in the sense that each dimension is well-defined and not overlapping with the rest of dimensions (and associated KPIs). Despite the fact that in the end SII provides an averaged evaluation of all dimensions (“multi-dimensional evaluation”), it is essential to integrate the project’s results in a categorization that reflects cross-dimensional aspects. To this respect, the SPI and its clustering to overarching, easily interpreted, cross-dimensional sectors provide the necessary flexibility and inclusivity reflecting the project’s performance versus the city’s needs.
- UC2: The second use-case pertains to future SCC projects which have the flexibility in adopting their KPIs at a later stage. The necessity for the SPI under this use-case comes directly from the fact that SCC projects are extremely wide in scope. A small or large-scale city project can focus on energy related matters, such as building renovations, RES penetration, and grid flexibility, while another can only touch aspects related to mobility and district level storage. The KPIs along with their dimensions defined for each of these projects are targeted to their specific interventions and the evaluation results of each project cannot be fairly compared (comparing the SII of project A to the SII of project B is unfair as their scope is different). In addition, even if the projects’ scope is similar, such a comparison lacks a common framework that includes all aspects in which a city needs to progress in order to meet its sustainability goals. These aspects are rarely limited to energy or e-mobility related matters. Leveraging the UN’s sustainable development goals, it is easy to conclude that a real smart city is (at least) energy efficient, clean, safe, just, citizen-centric, culturally rich, healthy, and self-sufficient. Therefore, it is essential to provide an evaluation of a specific project against universal, all-inclusive, overarching sectors on a higher hierarchical level than the level of KPI dimensions (which are pre-defined for each project). These sectors should be widely acclaimed and should ideally include a multitude of common KPIs belonging to multiple dimensions and covering all aspects of a smart city. The SPI then provides an index that can be used to compare reliably projects with different or similar focus under the same umbrella, while each sector is linked to relevant sub-indices for a more targeted assessment. The cross-dimensional nature of the SPI provides increased interest for a city, being able to assess self-consistently its overall performance and initiate targeted projects to progress further on. As noted in Section 2, the definition of a common KPI repository per pre-defined SCC sector is a matter of high-level institutional and international decision-making and thus such definition is outside the scope of this work. Nevertheless, once a consensus is reached on the common KPIs, the implementation of our proposed framework is straight-forward as described in Section 5.3.
4. Necessary Methods and Tools Pertaining to All Axes
4.1. Unit Normalization
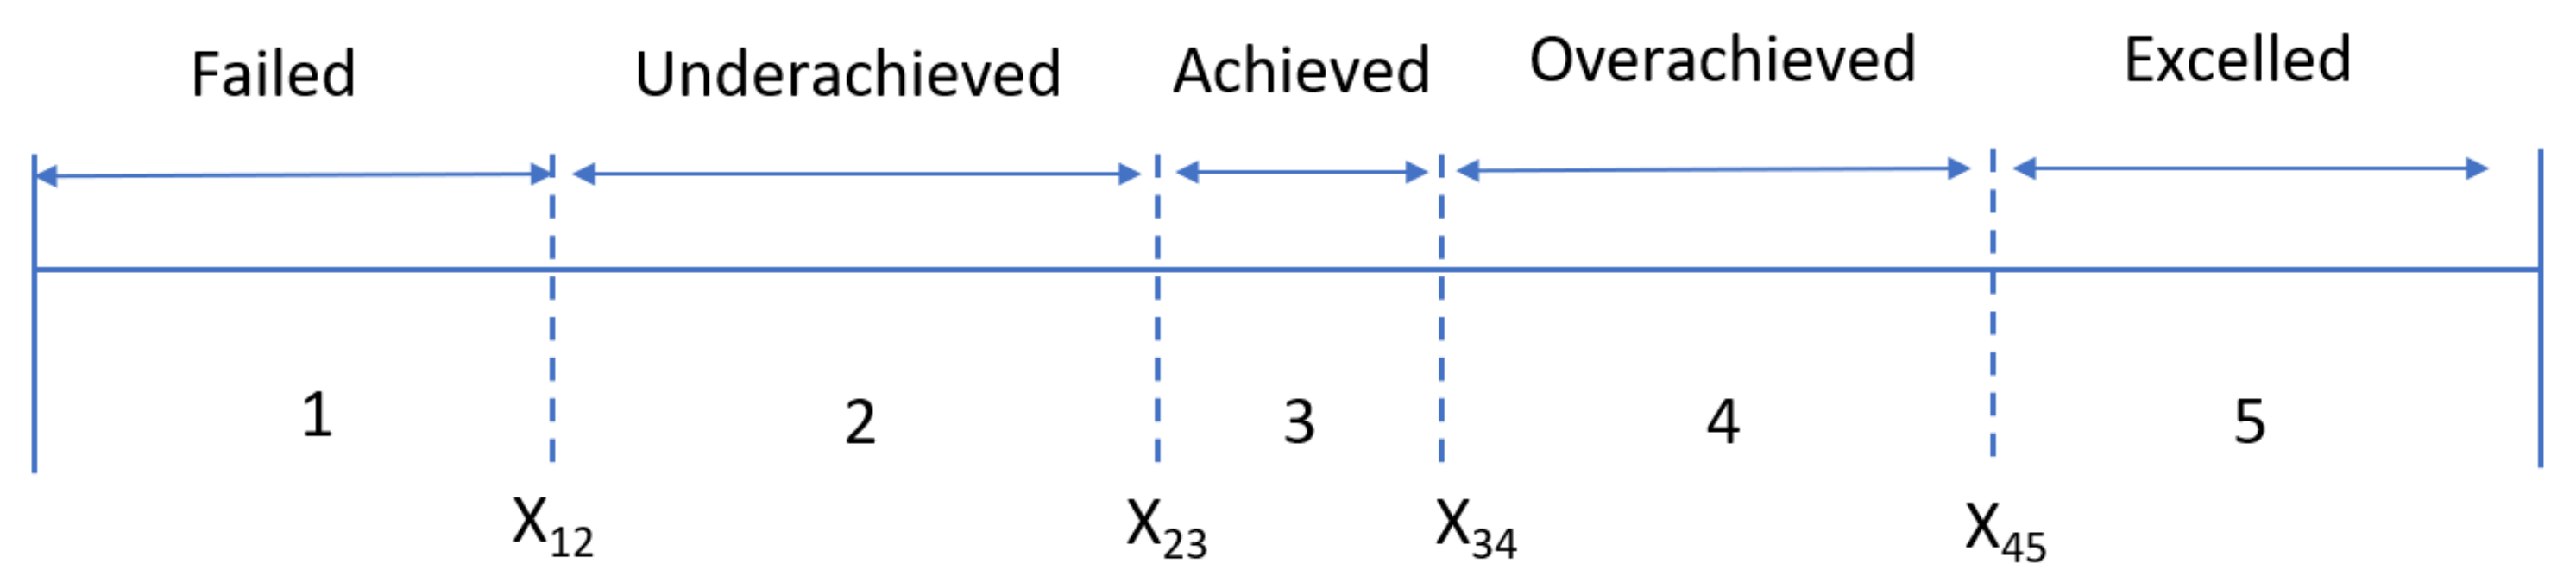
4.2. Value Normalization to a Uniform Scale
- Failed: ≤ (1 point is assigned to the examined indicator);
- Underachieved > and < (2 points are assigned to the examined indicator);
- Achieved ≥ and ≤ (3 points are assigned to the examined indicator);
- Overachieved > and < (4 points are assigned to the examined indicator);
- Excelled ≥ (5 points are assigned to the examined indicator)
4.3. Weighting
4.4. Aggregation
5. Index Calculation Procedure and Methodological Steps
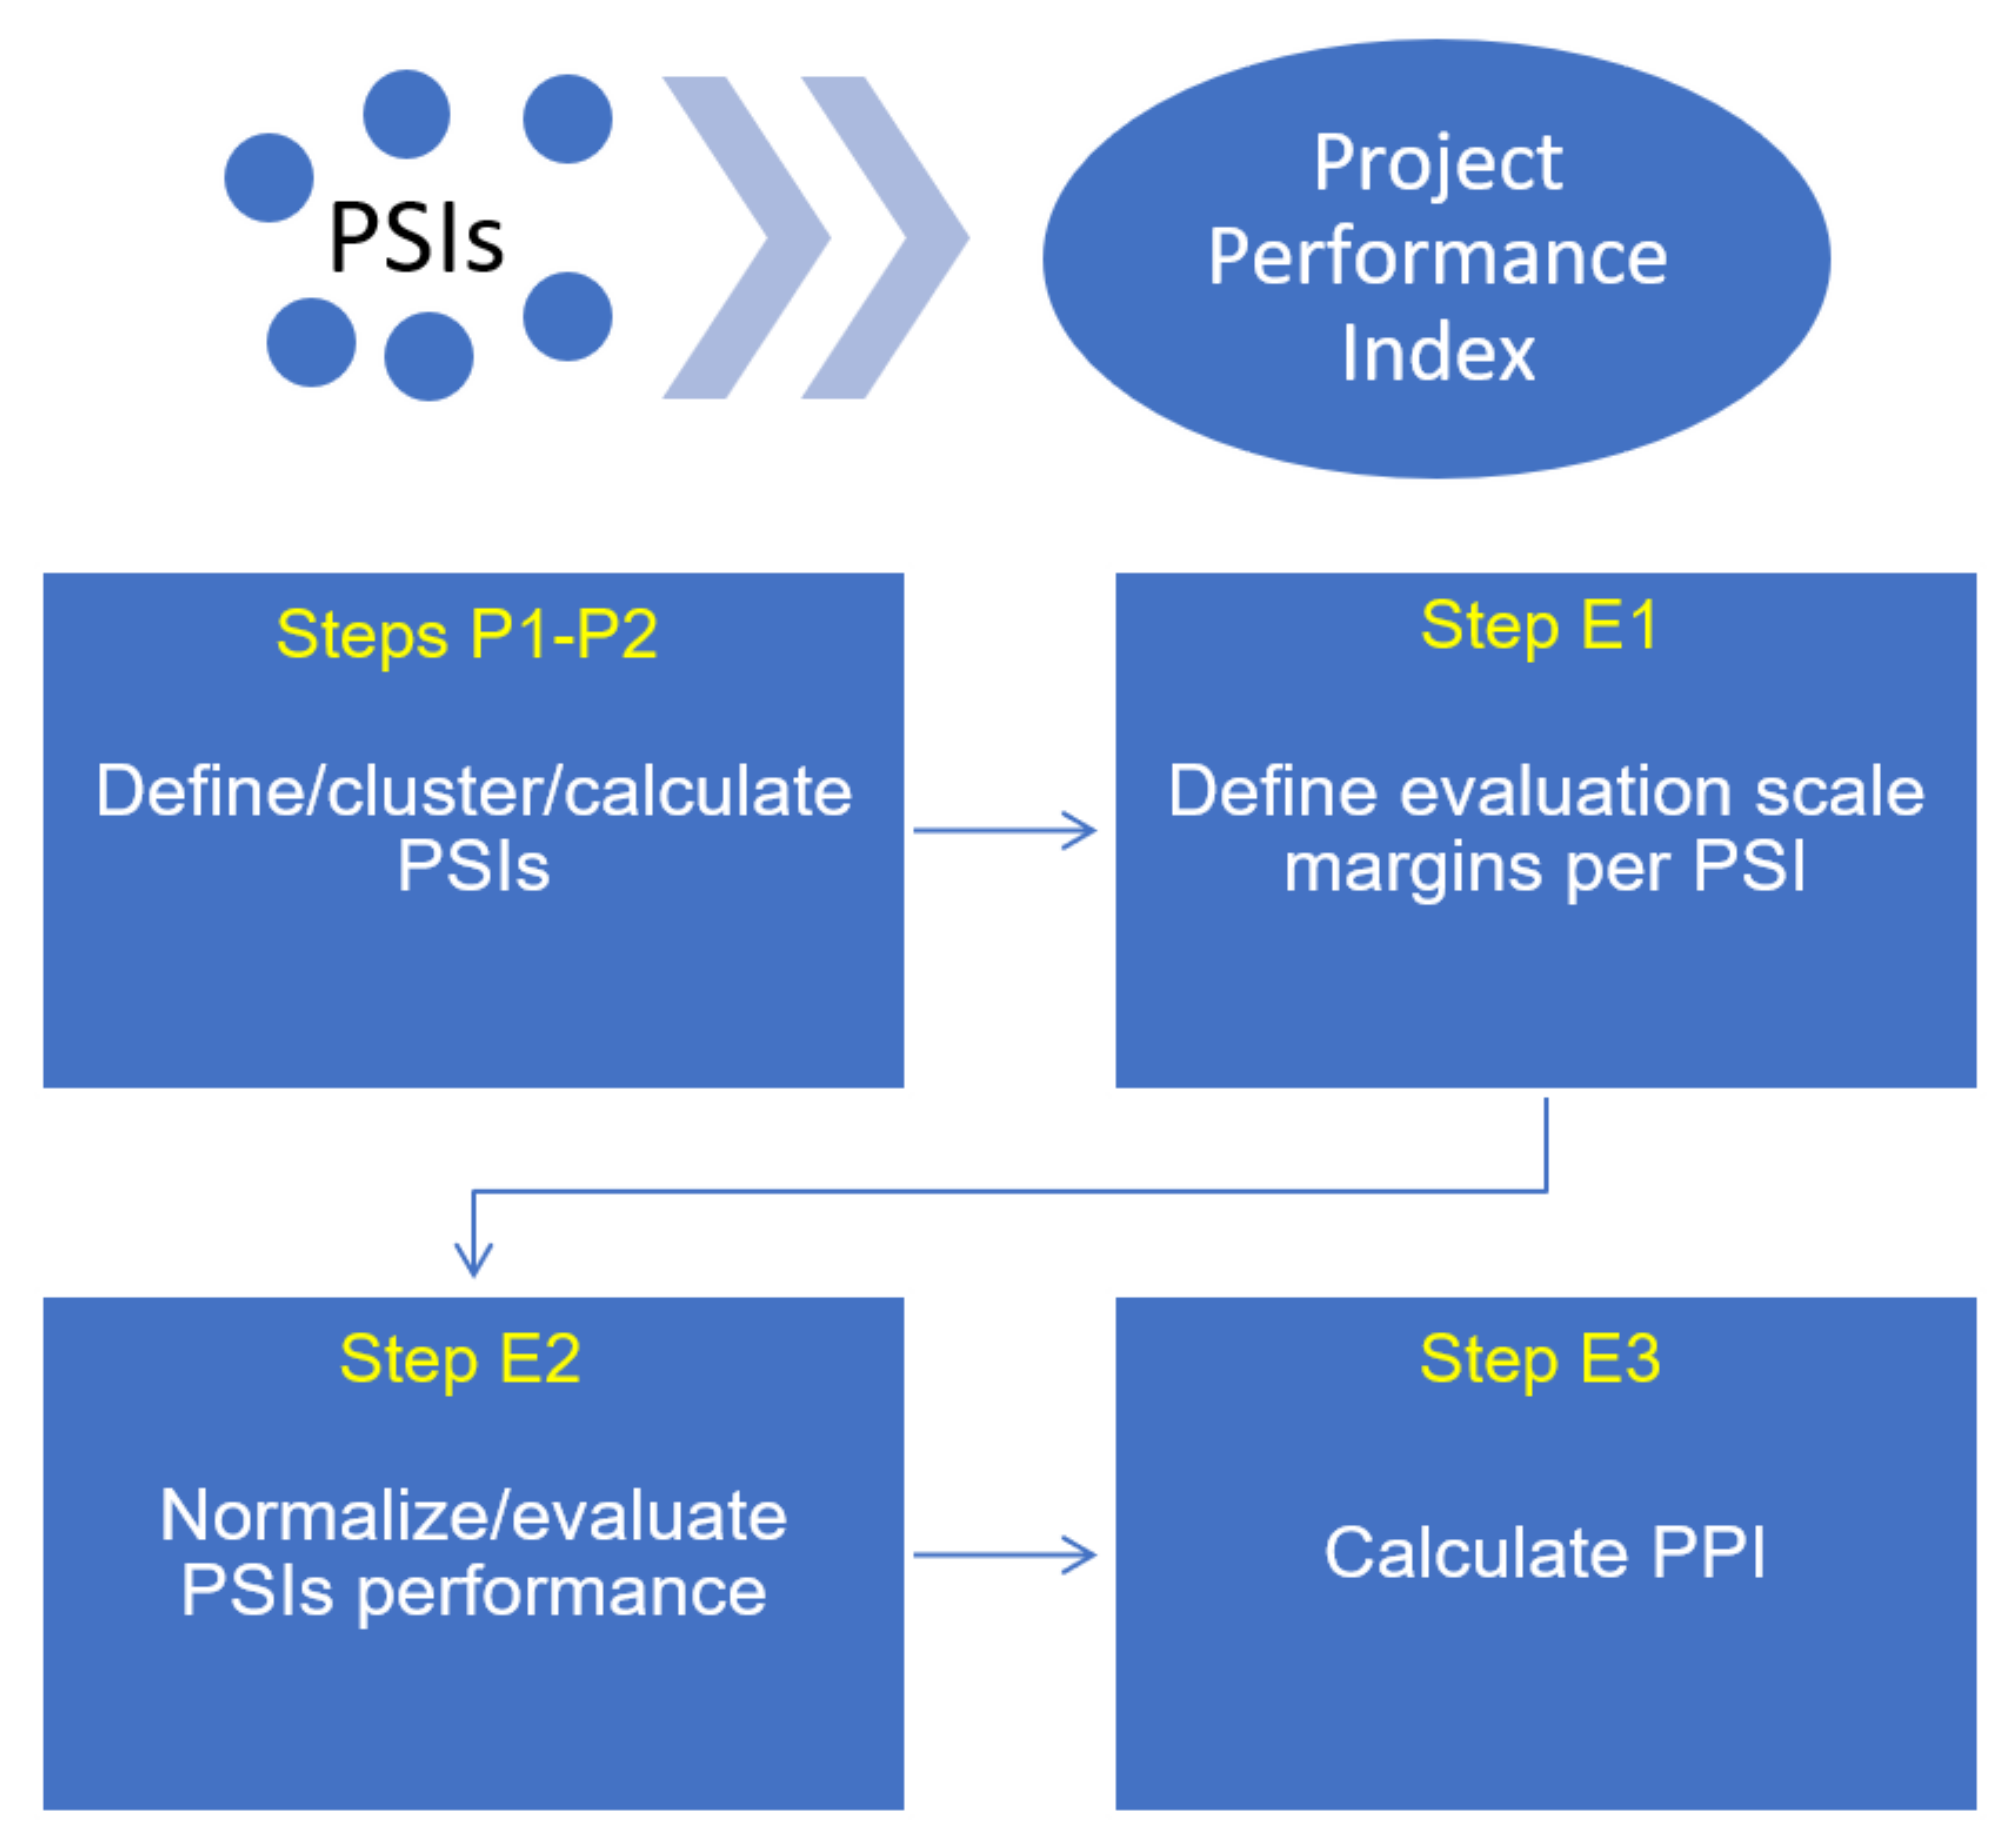
5.1. Evaluating SCC Projects’ Performance—The Project Performance Index (PPI)
5.2. Evaluating SCC Projects’ Sustainability Impact—The Sustainability Impact Index (SII)
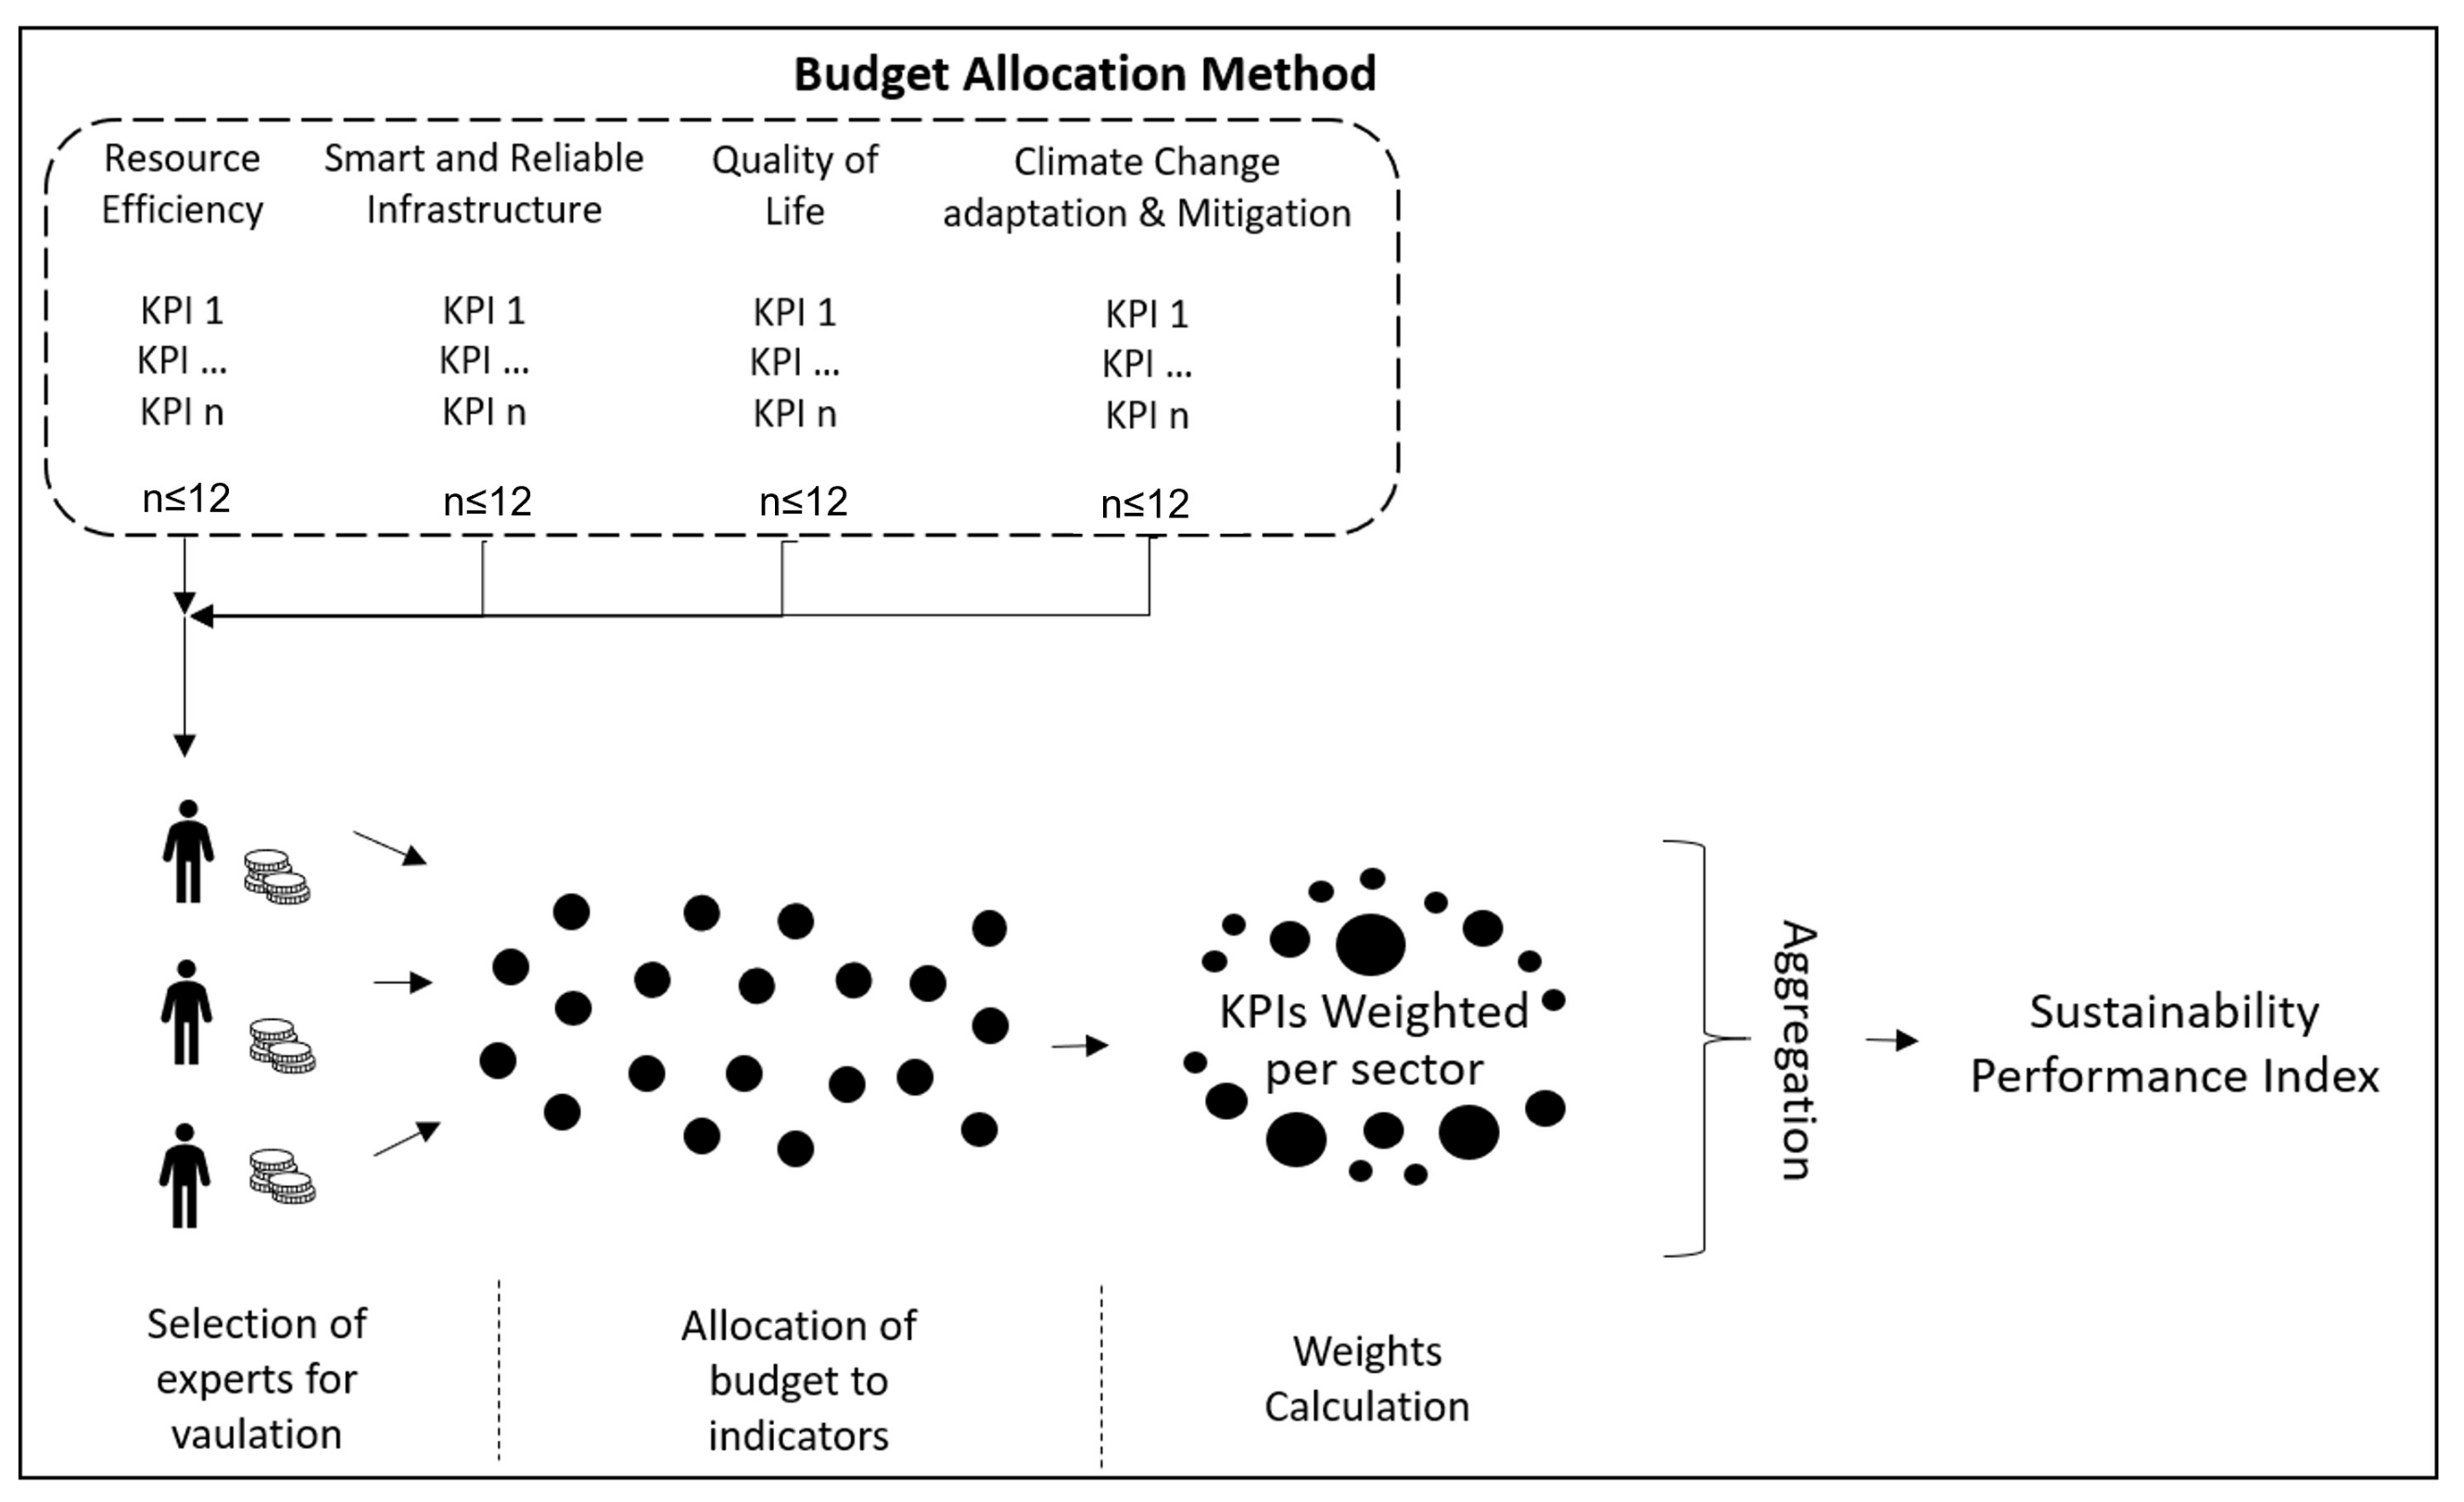
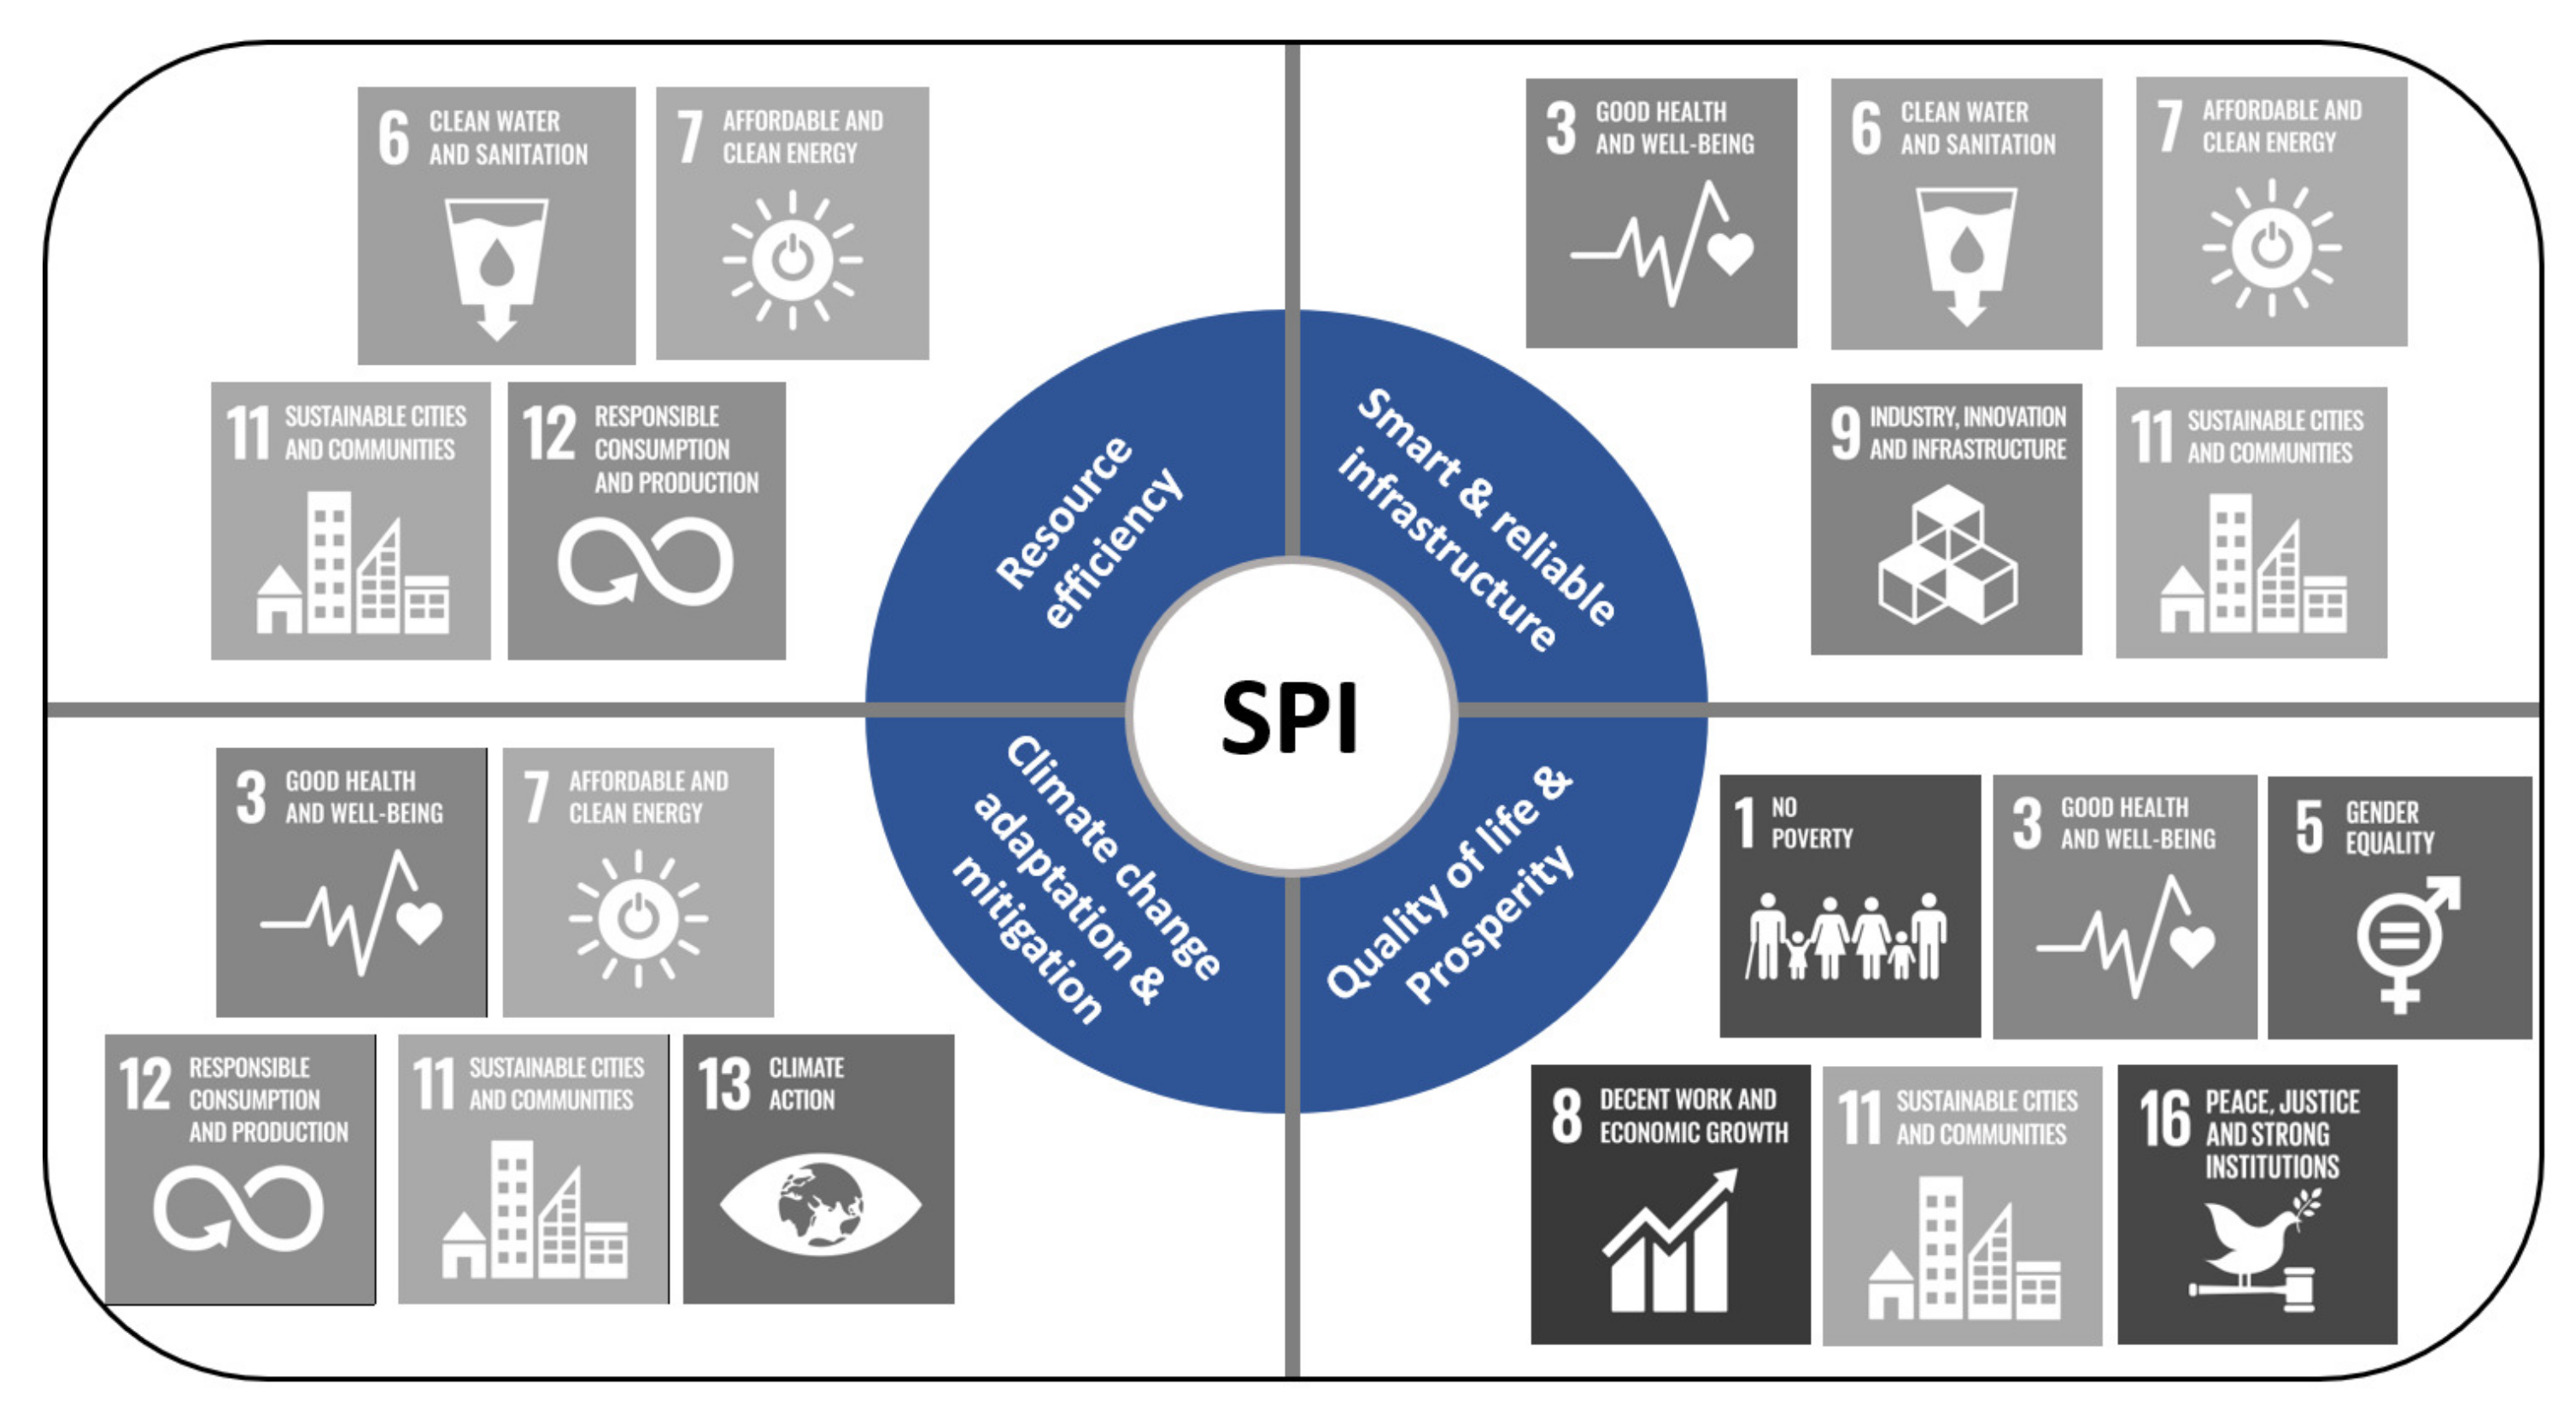
5.3. Evaluating Sccs’ All-Inclusively Sustainability Progress—The Sustainability Performance Index
- Sector 1: Resource Efficiency. Given the continuous earth’s population growth, an increasing global demand for resources is recorded which is also expected for the following decades. Resource efficiency is of utmost importance for smart cities striving to identify material, energy and human resources and link them properly in order to reduce environmental, economic and social risks and impacts and provide increased opportunities for sustainable living with greater productivity, lower costs, macroeconomic stability, and feasible consumer choices. The sector of “Resource efficiency” is highly relevant to aspects of natural and energy resources pertaining to the smart city ecosystem and the built environment including, but not limited to, RES penetration, grid flexibility, waste management, ICT measures (smart lighting, 5G, etc.), building renovation, building automation, water treatment, circularity/recycling and life-cycle, peer-to-peer (P2P) trading schemes, etc. Resource efficiency is considered here in alignment with SDGs #6: Clean water and sanitation, #7: Affordable and clean energy, #11: Sustainable cities and communities, and #12: Responsible consumption and production.
- Sector 2: Smart and Reliable Infrastructure. Infrastructure development and performance is highly relevant for smart city projects that explore and demonstrate upgraded and well-integrated urban infrastructure options by harnessing the dynamic capability of new cutting-edge technological advancements that are based on the global digitalization and industry 4.0 trends, as well as considering the increasing citizens’ needs for smart and innovative services. Apart from SDG#11, other related SDGs with smart city infrastructure are #3 Good health and well-being, #6 Clean water and sanitation, #7 Affordable and clean energy, and #9 Industry, innovation, and infrastructure. The most indicative aspects to be included in this sector are: E-mobility schemes, energy storage and grid flexibility (BESS, TES, V2G, etc.), ICT measures (smart lighting, 5G, etc.), building automation, traffic management, smart waste management, air quality management, DHC networks, public transport networks (accessibility and connectivity), smart grids (virtual power plants, etc.), road safety.
- Sector 3: Quality of Life and Prosperity. Quality of life and prosperity must be the cornerstone of smart and sustainable cities. Smart city initiatives should be considered successful only if they improve urban resident’s quality of life. In this context, this particular sector attempts to evaluate smart city projects in terms of public health, well-being, sustainable lifestyle, as well as economic development, i.e., whether the solutions and actions implemented can provide benefits, opportunities, and profits to the citizens. The most indicative aspects that should be covered by this sector are: air quality, reduced waste, water quality, reduced energy poverty, active transport and clean mobility, reduced noise, jobs creation and business opportunities, innovation uptake and in-city propagation, governance, citizen engagement, health and safety, and education. As a consequence, this sector has strong links with SDGs #1, No Poverty, #3, Good health and well-being, #4 Quality education #5 Gender equality, #8 Decent work and economic growth, #11 Sustainable cities and communities, and #16 Peace, justice and strong institutions.
- Sector 4: Climate Change Adaptation and Mitigation. The fact that the future transformation of cities into liveable ones relies on an effective decarbonisation strategy at global and regional level sets the area of climate change adaptation and mitigation as a key pillar for sustainable results. The specific category is highly relevant to the successful performance of smart city projects regarding responses to climate targets pertaining to reduced GHG and pollutant emissions in compliance with common standards and strategies, as well as appropriate adaptation measures preventing climate risks, such as floods, etc., and considering local particularities and vulnerabilities. The sector is linked with SDG#13 Climate action, as well as SDGs #3, Good health and well-being, #7 Affordable and clean energy, #11 Sustainable cities and communities, and #12 Responsible consumption and production. The sector may include indicative aspects that focus on air quality, RES penetration, waste management, e-mobility, water and wastewater treatment, circularity and recycling, reduced pollution, land use and urban space, and climate resilience (also including nature-based resilience, green areas, trees, etc.).
6. Illustrative Examples and Discussion on Index Scoring
6.1. Key Assumptions
- SSI and SPIs indices were extracted on a city level only. In total, 31 out of 37 KPIs were applied to assess this level (the rest KPIs were focusing on a building, block or district level only). Respective results can be extracted also for these aggregation levels but for the sake of simplicity and space restrictions we opted for a city analysis only in this paper.
- Functional units have been selected with a view to conform with POCITYF needs and defined KPI estimation formulas and variables to be extracted. This means that no extra data in comparison with the ones already foreseen in POCITYF, are needed for the framework to be implemented. Most of the functional units applied, are expressing a percentage of reduction or increase.
- Evaluation scales were defined by the authors, building upon own experiences and capitalizing as much as possible, European strategic goals and average European statistics. For instance, for the case of KPI—“Energy Savings” a reference point of 32.5% was set as a boundary value for achieving a satisfying performance (3 points) according to the energy efficiency target set by the EU 2018/2002 Directive. Similarly for the case of KPI—“Number of EV charging points” a reference point of 5.7 public charge points per 1000 capita (EU target value in the Road2Zero scenario ) has been set as a boundary value of success (3 points) whereas the rest of the evaluation scale has been marginalized based on the worst (<2) and best (>8) in class performant countries on this issue, assigning a score of 1 and 5 points, respectively. Setting solid and well-justified evaluation scales was found to be a very challenging but of high added value process. Developments on this subject are still on-going and a more detailed presentation of this issue is foreseen in the future.
- Target values applied in PPI have been defined by POCITYF during proposal submission and reflect the project’s own ambitions and expected impact. Minor modifications may apply in the future.
- The BAL method was deployed for determining weights and evaluating the impact to sustainable goals, i.e., for the SII. The method was also applied for determining weights and evaluating inclusive sectors in SCC projects, i.e., for the SPI. For the latter (SPI), an initial process of choosing the most important cross-dimensional KPIs per sector was performed based on an BAL-like method—KPIs with zero points assigned by all experts were excluded while the maximum KPIs per sector was limited to 12, in order to comply with the BAL method requirements, reducing cognitive stress to the experts. In all of the above, the evaluation was performed by the authors of the paper, serving as a preliminary group of experts. A wide pool of experts from different fields and countries will be developed and applied during the final implementation of the methodology.
- The KPI calculation (input of functional unit values by the user) were assigned indicatively by the authors considering a hypothetical performance of the POCITYF project by its end for one of the two LH cities.
6.2. PPI Results
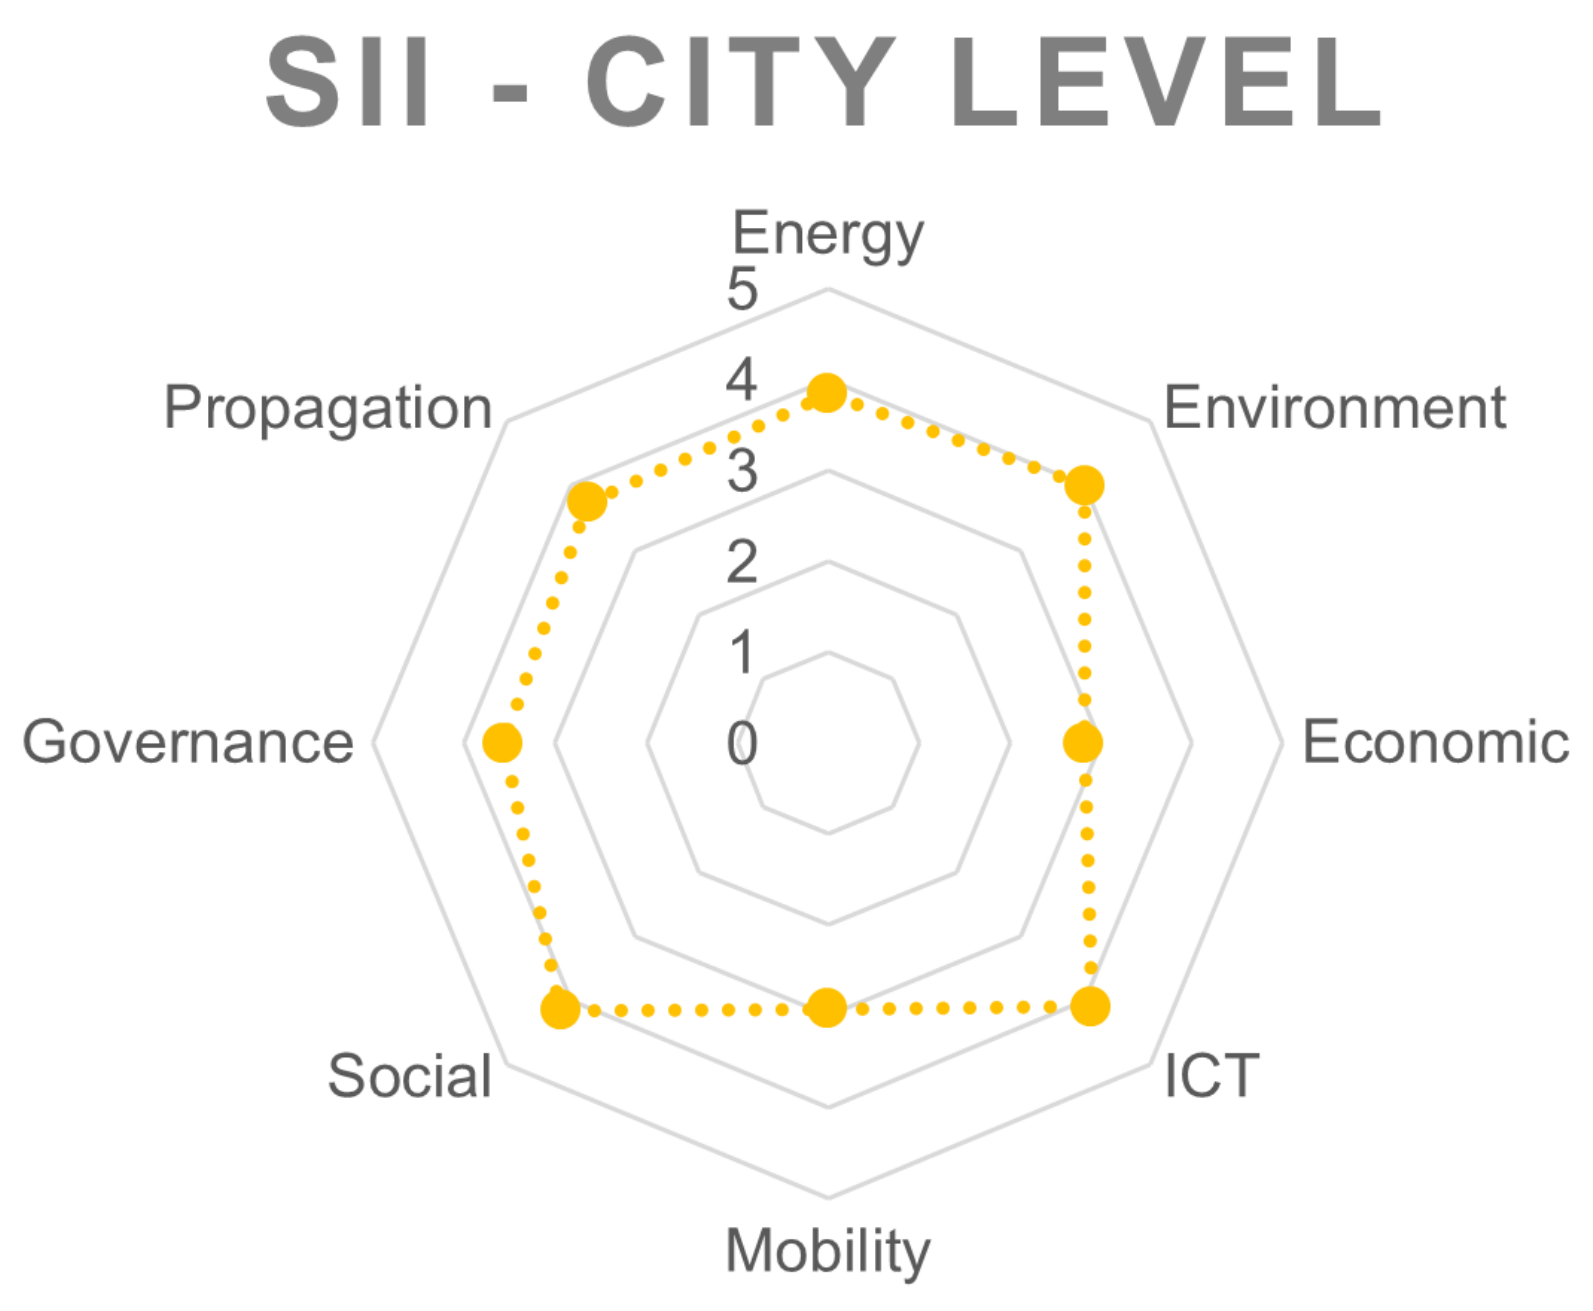
6.3. SII Results
6.4. SPI Results
7. Discussion
- The implementation of the current framework is foreseen to occur in the next years for several EU funded SCC projects. The illustrative example provided in Section 6 should be considered as a fictitious case-study due to the randomly assigned KPI values. As such, the authors plan to publish concrete and real data in the future as soon as the latter are available, illustrating the capabilities of USE framework into assessing the sustainability performance of SCC projects and elaborating on the results with thorough analysis.
- Concerning the SPI, we have already mentioned that under UC2 (future projects), the correct implementation of this axis-evaluation requires a common KPI-repository per sector, in order to obtain comparable results and towards a consistent benchmarking between cities. The process of populating such repositories is not straightforward. It should involve a variety of stakeholders (city authorities, technology providers, research institutes, policy makers, citizens, etc.) with adequate expertise, as well as diversity in each sector, so that all relevant aspects are covered and each sector truly becomes an overarching group which contributes to the total sustainability of a city. Moreover, we are fully aware that setting the SCC sectors and clearly defining their key aspects, is a quite challenging and demanding process on its own. The authors have already started collecting data towards the definition of the common KPIs per sector while working on a more elaborated justification for the SCC sectors definition. This work is outside the scope of the current article while we plan to enhance the definition of defined herein preliminary sectors and their aspects in the near future.
- The normalization procedure described in Section 4 requires a process of finding well accepted reference points for every indicator. This process is time and effort intensive, whereas a level of subjectivity is still involved. Reference points should be based on commonly accepted data and targets to increase objectivity as far as possible. In order to reduce uncertainty, it is proposed that these targets must be re-evaluated and modified regularly. Still, we consider this a step forward in comparison with business-as-usual practice where indicators are mostly assessed based on the increase or decrease in their value. Additionally, by utilizing a 5-point scale a lot of information is lost, which may lead to accumulation of scores into the same cluster (e.g., many buildings/PEBs/PEDs/Cities with the same score). Although for a single KPI it is very likely that scores will coincide, for a higher number of KPIs (usually applied by SCC projects) this is unlikely to happen. It is further proposed that the city should still perform the traditional indicator analysis (e.g., examine trends of absolute values over consecutive years) in order to identify more specific internal problems or opportunities for improvement.
- The evaluation on different spatial scales of a city (e.g., building level, PEB level, PED level, etc.) is inherent inside the USE framework. Adequate aggregation techniques can be used to leap from one level to the next (e.g., summing up each KPI contribution of the buildings that consist a PEB can provide the required PEB value). Such aggregation might seem oversimplified and can not surely take into account particular aspects of each lower level component (e.g., buildings) that might contribute non-uniformly to the upper level of evaluation (e.g., PEB). Moving to even higher spatial aggregation levels, such approach becomes further complicated as typically in SCC projects, the union of different PEBs is not equal to a whole PED (and similar for several PEDs aggregated to a city level). Choosing representative components of each evaluation level is ambiguous, although averaging provides a simple solution. In any case, the clear definition of these spatial scales inside a SCC project is pending and thus we are planning to redefine if necessary the aggregation techniques inside USE framework to comply with the SCC standards.
8. Conclusions
Author Contributions
Funding
Data Availability Statement
Conflicts of Interest
Appendix A

| KPI | Target Value | Evaluation Scale- Indicative Margins | Input | Score | ||||
|---|---|---|---|---|---|---|---|---|
| (1) | (2) | (3) | (4) | (5) | ||||
| Number of PEBs deployed at the end of POCITYF | 4 | ≤1 | (1, 4) | 4 | 5 | ≥6 | 4 | 3 |
| Number of PEDs/PEBs deployed until 2030 | 4–12 | ≤7 | (7, 16) | 16 | (16, 18) | ≥18 | 16 | 3 |
| Number of Cities with a SECAP approved and implemented | 8 | ≤3 | (3, 8) | 8 | 9 | ≥10 | 7 | 2 |
| Total local RES produced within the PEBs | 16,217 MWh/y | ≤−35% | (−35%, −2.5%) | [−2.5%, 2.5%] | (2.5%, 35%) | ≥35% | 15,480 | 2 |
| Total net energy needs covered by local RES within PEBs | 135% | ≤50% | (50%, 100%) | [100%, 125%] | (125%, 150%) | ≥150% | 110% | 3 |
| Waste heat recovery within PEBs 1 | 5880 MWh | ≤−35% | (−35%, −2.5%) | [−2.5%, 2.5%] | (2.5%, 35%) | ≥35% | 7000 | 4 |
| Thermal storage within PEBs 1 | 2052 MWh | ≤−35% | (−35%, −2.5%) | [−2.5%, 2.5%] | (2.5%, 35%) | ≥35% | 2040 | 3 |
| Batteries storage within PEBs 1 | 1885 MWh | ≤−35% | (−35%, −2.5%) | [−2.5%, 2.5%] | (2.5%, 35%) | ≥35% | 250 | 1 |
| V2G storage within PEBs 1 | 1916 MWh | ≤−35% | (−35%, −2.5%) | [−2.5%, 2.5%] | (2.5%, 35%) | ≥35% | 2643 | 5 |
| Building related GHG emissions reduction within PEBs 1 | 3574 t. CO2eq/y | ≤−35% | (−35%, −2.5%) | [−2.5%, 2.5%] | (2.5%, 35%) | ≥35% | 3589 | 3 |
| Cities committed as new POCITYF FCs | 20 | ≤10 | (10, 20) | 20 | (20, 30) | ≥30 | 15 | 2 |
| Floor area for demonstrating (LH) POCITYF solutions 1 | 87,480 | ≤−35% | (−35%, −2.5%) | [−2.5%, 2.5%] | (2.5%, 35%) | ≥35% | 81,480 | 2 |
| Floor area for replicating (FC) POCITYF solutions 1 | 140,265 | ≤−35% | (−35%, −2.5%) | [−2.5%, 2.5%] | (2.5%, 35%) | ≥35% | 140,000 | 3 |
| Number of residents living within the PEDs 1 | 169,247 | ≤−35% | (−35%, −2.5%) | [−2.5%, 2.5%] | (2.5%, 35%) | ≥35% | 191,254 | 4 |
| Pay−back period of POCITYF solutions | 10 years | ≥15 | (11, 15) | [9, 11] | (9, 5) | ≤5 | 12 | 2 |
| Total net energy savings due to POCITYF within PEBs 1 | 2322 MWh/y | ≤−35% | (−35%, −2.5%) | [−2.5%, 2.5%] | (2.5%, 35%) | ≥35% | 2459 | 4 |
| Reduction of total incoming energy through PEBs 1 | 10,492.6 MWh/y | ≤−35% | (−35%, −2.5%) | [−2.5%, 2.5%] | (2.5%, 35%) | ≥35% | 11,312 | 4 |
| Increase in total out coming energy through PEBs 1 | 7815.2 MWh/y | ≤−35% | (−35%, −2.5%) | [−2.5%, 2.5%] | (2.5%, 35%) | ≥35% | 7829 | 3 |
| Total energy needs covered by resources from outside PEBs 1 | 19% | ≤−35% | (−35%, −2.5%) | [−2.5%, 2.5%] | (2.5%, 35%) | ≥35% | 19% | 3 |
| Number of new e−vehicles (incl. e−bikes) on a city level 1 | 10,587 | ≤−35% | (−35%, −2.5%) | [−2.5%, 2.5%] | (2.5%, 35%) | ≥35% | 10,601 | 3 |
| Number of EVs participating in car−sharing schemes 1 | 110 | ≤−35% | (−35%, −2.5%) | [−2.5%, 2.5%] | (2.5%, 35%) | ≥35% | 95 | 2 |
| Number of new EV charging points rolled−out 1 | 1099 | ≤−35% | (−35%, −2.5%) | [−2.5%, 2.5%] | (2.5%, 35%) | ≥35% | 1100 | 3 |
| Total carbon dioxide emission reduction 1 | 9743 t. CO2eq/y | ≤−35% | (−35%, −2.5%) | [−2.5%, 2.5%] | (2.5%, 35%) | ≥35% | 11,965 | 5 |
| Nitrogen oxides reduction due to increased e−mobility 1 | 47.5 t. NOX/year | ≤−35% | (−35%, −2.5%) | [−2.5%, 2.5%] | (2.5%, 35%) | ≥35% | 47.4 | 3 |
| Sulfur dioxide reduction due to increased e−mobility 1 | 271.5 t. SO2/year | ≤−35% | (−35%, −2.5%) | [−2.5%, 2.5%] | (2.5%, 35%) | ≥35% | 268.4 | 3 |
| Number of patents application | >3 | ≤1 | (1, 4) | 4 | (4, 7) | ≥7 | 2 | 2 |
| Number of peer−reviewed publications | >10 | ≤7 | (7, 11) | 11 | (11, 16) | ≥16 | 18 | 5 |
| Similar projects where cooperation is established | >5 | ≤1 | (1, 6) | 6 | (6, 10) | ≥10 | 7 | 4 |
| European cities included into POCITYF D&E networks 1 | 100 | ≤−35% | (−35%, −2.5%) | [−2.5%, 2.5%] | (2.5%, 35%) | ≥35% | 106 | 4 |
| Parties interested in using POCITYF solutions 1 | >50 entities | ≤−35% | (−35%, −2.5%) | [−2.5%, 2.5%] | (2.5%, 35%) | ≥35% | 60 | 4 |
| Number of new and feasible product ideas generated 1 | >30 | ≤−35% | (−35%, −2.5%) | [−2.5%, 2.5%] | (2.5%, 35%) | ≥35% | 14 | 1 |
| Memorandum of cooperation with cities | 20 | ≤10 | (10, 20) | 20 | (20, 30) | ≥30 | 21 | 4 |
| Final PPI score (Project level): | 2.6 | |||||||
Appendix B
| KPI | Functional Unit (FU) | Assigned Weight | Evaluation Scale Indicative Margins | FU Input | Score | Weighted Score | ||||
|---|---|---|---|---|---|---|---|---|---|---|
| (1) | (2) | (3) | (4) | (5) | ||||||
| Energy Dimension | ||||||||||
| Energy Demand and Consumption | kWh/m/y | 0.170 | ≥100 | (80, 100) | [60, 80] | (40, 60) | ≤40 | 45 | 4 | 0.680 |
| Degree of energetic self-supply by RES | % | 0.158 | ≤40% | (40%, 60%) | [60%, 80%] | (80%, 100%) | ≥100% | 110% | 5 | 0.790 |
| Self-sufficiency ratio | % | 0.123 | ≤40% | (40%, 60%) | [60%, 80%] | (80%, 100%) | ≥100% | 101% | 5 | 0.615 |
| Energy Savings | % | 0.213 | ≤5% | (5%, 30%) | [30%, 35%] | (35%, 60%) | ≥60% | 19% | 2 | 0.426 |
| kWp photovoltaic installed per 100 inhabitants | kWp/100 inh. | 0.067 | ≤10 | (10, 150) | [150, 300] | (300, 450) | ≥450 | 187 | 3 | 0.201 |
| Smart Storage Capacity | % | 0.123 | ≤30% | (30%, 50%) | [50%, 70%] | (70%, 90%) | ≥90% | 100% | 5 | 0.615 |
| Integrated Building Management Systems | % | 0.073 | ≤30% | (30%, 50%) | [50%, 70%] | (70%, 90%) | ≥90% | 65% | 3 | 0.219 |
| Buildings in the city with smart energy meters | % | 0.073 | ≤30% | (30%, 50%) | [50%, 70%] | (70%, 90%) | ≥90% | 85% | 4 | 0.292 |
| Final SII score of Energy Dimension: | 3.8 | |||||||||
| Environmental Dimension | ||||||||||
| Greenhouse Gas Emissions | % | 0.417 | ≤10% | (10%, 40%) | [40%, 50%] | (50%, 80%) | ≥80% | 56% | 4 | 1.668 |
| Carbon Dioxide Emission Reduction | tCO2/cap./y | 0.233 | ≥10 | (8, 10) | [6, 8] | (4, 6) | ≤4 | 5.3 | 4 | 0.932 |
| Air Quality Index | Index | 0.350 | ≥100 | (75, 100) | [50, 75] | (25, 50) | ≤25 | 44 | 4 | 1.400 |
| Final SII score of Environmental Dimension: | 4.0 | |||||||||
| Economic Dimension | ||||||||||
| Total Investments | €/ | 0.150 | ≤200 | (200, 400) | [400, 600] | (600, 800) | ≥800 | 435 | 3 | 0.450 |
| Total Annual Costs | % | 0.163 | ≤30% | (30%, 50%) | [50%, 70%] | (70%, 90%) | ≥90% | 61% | 3 | 0.489 |
| Payback Period | Years | 0.327 | ≥15 | (11, 15) | [9, 11] | (5, 9) | ≤5 | 10 | 3 | 0.981 |
| Return on Investment (ROI) | % | 0.177 | ≤50% | (50%, 90%) | [90%, 110%] | (110%, 200%) | ≥200% | 100% | 3 | 0.531 |
| New Business Ideas Generated | #/y/1000 bus. | 0.183 | ≤10 | (10, 30) | [30, 50] | (50, 70) | ≥70 | 23 | 2 | 0.366 |
| Final SII score of Economic Dimension: | 2.8 | |||||||||
| ICT Dimension | ||||||||||
| Increased Energy System Flexibility | % | 0.334 | ≤30% | (30%, 50%) | [50%, 70%] | (70%, 90%) | ≥90% | 72% | 4 | 1.336 |
| Increased hosting capacity for RES/EVs | % | 0.283 | ≤30% | (30%, 50%) | [50%, 70%] | (70%, 90%) | ≥90% | 55% | 3 | 0.849 |
| Improved Data Privacy | Likert Scale (1–5) | 0.233 | 1 | 2 | 3 | 4 | 5 | 5 | 5 | 1.165 |
| Quality of Open Data | % | 0.150 | ≤30% | (30%, 50%) | [50%, 70%] | (70%, 90%) | ≥90% | 95% | 5 | 0.75 |
| Final SII score of ICT Dimension: | 4.1 | |||||||||
| Mobility Dimension | ||||||||||
| EVs and Low-Carbon Emission Vehicles | % | 0.283 | ≤2% | (2%, 5%) | [5%, 10%] | (10%, 20%) | ≥20% | 1,70% | 2 | 0.566 |
| Number of EV charging points | # points/1000 inh. | 0.283 | ≤2 | (2, 4) | [4, 6] | (6, 8) | ≥8 | 6.7 | 4 | 1.132 |
| Annual Energy delivered by charging points | kWh/y/point | 0.107 | ≤40 K | (40 K, 60 K) | [60 K, 80 K] | (80 K, 100 K) | ≥100 K | 96 K | 4 | 0.428 |
| Number of passengers using the new vehicles | % | 0.140 | ≤30% | (30%, 50%) | [50%, 70%] | (70%, 90%) | ≥90% | 63% | 3 | 0.42 |
| Shared EVs and Bicycles Penetration Rate | % | 0.187 | ≤0.1% | (0.1%, 1%) | [1%, 2.5%] | (2.5%, 5%) | ≥5% | 0.40% | 2 | 0.374 |
| Final SII score of Mobility Dimension: | 2.9 | |||||||||
| Social Dimension | ||||||||||
| People reached | % | 0.272 | ≤30% | (30%, 50%) | [50%, 70%] | (70%, 90%) | ≥90% | 60% | 3 | 0.816 |
| Local community involvement | Likert Scale (1–5) | 0.306 | 1 | 2 | 3 | 4 | 5 | 4 | 4 | 1.224 |
| Degree of satisfaction | Likert Scale (1–5) | 0.422 | 1 | 2 | 3 | 4 | 5 | 5 | 5 | 2.11 |
| Final SII score of Social Dimension: | 4.2 | |||||||||
| Governance Dimension | ||||||||||
| Online visits to the municipal open data portal | #/100K inh./y | 0.217 | ≤40 K | (40 K, 80 K) | [80 K, 120 K] | (120 K, 160 K) | ≥160 K | 75 K | 2 | 0.434 |
| Percentage of city services accessible online | % | 0.783 | ≤10% | (10%, 45%) | [45%, 55%] | (55%, 90%) | ≥90% | 75% | 4 | 3.132 |
| Final SII score of Governance Dimension: | 3.6 | |||||||||
| Propagation Dimension | ||||||||||
| Social compatibility | Likert Scale (1–5) | 0.257 | 1 | 2 | 3 | 4 | 5 | 3 | 3 | 0.771 |
| Technical compatibility | Likert Scale (1–5) | 0.267 | 1 | 2 | 3 | 4 | 5 | 3 | 3 | 0.801 |
| Market demand | Likert Scale (1–5) | 0.263 | 1 | 2 | 3 | 4 | 5 | 5 | 5 | 1.315 |
| Diffusion to other locations | Likert Scale (1–5) | 0.213 | 1 | 2 | 3 | 4 | 5 | 4 | 4 | 0.852 |
| Final SII score of Propagation Dimension: | 3.7 | |||||||||
| Final SII score (City level): | 3.6 | |||||||||
Appendix C
| Sector 1: Resource Efficiency | Sector 2: Smart and Reliable Infrastructure | ||||
|---|---|---|---|---|---|
| KPI | Weight | Weighted Score | KPI | Weight | Weighted Score |
| Energy Savings | 0.209 | 0.418 | Increased energy System Flexibility | 0.201 | 0.804 |
| Energy Demand and Consumption | 0.158 | 0.632 | Number of EV charging points | 0.159 | 0.636 |
| Self-sufficiency ratio | 0.142 | 0.71 | Integrated Building Management Systems | 0.114 | 0.342 |
| Degree of energetic self-supply by RES | 0.101 | 0.505 | Buildings in the city with smart energy meters | 0.089 | 0.356 |
| Smart Storage Capacity | 0.101 | 0.505 | Increased hosting capacity for RES/EVs | 0.078 | 0.234 |
| Increased energy System Flexibility | 0.069 | 0.276 | Annual Energy delivered by charging points | 0.071 | 0.284 |
| Total Annual Costs | 0.058 | 0.174 | Technical compatibility | 0.062 | 0.186 |
| Payback Period | 0.058 | 0.174 | Number of passengers using the new vehicles | 0.062 | 0.186 |
| Increased hosting capacity for RES/EVs | 0.052 | 0.156 | Quality of Open Data | 0.051 | 0.255 |
| Integrated Building Management Systems in Buildings | 0.052 | 0.156 | Total Investments | 0.051 | 0.153 |
| Final SPI Score—Sector 1 | 3.7 | Final SPI Score—Sector 2 | 3.7 | ||
| Sector 3: Quality of Lifeand Prosperity | Sector 4: Climate ChangeAdaptation and Mitigation | ||||
|---|---|---|---|---|---|
| KPI | Weight | Weighted Score | KPI | Weight | Weighted Score |
| Air Quality Index | 0.158 | 0.632 | Greenhouse Gas Emissions | 0.149 | 0.596 |
| Social compatibility | 0.123 | 0.369 | Air Quality Index | 0.140 | 0.560 |
| Degree of satisfaction | 0.011 | 0.055 | Carbon Dioxide Emission Reduction | 0.138 | 0.552 |
| New Business Ideas Generated | 0.104 | 0.208 | EVs and Low-Carbon Emission Vehicles | 0.091 | 0.182 |
| People reached | 0.104 | 0.312 | Degree of energetic self-supply by RES | 0.091 | 0.455 |
| Greenhouse Gas Emissions | 0.094 | 0.376 | Shared EVs and Bicycles Penetration Rate | 0.089 | 0.178 |
| Local community involvement | 0.089 | 0.356 | Energy Savings | 0.074 | 0.148 |
| Market demand | 0.089 | 0.445 | Number of passengers using the new vehicles | 0.064 | 0.192 |
| Energy Savings | 0.064 | 0.128 | Increased hosting capacity for RES/EVs | 0.064 | 0.192 |
| EVs and Low-Carbon Emission Vehicles | 0.064 | 0.128 | kWp photovoltaic installed per 100 inhabitants | 0.050 | 0.150 |
| Carbon Dioxide Emission Reduction | 0.050 | 0.200 | |||
| Diffusion to other locations | 0.050 | 0.200 | Energy Demand and Consumption | 0.050 | 0.200 |
| Final SPI Score—Sector 3 | 3.4 | Final SPI Score—Sector 4 | 3.4 | ||
References
- United Nations. Transforming Our World: The 2030 Agenda for Sustainable Development; United Nations, Department of Economic and Social Affairs: New York, NY, USA, 2015. [Google Scholar]
- Ruan, F.; Yan, L.; Wang, D. The complexity for the resource-based cities in China on creating sustainable development. Cities 2020, 97, 102571. [Google Scholar] [CrossRef]
- Department of Economic and Social Affairs, Population Division, United Nations. World Population Prospects 2019: Highlights. 2019. Available online: https://population.un.org/wpp/Publications/Files/WPP2019_Highlights.pdf (accessed on 6 April 2021).
- Ranalder, L.; Busch, H.; Hansen, T.; Brommer, M.; Couture, T.; Gibb, D.; Guerra, F.; Nana, J.; Reddy, Y.; Sverrisson, F.; et al. Renewables in Cities 2021 Global Status Report; REN21 Secretariat: Paris, France, 2021; Available online: https://www.ren21.net/wp-content/uploads/2019/05/REC_2021_full-report_en.pdf (accessed on 6 April 2021).
- C40 Cities. Available online: https://www.c40.org/ (accessed on 6 April 2021).
- Daring Cities. Available online: https://daringcities.org/ (accessed on 6 April 2021).
- Covenant of Mayors for Climate and Energy, Europe. Available online: https://www.covenantofmayors.eu/ (accessed on 6 April 2021).
- EU Smart Cities Information System (SCIS). Available online: https://smartcities-infosystem.eu/ (accessed on 6 April 2021).
- The Intelligent Cities Challenge. Available online: https://www.intelligentcitieschallenge.eu/cities (accessed on 6 April 2021).
- Energy Cities. Available online: https://energy-cities.eu/ (accessed on 6 April 2021).
- Mendizabal, M.; Heidrich, O.; Feliu, E.; García-Blanco, G.; Mendizabal, A. Stimulating urban transition and transformation to achieve sustainable and resilient cities. Renew. Sustain. Energy Rev. 2018, 94, 410–418. [Google Scholar] [CrossRef]
- Nevens, F.; Frantzeskaki, N.; Gorissen, L.; Loorbach, D. Urban Transition Labs: Co-creating transformative action for sustainable cities. J. Clean. Prod. 2013, 50, 111–122. [Google Scholar] [CrossRef]
- Clerici Maestosi, P.; Andreucci, M.B.; Civiero, P. Sustainable Urban Areas for 2030 in a Post-COVID-19 Scenario: Focus on Innovative Research and Funding Frameworks to Boost Transition towards 100 Positive Energy Districts and 100 Climate-Neutral Cities. Energies 2021, 14, 216. [Google Scholar] [CrossRef]
- Calzada, I. Replicating Smart Cities: The City-to-City Learning Programme in the Replicate EC-H2020-SCC Project. Smart Cities 2020, 3, 978–1003. [Google Scholar] [CrossRef]
- Garrido-Marijuan, A.; Pargova, Y.; Wilson, C. The Making of a Smart City: Best Practices across Europe. Bruxelles Eur. Comm. 2017. Available online: https://smart-cities-marketplace.ec.europa.eu/insights/publications/making-smart-city-best-practices-across-europe (accessed on 6 April 2021).
- Europeia Comissão. European Innovation Partnership on Smart Cities and Communities: Strategic Implementation Plan. Smart City Communities 2012, 1, 1–22. [Google Scholar]
- Angelakoglou, K.; Kourtzanidis, K.; Giourka, P.; Apostolopoulos, V.; Nikolopoulos, N.; Kantorovitch, J. From a Comprehensive Pool to a Project-Specific List of Key Performance Indicators for Monitoring the Positive Energy Transition of Smart Cities—An Experience-Based Approach. Smart Cities 2020, 3, 705–735. [Google Scholar] [CrossRef]
- Barsi, B. Beyond indicators, new methods in Smart city assessment. OraȘE INTELIGENTE ȘI DEZVOLTARE REGIONALĂ 2018, 2, 87–100. [Google Scholar]
- Caird, S.P.; Hallett, S.H. Towards evaluation design for smart city development. J. Urban Des. 2019, 24, 188–209. [Google Scholar] [CrossRef]
- Shen, L.Y.; Ochoa, J.J.; Shah, M.N.; Zhang, X. The application of urban sustainability indicators—A comparison between various practices. Habitat Int. 2011, 35, 17–29. [Google Scholar] [CrossRef]
- Huovila, A.; Bosch, P.; Airaksinen, M. Comparative analysis of standardized indicators for Smart sustainable cities: What indicators and standards to use and when? Cities 2019, 89, 141–153. [Google Scholar] [CrossRef]
- Antolín, J.; de Torre, C.; García-Fuentes, M.Á.; Pérez, A.; Tomé, I.; Mirantes, M.L.; Hoyos, E. Development of an Evaluation Framework for Smartness and Sustainability in Cities. Sustainability 2020, 12, 5193. [Google Scholar] [CrossRef]
- Picioroagă, I.I.; Eremia, M.; Sănduleac, M. SMART CITY: Definition and evaluation of key performance indicators. In Proceedings of the 2018 International Conference and Exposition on Electrical and Power Engineering (EPE), Iasi, Romania, 18–19 October 2018; pp. 217–222. [Google Scholar]
- Ameen, R.F.M.; Mourshed, M. Urban sustainability assessment framework development: The ranking and weighting of sustainability indicators using analytic hierarchy process. Sustain. Cities Soc. 2019, 44, 356–366. [Google Scholar] [CrossRef]
- Huang, L.; Wu, J.; Yan, L. Defining and measuring urban sustainability: A review of indicators. Landsc. Ecol. 2015, 30, 1175–1193. [Google Scholar] [CrossRef]
- Singh, R.K.; Murty, H.R.; Gupta, S.K.; Dikshit, A.K. An overview of sustainability assessment methodologies. Ecol. Indic. 2009, 9, 189–212. [Google Scholar] [CrossRef]
- Gan, X.; Fernandez, I.C.; Guo, J.; Wilson, M.; Zhao, Y.; Zhou, B.; Wu, J. When to use what: Methods for weighting and aggregating sustainability indicators. Ecol. Indic. 2017, 81, 491–502. [Google Scholar] [CrossRef]
- OECD. Managing Environmental and Energy Transitions for Regions and Cities; OECD Publishing: Paris, France, 2020; Available online: https://www.oecd.org/cfe/managing-environmental-and-energy-transitions-for-regions-and-cities-f0c6621f-en.htm (accessed on 6 April 2021).
- Kremer, P.; Haase, A.; Haase, D. The future of urban sustainability: Smart, efficient, green or just? Introduction to the special issue. Sustain. Cities Soc. 2019, 51, 101761. [Google Scholar] [CrossRef]
- Adenaike, F.A.; Ibem, E.O.; Balogun, R.A.; Oladunjoye, K.G.K. Urban sustainability concepts and their implications on urban form. Urban Reg. Plan. 2018, 3, 27–33. [Google Scholar]
- Mayer, A.L. Strengths and weaknesses of common sustainability indices for multidimensional systems. Environ. Int. 2008, 34, 277–291. [Google Scholar] [CrossRef]
- Martin, C.; Evans, J.; Karvonen, A.; Paskaleva, K.; Yang, D.; Linjordet, T. Smart-sustainability: A new urban fix? Sustain. Cities Soc. 2019, 45, 640–648. [Google Scholar] [CrossRef]
- Yigitcanlar, T.; Kamruzzaman, M.; Foth, M.; Sabatini-Marques, J.; da Costa, E.; Ioppolo, G. Can cities become smart without being sustainable? A systematic review of the literature. Sustain. Cities Soc. 2019, 45, 348–365. [Google Scholar] [CrossRef]
- Bibri, S.E.; Krogstie, J. Smart sustainable cities of the future: An extensive interdisciplinary literature review. Sustain. Cities Soc. 2017, 31, 183–212. [Google Scholar] [CrossRef]
- Azevedo Guedes, A.L.; Carvalho Alvarenga, J.; Dos Santos Sgarbi Goulart, M.; Rodriguez y Rodriguez, M.V.; Pereira Soares, C.A. Smart cities: The main drivers for increasing the intelligence of cities. Sustainability 2018, 10, 3121. [Google Scholar] [CrossRef] [Green Version]
- Burck, J.; Ursula, H.; Bals, C.; Helling, V.; Höhne, N.; Nascimento, L. Climate Change Performance Index. Germanwatch, NewClimate Institute & Climate Action Network. 2020. Available online: https://ccpi.org/download/the-climate-change-performance-index-2021/ (accessed on 6 April 2021).
- World Energy Council. Energy Trilemma Index 2020. World Energy Council. 2020. Available online: https://www.worldenergy.org/publications/entry/world-energy-trilemma-index-2020 (accessed on 6 April 2021).
- Wendling, Z.A.; Emerson, J.W.; de Sherbinin, A.; Esty, D.C. 2020 Environmental Performance Index; Yale Center for Environmental Law & Policy: New Haven, CT, USA, 2020; Available online: https://epi.yale.edu/downloads/epi2020report20210112.pdf (accessed on 6 April 2021).
- World Economic Forum. Energy Transition Index 2021. Available online: https://www.weforum.org/reports/fostering-effective-energy-transition-2021 (accessed on 6 April 2021).
- Sharifi, A. A typology of smart city assessment tools and indicator sets. Sustain. Cities Soc. 2020, 53, 101936. [Google Scholar] [CrossRef]
- Feleki, E.; Vlachokostas, C.; Moussiopoulos, N. Characterisation of sustainability in urban areas: An analysis of assessment tools with emphasis on European cities. Sustain. Cities Soc. 2018, 43, 563–577. [Google Scholar] [CrossRef]
- Networked Society Lab. Networked Society City Index 2016. Ericsson 2016. Available online: https://www.ericsson.com/49ea27/assets/local/reports-papers/networked-society-insights/reports/2016-networked-society-city-index.pdf (accessed on 6 April 2021).
- European Commission. Green City Tool, European Green Capital. Available online: https://webgate.ec.europa.eu/greencitytool/topic/ (accessed on 6 April 2021).
- Buldeo Rai, H.; van Lier, T.; Meers, D.; Macharis, C. An indicator approach to sustainable urban freight transport. J. Urban. Int. Res. Placemaking Urban Sustain. 2018, 11, 81–102. [Google Scholar] [CrossRef]
- Abu-Rayash, A.; Dincer, I. Development of integrated sustainability performance indicators for better management of smart cities. Sustain. Cities Soc. 2021, 67, 102704. [Google Scholar] [CrossRef]
- Ali-Toudert, F.; Ji, L. Modeling and measuring urban sustainability in multi-criteria based systems—A challenging issue. Ecol. Indic. 2017, 73, 597–611. [Google Scholar] [CrossRef]
- Molinaro, R.; Najjar, M.K.; Hammad, A.W.; Haddad, A.; Vazquez, E. Urban Development Index (UDI): A Comparison between the City of Rio de Janeiro and Four Other Global Cities. Sustainability 2020, 12, 823. [Google Scholar] [CrossRef] [Green Version]
- Chen, Y.; Zhang, D. Evaluation of city sustainability using multi-criteria decision-making considering interaction among criteria in Liaoning province China. Sustain. Cities Soc. 2020, 59, 102211. [Google Scholar] [CrossRef]
- The China Urban Sustainability Index 2016. 2016. Available online: http://www.urbanchinainitiative.org/en/resources/report.html (accessed on 6 April 2021).
- Kılkış, Ş. Sustainable development of energy, water and environment systems index for Southeast European cities. J. Clean. Prod. 2016, 130, 222–234. [Google Scholar] [CrossRef]
- Shields, K.; Langer, H.; Watson, J.; Stelzner, K. European Green City Index. Assessing the Environmental Impact of Europe’s Major Cities; Siemens AG: München, Germany, 2009. [Google Scholar]
- Akande, A.; Cabral, P.; Gomes, P.; Casteleyn, S. The Lisbon ranking for smart sustainable cities in Europe. Sustain. Cities Soc. 2019, 44, 475–487. [Google Scholar] [CrossRef]
- Collins, A.J.; Jordan, C.A.; Robinson, R.M.; Cornelius, C.; Gore, R. Exploring good cycling cities using multivariate statistics. Environ. Syst. Decis. 2020, 40, 526–543. [Google Scholar] [CrossRef]
- Cohen, B. The Boyd-Cohen Smart City Index. Available online: https://www.fastcompany.com/3038818/the-smartest-cities-in-the-world-2015-methodology (accessed on 6 April 2021).
- 2thinknow. Innovation Cities™ Index 2019. Available online: https://www.innovation-cities.com/index-2019-global-city-rankings/18842/ (accessed on 6 April 2021).
- +CityxChange—Positive City ExChange, H2020—European Commission. Available online: https://cityxchange.eu/ (accessed on 6 April 2021).
- SPARCS—Sustainable Energy Positive & Zero cARbon CommunitieS, H2020—European Commission. Available online: https://www.sparcs.info/ (accessed on 6 April 2021).
- SHARING CITIES—Building Smart Cities Together, H2020—European Commission. Available online: https://www.sharingcities.eu/ (accessed on 6 April 2021).
- ATELIER—AmsTErdam BiLbao ciTizen Driven Smart Cities, H2020—European Commission. Available online: https://smartcity-atelier.eu/ (accessed on 6 April 2021).
- European Green Capital Award, (EGCA). Available online: https://ec.europa.eu/environment/europeangreencapital/about-the-award/ (accessed on 6 April 2021).
- Chao, A.L.; Gallego, A.C.; Lopez-Chao, V.; Alvarellos, A. Indicators Framework for Sustainable Urban Design. Atmosphere 2020, 11, 1143. [Google Scholar] [CrossRef]
- Berrone, P.; Ricart, J.E. IESE Cities in Motion Index 2020. Available online: https://media.iese.edu/research/pdfs/ST-0542-E.pdf (accessed on 6 April 2021).
- IMD. IMD Smart City Index 2020. Available online: https://www.imd.org/smart-city-observatory/smart-city-index/ (accessed on 6 April 2021).
- AT Kearney. The 2020 Global Cities Index. Available online: https://www.kearney.com/global-cities/2020 (accessed on 6 April 2021).
- MMF. Global Power City Index 2020. Available online: http://mori-m-foundation.or.jp/english/ius2/gpci2/index.shtml (accessed on 6 April 2021).
- Mercer’s Quality of Living Index 2020. Available online: https://mobilityexchange.mercer.com/quality-of-living (accessed on 6 April 2021).
- The Economist Intelligence Unit. The Global Livability Index 2019. Available online: https://www.eiu.com/topic/liveability (accessed on 6 April 2021).
- Li, X.; Fong, P.S.; Dai, S.; Li, Y. Towards sustainable smart cities: An empirical comparative assessment and development pattern optimization in China. J. Clean. Prod. 2019, 215, 730–743. [Google Scholar] [CrossRef]
- ESI Thoughtlab. Building a Hyperconnected City, a Global Research Initiative. Available online: https://econsultsolutions.com/wp-content/uploads/2019/11/ESITL_Building-a-Hyperconnected-City_Report.pdf (accessed on 6 April 2021).
- EasyPark. EasyPark Smart Cities Index 2019. Available online: https://easyparkgroup.com/smart-cities-index/ (accessed on 6 April 2021).
- Batten, J. Arcadis Sustainable Cities Index 2018. Available online: https://www.arcadis.com/campaigns/citizencentriccities/index.html (accessed on 6 April 2021).
- Phillis, Y.A.; Kouikoglou, V.S.; Verdugo, C. Urban sustainability assessment and ranking of cities. Comput. Environ. Urban Syst. 2017, 64, 254–265. [Google Scholar] [CrossRef]
- Marsal-Llacuna, M.L.; Colomer-Llinàs, J.; Meléndez-Frigola, J. Lessons in urban monitoring taken from sustainable and livable cities to better address the Smart Cities initiative. Technol. Forecast. Soc. Chang. 2015, 90, 611–622. [Google Scholar] [CrossRef]
- Giffinger, R.; Fertner, C.; Kramar, H.; Meijers, E. City-ranking of European medium-sized cities. Cent. Reg. Sci. Vienna UT 2007, 1–12. Available online: http://www.smartcity-ranking.eu/download/city_ranking_final.pdf (accessed on 6 April 2021).
- Manville, C.; Cochrane, G.; Cave, J.; Millard, J.; Pederson, J.K.; Thaarup, R.K.; Liebe, A.; Wissner, M.; Massink, R.; Kotterink, B. Mapping Smart Cities in the EU; European Parliament; Directorate General for Internal Policies; Policy Department Economic and Scientific Policy A: Brussel, Belgium, 2014. [Google Scholar]
- Manuel, A. Sustainable City Index 2014 (SCI 2.0). Sustainable Society Foundation. 2016. Available online: http://pie.pascalobservatory.org/sites/default/files/summary-sci2.0.pdf (accessed on 6 April 2021).
- United Nations Human Settlements Programme (UN-Habitat). State of the World’s Cities 2012/2013: Prosperity of Cities; Routledge: London, UK, 2013. [Google Scholar]
- Grant, K.A.; Chuang, S. An aggregating approach to ranking cities for knowledge-based development. Int. J. Knowl. Based Dev. 2012, 3, 17–34. [Google Scholar] [CrossRef]
- Shnapp, S.; Paci, D.; Bertoldi, P. Enabling Positive Energy Districts across Europe: Energy Efficiency Couples Renewable Energy; Publication Office of the European Union: Luxembourg, 2020. [Google Scholar]
- Bossi, S.; Gollner, C.; Theierling, S. Towards 100 Positive Energy Districts in Europe: Preliminary Data Analysis of 61 European Cases. Energies 2020, 13, 6083. [Google Scholar] [CrossRef]
- POCITYF—A Positive Energy CITY Transformation Framework, H2020—European Commission. Available online: https://pocityf.eu/ (accessed on 6 April 2021).
- RESPONSE—IntegRatEd Solutions for Positive Energy and Resilient CitiEs, H2020—European Commission. Available online: https://response-project.eu/ (accessed on 6 April 2021).
- Recharge EU: How Many Charge Points Will Europe and Its Member States Need in the 2020s; European Federation for Transport and Environment AISBL: Belgium, Belgium, 2020.
- Toli, A.M.; Murtagh, N. The concept of sustainability in smart city definitions. Front. Built Environ. 2020, 6, 77. [Google Scholar] [CrossRef]
- UNECE. Sustainable Smart Cities. Available online: https://unece.org/housing/sustainable-smart-cities (accessed on 22 June 2021).
- Pelenc, J.; Dedeurwaerdere, T. Brief for GSDR 2015: Weak Sustainability Versus Strong Sustainability. 2015. Brief for the Global Sustainable Development Report [Online]. Available online: https://sustainabledevelopment.un.org/content/documents/6569122-Pelenc-Weak%20Sustainability%20versus%20Strong%20Sustainability.pdf (accessed on 23 June 2021).
- Joint Research Centre-European Commission; OECD. Handbook on Constructing Composite Indicators: Methodology and User Guide; OECD Publishing: Paris, France, 2008. [Google Scholar]
- Zhou, L.; Tokos, H.; Krajnc, D.; Yang, Y. Sustainability performance evaluation in industry by composite sustainability index. Clean Technol. Environ. Policy 2012, 14, 789–803. [Google Scholar] [CrossRef]
- Angelakoglou, K.; Gaidajis, G. A conceptual framework to evaluate the environmental sustainability performance of mining industrial facilities. Sustainability 2020, 12, 2135. [Google Scholar] [CrossRef] [Green Version]
- Gaidajis, G.; Angelakoglou, K. Sustainability of industrial facilities through water indicators. Environ. Process. 2016, 3, 91–103. [Google Scholar] [CrossRef]
- Moldan, B.; Janoušková, S.; Hák, T. How to understand and measure environmental sustainability: Indicators and targets. Ecol. Indic. 2012, 17, 4–13. [Google Scholar] [CrossRef]
- D’Agostino, D.; Zangheri, P.; Cuniberti, B.; Paci, D.; Bertoldi, P. Synthesis Report on the National Plans For Nearly Zero Energy Buildings (NZEBs); Joint Research Center (JRC) Publications: Brussels, Belgium, 2016. [Google Scholar]
- D’agostino, D.; Zangheri, P.; Castellazzi, L. Towards nearly zero energy buildings in Europe: A focus on retrofit in non-residential buildings. Energies 2017, 10, 117. [Google Scholar] [CrossRef]
- McClelland, G. Equal versus Differential Weighting for Multiattribute Decisions: There Are No Free Lunches; Technical report; Colorado Univ at Boulder Center for Research on Judgment and Policy: Boulder, CO, USA, 1978. [Google Scholar]
- Geniaux, G. Sustainable Development Indicator Frameworks and Initiatives; Technical report; Seamless: Paris, France, 2009. [Google Scholar]
- Nardo, M.; Saisana, M.; Saltelli, A.; Tarantola, S. Tools for composite indicators building. European Commission, EUR 21682 EN. In Institute for the Protection and Security of the Citizen; JRC: Ispra, Italy, 2005. [Google Scholar]
- Hermans, E.; Van den Bossche, F.; Wets, G. Combining road safety information in a performance index. Accid. Anal. Prev. 2008, 40, 1337–1344. [Google Scholar] [CrossRef] [Green Version]
- Muldur, U. Technical Annex on Structural Indicators. In Two Composite Indicators to Assess the Progress of Member States in their Transition towards a Knowledge-Based Economy; DG DG Research (Europäische Kommission): Brussels, Belgium, 2001. [Google Scholar]
- Kaufmann, D.; Kraay, A.; Zoido-Lobatón, P. Aggregating Governance Indicators; World Bank Policy Research Working Paper No. 2195; World Bank: Washington, DC, USA, 1999. [Google Scholar]
- Ülengin, B.; Ülengin, F.; Güvenç, Ü. A multidimensional approach to urban quality of life: The case of Istanbul. Eur. J. Oper. Res. 2001, 130, 361–374. [Google Scholar] [CrossRef]
- Moldan, B.; Billharz, S.; Matravers, R. Sustainability Indicators. A Report on the Project on Indicators of Sustainable Development; John Wiley & Sons: Chichester, UK, 1997. [Google Scholar]
- Ahlers, D.; Driscoll, P.; Wibe, H.; Wyckmans, A. Co-creation of positive energy blocks. In IOP Conference Series: Earth and Environmental Science; IOP Publishing: Bristol, UK, 2019; Volume 352, p. 012060. [Google Scholar]
- Chen, L.; Pu, P. Survey of Preference Elicitation Methods; EPFL Technical Report IC/2004/67; HCI: Cham, Switzerland, 2004. [Google Scholar]
- Beliakov, G.; Pradera, A.; Calvo, T. Aggregation Functions: A Guide for Practitioners; Springer: Heidelberg, Germany, 2007; Volume 221. [Google Scholar]
- Pollesch, N.; Dale, V.H. Applications of aggregation theory to sustainability assessment. Ecol. Econ. 2015, 114, 117–127. [Google Scholar] [CrossRef] [Green Version]
- Guitouni, A.; Martel, J.M. Tentative guidelines to help choosing an appropriate MCDA method. Eur. J. Oper. Res. 1998, 109, 501–521. [Google Scholar] [CrossRef]
- Munda, G.; Nardo, M. Noncompensatory/nonlinear composite indicators for ranking countries: A defensible setting. Appl. Econ. 2009, 41, 1513–1523. [Google Scholar] [CrossRef] [Green Version]
- Wang, X.; Salat, S.; Arup; Painte, D. Urban Sustainability Framework; Global Platform for Sustainable Cities & World Bank: Washington, DC, USA, 2018. [Google Scholar]
- Gong, W.; Lyu, H. Belt & Road Initiative—Developing Green Economies for cities (BRIDGE)—Sustainable City Indexing: Towards the Creation of an Assessment Framework for Inclusive and Sustainable Urban-Industrial Development. Available online: https://www.unido.org/sites/default/files/files/2018-02/BRIDGE%20for%20Cities_Issue%20Paper_2.pdf (accessed on 6 April 2021).
- The New Urban Agenda. Available online: https://habitat3.org/the-new-urban-agenda/ (accessed on 6 April 2021).
- Coalition for Urban Transitions. Available online: https://urbantransitions.global/ (accessed on 6 April 2021).
- European Commission. The European Green Deal; COM (2019) 640 Final; EC: Brussels, Belgium, 2019. [Google Scholar]
- Citykeys. Available online: http://www.citykeys-project.eu/ (accessed on 6 April 2021).
- Reinventing Cities: Guidance to Design a Low-Carbon, Sustainable and Resilient Project. Available online: https://www.c40reinventingcities.org/en/professionals/guidelines/ (accessed on 6 April 2021).
| Index | Description | # of Ind. | Dimensions | Pros | Cons |
|---|---|---|---|---|---|
| European Green Capital Award (2010–2021) [60] | Extension of the Green City Index (2009). It provides with an assessment and benchmarking analysis about green and sustainable performance of the European cities | N/A | Air Quality, Energy, Mobility, Climate Change Mitigation, Climate Change Adaptation, Nature, Noise, Governance, Water, Green growth and innovation, Land Use, and Waste | Enables sharing of experiences and best practices among cities; Introduces in parallel an award for the medium-sized cities-the European Green Leaf and the Green City Tool; Motivates cities | Not based on all aspects of urban sustainability/focuses on environmental sustainability; Not suitable for global benchmarking, as it is EU-based index and tool; |
| Indicators Framework for Sustainable Urban Design 2020 [61] | A general diagnosis of the sustainable nature of the urban environment, that considers 32 different scope-oriented international frameworks and tools to investigate the strongest and weakest points of sustainability, using 4 main sub-indices: social, environmental, economic, governance | 48 | Energy, Waste, Water, Pollution, Mobility and Transport, Plan and Design, Site and Land; Social aspects, Governance Management, City Planning and Innovation, Transparency; Economy’s Local Aspect, Labor and Finance | Strong sustainability perspective; Based on the TBL pillar while including also governance aspects as a 4th key sustainability pillar; Selects indicators via using and analyzing both worldwide-accepted and less-used frameworks; Alignment with SDGs; | Not sufficient for smartness aspects; No evaluation metrics nor calculation methodology for the index is provided; The list of indicators is not final due to data availability issues; |
| REMOURBAN Framework for Smartness and Sustainability in Cities 2020 [22] | An holistic evaluation approach of an Urban Regeneration Model using two composite indices and 3 measurable objectives towards smart (Sm) and sustainable (Su) transformation of the engaged cities, based on existing knowledge from other SCC projects, ISO standards, SDGs, etc. | 104 | Urban Space, Mobility and Transport, Building and Housing, Air Quality, Energy, Water and Waste, Economy, Social and Well-being, Governance and Institutional | Two levels of evaluation: city level and project level; Assesses both sustainability and smartness; Accompanied by the “STILE” web-based tool that calculates and visualizes project results and city progress and creates base-cases; Includes metrics related with SDGs; | Project-specific framework based only on defined KPIs; Limited holistic evaluation in terms of sustainability potential; Indirect evaluation of project’s success against its own goals |
| IESE Cities in Motion Index (CIMI) 2020 [62] | Measurement of city sustainability and smartness with regard to the quality of life of their inhabitants, and ranking of 174 cities, 79 of which are capitals | 101 | Human capital, Social cohesion, Economy, Governance, Environment, Mobility and Transport, Urban Planning, International Outreach, Technology | Broad geographical coverage across 80 countries; In-depth research based on interviews with city leaders and research experts; Identifies the Strengths and Weaknesses of the 174 cities | Lack of data for some indicators; Indicators related to country-level were assigned to city-level; The number of variables included may be insufficient to capture the complexity of each dimension; |
| IMD-SUTD Smart City Index 2020 [63] | Ranks 109 cities worldwide based on 2 smart pillars and 5 key dimensions by capturing the perceptions of 120 residents in each city | 39 | Health and Safety, Mobility, Activities, Opportunities, and Governance | Recognizes that not all cities start from the same development level, nor with same set of advantages; Considers priority areas for cities | Not evaluating key sustainability aspects, e.g., environmental, climate, and energy performance; Inconsistency of data in some cases |
| The Global Cities Index (GCI) 2020 [64] | Measures the international standing of 151 cities globally across five dimensions, resulting in city rankings in terms of business opportunities and economic innovation | 29 | Business Activity, Human Capital, Information Exchange, Cultural Experience, Political Engagement | Outlines new challenges and priorities in the business sector; Provides a snapshot of how COVID-19 has shattered the status-quo; Reflects emerging geographies | Focuses only on business innovation and economy; Not primarily based on smart city technology and urban sustainability pertaining to environmental issues |
| Global Power City Index (GPCI) 2020 [65] | Evaluates and ranks major cities of the world (48) according to their comprehensive power level in terms of average well-being and access to urban facilities, in order to attract people, capital, and enterprises | 70 | Economy, Research and Development, Cultural Interaction, Liveability, Environment, Accessibility | Function-specific ranking; Focuses on the development state of cities including a broad set of factors; Examines changes in working styles and people commuting owing to COVID-19 | Does not address sufficiently smartness aspects; Includes a limited number of indicators for energy performance, governance, etc.; Differs conceptually with the 3-pillar sustainability approach |
| Urban Development Index (UDI) 2020 [47] | Aims to measure the level of sustainable development in the city of Rio-de-Janeiro via benchmarking with other four cities, based on an equal weighting approach | 32 | Capitalizing on 4 knowledge-based urban development (KBUD) pillars: economy, society, environment, and governance | Provides a baseline for how a city is positioned in relation to others and determines how to improve its urban performance; comprehensive structure of 8 target groups | Does not entail resource efficiency, energy transition and climate change aspects; Renewable energy and air quality indicators not included; Data used from other indices |
| Mercer’s Quality of Living City Ranking (QoL) 2020 [66] | Assesses living conditions for 140 cities against generally accepted standards and gives recommendations to potential employees for assigned destinations | 39 | Political and social, economic, socio-cultural, health, education, public services and transportation, recreation, consumer goods, housing, natural environment | City-to-city index comparison that quantifies the difference in the quality of living between any two cities; Provision of data on quality of living that help employees sent to work abroad, students, etc. | Not suitable for evaluating overall sustainable development progress nor smartness; Not including aspects pertaining to resource efficiency, technology, energy, and climate targets |
| The Global Liveability Index (GLI) 2019 [67] | Assesses which locations among 140 cities worldwide provide the best or the worst living conditions based on 5 evaluation areas | 30 | Stability, Healthcare, Culture and Environment, Education, Infrastructure | Quantifies the challenges to an individual’s lifestyle in any given location, and allows for direct comparison between locations | Based on living conditions; Not adequate focus on sustainability and smartness; differs conceptually with the 3-pillar approach |
| Lisbon ranking for smart sustainable cities (LRSC) 2019 [52] | Ranks 28 European capital cities based on how smart and sustainable they are by using data from a single open database (Eurostat), and conducting hierarchical clustering and PCA | 32 | TBL-oriented: Economy, Environment, Society further broken down into six smartness topics each; Linked to UNECE-ITU Smart Sustainable Cities Framework | Validated with other urban ranking systems; Highlights the top 3 indicators with impact on ranking; Sensitivity analysis associates the cities’ score with key variables, such as location, population | Does not cover adequately some themes of smart and sustainable cities; Limited set of final variables selected to characterize city smartness and sustainability |
| Smart Sustainable Cities China (SSCC) 2019 [68] | Assesses and analyzes the development state of 35 smart cities in China by combining principal component analysis (PCA) and back propagation (BP) techniques | 22 | Technological Innovation, Smart Economy, Smart Infrastructure, Smart Services, Smart Mobility, Smart Environment | Introduces a factor-driven smart development pattern for cities; The PCA-BP neural network combination optimizes the validity of the system evaluation | Focuses on technology or does not cover sufficiently all parts of smart and sustainable cities (e.g., climate and energy performance of cities) |
| ESI Thoughtlab Hyper-connected City Index 2019 [69] | Benchmarks data from 100 cities, in order to provide an evidence-based roadmap that cities can use to become hyperconnected urban centers of the future | 37 | Technology, Data, and analytics Cybersecurity, Citizen connectivity and engagement | Universal spatial scope (cities from 52 countries worldwide); Barriers for cities identified; Coherent information and analysis and inputs from survey and interviews | Major focus on smart city technology and economy, thus it does not adequately address key sustainability aspects |
| EasyPark Smart Cities Index 2019 [70] | Performs a sophisticated analysis of the world’s most technologically advanced cities, offering a clear city-to-city breakdown of key indicators and ranking the top 100 | 24 | Transport and Mobility, Sustainability, Governance, Economy, Digitalization, Cybersecurity, Living Standard, Expert Perception | Covers a wide range of regions, prioritizing capitals and financial centers; Offers interesting insights into smart infrastructure and smart city technology in cities | Does not address adequately urban sustainability aspects; Lack of climate and energy performance related with key policies; Major emphasis on technology |
| Arcadis Sustainable Cities Index (SCI) 2018 [71] | Explores city sustainability from the perspective of the citizen and investigates how different cities enable different citizen groups to meet their particular needs | 32 | TBL: Social, Environmental, Economic | Aligned to the SDGs and tracks progress against commitments; Introduces city clusters based on eight archetypes highlighting how cities are perceived by citizens | Several indicators have outlying values; In some cases only national-level data are taken (instead of city-based) |
| Sustainability Assessment Fuzzy Evaluation (SAFE) 2017 [72] | Assesses the sustainability of 106 cities worldwide as a function of two main inputs, ecology and well-being | 46 | Ecological input: air, land, and water; Well-being input: economy, education, health, and civic environment | Grouping of cities according to geography and economy; sensitivity analysis identifies inputs that most affect sustainability | Does not address smartness aspects, e.g., smart infrastructure, technology, energy, mobility, etc. |
| Ericsson Networked Society City Index (NSCI) 2016 [42] | Measures the performance of 41 cities from two perspectives: their maturity in ICT and TBL, with particular regard to sustainable urban development in a connected society | 49 | TBL development and ICT maturity both divided into three dimensions: social-economic-environment and ICT infrastructure, ICT affordability, ICT usage | Combines properly technology and sustainability aspects; Introduces the city boundaries concept to capture how cities perform in relation to absolute targets; Online tool; Worldwide spatial scope | Limited number of cities; Difficulties and constraints may be occurred when adding new cities; Provides only a ranking of cities while not offering score-based evaluation per dimension or indicator |
| The China Urban Sustainability Index 2016 (USI) [49] | Examines the sustainability level of 185 Chinese cities of different sizes and various development stages with emphasis on societal and environmental indicators | 23 | Economy, Society, Resources, and Environment | Includes all levels of cities and reflects the full China’s landscape; Acts as a means of quantifying urban growth and development, rather than a static benchmarking tool | Does not adequately address smartness aspects; Based on the national laws of China for urban sustainability |
| Sustainable Development of Energy, Water, and Environment Systems Index (SDEWES) 2015 [50] | Benchmarks the performance of 120 cities across energy, water, and environment systems towards promoting policy learning, action, and cooperation and bringing cities closer to sustainable development | 35 | Energy and Climate, CO2 emissions, Water Usage, Environmental Quality, Urban Planning, R&D and Policy | Best practices are identified based on the top cities in each dimension; City pairing for policy learning; Increased geographical diversity; Aligned with city goals/SDGs; Mapping cities in an Atlas /interactive table of results | Smart technology aspects not sufficiently included; Main focus on energy, climate and environmental sustainability while not addressing economic and business issues |
| Local Agenda 21 Synthetic Index 2015 [73] | A synthetic index based on the Local Agenda 21 concept for the city of Barcelona and related sustainability and quality of life aspects, using PCA for the analysis, as well as the aggregation of a set of indicators, towards summarizing smart city performance | 24 | Green spaces and biodiversity, Public space, Mobility, Environmental, and Air Quality, Energy, and Natural Resources, Waste, Social Cohesion, Economic Activity, Culture, Education, Cooperation | Proposes real-time data monitoring instead of usage of historical stats; Physical and non-physical data and highly correlated indicators; Compliance with LA 21 objectives; Highlights the need for smartness and intelligence aspects; | Limited scope and evaluation with the final used set of indicators; No calculation methodology for the index is provided; Not suitable for comparability of cities nor projects; |
| Smart Cities Ranking of European Medium-sized Cities 2014 [74] | Ranks and provides an analysis of the characteristics of 77 medium cities in Europe showing their strengths and weaknesses by measuring smart city outcomes against 6 smart city dimensions | 74 | Smart Economy, Smart People, Smart Mobility, Smart Living, Smart Environment, Smart Governance | It considers the challenges of smaller cities which might be unexplored to a certain extent; Provides with benchmarking and ranking | Multiple data sources—indicators coming both from the urban (local) but also from the national level; Averaging indicators at all levels |
| Mapping Smart Cities in the EU 2014 [75] | Entails 88 smart city initiatives in 20 smart cities (after a sampling hierarchy) to explore their contribution to the goals of the 2020 European strategy | N/A | Smart Economy, Smart People, Smart Mobility, Smart Living, Smart Environment, Smart Governance | Project-based evaluation; Aligned with EU strategy 2020; | Assesses cities against country’s coverage of characteristics relative to an ideal of 100% coverage |
| Boyd-Cohen Smart City Index Master Indicators 2014 [54] | Presents a total score of smart city performance of 120 eligible cities across the globe, based on the Smart Cities while properly considering also sustainability issues | 62 | Economy, People, Mobility, Living, Governance, Environment | Entails a multitude of indicators addressing most of the factors of smart and sustainable cities; Universal spatial scope in tandem with regional characteristics | Lack of a unified approach-uses and combines data from individual indicators and other indices, e.g., Mercer, Innovation Cities Index; Indicator averaging at each level |
| Sustainable City Index 2.0 (SCI 2.0) 2014 [76] | Evaluates 403 Dutch cities showing at a glance the level of their sustainability | 24 | Economic Well-being, Environmental Well-being and Resources circularity, Human Well-being | Examines thoroughly the correlation between various indicators; Results can also be aggregated to the provinces’ level | Does not include governance aspects; Several data sources |
| UN-Habitat’s City Prosperity Index (CPI) 2012 [77] | Evaluates the degree of prosperity in the cities of the world based on the concept of the wheel of urban prosperity, a conceptual matrix that symbolises the well-balanced development across five spokes | 17 | Productivity, Infrastructure Development, Quality of Life, Equity and Social Inclusion, Environmental Sustainability, Urban Governance, and Legislation | Aids the design of effective policy interventions; Allows to evaluate, and report on city progress towards the implementation of the SD Agenda 2030; Depicts the strengths or weaknesses of prosperity factors | Does not address smartness aspects, e.g., smart infrastructure, technology, energy, mobility, etc. |
| CITYWEB Index 2012 (CityCard) [78] | Evaluates and ranks performance of cities against city concepts. Each city receives a score out of 100 in five city development models and a total grade out of 500 | 21 | Global Cities; Nice Cities; Knowledge-intensive networks; Intelligent Cities; Creative Cities; | Highlights specific areas where a city can be improved; Equally useful to individuals, businesses, academics and governments; Includes both quantitative and qualitative factors (well-balanced) | Weighting issues; Lack of consistency of the data Lack of data for some categories or cities; Overlap of some indicators |
Publisher’s Note: MDPI stays neutral with regard to jurisdictional claims in published maps and institutional affiliations. |
© 2021 by the authors. Licensee MDPI, Basel, Switzerland. This article is an open access article distributed under the terms and conditions of the Creative Commons Attribution (CC BY) license (https://creativecommons.org/licenses/by/4.0/).
Share and Cite
Kourtzanidis, K.; Angelakoglou, K.; Apostolopoulos, V.; Giourka, P.; Nikolopoulos, N. Assessing Impact, Performance and Sustainability Potential of Smart City Projects: Towards a Case Agnostic Evaluation Framework. Sustainability 2021, 13, 7395. https://doi.org/10.3390/su13137395
Kourtzanidis K, Angelakoglou K, Apostolopoulos V, Giourka P, Nikolopoulos N. Assessing Impact, Performance and Sustainability Potential of Smart City Projects: Towards a Case Agnostic Evaluation Framework. Sustainability. 2021; 13(13):7395. https://doi.org/10.3390/su13137395
Chicago/Turabian StyleKourtzanidis, Konstantinos, Komninos Angelakoglou, Vasilis Apostolopoulos, Paraskevi Giourka, and Nikolaos Nikolopoulos. 2021. "Assessing Impact, Performance and Sustainability Potential of Smart City Projects: Towards a Case Agnostic Evaluation Framework" Sustainability 13, no. 13: 7395. https://doi.org/10.3390/su13137395