
Economies of Scale and Perceived Corruption in Natural Resource Management: A Comparative Study between Ukraine, Romania, and Iceland

 ,
,
Abstract
:1. Introduction
2. Materials and Methods
2.1. Case Study Approach
2.2. Case Study Selection
2.3. Methods of Data Collection
2.4. Data Analysis
3. Results
3.1. Arable Land Ownership in Ukraine
3.1.1. Consolidation of Companies in the Agriculture Sector
3.1.2. Socioeconomic Conditions of Small-Scale Farmers
3.1.3. Summary of the Ukrainian Case
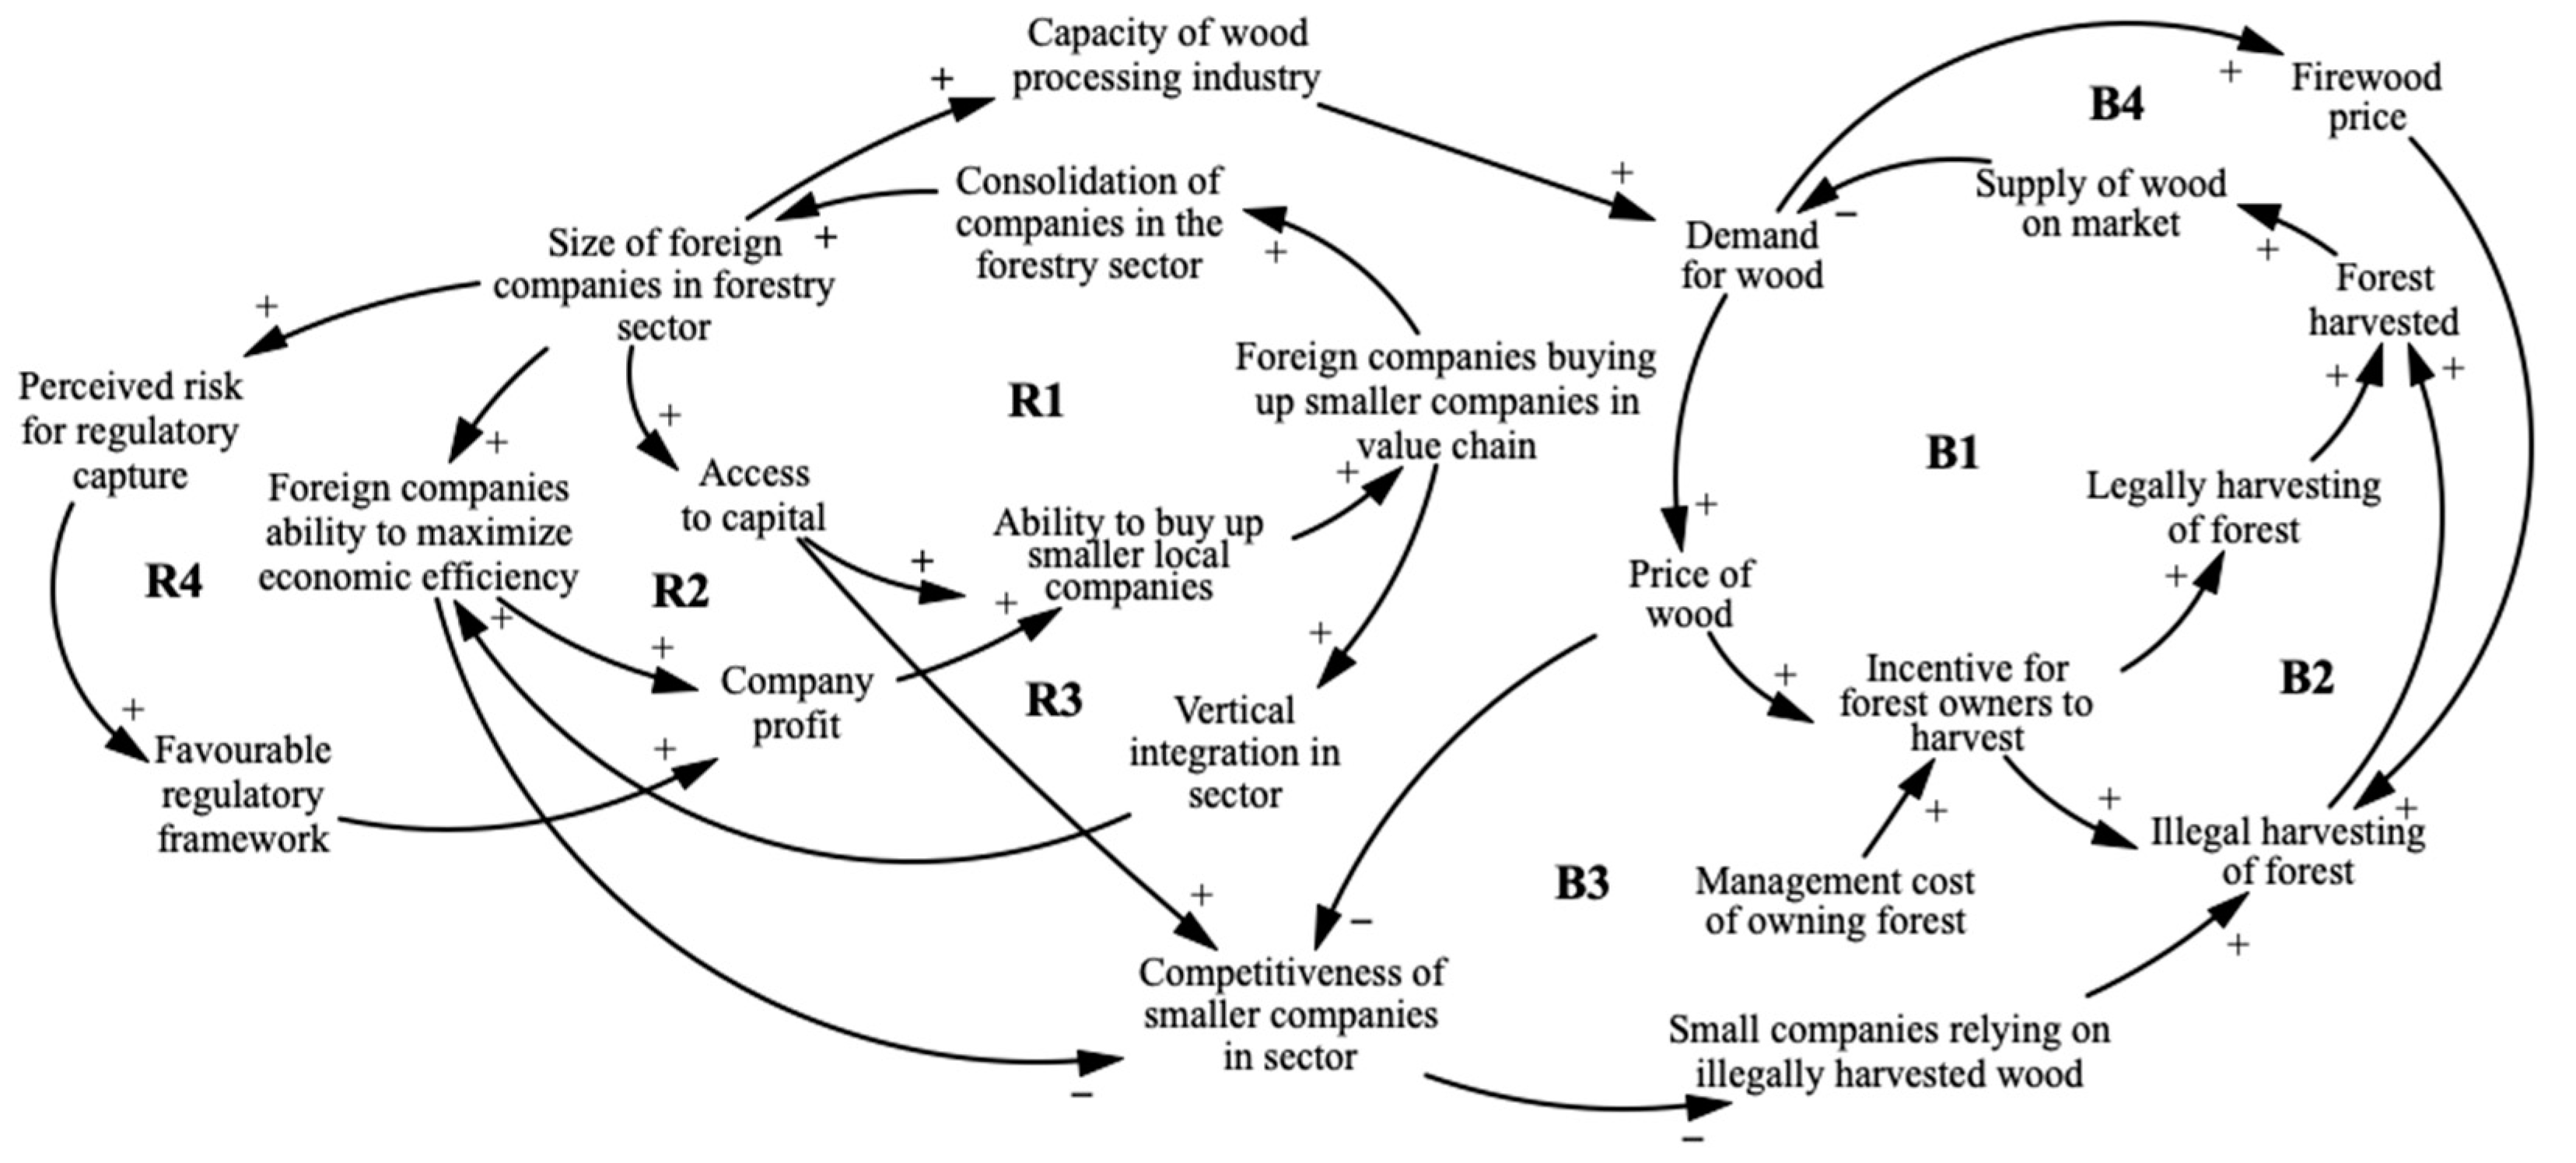
3.2. The Romanian Forestry Sector
3.2.1. Forest Management
3.2.2. Consolidation in the Forestry Sector
3.2.3. Smaller Actors in the Forestry Sector
3.2.4. Summary of the Romanian Case
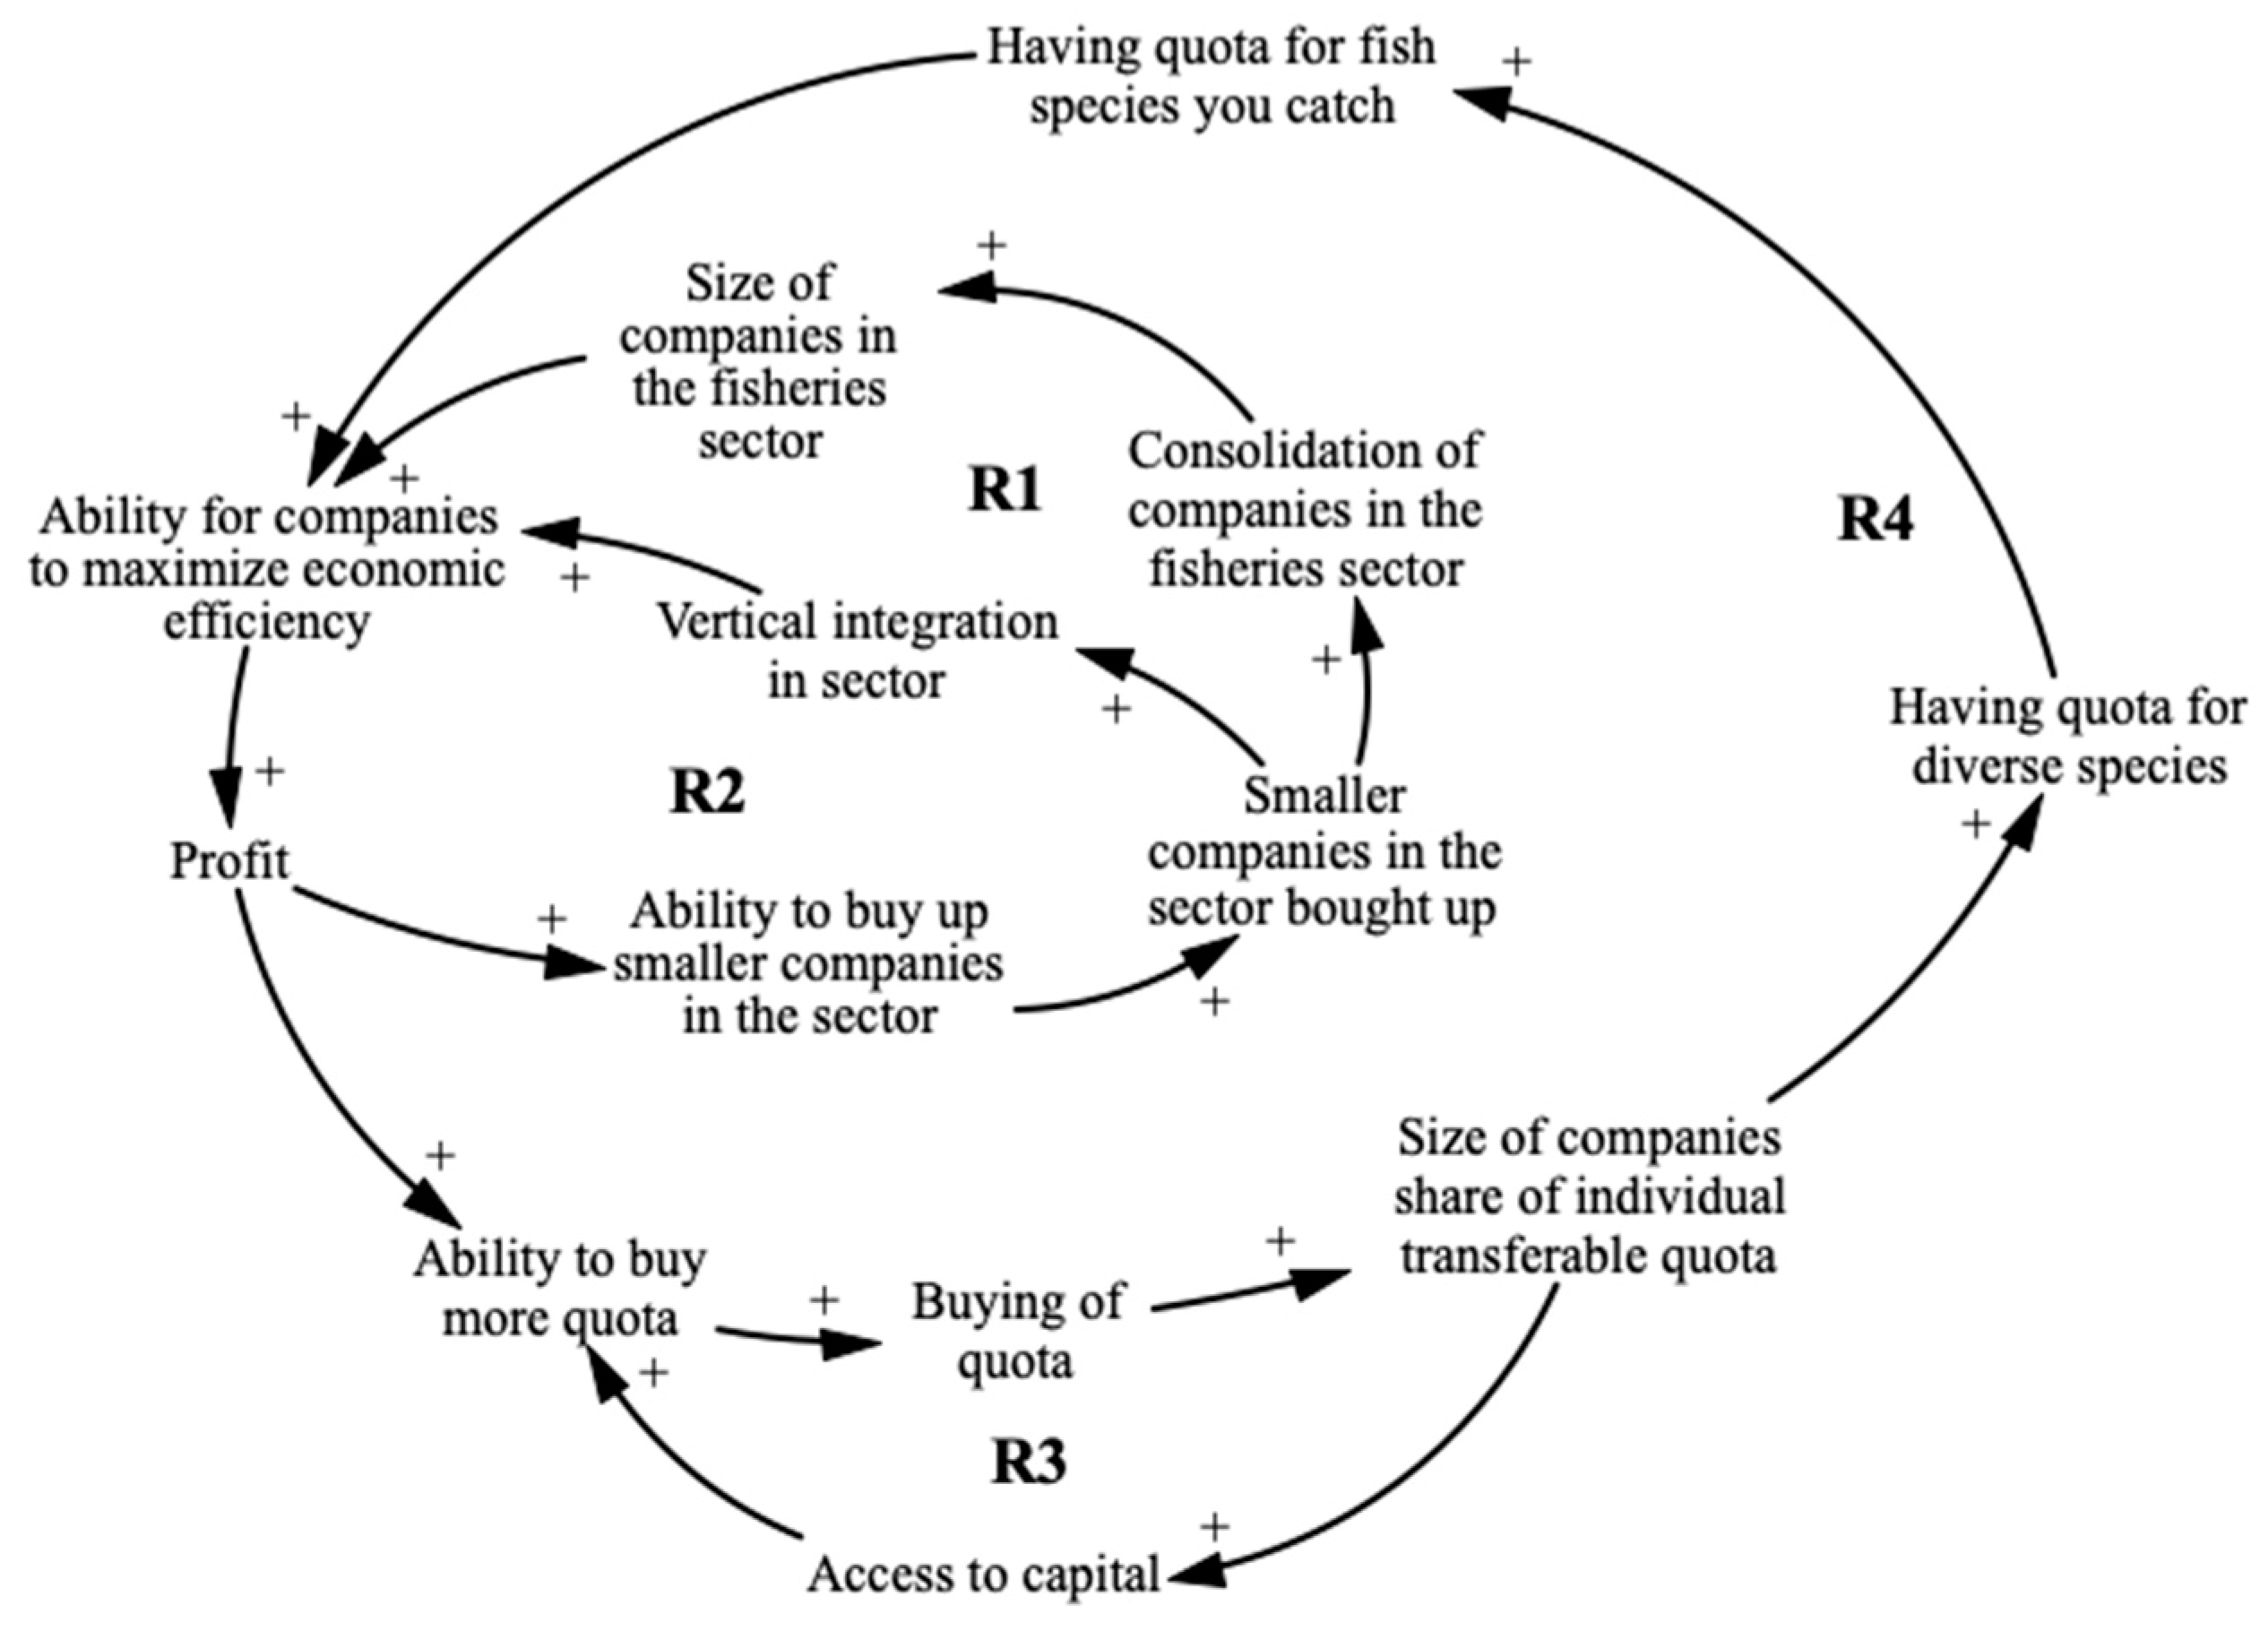
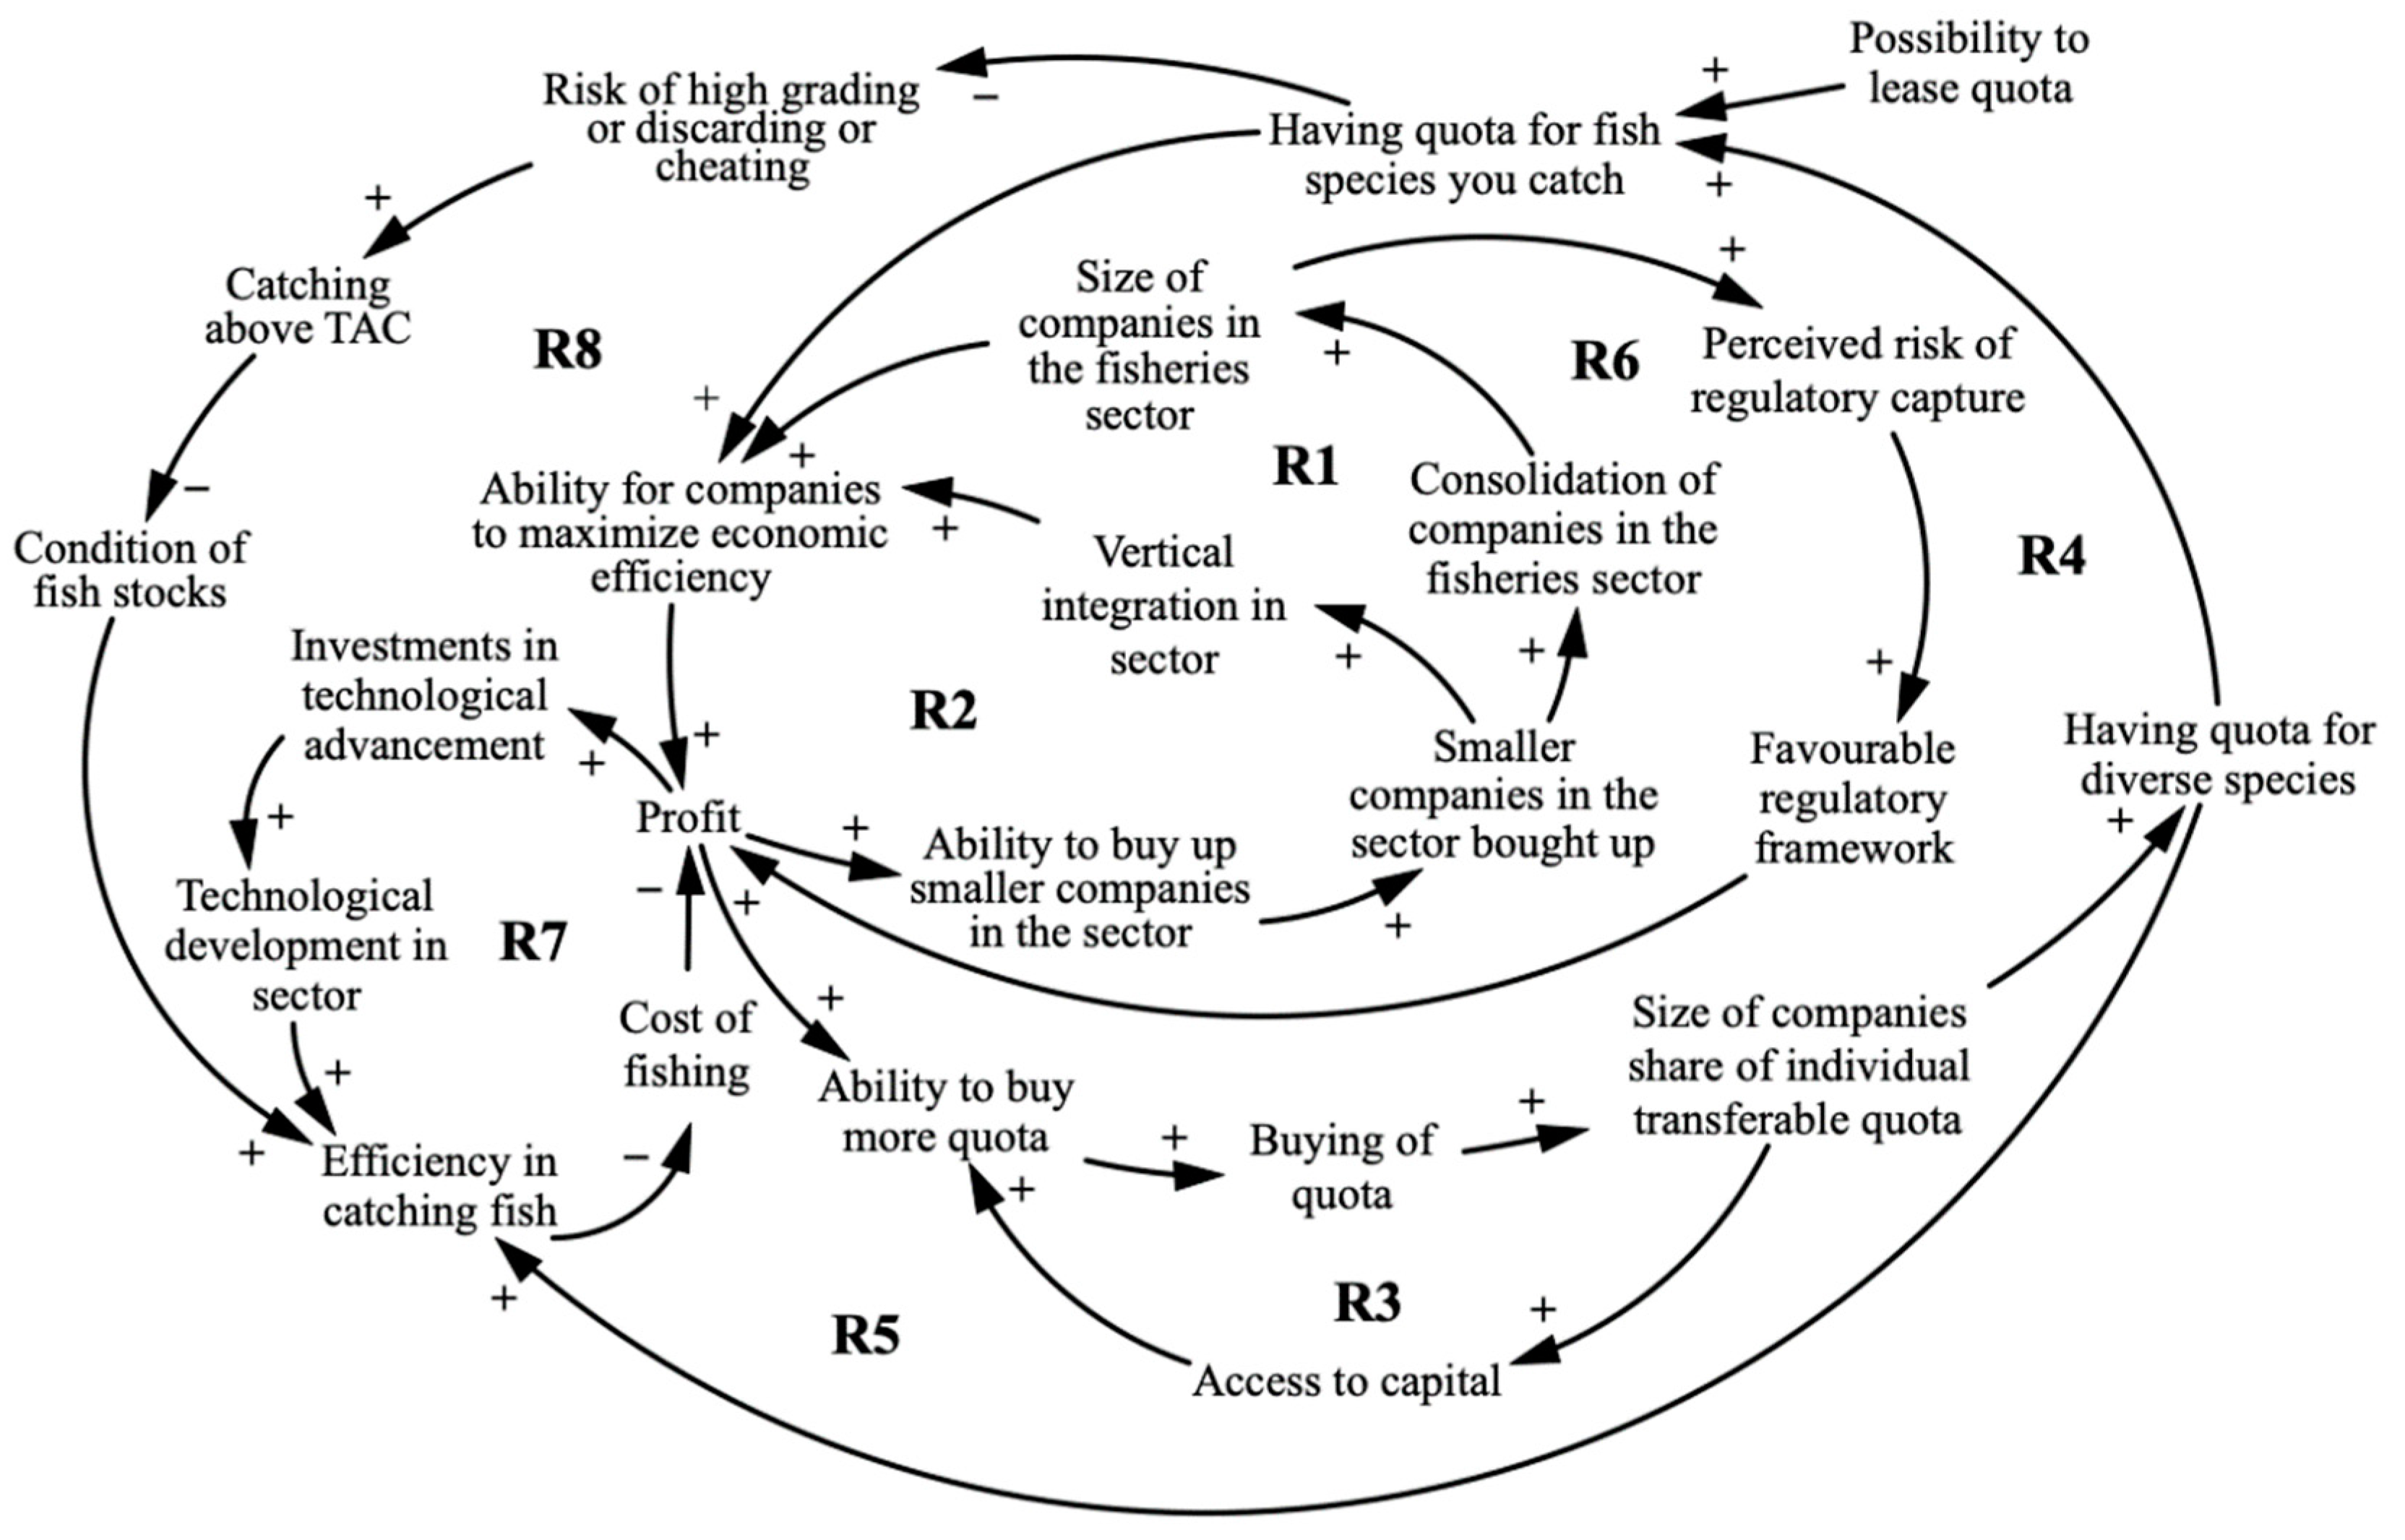
3.3. The Icelandic Fisheries Sector
3.3.1. The Icelandic ITQ System
3.3.2. Consolidation of Companies in the Fisheries Sector
3.3.3. Summary of the Icelandic Case
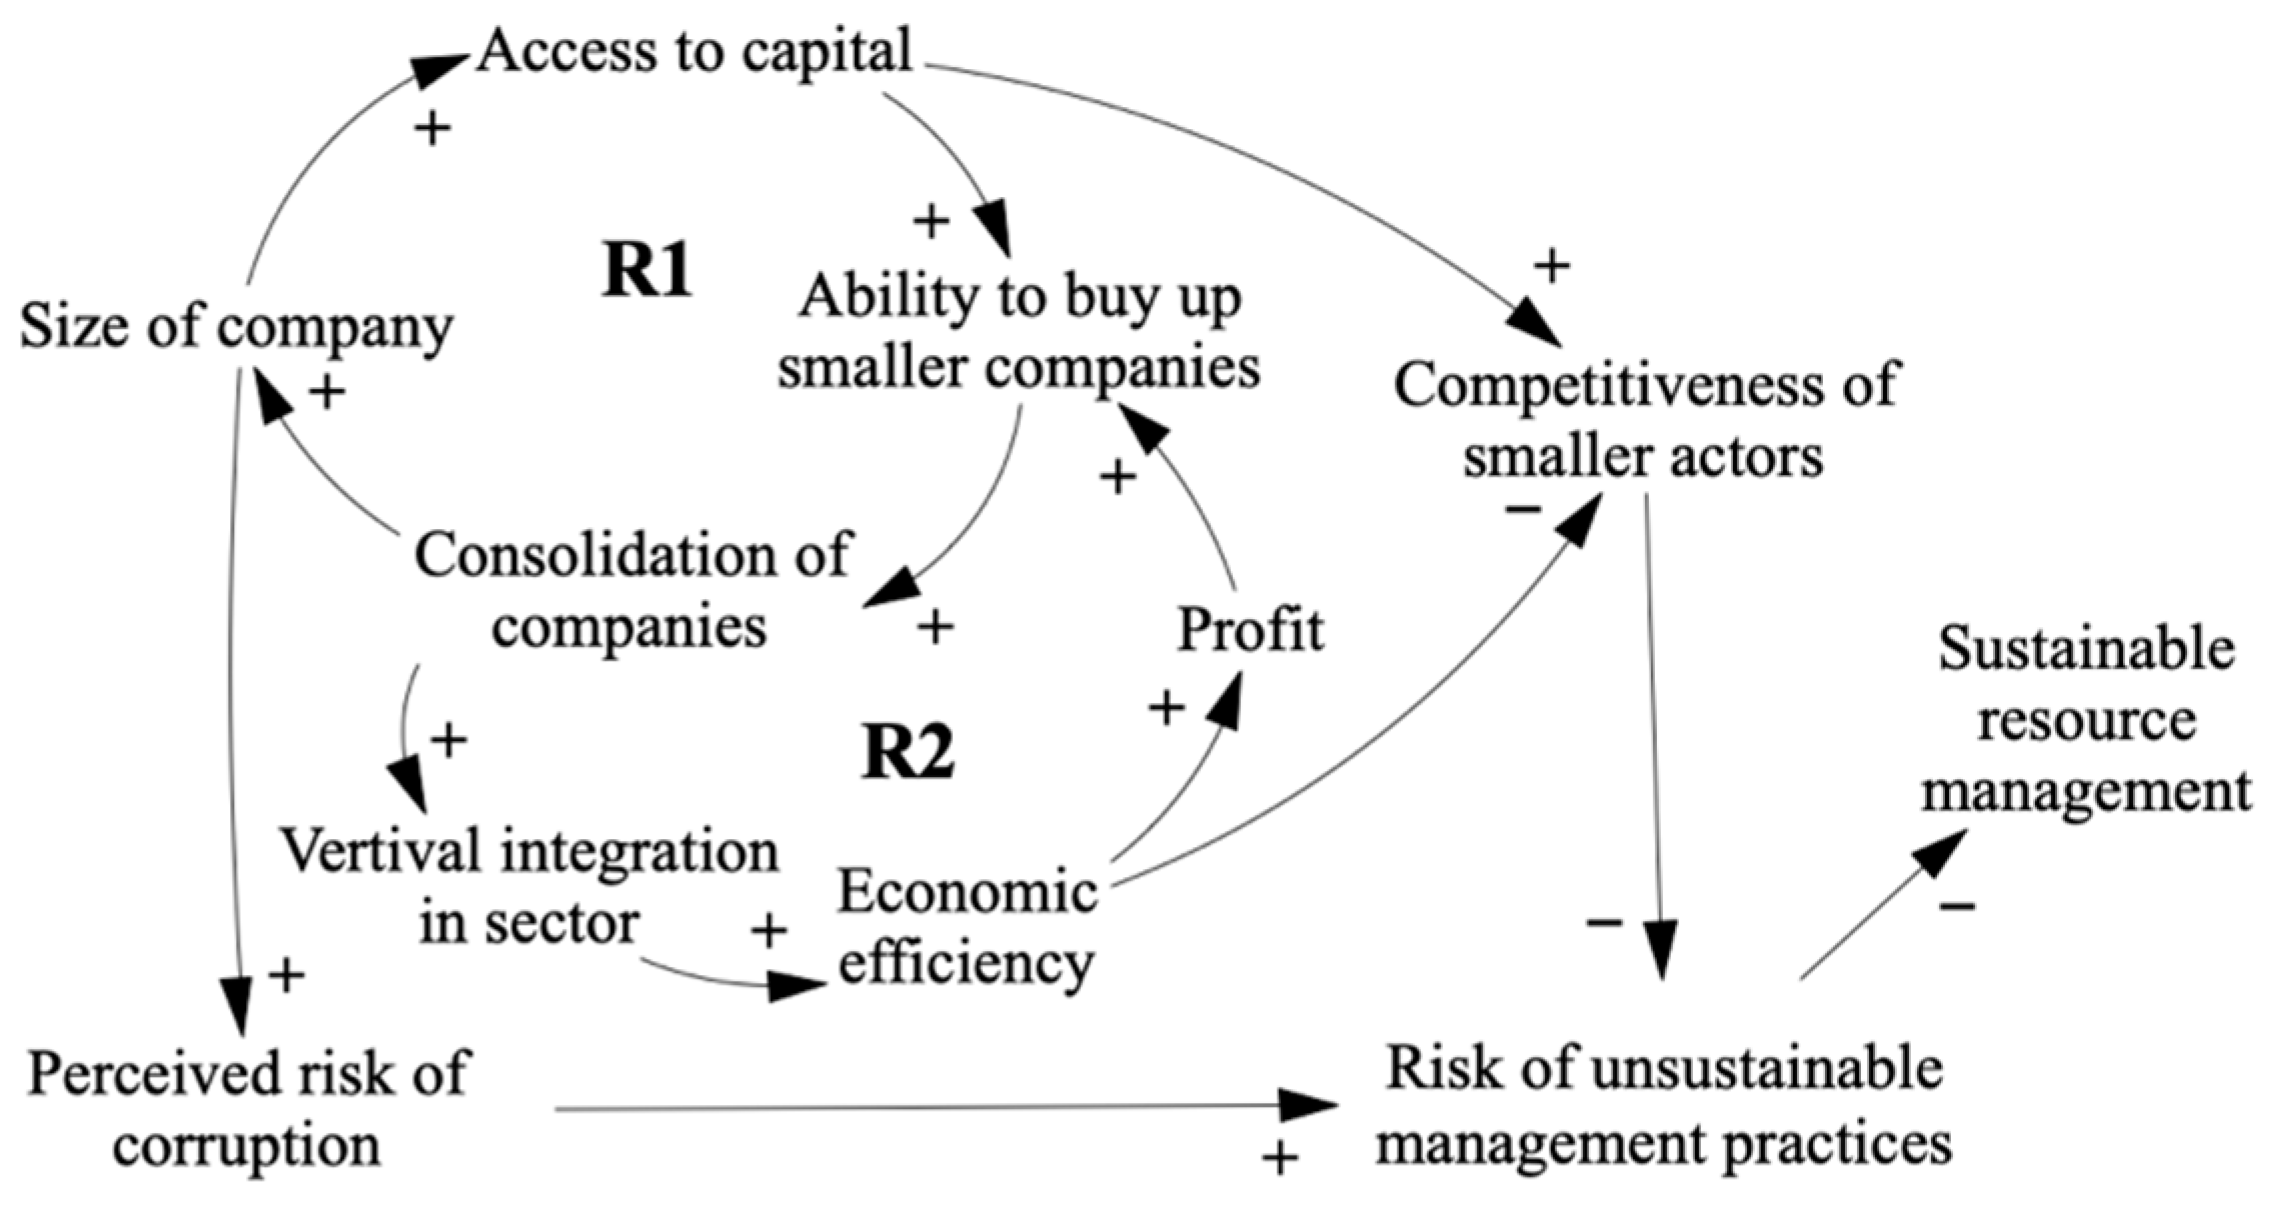
4. Discussion
5. Conclusions
Author Contributions
Funding
Institutional Review Board Statement
Informed Consent Statement
Data Availability Statement
Acknowledgments
Conflicts of Interest
References
- Svedrup, H.; Ragnarsdottir, K.V. Natural Resources in a Planetary Perspective. Geochem. Perspect. 2014, 3, 129–130. [Google Scholar] [CrossRef] [Green Version]
- Meadows, D.H.; Meadows, D.L.; Randers, J.; Behrens, W. The Limits to Growth: A Report for the Club of Rome’s Project on the Predicament of Mankind; Potomac Associates Book; Earth Island Limited: London, UK, 1972; ISBN 9780856440106. [Google Scholar]
- Hardin, G. The Tragedy of the Commons. Science 1968, 162, 1243–1248. [Google Scholar] [CrossRef] [PubMed] [Green Version]
- Ostrom, E. Governing the Commons: The Evolution of Institutions for Collective Action; Cambridge University Press: Cambridge, UK, 1990. [Google Scholar]
- May, P.J. Social Regulation. In The Tools of Government: A Guide to the New Governance; Salamon, L.M., Ed.; Oxford University Press: Oxford, UK, 2002; pp. 156–185. [Google Scholar]
- Palahí, M.; Pantsar, M.; Costanza, R.; Kubiszewski, I.; Potočnik, J.; Stuchtey, M.; Nasi, R.; Lovins, H.; Giovannini, E.; Fioramonti, L.; et al. Investing in Nature as the True Engine of Our Economy: A 10-Point Action Plan for a Circular Bioeconomy of Wellbeing; European Forest Institute: Sarjanr, Finland, 2020; ISBN 978-952-5980-92-9. [Google Scholar]
- FAO. FAO 50th Anniversary Declaration on Food and Agriculture “The Quebec Declaration”; FAO: Rome, Italy, 1995. [Google Scholar]
- FAO. Progress on the Sustainable Development Goals/2030 Agenda for Sustainable Development Executive. In Proceedings of the Forty-first Session, Rome, Italy, 22–29 June 2019. [Google Scholar]
- FAO. SAFA Guidelines: Sustainability Assessment of Food and Agriculture Systems; FAO: Rome, Italy, 2014; ISBN 978-92-5-108485-4. [Google Scholar]
- Williams, A.; Le Billon, P. Introduction. In Corruption, Natural Resources and Development: From Resource Curse to Political Ecology; Williams, A., Le Billon, P., Eds.; Edward Elgar Publishing: Cheltenham, UK, 2017; pp. 1–14. ISBN 9781785361197. [Google Scholar]
- Kolstad, I.; Søreide, T.; Williams, A. Corruption in Natural Resource Management: An Introduction. U4 Brief 2008, 2. Available online: https://www.u4.no/publications/corruption-in-natural-resource-management-an-introduction.pdf (accessed on 25 April 2021). [CrossRef] [Green Version]
- Transparency International. Corruption Perceptions Index; Transparency International: Berlin, Germany, 2010. [Google Scholar]
- Robbins, P. The Rotten Institution: Corruption in Natural Resource Management. Political Geogr. 2000, 19, 423–443. [Google Scholar] [CrossRef]
- Sumaila, U.R.; Jacquet, J.; Witter, A. When bad gets worse: Corruption and fisheries. In Corruption, Natural Resources and Development: From Resource Curse to Political Ecology; Williams, A., Le Billon, P., Eds.; Edward Elgar Publishing: Cheltenham, UK, 2017; ISBN 9781785361197. [Google Scholar]
- Persson, A.; Rothstein, B.; Teorell, J. Getting the basic nature of systemic corruption right: A reply to Marquette and Peiffer. Governance 2018, 32, 799–810. [Google Scholar] [CrossRef]
- Mungiu-Pippidi, A. Controlling Corruption Throught Collective Action. J. Democr. 2013, 24, 102–115. [Google Scholar] [CrossRef]
- Lambsdorff, J.G. The Institutional Economics of Corruption and Reform: Theory, Evidence and Policy; Cambridge University Press: Cambridge, UK, 2007; ISBN 9780511274183. [Google Scholar]
- Rose-Ackerman, S. Corruption: A Study in Political Economy; Academic Press: New York, NY, USA, 1978; ISBN 9781483289069. [Google Scholar]
- Gailmard, S. Accountability and principal-agent theory. In The Oxford Handbook of Public Accountability; Bovens, M., Goodin, R.E., Schillemans, T., Eds.; Oxford University Press: Oxford, UK, 2014. [Google Scholar]
- Jain, A.K. Corruption: A review. J. Econ. Surv. 2001, 15, 71–121. [Google Scholar] [CrossRef]
- Ragin, C.C. The Comparative Method: Moving Beyond Qualitative and Quantitative Strategies; University of California Press: Berkeley, CA, USA, 1987. [Google Scholar]
- Arksey, H.; Knight, P. Interviewing for Social Scientists; Sage Publications: London, UK, 1999. [Google Scholar]
- Stake, R.E. The Art of Case Study Research; Sage Publications: Thousand Oaks, CA, USA, 1995. [Google Scholar]
- The World Bank Population Density (People per sq. km of Land Area). Available online: https://data.worldbank.org/indicator/EN.POP.DNST (accessed on 13 June 2021).
- The World Bank Population, Total. Available online: https://data.worldbank.org/indicator/SP.POP.TOTL (accessed on 13 June 2021).
- Transparency International Corruption Perceptions Index. Available online: https://www.transparency.org/cpi2019?/news/feature/cpi-2019 (accessed on 16 February 2020).
- The World Bank GNI per Capita, Atlas Method (Current US$). Available online: https://data.worldbank.org/indicator/NY.GNP.PCAP.CD (accessed on 13 June 2021).
- Reed, M.S.; Graves, A.; Dandy, N.; Posthumus, H.; Hubacek, K.; Morris, J.; Prell, C.; Quinn, C.H.; Stringer, L.C. Who’s in and why ? A typology of stakeholder analysis methods for natural resource management. J. Environ. Manag. 2009, 90, 1933–1949. [Google Scholar] [CrossRef]
- Durham, E.; Baker, H.; Smith, M.; Moore, E.; Morgan, V. The BiodivERsA Stakeholder Engagement Handbook; BiodivERsA: Paris, France, 2014. [Google Scholar]
- Gunnarsdóttir, I.; Davíðsdóttir, B.; Worrell, E.; Sigurgeirsdottir, S. It is best to ask: Designing a stakeholder-centric approach to selecting sustainable energy development indicators. Energy Res. Soc. Sci. 2021, 74. [Google Scholar] [CrossRef]
- Robson, C. Real World Research: A Resource for Social Scientists and Practitioner-Researchers; Blackwell Publishers: Oxford, UK, 1993. [Google Scholar]
- Roulston, K. Analysing interviews. In The Sage Handbook of Qualitative Data Analysis; Metzler, K., Ed.; Sage Publications: London, UK, 2014; pp. 297–312. ISBN 978-1-4462-0898-4. [Google Scholar]
- Meadows, D.H. Thinking in Systems: A Primer; Wright, D., Ed.; Chelsea Green Publishing: Hartford, VT, USA, 2008. [Google Scholar]
- Reichel, A. (Re-)Structuration of System Dynamics. In Proceedings of the 22nd International Conference of the System Dynamics Society, Oxford, UK, 25–29 July 2004. [Google Scholar]
- Sterman, J. Business Dynamics: Systems Thinking and Modeling for a Complex World; McGraw-Hill Higher Education; Irwin/McGraw-Hill: New York, NY, USA, 2000; ISBN 9780072311358. [Google Scholar]
- Doyle, J.K.; Ford, D.N. Mental models concepts for system dynamics research. Syst. Dyn. Rev. 1998, 14, 3–29. [Google Scholar] [CrossRef]
- Lane, D.C. Rerum cognoscere causas: Part II—Opportunities generated by the agency/structure debate and suggestions of system dynamics. Syst. Dyn. Rev. 2001, 17, 293–309. [Google Scholar] [CrossRef]
- Turner, B.L.; Kim, H.; Andersen, D.F. Improving coding procedures for purposive text data: Researchable questions for qualitative system dynamics modeling. Syst. Dyn. Rev. 2013, 29, 253–263. [Google Scholar] [CrossRef]
- Spicer, J. Representation and Dynamic Implications of Mental Models of Food Systems. In Proceedings of the 33rd International Conference of the System Dynamics Society, Cambridge, MA, USA, 19–23 July 2015. [Google Scholar]
- Kim, H.; Andersen, D.F. Building confidence in causal maps generated from purposive text data: Mapping transcripts of the Federal Reserve. Syst. Dyn. Rev. 2012, 28, 311–328. [Google Scholar] [CrossRef]
- Charmaz, K. Constructing Grounded Theory: A Practical Guide through Qualitative Analysis; Sage Publications: London, UK, 2006; ISBN 9780761973522. [Google Scholar]
- Fileccia, T.; Guadagni, M.; Hovhera, V.; Bernoux, M. Ukraine-Soil Fertility to Strengthen Climate Resilience: Preliminary Assessment of the Potential Benefits of Conservation Agriculture: Main Report (English); FAO: Rome, Italy, 2014; Volume 1, p. 31. [Google Scholar]
- Mamonova, N. Resistance or adaptation? Ukrainian peasants’ responses to large-scale land acquisitions. J. Peasant Stud. 2015, 42, 607–634. [Google Scholar] [CrossRef]
- Stupak, N. Impact of Agricultural Transition on Soil Protection in Ukraine: The Role of Institutional Change. Land Use Policy 2016, 55, 86–97. [Google Scholar] [CrossRef]
- fao.org FAO Kicks off Project Aimed at Tackling Land Degradation in Ukraine. Available online: http://www.fao.org/europe/news/detail-news/en/c/1128337/ (accessed on 26 June 2021).
- Lerman, Z. Land Reform and Farm Restructuring in Ukraine. Probl. Post-Communism 1999, 46, 42–55. [Google Scholar] [CrossRef]
- Keyzer, M.A.; Merbis, M.D.; Witt, R.; Heyets, V.; Borodina, O.; Prokopa, I. Farming and rural development in Ukraine. JRC Sci. Policy Rep. 2012. [Google Scholar]
- International Trade Administration Ukraine Adopts Land Reform. Available online: https://www.trade.gov/market-intelligence/ukraine-adopts-land-reform (accessed on 21 November 2020).
- Visser, O.; Spoor, M. Land grabbing in post-Soviet Eurasia: The world’s largest agricultural land reserves at stake. J. Peasant Stud. 2011, 38, 299–323. [Google Scholar] [CrossRef]
- Shikula, M.K. A mechanism for the self-regulation of fertility in Ukrainian chernozems. In Soil Quality, Sustainable Agriculture and Environmental Security in Central and Eastern Europe; Wilson, M.J., Maliszewska-Kordybach, B., Eds.; Springer Science & Business Media: Berlin/Heidelberg, Germany, 2012; pp. 259–266. ISBN 9401141819. [Google Scholar]
- Dal Bó, E. Regulatory capture: A review. Oxford Rev. Econ. Policy 2006, 22, 203–225. [Google Scholar] [CrossRef]
- FAO. Voluntary Guidelines for Sustainable Soil Management; FAO: Rome, Italy, 2017. [Google Scholar]
- Siry, J.P.; Cubbage, F.W.; Rukunuddin, M. Sustainable forest management: Global trends and opportunities. For. Policy Econ. 2005, 7, 551–561. [Google Scholar] [CrossRef]
- United Nations. Environmental Performance Reviews: Romania; United Nations: New York, NY, USA; Geneva, Switzerland, 2012. [Google Scholar]
- FAO; UNEP. The State of the World’s Forests 2020. Forests, Biodiversity and People; FAO: Rome, Italy, 2020. [Google Scholar]
- Ciceu, A.; Radu, R.; García-Duro, J. National Forestry Accounting Plan of Romania for the First Compliance Period (2021–2025); Institutului Național de Cercetare-Dezvoltare în Silvicultură „Marin Drăcea” (INCDS): Voluntari, Romania, 2019. [Google Scholar]
- FAO. Global Forest Resource Assessment 2020 Report: Romania; FAO: Rome, Italy, 2020. [Google Scholar]
- Anfodillo, T.; Carrer, M.; Dalla Valle, E.; Giacoma, E.; Lamedica, S.; Pettenella, D. Activity 2.7: Forestry and Timber Industry Report on Current State of Forest Resources in the Carpathians; INTERREG III B CADSES Programme Carpathian Project Universita Degli Studi Di Padova: Padova, Italy, 2008. [Google Scholar]
- Eurostat Forests, Forestry and Logging. Available online: https://ec.europa.eu/eurostat/statistics-explained/index.php/Forests,_forestry_and_logging#Forests_and_other_wooded_land%0Ahttps://ec.europa.eu/eurostat/statistics-explained/pdfscache/52476.pdf (accessed on 10 March 2021).
- Romania Insider More than Half of Romania’s Wood Exports Go Outside EU. Which Are the Biggest Markets? Available online: https://www.romania-insider.com/more-half-romanias-wood-exports-go-outside-eu-which-are-biggest-markets (accessed on 15 March 2021).
- UNEP. Carpathians Environment Outlook; UNEP: Geneva, Switzerland, 2007. [Google Scholar]
- Drăgoi, M.; Toza, V. Did Forestland Restitution Facilitate Institutional Amnesia? Some Evidence from Romanian Forest Policy. Land 2019, 8, 99. [Google Scholar] [CrossRef] [Green Version]
- Abrudan, I.V. A decade of non-state administration of forests in Romania: Achievements and challenges. Int. For. Rev. 2012, 14, 275–284. [Google Scholar] [CrossRef]
- Nichiforel, L.; Bouriaud, L.; Nonić, D.; Dorondel, S.; Măntescu, L.; Terpe, H. Forest Land Ownership Change in Romania; COST Action FP1201 FACESMAP Country Report; European Forest Institute Central-East and South-East European Regional Office: Vienna, Austria, 2015. [Google Scholar]
- Ioras, F.; Abrudan, I.V. The Romanian forestry sector: Privatisation facts. Int. For. Rev. 2006, 8, 361–367. [Google Scholar] [CrossRef]
- Knorn, J.; Kuemmerle, T.; Radeloff, V.C.; Szabo, A.; Mindrescu, M.; Keeton, W.S.; Abrudan, I.; Griffiths, P.; Gancz, V.; Hostert, P. Forest restitution and protected area effectiveness in post-socialist Romania. Biol. Conserv. 2012, 146, 204–212. [Google Scholar] [CrossRef]
- Knorn, J.; Kummerle, T.; Radeloff, V.C.; Keeton, W.S.; Gancz, V.; Biris, I.-A.; Svoboda, M.; Griffiths, P.; Hagatis, A.; Hostert, P. Continued loss of temperate old-growth forests in the Romanian Carpathians despite an increasing protected area network. Environ. Conserv. 2012, 40, 182–193. [Google Scholar] [CrossRef] [Green Version]
- Marinchescu, M.; Halalisan, A.F.; Popa, B.; Abrudan, I.V. Forest administration in Romania: Frequent problems and expectations. Not. Bot. Horti Agrobot. Cluj-Napoca 2014, 42, 588–595. [Google Scholar] [CrossRef] [Green Version]
- Nichiforel, L.; Keary, K.; Deuffic, P.; Weiss, G.; Thorsen, B.J.; Winkel, G.; Avdibegović, M.; Dobšinská, Z.; Feliciano, D.; Gatto, P.; et al. How private are Europe’s private forests? A comparative property rights analysis. Land Use Policy 2018, 76, 535–552. [Google Scholar] [CrossRef]
- Halalisan, A.F.; Abrudan, I.V.; Popa, B. Forest management certification in Romania: Motivations and perceptions. Forests 2018, 9, 425. [Google Scholar] [CrossRef] [Green Version]
- Schmithüsen, F.; Hirsch, F. Geneva Timber and Forest Study Paper 26; United Nations: Geneva, Switzerland, 2010. [Google Scholar]
- Vasile, M. The other frontier: Forest rush and small-scale timbermen of postsocialist Transylvania. J. Peasant Stud. 2020, 1–26. [Google Scholar] [CrossRef]
- Palaghianu, C.; Nichiforel, L. Between perceptions and precepts in the dialogue on Romanian forests. Bucov. For. 2016, 16, 3–8. [Google Scholar] [CrossRef] [Green Version]
- Palaghianu, C.; Dutca, I. Afforestation and reforestation in Romania: History, current practice and future perspectives. Reforesta 2017, 54–68. [Google Scholar] [CrossRef]
- IFN National Forest Inventory: Forest Resource Assessment in Romania. Available online: http://roifn.ro/site/rezultate-ifn-2/ (accessed on 21 November 2020).
- Romania Insider Romanian Forest Owners Claim Illegal logging Exaggerated by Media. Available online: https://www.romania-insider.com/ro-forest-owners-illegal-logging-exagerrated (accessed on 15 March 2021).
- Ziarul Financiar Cătălin Tobescu, Director Fordaq: “Preţul Lemnului de foc a Luat-o Razna. S-a Ajuns la un Preţ de 500-600 lei Metrul Cub în Sudul Ţării”. Available online: https://www.zf.ro/constructii-imobiliare/catalin-tobescu-director-fordaq-pretul-lemnului-de-foc-a-luat-o-razna-s-a-ajuns-la-un-pret-de-500-600-lei-metrul-cub-in-sudul-tarii-16844097 (accessed on 15 March 2021).
- Neacsa, A.; Panait, M.; Muresan, J.D.; Voica, M.C. Energy poverty in european union: Assessment difficulties, effects on the quality of life, mitigation measures. Some evidences from Romania. Sustainability 2020, 12, 4036. [Google Scholar] [CrossRef]
- FAO. The State of World Fisheries and Aquaculture 2020: Sustainability in Action; FAO: Rome, Italy, 2020; ISBN 9789251326923. [Google Scholar]
- Grainger, C.A.; Parker, D.P. The political economy of fishery reform. Annu. Rev. Resour. Econ. 2013, 5, 369–386. [Google Scholar] [CrossRef] [Green Version]
- Matthiasson, T.; Agnarsson, S. Property Rights in Icelandic Fisheries. In Handbook of Marine Fisheries Conservation and Management; Oxford University Press: Oxford, UK, 2010; pp. 299–309. [Google Scholar]
- Palsson, G.; Helgason, A. Figuring fish and measuring men: The individual transferable quota system in the Icelandic cod fishery. Ocean Coast. Manag. 1996, 28, 117–146. [Google Scholar] [CrossRef]
- Runolfsson, B.; Arnason, R. Initial Allocation of ITQs in the Icelandic Fisheries. In FAO Fisheries Technical Paper; FAO: Rome, Italy, 2001; pp. 24–31. [Google Scholar]
- Eythorsson, E. A decade of ITQ-management in Icelandic fisheries: Consolidation without consensus. Mar. Policy 2000, 24, 483–492. [Google Scholar] [CrossRef] [Green Version]
- McCay, B.J. Social and ecological implications of ITQs: An overview. Ocean Coast. Manag. 1995, 28, 3–22. [Google Scholar] [CrossRef]
- Eythórsson, E. Theory and practice of ITQs in Iceland: Privatization of common fishing rights. Mar. Policy 1996, 20, 269–281. [Google Scholar] [CrossRef]
- Kokorsch, M.; Karsdottir, A.; Benediktsson, K. Improving or overturning the ITQ system? Views of stakeholders in Icelandic fisheries. Marit. Stud. 2015, 14. [Google Scholar] [CrossRef] [Green Version]
- Agnarsson, S.; Matthiasson, T.; Giry, F. Consolidation and distribution of quota holdings in the Icelandic fisheries. Mar. Policy 2016, 72, 263–270. [Google Scholar] [CrossRef]
- OECD The political economy of the ITQ system and resource rent tax in Icelandic fisheries. In The Political Economy of Biodiversity Policy Reform; OECD Publishing: Paris, France, 2017.
- Chambers, C.; Helgadóttir, G.; Carothers, C. “Little kings”: Community, change and conflict in Icelandic fisheries. Marit. Stud. 2017, 16. [Google Scholar] [CrossRef] [Green Version]
- Edvardsson, K.N.; Cezara, P.; Benediktsson, K. Mapping the geographical consolidation of fishing activities in Iceland during the maturation of the ITQ fi sheries management system. Appl. Geogr. 2018, 97, 85–97. [Google Scholar] [CrossRef]


| Main Differences | Similarities | Similar Outcomes |
|---|---|---|
| Population size and density | Privatization of natural resource | |
| Economic development | Consolidation of companies in the natural resource sectors | |
| Degree of European integration | Perceived risks of unsustainable resource management practices | |
| Ranking on the CPI | Perceived corruption risks in resource sectors |
| Stakeholder Category | Ukraine | Romania | Iceland |
|---|---|---|---|
| Current/former NGO staff/member | 8 | 5 | 2 |
| Current/former resource owner/recipient | 1 | 2 | 2 |
| Current/former Member of Parliament | 1 | 1 | 2 |
| Current/former journalist | 1 | 1 | 1 |
| Current/former parliamentary staff | 1 | 1 | 1 |
| Current/former member of academia | 3 | 3 | 3 |
| Current/former public official | 7 | 3 | 4 |
| Current/former member of government | 1 | 0 | 0 |
| Current/former representative from harvesting operations/exploitation of resource | 2 | 4 | 5 |
| Current/former small business owner | 3 | 1 | 1 |
| Current/former big industry worker | 0 | 1 | 2 |
| Current/former local politician | 0 | 0 | 1 |
| Current/former employee in the finance sector | 1 | 0 | 1 |
| Total Interviews | 15 | 13 | 12 |
| Total Participants 1 | 17 | 15 | 12 |
| Of those: | |||
| Number of female participants | 4 | 1 | 3 |
| Number of male participants | 13 | 14 | 9 |
| Age 20–40 years | 5 | 5 | 2 |
| Age 40–60 years | 6 | 6 | 5 |
| Age 60–80 years | 6 | 4 | 5 |
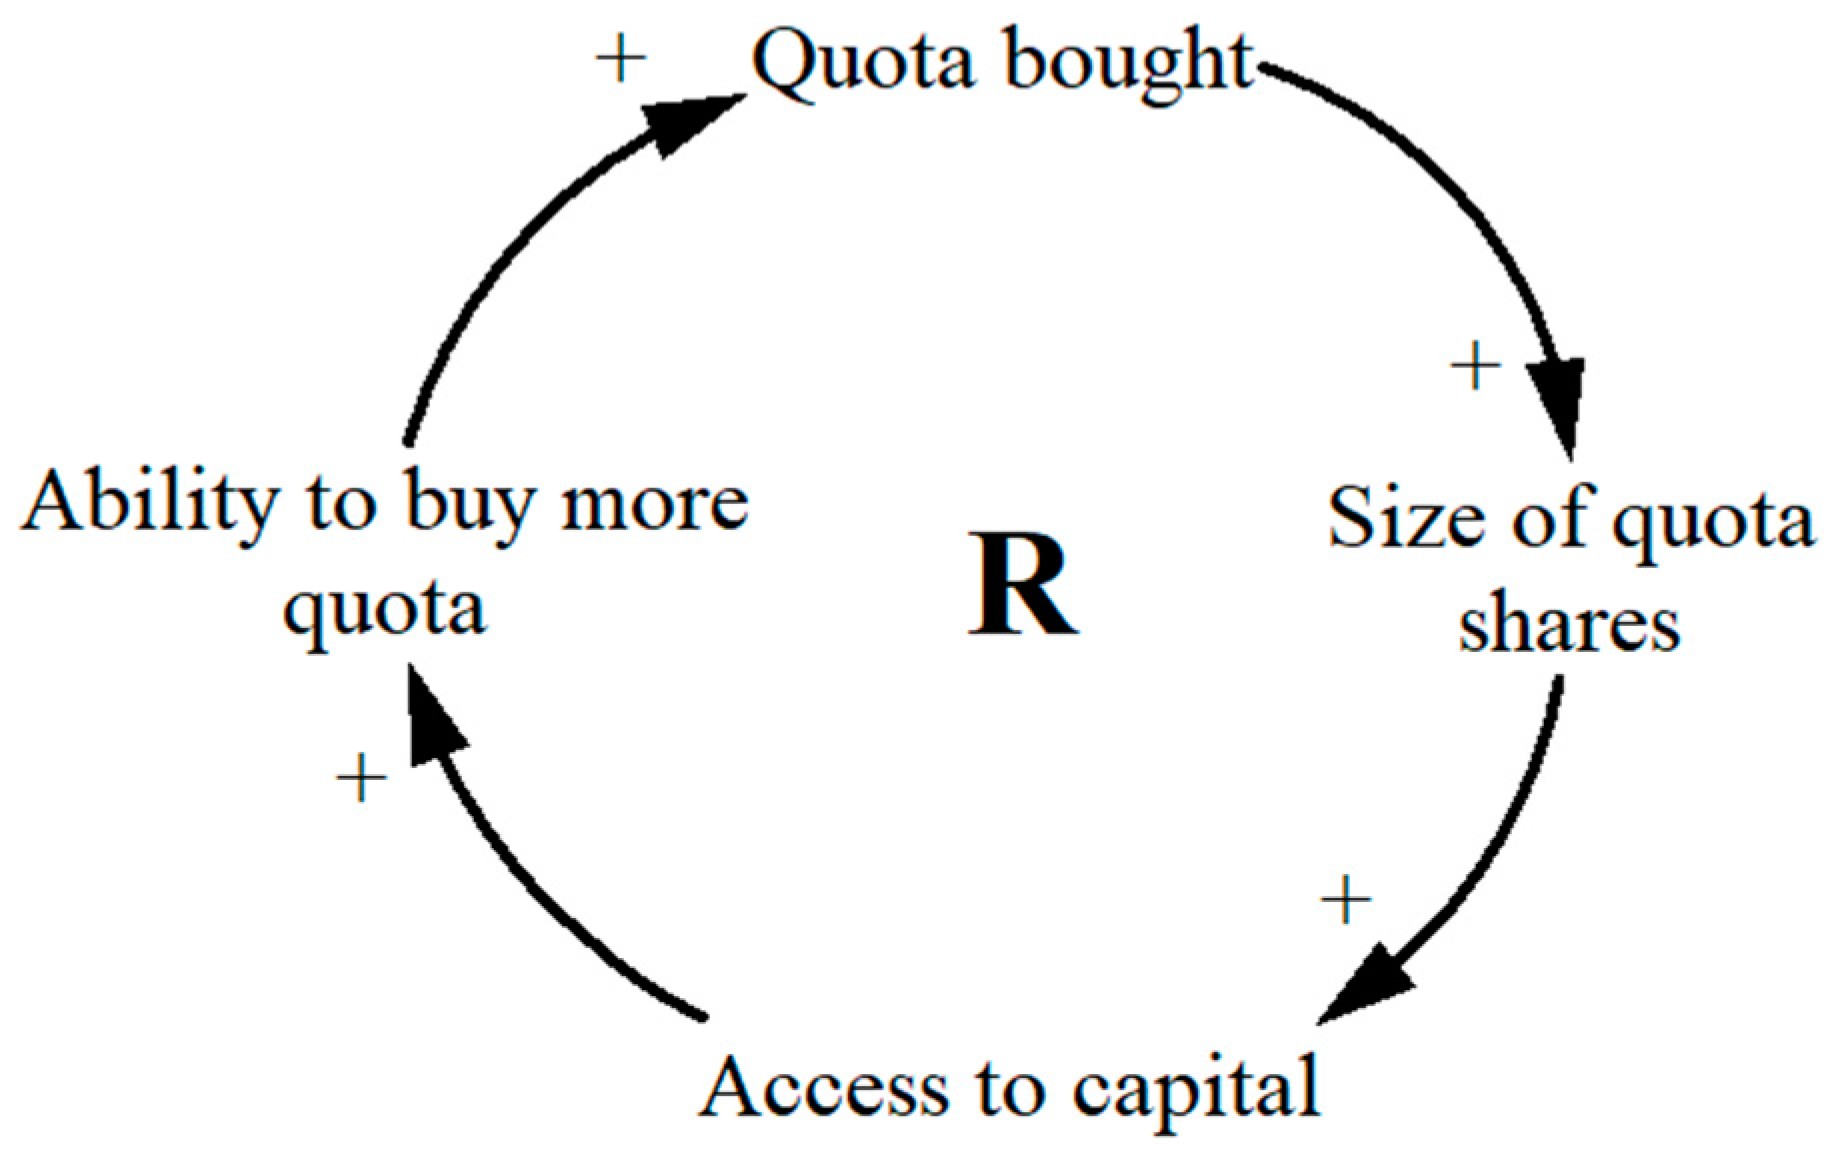
| Cause Variable | Effect Variable | Polarity | Country | Stake-Holder Category | Resource | Gender | Age | Location |
|---|---|---|---|---|---|---|---|---|
| Ability to buy more quota | Quota bought | + | Iceland | x | Fisheries | x | x | x |
| Quota bought | Size of quota shares | + | Iceland | x | Fisheries | x | x | x |
| Size of quota shares | Access to capital | + | Iceland | x | Fisheries | x | x | x |
| Access to capital | Ability to buy more quota | + | Iceland | x | Fisheries | x | x | x |
Publisher’s Note: MDPI stays neutral with regard to jurisdictional claims in published maps and institutional affiliations. |
© 2021 by the authors. Licensee MDPI, Basel, Switzerland. This article is an open access article distributed under the terms and conditions of the Creative Commons Attribution (CC BY) license (https://creativecommons.org/licenses/by/4.0/).
Share and Cite
Gisladottir, J.; Sigurgeirsdottir, S.; Ragnarsdóttir, K.V.; Stjernquist, I. Economies of Scale and Perceived Corruption in Natural Resource Management: A Comparative Study between Ukraine, Romania, and Iceland. Sustainability 2021, 13, 7363. https://doi.org/10.3390/su13137363
Gisladottir J, Sigurgeirsdottir S, Ragnarsdóttir KV, Stjernquist I. Economies of Scale and Perceived Corruption in Natural Resource Management: A Comparative Study between Ukraine, Romania, and Iceland. Sustainability. 2021; 13(13):7363. https://doi.org/10.3390/su13137363
Chicago/Turabian StyleGisladottir, Johanna, Sigurbjörg Sigurgeirsdottir, Kristín Vala Ragnarsdóttir, and Ingrid Stjernquist. 2021. "Economies of Scale and Perceived Corruption in Natural Resource Management: A Comparative Study between Ukraine, Romania, and Iceland" Sustainability 13, no. 13: 7363. https://doi.org/10.3390/su13137363
APA StyleGisladottir, J., Sigurgeirsdottir, S., Ragnarsdóttir, K. V., & Stjernquist, I. (2021). Economies of Scale and Perceived Corruption in Natural Resource Management: A Comparative Study between Ukraine, Romania, and Iceland. Sustainability, 13(13), 7363. https://doi.org/10.3390/su13137363