
Inward Foreign Direct Investment-Induced Technological Innovation in Sri Lanka? Empirical Evidence Using ARDL Approach


1
School of Economics, Huazhong University of Science and Technology, Wuhan 430074, China
2
Department of Economics, Faculty of Social Sciences and Humanities, Rajarata University of Sri Lanka, Mihintale 50300, Sri Lanka
3
Department of Environmental Management, Faculty of Social Sciences and Humanities, Rajarata University of Sri Lanka, Mihintale 50300, Sri Lanka
*
Author to whom correspondence should be addressed.
Sustainability 2021, 13(13), 7334; https://doi.org/10.3390/su13137334
Submission received: 12 May 2021
/
Revised: 21 June 2021
/
Accepted: 22 June 2021
/
Published: 30 June 2021
(This article belongs to the Collection Technological Innovation and Economic Growth)
Abstract
:Fostering innovation is considered one of the key policy priorities in most governments’ agendas in developing countries. Foreign direct investment (FDI) is a principal resource for financing sustainable development, corresponding to 17 sustainable development goals (SDGs). This study analyzes how inward FDI affects innovation in Sri Lanka using secondary data from 1990 to 2019. We used the Autoregressive Distributed Lag (ARDL) cointegration procedure to examine the long-run relationships between variables. As per the study results, the coefficient of inward FDI is a negative sign while the coefficients of education expenditure (EDU) and research and development expenditure (RDE) show positive signs of 0.26 and 5.7, respectively, and are statistically significant in the long run. It is demonstrated that research and development expenditure is vital in explaining technological innovation, and inward FDI inflows do not contribute to widening technological innovation in Sri Lanka. More FDI inflows will not bring higher innovation. Shaping the future of FDI in Sri Lanka is essential to foster innovation capability.
1. Introduction
Foreign direct investment (FDI) is considered one of the effective channels of technology transmission across borders. FDI inflow contains knowledge about new technologies and materials, production methods, or organizational management skills [1]. Furthermore, FDI is an essential pillar of economic development policy, and most countries in the world have established national investment promotion agencies (IPAs) to attract FDI. Foreign direct investment contributes to sustainable development in several ways. It directly impacts increasing capital investment, exports, employment, and tax revenue while generating an indirect impact on local suppliers, technology transfer, productivity, innovation, and good governance. It can also support local industry upgrading in host economies and facilitate their participation in the global value chain [2,3,4]. In the 2030 agenda of sustainable development goals (SDGs), FDI is considered as a principal resource of financing for sustainable development [5].
On the other hand, the importance of FDI has emerged from multinational corporations (MNCs) in creating positive externalities in economic growth by providing financial resources, creating jobs, transferring technological know-how, managerial and organizational skills, and enhancing competitiveness [6,7]. Today, the importance of FDI has increased as it is a form of technology transfer and market network that can affect global production and sales [8]. According to the United Nations Conference on Trade and Development (UNCTAD) data, it is evident that foreign capital globalization and enormous FDI inflow were stable in developing countries during the last years compared with developed countries. By 2019, the share of global FDI to developing countries accounted for 54 percent [9]. Most developing countries believe that FDI’s principal benefits are embodied in increasing their technological and scientific capacities and narrowing the technological gaps between them and developed countries. FDI contributes to technological progress in developing countries and is an essential factor for the technology inflows that can create and strengthen overall technological capabilities [10]. Technological innovation can define as a fundamental driver of economic growth and human progress. Nowadays, international production is a common fact through foreign direct investment due to technological advancement.
Furthermore, FDI might stimulate technological innovation in host countries through various channels such as competitive effect, demonstration effect, human capital formation effect, knowledge diffusion through the brain, backward linkages, and forward linkages [11]. A country can realize technological innovation in two ways, namely independent innovation and technology introduction. FDI inflows attend to technology introduction, as foreign-invested firms bring production technology, management, and experience to the host country. On the other hand, FDI stimulates the host country’s cognizance for independent innovation to compete with foreign firms [12].
The empirical literature shows mixed results on the impact of FDI on innovation. We believe that country-specific studies are imperative for each country to identify the effects of FDI on innovation. Hence, the main objective of this study is to examine the impact of inward FDI on technological innovation in Sri Lanka. Before the government implemented the economic liberalization policy in 1977 in Sri Lanka, the economy followed inward-looking policies, which had limitations for foreign investors and the free flow of FDI [13]. Later, the new government initiated an extensive economic liberalization process in 1977 [14]. Previously imposed quantitative restrictions on imports were removed, and a more uniform tariff structure was introduced. The exchange rate was realigned in 1978, which had been overvalued due to pre-existed trade suppression and the newly established Greater Colombo Economic Commission (GCEC) in 1978 to promote export-oriented foreign investment. GCEC is the forerunner to the Board of Investment, which is the incumbent establishment responsible for FDI.
Furthermore, GCEC was responsible for establishing export-processing zones (EPZs) and formulating and implementing an incentives package for foreign investments. Further, Sri Lanka offers attractive investment opportunities for foreign companies and has adopted many policies to attract foreign direct investment. The country provided perhaps one of the most liberal FDI regimes in South Asia [14]. Figure 1 shows the trend of FDI inflows in Sri Lanka during the last years.
The past four decades have observed a dramatic increase in foreign capital inflows in Sri Lanka. The inflows of FDI increased from $47 million in 1979 to $758 million in 2019. Undertaking an empirical study on the effects of FDI inflows on technological innovation is imperative. The empirical literature shows mixed results on the impact of FDI on innovation. We believe that country-specific studies are essential for each country to identify the effects of FDI on innovation. To the best of our knowledge, none of the studies have focused on the nexus between FDI inflows and technological innovation in Sri Lanka using the granted patent data as a measurement of technological innovation and the Autoregressive Distributed Lag (ARDL) model. Therefore, our study attempts to fill this gap in the body of knowledge. More than ever, trade liberalization policies are motivated by the expectation that the domestic economy will receive a significant trade and capital flow [15,16]. Many empirical studies confirm that the impact of foreign technology through FDI and trade is a significant determinant of growth in the host country. Technology transfer through FDI affects domestic innovation efforts. Instead of developing domestic technology, domestic firms could use foreign technology with less uncertainty. It then induces innovation. This process is an important fact for developing countries, as innovation plays a vital role in technological improvement [17,18]. A proper understanding of the impacts of FDI flows, policy formulation related to trade, investment, and future development scenarios could be more effective. Therefore, the gap of knowledge in this area has motivated this study to address the impacts of inward FDI on technological innovation.
The contribution of our work can be explained as follows. This study contributes to the literature by providing evidence of FDI inflows on technological innovation in a developing country. Unlike many other studies that use industry analyses, this one uses a country-level analysis. The study’s scope is limited to developing countries. The motivations of MNCs entering developed and developing countries differ. Understanding the effects of FDI flows is more important for developing countries to their policy formulation related to trade, investment, and development. Especially, findings of this study contribute to policy formulation in achieving sustainable development goal 9, which is about “industry, innovation, and infrastructure” in developing countries. This study also contributes to the growing literature on applying the ARDL method for small sample analysis. Finally, we also contribute to enriching the existing literature on innovation measuring.
The remainder of this article is as follows. Section 2 discusses the theoretical foundation and literature review. The materials and methods of the study are explained in Section 3. Estimating and analyzing the results are presented in Section 4. Section 5 and Section 6 describes the discussion and conclusion of the study.
2. Theoretical Foundation and Literature Review
Economic theory explains the role of FDI in accelerating economic growth in an economy. Modern economic growth theories demonstrate that FDI plays a crucial role in transferring technological progress and creating new ideas to determine the economic growth rate [19,20]. Neoclassical and endogenous growth models have been widely empirically used to test those theoretical benefits of FDI. Endogenous growth models have been combined with technology diffusion studies to show FDI impacts on economic growth [21,22,23,24]. In these models, technology plays a crucial role in economic development. The exogenous growth theory explains that FDI leads to capital formation in the host country, thereby influencing reinvestment of profits and further inflows of capital therein. Infusion of foreign capital makes a lower balance of payment and provides higher-order production techniques by replacing ineffective methods [25,26,27].
Since the seminal work of Schumpeter [28], many studies stipulate that FDI flows induce innovation. The literature shows that new technology and innovation drive economic growth forces [18,20,26,29,30,31]. The innovative activity supports economic productivity and growth. Long-run economic growth depends on the environment, which creates incentives for innovation and application of new technology, for example, intellectual property rights [32,33]. Economic growth is manifested by the distribution of innovation in economic activity. This procedure contributes to the growth of both labor productivity and total factor productivity, and then it accelerates economic growth [34,35]. It is a direct way to find the effects of FDI on a firm by observing its innovative output rather than productivity, as productivity performance does not reflect all innovation output [36]. FDI can stimulate a host country’s innovation through several mechanisms [11], such as demonstration effects [37,38,39], competitive effects [39,40,41] human capital mobility effects [38,42], and backward linkages [43,44,45,46].
The relationship between FDI inflows and innovation has been widely explored at both the firm/industry and country levels in the empirical literature. The results of empirical studies show that FDI’s impact on innovation will vary with different regions, country level, firm, and industry level. The view that FDI affects a host country firms’ economic performance is based on the assumption that MNCs have access to advanced technology and better know-how [47,48,49]. The existing empirical studies on firm/industry level have used different productivity measures such as total factor productivity and labor productivity to examine the relationship between FDI and innovation. In the same line, the impact of FDI flows on innovation capacity at the country level has been evaluated using different innovation measures such as patent applications, patent grants, and R&D expenditure. We noticed two groups of studies: the first found the relationship between FDI inflows and innovation using firms-level or industry-level data and include Wang and Wu [50], Girma et al. [51], Nyeadi and Adjasi [52], Wang et al. [53], Khachoo and Sharma [54], Keller and Yeaple [55], Garcia et al. [56], and Osano and Koine [57]. The second group revealed the relationship between FDI inflows and innovation using country-level data and include Dhrifi [58], Erdal and Gocer [59], Zeng and Zhou [12], Zhang [60], Kemeny [61], Sivlogathasan and Wu [62], Cheung and Lin [37], Chen [63], Mohamed et al. [64], and Ustalar and Sanlisoy [65]. Furthermore, the results of these studies are contradictory. Some of the studies found that FDI encourages a firm’s or country’s innovation capacity, as seen in Ustalar and Sanlisoy [65], Nyeadi and Adjasi [52], Ismail [66], Dhrifi [58], Erdal and Gocer [59], Zhang [60], Girma et al. [51], Zeng and Zhou [12], Kemeny [61], Wang et al. [53], Osano and Koine [57], Shamsub [67], Khachoo and Sharma [54], Sivalogathasan and Wu [54], Keller and Yeaple [55], Caves [47], Globerman [68], Blomstrom and Persson [69], and Javorick [46], while others revealed FDI has negligible or insignificant effects on innovation. These include Garcia et al. [56], Chen [63], Aitken and Harrison [70], Haddad and Harisson [71], Djankov and Hoekman [72], Sasidharan [73], Qu and Wei [74], Dunning and Lundan [48], and Mohamed et al. [64]. Table 1 shows the firm/industry-level studies, and Table 2 presents country-level studies.
Given these concerns, the net impact of FDI spillovers on innovation is difficult to predict. It can be either positive or negative, as well as statistically insignificant. There are also limits in the quantitative approaches used. Common econometric methods that use aggregate data to assess FDI’s spillover provide little opportunity for explaining how spillover occurs or does not occur in reality, particularly in developing countries where data are few. The motivations of MNCs entering developed and developing countries differ. Therefore, to understand the effects of FDI on technological innovation in developing countries, country-level empirical research needs to be conducted. Thus, to assess the impact of FDI on innovation, our study hypothesizes:
Hypothesis 1 (H1):
FDI to Sri Lanka has a positive impact on technological innovation.
3. Materials and Methods
This study investigated the impact of inward FDI on technological innovation in Sri Lanka. The study used five variables for the analysis. Endogenous growth theory and literature findings of the determinants of technological progress were used to select the variables. We collected the relevant data from the World Development Indicators (WDI) and the National Intellectual Property Office’s statistics (NIPO) in Sri Lanka. The long-run empirical model reflecting the impact of inward FDI on innovation capability is specified in following equation. The structural formulas in the studies of Cheung and Lin [37], Chen [63], and Sivalogathasan and Wu [62] were modified to create the model.
The proposed model to discuss the effects of inward FDI on technological innovation can be specified by the following econometric model.
where:
= Logarithm form of granted patents to residents
= Inward FDI as a percentage of GDP
= GDP growth rate
= Research and development expenditure as a percentage of GDP
= Education expenditure as a percentage of GDP
= Error term
In the above Equation (1), granted patents to residents is the dependent variable representing the host country’s innovation. We are aware that many researchers have used the number of patent applications as a measure of innovation [37,54,59,76,77,78,79]. However, patent applications are an imprecise measure of innovation because some are not patentable and some investors may choose not to apply for patents [80,81,82]. As a result, according to Maradana et al. [83], Sun and Du [84], Ang [85], Wong [86], Aghion et al. [29], and Kim and Lee [87], awarded patents are deemed to represent technological innovation rather than patent applications.
The amount of inward FDI as a percentage of GDP used to measure comprehensively capture its effect on innovation. The main focus of our analysis is to analyze the impact of FDI inflows on innovation. FDI is viewed as a major technology transfer channel, and it stimulates innovation capacity in the host country [1,6,7,15,88,89]. We include GDP growth to account for the fact that innovation capabilities may differ at different stages of economic growth in an economy [62]. Expenditure on R&D reflects the nation’s absorptive capacity and represents innovation efforts [67,90]. The new growth theories consider the human capital factor as an explaination of economic growth and innovation. Efficient allocation for education will lead to human capital and stimulate economic growth. Education expenditure is an essential indicator of human capital formation [18,20,91,92]. Hence, we include education expenditure as a percentage of GDP into the model. This study uses annual time series data in Sri Lanka covering the period of 1990 to 2019. We used E-Views 10 statistical program to run all of the tests included in this analysis. Descriptive statistics of the variables are presented in Table 3.
We applied the ARDL cointegration procedure to examine the long-run relationships between variables. Because of its validity based on integrating the variables and sample size, the ARDL cointegration procedure developed by Pesaran et al. [93] has been used as a test method for long-run relationships between economic variables in time series analysis in many recent studies [64,94,95,96]. Other cointegration methods proposed by Engel and Granger [97] and Johansen and Juselius [98] are only valid with the cases of the same order of integration. On the other hand, the ARDL model is the most suitable model for superior performance in small samples [93].
In the procedures of estimating long-run relationships, the first step is assessing long-run relationships, as shown in Equation (1). After identifying the existence of long-run equilibrium, the next step is estimating the long-run parameters. The specific ARDL model used in this analysis is formulated as shown by Equation (2).
where is the difference operator,is the drift component, is white noise error term and correspond to the long-run relationship, show the short-run dynamics of the model. In Equation (2), the F statistic of the lagged terms is used to test whether there is cointegration among the variables or not in the long term.
In this case, the null hypothesis is that a cointegrating relationship does not exist among the variables (: = 0) while the alternative hypothesis states the existence of a cointegrating relationship among the variables (: 0). Here, the method for testing this hypothesis is to compare the F-statistic with the upper and lower bounds of critical values for the bounds test. The calculated F-statistics are compared with the upper and lower bounds of critical values. Suppose the calculated F-statistic exceeds the upper bound critical value at the considered significance value. It indicates that the case is significant and the null hypothesis is rejected, and there is a long-term relationship between the variables. If the F-statistic is lower than the lower bound of the critical value, it is insignificant and the alternative hypothesis is accepted; there is no long-term relationship. However, the decision regarding the long-term relationships between the variables is inconclusive; if the F-statistics is neither lower nor greater than the two critical values, the value lies between the upper and the lower bound of the critical value. According to the sample size, the critical bounds values are different, as explained by Pesaran et al., Narayan, and Sam et al. [93,99,100].
In the next step of the procedure, we obtain the short-run coefficients of the explanatory variables using the ARDL–ECM model, as shown by Equation (3):
where: ECT is the error correction term which measures the speed of adjustment each period toward equilibrium, is the corresponding parameter that indicates this measure, and is the error term. If the coefficient of the error correction term is statistically significant, a negative sign implies short-run disequilibrium adjustments towards the long-run equilibrium.
4. Estimating and Analyzing Results
4.1. Unit Root Analysis
Before testing cointegration, this analysis conducted unit root tests to check the order of integration for each variable using the Augmented Dickey-Fuller (ADF) test and Phillips-Perron (PP) test.
The results indicated that the null hypothesis could not be rejected at the level for all variables except FDI and GDP. It reveals that FDI and GDP are integrated into I (0). The variables LnTi, EDU, and RDE are integrated at I (1). Furthermore, the test results confirmed that no variables exceeded the order of integration I (1), and variables are a mixture of integration I (0) and I (1). The mixed order of integration of the variables, as shown in Table 4, supports applying the ARDL approach to testing for cointegration.
4.2. Lag Length Criteria
Selecting an appropriate lag length is essential before applying the ARDL test, as inappropriate lag length selection leads to a spurious outcome. Here, the appropriate lag length of the variables was selected using the Akaike information criteria (AIC). The criteria show the top twenty models, as shown in Figure 2. The ARDL model proceeded with the lowest AIC (1,1,0,3,3) for this analysis.
4.3. Diagnostic Tests
The estimated model has passed diagnostic tests that approved the desired econometric properties of a model, as shown in Table 5.
According to the Lagrange Multiplier test of serial correlation, it is suggested that the residuals are not serially correlated as we failed to reject the null hypothesis of no serial correlation. Moreover, normality test results confirmed that the hypothesis of normally distributed residuals could not be rejected and indicated that the error is normally distributed in the model. Breusch-Pagan-Godfrey’s test identified that the disturbance term in the equation is homoscedastic. Its probability value exceeded the 5% significance level and failed to reject the null hypothesis. The diagnostic test results of the estimated model confirmed that the model is free from heteroscedasticity and serial correlation.
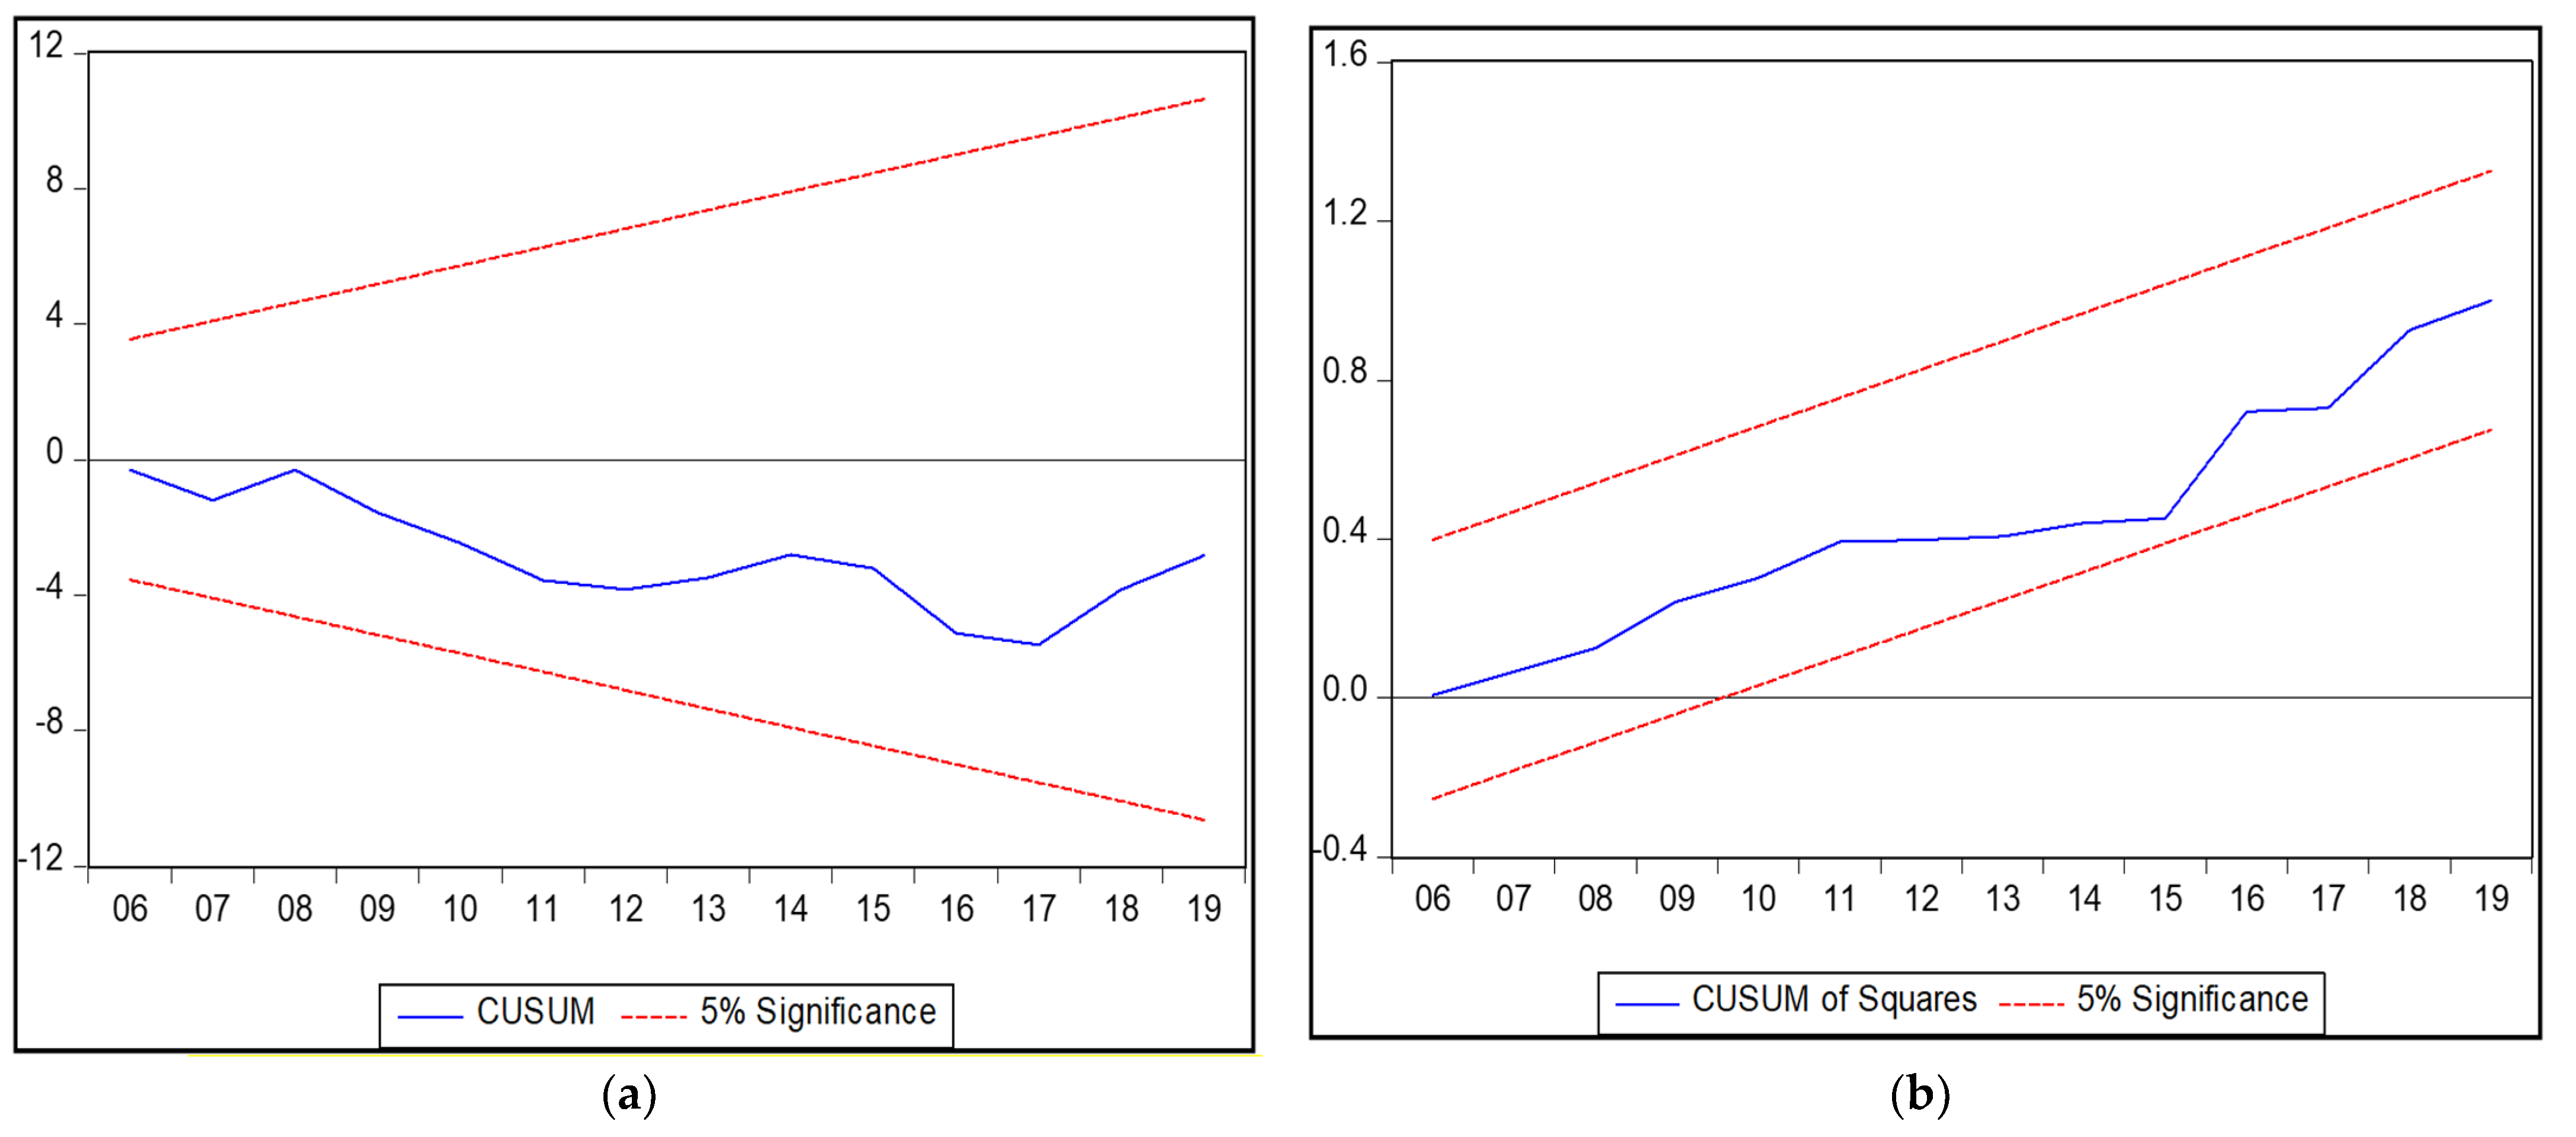
Furthermore, we employed cumulative sum (CUSUM) and cumulative sum of squares (CUSUMSQ) charts developed by Brown et al. to ensure the estimated parameters of our results’ long-run relationship [101]. According to Figure 3a,b, the CUSUM and CUSUM square plots lie within the critical lower and upper bounds at the 5% significance level. Accordingly, the chosen model is statistically stable, and the parameters corresponding to GDP, EDU, RDE, and FDI to LnTI are consistent.
4.4. ARDL Bounds Test
When LnTI is the dependent variable, the result of the bound test for the ARDL model (1,1,0,3,3) is shown in Table 6. The null hypothesis of the F-Bounds test is that there is no cointegration among variables. The null hypothesis is accepted if the calculated F-statistic is below the lower bound. If the F-statistic is higher than the upper bound, the null hypothesis is rejected and the integration among variables is confirmed We applied critical bound values given by Narayan as our study’s sample size was small [99].
The ARDL bounds test calculated the F-statistic at 17.868, above the upper bound at the 5% significance level (4.223). Therefore, we confirmed that a long-run equilibrium relationship exists among LnTI, FDI, GDP, EDU, and RDE.
4.5. Long-Run Equilibrium Relationship
The regression results in Table 7 indicate that the R squared value is 0.759 and the adjusted R2 is 0.552. This means that 76 percent of total variations in innovation in Sri Lanka are explained by changes in GDP growth rate, FDI inflows, education expenditure, and R&D expenditure. According to the long-run results, the coefficient of FDI is a negative four sign, significant at a five percent level. This suggests that FDI inflows are an important variable in explaining technological innovation in Sri Lanka. However, FDI inflows affect innovation negatively, opposite to what we hypothesized. It suggests that a higher level of FDI inflows is less likely to increase innovation in the long run.
Meanwhile, the coefficients of EDU and RDE showed positive signs at 0.260810 and 5.700958, respectively, and are statistically significant in the long run. This suggests that education expenditure and R&D expenditure are important variables in explaining technological innovation in Sri Lanka. GDP growth rate with a coefficient of 0.0134 is statistically insignificant, implying that GDP growth rate has no significant effect on innovation.
4.6. Short-Run Equilibrium Relationship
Table 8 exhibits an Error Correction Model (ECM) associated with the ARDL (1,1,0,3,3) model selected based on the Akaike Information Criteria (AIC). It shows statistical significance at the 1% level to confirm a speed of adjustment back to a long-term equilibrium with the coefficient of (ECTt−i) −0.593810 This indicates the amount of change in the innovation as a result of the deviation of the value s of the independent variables in the short run from their long-run equilibrium values by one unit.
5. Discussion
This study attempted to examine the impact of inward foreign direct investment on technological innovation in Sri Lanka from 1990 to 2019. The ARDL model was used in this study. According to the bound test results of the ARDL model, the long-run equilibrium is confirmed. After that, the long-run and short-run coefficients were calculated using the Error Correction form of the selected ARDL model. The empirical evidence demonstrated the following findings.
Expenditure on education and R&D expenditure variables are the only statistically significant variables with positive coefficients in the long run. Furthermore, it shows the importance of research and development expenditure and education expenditure to widen innovation capability in Sri Lanka. These results were consistent with the previous studies by Cheung and Lin, Shamsub, Sivalogathasan and Wu Erdal and Gocer. The coefficient of FDI is a negative sign, and it is significant at a five percent level. Inward FDI is not contributing towards widening technological innovation in Sri Lanka. More FDI will not bring higher innovation. These results are similar to the results of Chen, Gercia et al. and Shamsub Aitken, and Harrison, Haddad and Harrison, Djankov and Hoekman, and Sasidharan’s studies. The results demonstrate ways of improving regional innovation, suggesting increasing domestic research and development, improving innovation capability and absorptive capacity in domestic firms, and acquiring stock of human capital. However, most of the existing empirical studies, such as Cheung and Lin, Sivalogathasan and Wo, Eradal, Loukil, Dhrifi, Nyeadi and Adjas, confirmed that inward FDI is one of the significant elements of innovation capability in an economy. Unlike many other studies that use industry analyses, our study used a country-level analysis. The study’s scope differs from many other tasks. The motivations of MNCs entering developed and developing countries differ. The study’s findings imply that FDI may not positively impact the economy as a whole. Positive FDI spillovers may limit the economy’s specific sector with solid forward links to innovate local firms.
Furthermore, there may be some reasons for finding the weak relationship between inward FDI and innovation in Sri Lanka. Before the government implemented the economic liberalization policy in 1977 in Sri Lanka, the economy followed inward-looking policies, which had limitations for foreign investors and the free flow of FDI [13]. Later, the new government initiated an extensive economic liberalization process in 1977 [14]. Trade and investment policies promoted export-oriented industries. The inflow of FDI to the manufacturing sector accounted for more than 90%, while the service sector has not accounted for more FDI. After introducing privatization policies in the 1990s by the Sri Lankan government, the FDI became more prominent to the service sector than the manufacturing sector [102]. In the 2000s, inward FDI had focused on the infrastructure sector and services sector, while FDI to the manufacturing sector remained low, as shown in Table 9. The absorptive capacity of these two sectors is low compared to the manufacturing industry. Therefore, most foreign-funded firms were unable to acquire the maximum benefits of FDI spillovers.
Furthermore, another possible explanation for this existing relationship between FDI to Sri Lanka and innovation can be justified using trends of gross expenditure on research and development (GERD) by the source of funding, as shown in Table 10.
Gross expenditure on research and development from foreign sources as a percentage of GDP is low compared to other sources [105,106]. This further confirmed our findings on the relationship between FDI inflows and innovation. Sri Lanka has a weak tendency to accelerate its innovation capabilities utilizing foreign sources of research and development activities under the existing foreign sources. This suggests that local firm-focused research and development is essential to build innovation capabilities accompanied by more foreign sources.
6. Conclusions
The study results showed Sri Lanka has a weak tendency to accelerate its innovation capabilities utilizing foreign sources. This suggests that local firm-focused research and development is essential to build innovation capabilities accompanied by more foreign sources. Obtaining advanced technology through FDI should be the primary motivation to attract FDI from developed countries. Then, it will cause an improvement in domestic innovation capability. Hence, it is still necessary to form domestic firms with an absorptive capacity to enjoy the benefits of multinational firms.
Furthermore, our research findings can be used to formulate policies regarding future development scenarios in developing countries. According to the 2030 agenda of sustainable development, fostering innovation is considered one of the key policy priorities in most governments’ plans in developing countries. FDI is considered as a principal source of financing sustainable development goals corresponding to 17 sustainable development goals. Development policies should focus on the quality of inward FDI to foster innovation capabilities in Sri Lanka, arranging in line with Goal 9 of SDGs [107]. Hence, the government should strengthen the protection of intellectual property rights to inspire innovation. Shaping the future of FDI flows in developing countries is essential to foster innovation capability.
In this study, we interpreted our results considering the following limitations. Our research is limited to 30 years of data in one of the developing countries. Furthermore, we included only limited variables as input for innovation capability. Future research should consist of more variables such as fixed capital formation, population, number of researchers and scientists, technological enterprises, and labor productivity to have a more conclusive answer. This will be left for future studies.
Author Contributions
Conceptualization, A.A.; data curation, A.A. and M.M.; methodology, A.A.; formal analysis, A.A.; supervision, H.L.; writing—original draft preparation, A.A. All authors have read and agreed to the published version of the manuscript.
Funding
Authors have not received any funds for this research.
Institutional Review Board Statement
Not applicable.
Informed Consent Statement
Not applicable.
Data Availability Statement
Publically available data were used to analyze in this study. The data can be found from the following links: https://databank.worldbank.org/source/world-development-indicators, accessed on 24 June 2021; https://www.nipo.gov.lk/web/index.php?option=com_content&view=article&id=8&Itemid=130&lang=en, accessed on 24 June 2021.
Acknowledgments
The authors are grateful to the anonymous reviewers for their helpful comments and suggestions to improve the quality of this paper.
Conflicts of Interest
The authors declare no conflict of interest.
References
- Bodman, P.; Le, T. Assessing the roles that absorptive capacity and economic distance play in the foreign direct investment-productivity growth nexus. Appl. Econ. 2013, 45, 1027–1039. [Google Scholar] [CrossRef]
- Park, J. International student flows and R&D spillovers. Econ. Lett. 2004, 82, 315–320. [Google Scholar] [CrossRef]
- Le, T. ‘Brain drain’ or ‘brain circulation’: Evidence from oecd’s international migration and r&d spillovers. Scott. J. Political Econ. 2008, 55, 618–636. [Google Scholar] [CrossRef]
- Le, T.; Bodman, P.M. Remittances or technological diffusion: Which drives domestic gains from brain drain? Appl. Econ. 2011, 43, 2277–2285. [Google Scholar] [CrossRef]
- Adediran, A. Nigerian Institute of Advanced Legal Studies Foreign Direct Investment and Sustainable Development in Nigerian Aviation. Australas. Rev. Afr. Stud. 2019, 40, 119. [Google Scholar] [CrossRef]
- Adams, S. Foreign Direct investment, domestic investment, and economic growth in Sub-Saharan Africa. J. Policy Model. 2009, 31, 939–949. [Google Scholar] [CrossRef]
- Kobrin, S. The determinants of liberalization of FDI policy in developing countries: A cross-sectional analysis. Transnatl. Corp. 2007, 14, 67–103. [Google Scholar]
- Lipsey, R.; Sjöholm, F.; Sun, J. Foreign Ownership and Employment Growth in Indonesian Manufacturing. Natl. Bur. Econ. Res. 2010, 21, 23. [Google Scholar] [CrossRef]
- United Nations Conference on Trade and Development. World Investment Report; United Nations Conference on Trade and Development: New York, NY, USA, 2019. [Google Scholar]
- United Nations Conference on Trade and Development. World Investment Report; United Nations Conference on Trade and Development: New York, NY, USA, 1994. [Google Scholar]
- Berger, M.; Diez, J.R. Can Host Innovation Systems in Late Industrializing Countries Benefit from the Presence of Transnational Corporations? Insights from Thailand’s Manufacturing Industry. Eur. Plan. Stud. 2008, 16, 1047–1074. [Google Scholar] [CrossRef]
- Zeng, S.; Zhou, Y. Foreign Direct Investment’s Impact on China’s Economic Growth, Technological Innovation and Pollution. Int. J. Environ. Res. Public Health 2021, 18, 2839. [Google Scholar] [CrossRef] [PubMed]
- Velnampy, T.; Achchuthan, S.; Kajananthan, R. Foreign Direct Investment and Economic Growth: Evidence from Sri Lanka. 10 Years of ASARC International Conference, The Australian National University. Int. J. Bus. Manag. 2013, 9, 140. [Google Scholar] [CrossRef] [Green Version]
- Athukorala, P.; Jayasuriya, S.K. Complementarity of Trade and FDI Liberalization in Industrial Growth: Lessons from Sri Lanka. In Proceedings of the 10 Years of ASARC International Conference, Canberra, Australia, 27–28 April 2004; Available online: https://ideas.repec.org/p/pas/asarcc/2004-10.html (accessed on 11 June 2021).
- Coe, D.T.; Helpman, E.; Hoffmaister, A.W. North-South R & D Spillovers. Econ. J. 1997, 107, 134–149. [Google Scholar] [CrossRef] [Green Version]
- Potterie, B.V.P.D.L.; Lichtenberg, F. Does Foreign Direct Investment Transfer Technology Across Borders? Rev. Econ. Stat. 2001, 83, 490–497. [Google Scholar] [CrossRef]
- Aghion, P.; Harris, C.; Vickers, J. Competition and growth with step-by-step innovation: An example. Eur. Econ. Rev. 1997, 41, 771–782. [Google Scholar] [CrossRef]
- Romer, P. Endogenous Technological Change. Endog. Technol. Chang. 1989, 98, S71–S102. [Google Scholar] [CrossRef]
- Chunlai, C. Provincial Characteristics and Foreign Direct Investment Location Decision within China, Chinese Economies Research Centre (CERC) Working Papers; University of Adelaide, Australia. Available online: https://econpapers.repec.org/scripts/showcites.pf?h=repec:isa:wpaper:27 (accessed on 11 June 2021).
- Grossman, G.M.; Helpman, E. Endogenous Innovation in the Theory of Growth. J. Econ. Perspect. 1994, 8, 23–44. [Google Scholar] [CrossRef] [Green Version]
- Barro, R.; Sala-I-Martin, X. Economic Growth; McGraw-Hill: Cambridge, MA, USA, 1995. [Google Scholar]
- Lucas, R.E., Jr. On the mechanics of economic development. J. Monet. Econ. 1988, 1, 3–42. [Google Scholar] [CrossRef]
- De Mello, L.R., Jr. Foreign direct investment in developing countries and growth: A selective survey. J. Dev. Stud. 1997, 34, 1–34. [Google Scholar] [CrossRef]
- Herzer, D.; Schrooten, M. Outward FDI and domestic investment in two industrialized countries. Econ. Lett. 2008, 99, 139–143. [Google Scholar] [CrossRef]
- Goldar, B.; Banga, R. Impact of Trade Liberalization on Foreign Direct Investment in Indian Industries; ARTNeT Working Paper Series, Asia-Pacific Research and Training Network on Trade; Bangkok, Thailand. Available online: https://www.econstor.eu/handle/10419/178394 (accessed on 11 June 2021).
- Solow, R.M. A Contribution to the Theory of Economic Growth. Q. J. Econ. 1956, 70, 65. [Google Scholar] [CrossRef]
- Elboiashi, H.A.T. The Effect of FDI and Other Foreign Capital Inflows on Growth and Investment in Developing Economies. Ph.D. Thesis, Glasgow University, Glasgow, Scotland, 2011. [Google Scholar]
- Śledzik, K. Schumpeter’s View on Innovation and Entrepreneurship. SSRN Electron. J. 2013. [Google Scholar] [CrossRef]
- Aghion, P.; Bloom, N.; Blundell, R.; Griffith, R.; Howitt, P. Competition and Innovation: An Inverted-U Relationship. Q. J. Econ. 2005, 120, 701–728. [Google Scholar] [CrossRef] [Green Version]
- Aghion, P.; Blundell, R.; Griffith, R.; Howitt, P.; Prantl, S. The Effects of Entry on Incumbent Innovation and Productivity. Rev. Econ. Stat. 2009, 91, 20–32. [Google Scholar] [CrossRef] [Green Version]
- Griliches, Z.; Mairesse, J. Productivity and R and D at the Firm Level. In R and D Patents, and Productivity; University of Chicago Press: Chicago, IL, USA, 1984; pp. 339–374. [Google Scholar]
- Chu, A.C. Effects of Patent Policy on Income and Consumption Inequality in a R&D Growth Model. South. Econ. J. 2010, 77, 336–350. [Google Scholar] [CrossRef] [Green Version]
- Hu, A.G.; Png, I.P.L. Patent rights and economic growth: Evidence from cross-country panels of manufacturing industries. Oxf. Econ. Pap. 2013, 65, 675–698. [Google Scholar] [CrossRef] [Green Version]
- Crepon, B.; Duguet, E.; Mairessec, J. Research, Innovation And Productivi [Ty: An Econometric Analysis At The Firm Level. Econ. Innov. New Technol. 1998, 7, 115–158. [Google Scholar] [CrossRef]
- Belze, L.; Gauthier, O. Innovation and economic growth: Role and challenges of SME financing. International SME Review: Economy and Management of Small and Medium Enterprises. Rev. Int. PME Économie et Gest. Petite et Moy. Entrep. 2000, 13, 65–86. [Google Scholar] [CrossRef] [Green Version]
- Salomon, R.M.; Shaver, J.M. Learning by Exporting: New Insights from Examining Firm Innovation. J. Econ. Manag. Strat. 2005, 14, 431–460. [Google Scholar] [CrossRef]
- Cheung, K.-Y.; Lin, P. Spillover effects of FDI on innovation in China: Evidence from the provincial data. China Econ. Rev. 2004, 15, 25–44. [Google Scholar] [CrossRef] [Green Version]
- Liu, X.; Zou, H. The impact of greenfield FDI and mergers and acquisitions on innovation in Chinese high-tech industries. J. World Bus. 2008, 43, 352–364. [Google Scholar] [CrossRef]
- Saggi, K. Trade, Foreign Direct Investment, and International Technology Transfer. World Bank Res. Obs. 2002, 17, 191–235. [Google Scholar] [CrossRef]
- Damanpour, F. An Integration of Research Findings of Effects of Firm Size and Market Competition on Product and Process Innovations. Br. J. Manag. 2010, 21, 996–1010. [Google Scholar] [CrossRef]
- Lin, H.-L.; Lin, E.S. FDI, Trade, and Product Innovation: Theory and Evidence. South. Econ. J. 2010, 77, 434–464. [Google Scholar] [CrossRef]
- Javorcik, B.S. Can Survey Evidence Shed Light on Spillovers from Foreign Direct Investment? World Bank Res. Obs. 2008, 23, 139–159. [Google Scholar] [CrossRef]
- Bučar, M.; Rojec, M.; Stare, M.; Bu, M. Backward FDI linkages as a channel for transferring technology and building innovation capability: The case of Slovenia. Eur. J. Dev. Res. 2009, 21, 137–153. [Google Scholar] [CrossRef]
- Blalock, G.; Gertler, P.J. Welfare gains from Foreign Direct Investment through technology transfer to local suppliers. J. Int. Econ. 2008, 74, 402–421. [Google Scholar] [CrossRef]
- Jabbour, L.; Mucchielli, J.L. Technology Transfer Through Vertical Linkages: The Case of the Spanish Manufacturing Industry. J. Appl. Econ. 2007, 10, 115–136. [Google Scholar] [CrossRef] [Green Version]
- Javorcik, B.S. Does Foreign Direct Investment Increase the Productivity of Domestic Firms? In Search of Spillovers through Backward Linkages. Am. Econ. Rev. 2004, 94, 605–627. [Google Scholar] [CrossRef] [Green Version]
- Caves, R.E. Multinational Firms, Competition, and Productivity in Host-Country Markets. Economica 1974, 41, 176. [Google Scholar] [CrossRef]
- Dunning, J.H. Theory Toward an Eclectic Production: Of International Tests Some Empirical. J. Int. Bus. Stud. 1970, 11, 12–23. [Google Scholar]
- Freeman, C.; Cantwell, J. Technological Innovation and Multinational Corporations. Econ. J. 1990, 100, 621. [Google Scholar] [CrossRef]
- Wang, C.C.; Wu, A. Geographical FDI knowledge spillover and innovation of indigenous firms in China. Int. Bus. Rev. 2016, 25, 895–906. [Google Scholar] [CrossRef]
- Girma, S.; Gong, Y.; Görg, H. What Determines Innovation Activity in Chinese State-owned Enterprises? The Role of Foreign Direct Investment. World Dev. 2009, 37, 866–873. [Google Scholar] [CrossRef]
- Nyeadi, J.D.; Adjasi, C. Foreign direct investment and firm innovation in selected sub-Saharan African Countries. Cogent Bus. Manag. 2020, 7, 7. [Google Scholar] [CrossRef]
- Wang, J.; Liu, X.; Wei, Y.; Wang, C. Cultural Proximity and Local Firms’ catch up with Multinational Enterprises. World Dev. 2014, 60, 1–13. [Google Scholar] [CrossRef] [Green Version]
- Khachoo, Q.; Sharma, R. FDI and Innovation: An Investigation into Intra- and Inter-industry Effects. Glob. Econ. Rev. 2016, 45, 311–330. [Google Scholar] [CrossRef]
- Keller, W.; Yeaple, S.R. Multinational Enterprises, International Trade, and Productivity Growth: Firm-Level Evidence from the United States. Rev. Econ. Stat. 2009, 91, 821–831. [Google Scholar] [CrossRef] [Green Version]
- García, F.; Jin, B.; Salomon, R. Does inward foreign direct investment improve the innovative performance of local firms? Res. Policy 2013, 42, 231–244. [Google Scholar] [CrossRef]
- Osano, H.M.; Koine, P.W. Role of foreign direct investment on technology transfer and economic growth in Kenya: A case of the energy sector. J. Innov. Entrep. 2016, 5, 31. [Google Scholar] [CrossRef] [Green Version]
- Dhrifi, A. Foreign direct investment, technological innovation and economic growth: Empirical evidence using simultaneous equations model. Int. Rev. Econ. 2015, 62, 381–400. [Google Scholar] [CrossRef]
- Erdal, L.; Göçer, I. The Effects of Foreign Direct Investment on R&D and Innovations: Panel Data Analysis for Developing Asian Countries. Procedia Soc. Behav. Sci. 2015, 195, 749–758. [Google Scholar] [CrossRef] [Green Version]
- Zhang, L. The knowledge spillover effects of FDI on the productivity and efficiency of research activities in China. China Econ. Rev. 2017, 42, 1–14. [Google Scholar] [CrossRef]
- Kemeny, T. Does Foreign Direct Investment Drive Technological Upgrading? World Dev. 2010, 38, 1543–1554. [Google Scholar] [CrossRef]
- Sivalogathasan, V.; Wu, X. The Effect of Foreign Direct Investment on Innovation in South Asian Emerging Markets. Glob. Bus. Organ. Excel. 2014, 33, 63–76. [Google Scholar] [CrossRef]
- Chen, Y. Impact of Foreign Direct Investment on Regional Innovation Capability: A Case of China. J. Data Sci. 2007, 5, 577–596. [Google Scholar]
- Mohamed, M.; Liu, P.; Nie, G. Are Technological Innovation and Foreign Direct Investment a Way to Boost Economic Growth? An Egyptian Case Study Using the Autoregressive Distributed Lag (ARDL) Model. Sustainability 2021, 13, 3265. [Google Scholar] [CrossRef]
- Ustalar, S.A.; Şanlisoy, S. Doğrudan Yabancı Yatırımlarının Yenilik Performansı Üzerindeki Etkisi: Doğrusal Olmayan ARDL Yaklaşımı. Izmir İktisat Derg. 2020, 35, 77–89. [Google Scholar] [CrossRef]
- Ismail, N.W. Innovation and high-tech trade in Asian countries. Int. Conf. Recent Dev. Asian Trade Policy Integr. 2013, 1–19. [Google Scholar]
- Shamsub, H. Interrelationships between inward FDI and indigenous innovation in developing economies. Glob. Bus. Econ. Rev. 2014, 16, 296. [Google Scholar] [CrossRef]
- Globerman, S. Foreign Direct Investment and ’Spillover’ Efficiency Benefits in Canadian Manufacturing Industries. Can. J. Econ. /Rev. Can. d’économique 1979, 12, 42. [Google Scholar] [CrossRef]
- Blomström, M.; Persson, H. Foreign investment and spillover efficiency in an underdeveloped economy: Evidence from the Mexican manufacturing industry. World Dev. 1983, 11, 493–501. [Google Scholar] [CrossRef]
- Aitken, B.J.; Harrison, A.E. Do Domestic Firms Benefit from Direct Foreign Investment? Evidence from Venezuela. Am. Econ. Rev. 1999, 89, 605–618. [Google Scholar] [CrossRef] [Green Version]
- Haddad, M.; Harrison, A. Are there positive spillovers from direct foreign investment? J. Dev. Econ. 1993, 42, 51–74. [Google Scholar] [CrossRef]
- Djankov, S.; Hoekman, B. Foreign Investment and Productivity Growth in Czech Enterprises. World Bank Econ. Rev. 2000, 14, 49–64. [Google Scholar] [CrossRef]
- Sasidharan, S. Foreign Direct Investment and Technology Spillovers: Evidence from the Indian Manufacturing Sector. Working Paper Series, United Nations University, Maastricht Economic and Social Research Institute on Innovation and Technology, Netherland. 2006. Available online: https://www.worldscientific.com/doi/10.1142/S0217590812500117 (accessed on 24 June 2021).
- Qu, Y.; Wei, Y. The Role of Domestic Institutions and FDI on Innovation—Evidence from Chinese Firms. Asian Econ. Pap. 2017, 16, 55–76. [Google Scholar] [CrossRef]
- Loukil, K. Foreign direct investment and technological innovation in developing countries. Oradea J. Bus. Econ. 2016, 31–40. [Google Scholar] [CrossRef]
- Gardner, T.A.; Joutz, F.L. Economic Growth, Energy Prices and Technological Innovation. South. Econ. J. 1996, 62, 653. [Google Scholar] [CrossRef]
- Maradana, R.P.; Pradhan, R.P.; Dash, S.; Zaki, D.B.; Gaurav, K.; Jayakumar, M.; Sarangi, A.K. Innovation and economic growth in European Economic Area countries: The Granger causality approach. IIMB Manag. Rev. 2019, 31, 268–282. [Google Scholar] [CrossRef]
- Agénor, P.-R.; Neanidis, K.C. Innovation, public capital, and growth. J. Macroecon. 2015, 44, 252–275. [Google Scholar] [CrossRef] [Green Version]
- Sohag, K.; Begum, R.; Abdullah, S.M.S.; Jaafar, M. Dynamics of energy use, technological innovation, economic growth and trade openness in Malaysia. Energy 2015, 90, 1497–1507. [Google Scholar] [CrossRef]
- Hao, Y.; Wu, Y.; Wu, H.; Ren, S. How do FDI and technical innovation affect environmental quality? Evidence from China. Environ. Sci. Pollut. Res. 2019, 27, 7835–7850. [Google Scholar] [CrossRef]
- Allred, B.B.; Park, W.G. Patent rights and innovative activity: Evidence from national and firm-level data. J. Int. Bus. Stud. 2007, 38, 878–900. [Google Scholar] [CrossRef]
- Dang, J.; Motohashi, K. Patent statistics: A good indicator for innovation in China? Patent subsidy program impacts on patent quality. China Econ. Rev. 2015, 35, 137–155. [Google Scholar] [CrossRef]
- Maradana, R.P.; Pradhan, R.P.; Dash, S.; Gaurav, K.; Jayakumar, M.; Chatterjee, D. Does innovation promote economic growth? Evidence from European countries. J. Innov. Entrep. 2017, 6, 1–23. [Google Scholar] [CrossRef] [Green Version]
- Sun, Y.; Du, D. Determinants of industrial innovation in China: Evidence from its recent economic census. Technovation 2010, 30, 540–550. [Google Scholar] [CrossRef]
- Ang, J. Research, technological change and financial liberalization in South Korea. J. Macroecon. 2010, 32, 457–468. [Google Scholar] [CrossRef]
- Wong, C.-Y.; Goh, K.-L. Modeling the behaviour of science and technology: Self-propagating growth in the diffusion process. Science 2010, 84, 669–686. [Google Scholar] [CrossRef]
- Kim, J.; Lee, S. Patent databases for innovation studies: A comparative analysis of USPTO, EPO, JPO and KIPO. Technol. Forecast. Soc. Chang. 2015, 92, 332–345. [Google Scholar] [CrossRef]
- Coe, D.T.; Helpman, E.; Hoffmaister, A.W. International R&D spillovers and institutions. Eur. Econ. Rev. 2009, 53, 723–741. [Google Scholar]
- Durham, J. Absorptive capacity and the effects of foreign direct investment and equity foreign portfolio investment on economic growth. Eur. Econ. Rev. 2004, 48, 285–306. [Google Scholar] [CrossRef]
- Griffith, R.; Huergo, E.; Mairesse, J.; Peters, B. Innovation and Productivity Across Four European Countries. Oxf. Rev. Econ. Policy 2006, 22, 483–498. [Google Scholar] [CrossRef]
- Conrad, D.A. The Level-Specific Effects of Education on Economic Growth: Evidence from Four Caribbean Countries. J. Dev. Areas 2011, 45, 279–290. [Google Scholar] [CrossRef]
- Yun, W.S.; Yusoff, R. Determinants of public education expenditure: A review. Southeast Asian J. Econ. 2019, 7, 127–142. [Google Scholar]
- Pesaran, M.H.; Shin, Y.; Smithc, R.J. Bounds testing approaches to the analysis of level relationships. J. Appl. Econ. 2001, 16, 289–326. [Google Scholar] [CrossRef]
- Sarker, B.; Khan, F. Nexus between foreign direct investment and economic growth in Bangladesh: An augmented autoregressive distributed lag bounds testing approach. Financ. Innov. 2020, 6, 1–18. [Google Scholar] [CrossRef]
- Kim, S. The Effects of Foreign Direct Investment, Economic Growth, Industrial Structure, Renewable and Nuclear Energy, and Urbanization on Korean Greenhouse Gas Emissions. Sustainability 2020, 12, 1625. [Google Scholar] [CrossRef] [Green Version]
- Ridzuan, A.R.; Ismail, N.A.; Hamat, A.F.C. Does Foreign Direct Investment Successfully Lead to Sustainable Development in Singapore? Economies 2017, 5, 29. [Google Scholar] [CrossRef] [Green Version]
- Engele, R.F.; Granger, C.W.R. Co-Integration and Error Correction.pdf. Econometrica 1987, 55, 251–276. [Google Scholar] [CrossRef]
- Johamen, S.; Jtiselius, K. Maximum likelihood estimation and inference on cointegration—with appucations to the demand for money. Oxf. Bull. Econ. Stat. 1990, 52, 169–210. [Google Scholar]
- Narayan, P.K. The saving and investment nexus for China: Evidence from cointegration tests. Appl. Econ. 2005, 37, 1979–1990. [Google Scholar] [CrossRef]
- Sam, C.Y.; McNown, R.; Goh, S.K. An augmented autoregressive distributed lag bounds test for cointegration. Econ. Model. 2019, 80, 130–141. [Google Scholar] [CrossRef]
- Brown, R.L.; Durbin, J.; Evans, J.M. Techniques for Testing the Constancy of Regression Relationships Over Time. J. R. Stat. Soc. Ser. B Stat. Methodol. 1975, 37, 149–163. [Google Scholar] [CrossRef]
- Konara, K.M.P.S.B. Foreign direct investment in Sri Lanka: Determinants and impact. Ph.D. Thesis, York University, Heslington, UK, 2013. [Google Scholar]
- CBSL. Annual Report; Central Bank of Sri Lanka: Colombo, Sri Lanka, 2015. [Google Scholar]
- CBSL. Annual Report; Central Bank of Sri Lanka: Colombo, Sri Lanka, 2019. [Google Scholar]
- NSF. Sri Lanka Science and Technology Statistical Handbook; National Science Foundation: Colombo, Sri Lanka, 2013; pp. 2–5. [Google Scholar]
- NSF. Sri Lanka Science and Technology Statistical Handbook; National Science Foundation: Colombo, Sri Lanka, 2018; pp. 2–18. [Google Scholar]
- United Nations (UN). Transforming Our World. In The 2030 Agenda for Sustainable Development; United Nations General Assembly: New York, NY, USA, 2015; pp. 1–35. [Google Scholar]
Figure 1.
FDI inflows in Sri Lanka 1978-2019 (Current USD).
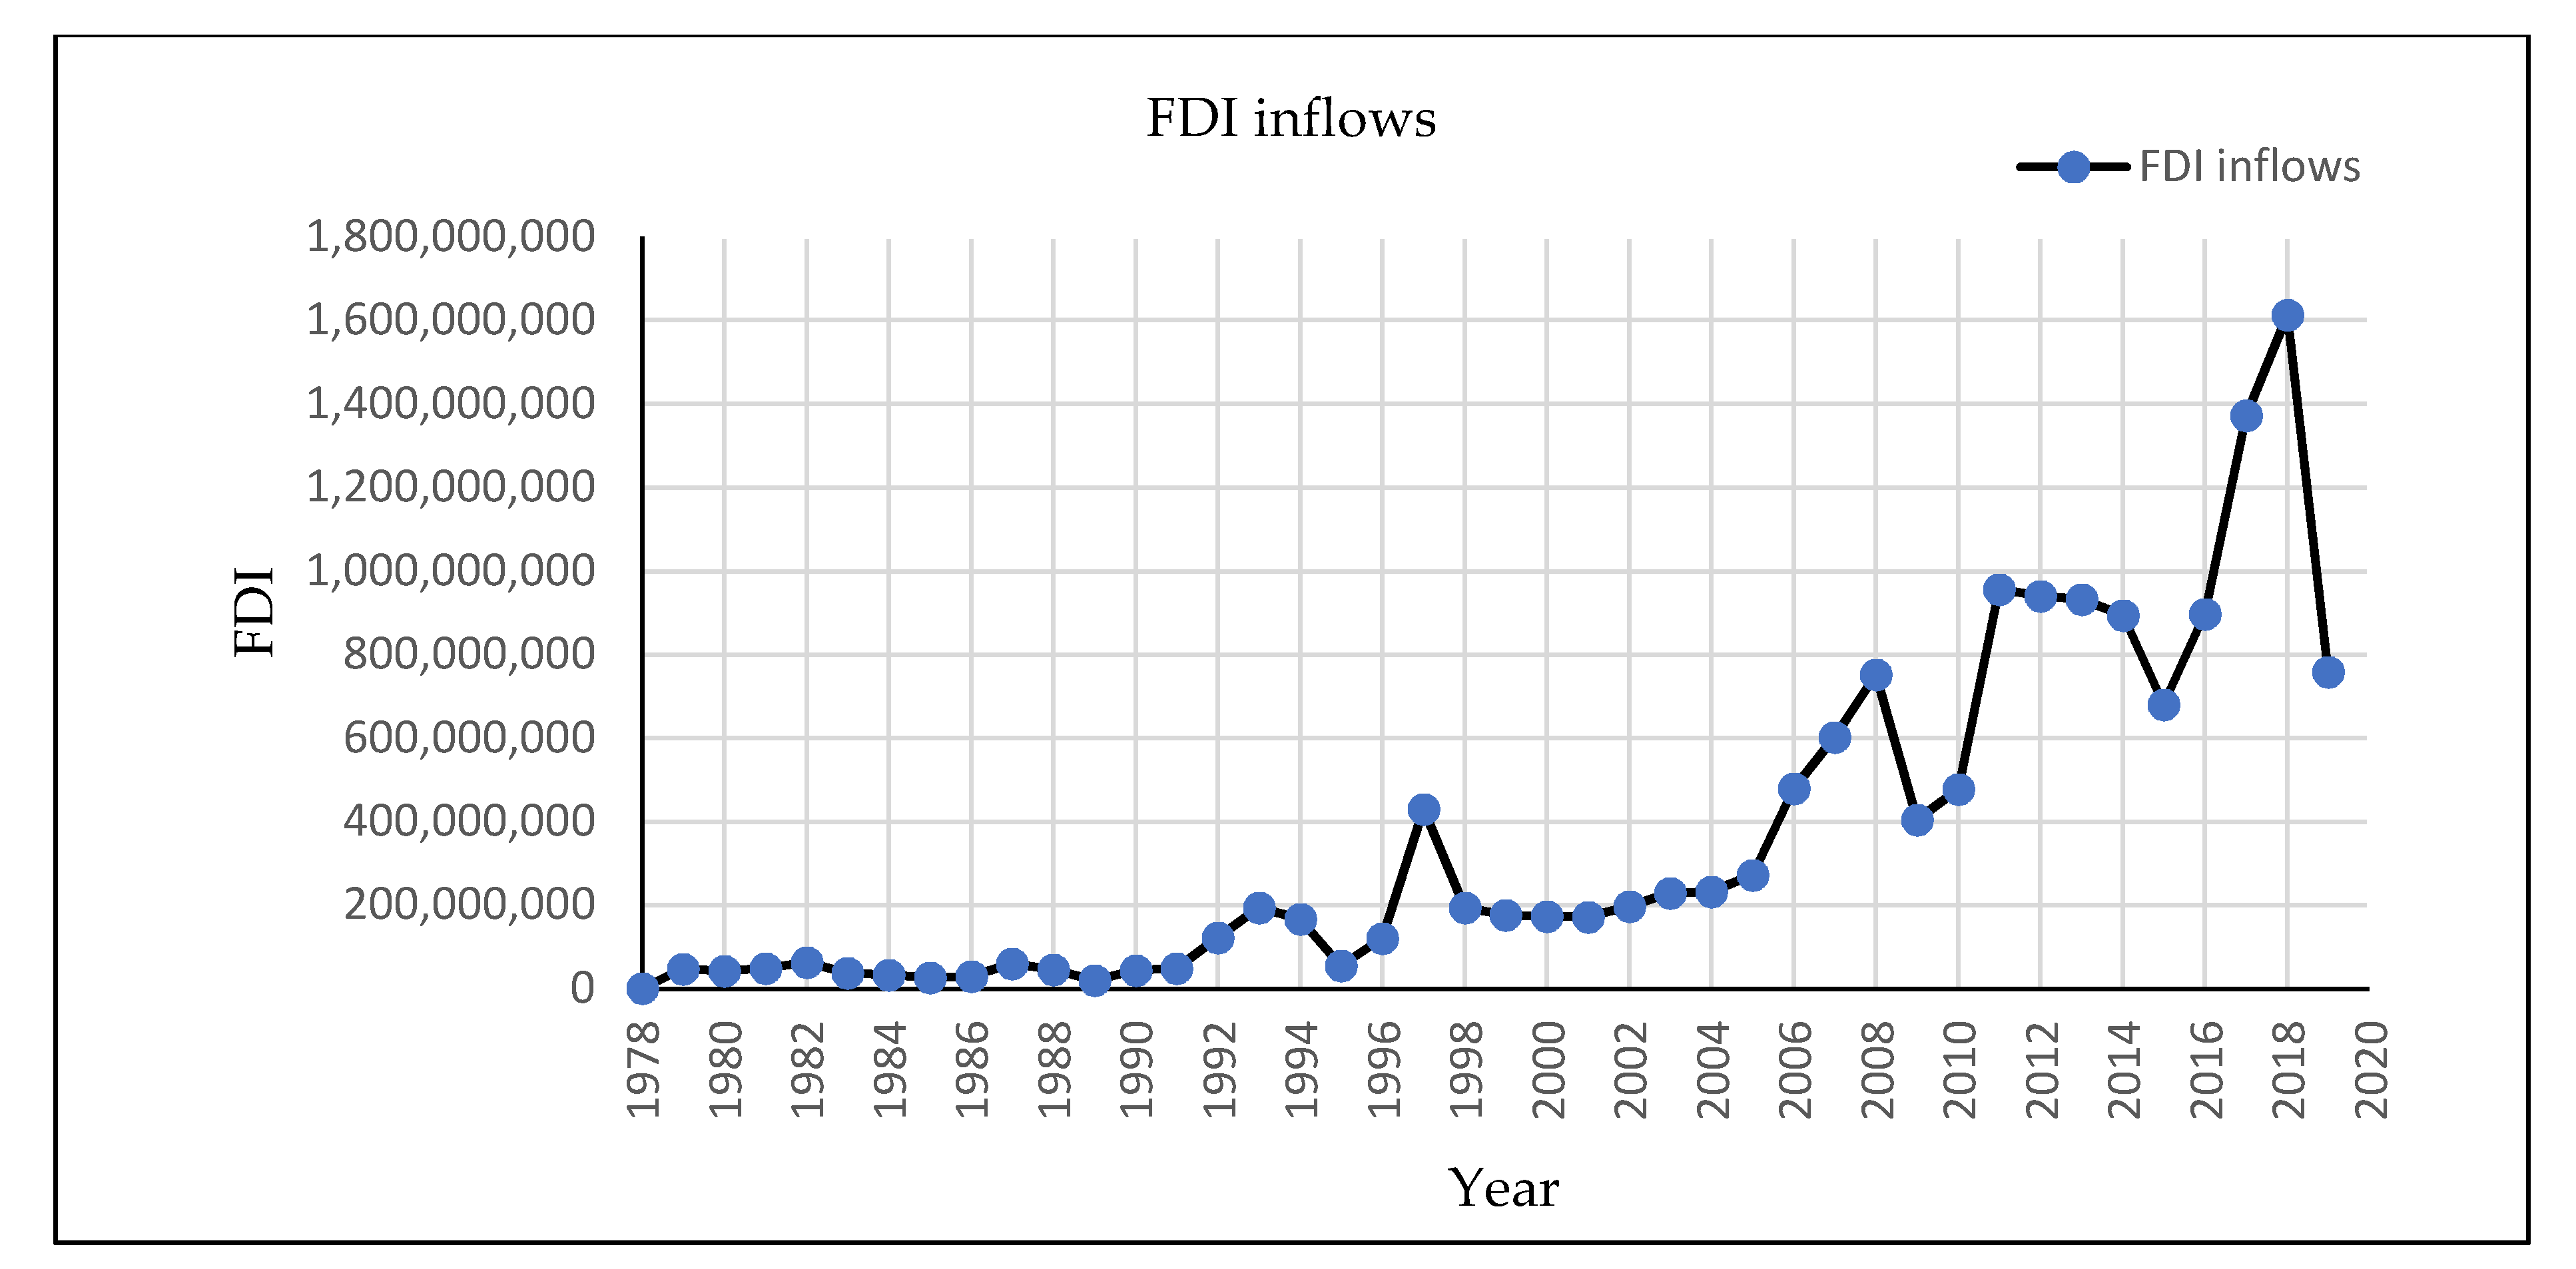
Figure 2.
Lag length of each variable. Source: Researcher’s calculation using E-Views 10.
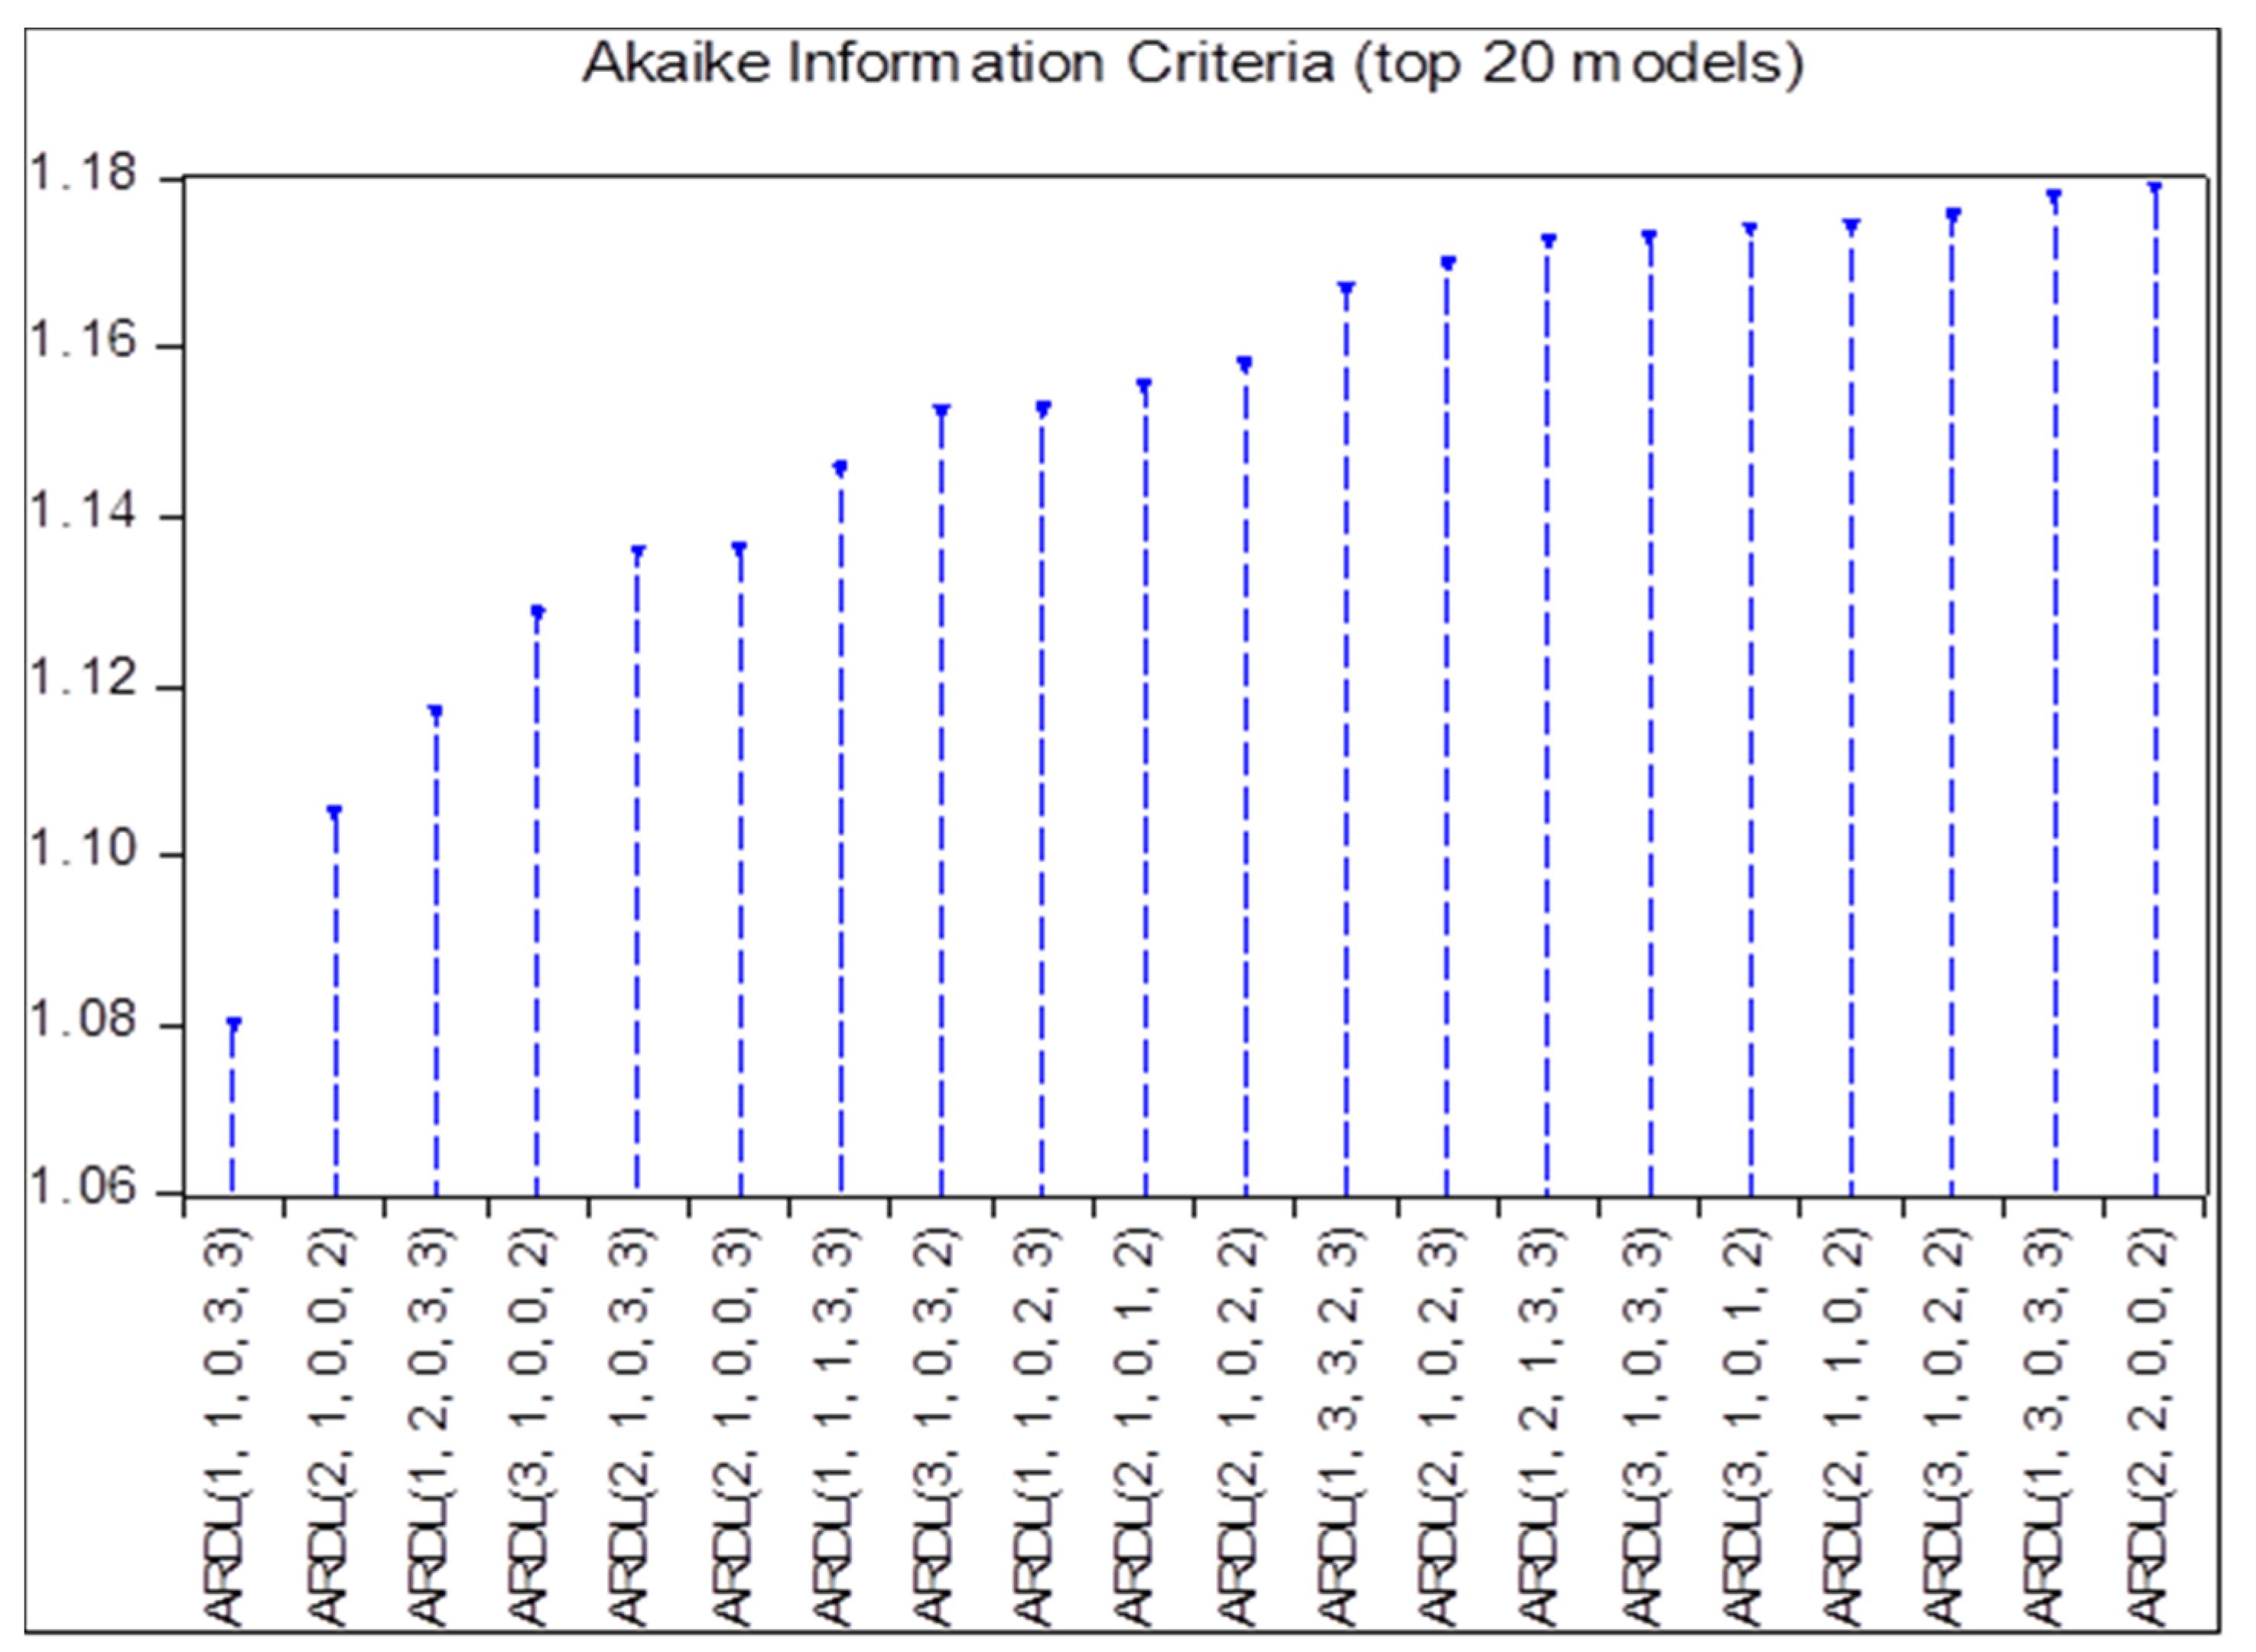
Figure 3.
(a) Cumulative Sum (CUSUM); (b) Cumulative Sum of Squares (CUSUMSQ).

Table 1.
FDI and innovation—firm/industry-level studies.
| Researcher(s) | Period | Database | Methods |
|---|---|---|---|
| Wang and Wu [50] | 2009 | A firm-level study in China | Five sets of regression analyses |
| Girma et al. [51] | 1999–2005 | A firm-level study in China—20,000 state-owned enterprises | Generalized method of moment (GMM) method |
| Nyeadi and Adjasi [52] | Nigeria 2014 and South Africa 2007: World Bank Enterprise Survey | A firm-level study in Nigeria and South Africa | Instrumental variable two-stage least square (IV2SLS) method, instrumental limited information maximum likelihood (IVLIML) method |
| Wang et al. [53] | 1998–2007 | A firm-level study in China | Regression analysis |
| Khachoo and Sharma [54] | 2000–2013 | A firm-level study in India | Log-likelihood model |
| Keller and Yeaple. [55] | 1987–1996 | A firm-level study in the United States | Ordinary Least Square (OLS) model |
| Garcia et al. [56] | 1990–2002 | A firm-level study in Spanish | Poisson regression |
| Osano and Koine [57] | 2001–2014 | The energy sector in Kenya | Regression analysis |
Table 2.
FDI and innovation—country-level studies.
| Researcher(s) | Period | Database | Methods |
|---|---|---|---|
| Dhrifi [58] | 1990–2012 | A countries level study—83 developed and developing countries | Simultaneous Equations Model (SEM) |
| Erdal and Gocer [59] | 1996–2013 | A countries level studies—10 developing countries | Fully Modified Least Squares (PFMOLS) |
| Zeng and Zhou [12] | 2004–2016 | A country-level study—China | Dynamic panel simultaneous-equation model |
| Zhang [60] | 2004–2012 | A country-level study—China | Generalized method of moment(GMM) |
| Kemeny [61] | 1975–2000 | A countries level study—119 countries in Europe, America, and Asia. | Generalized method of moment(GMM) |
| Sivalogathasan and Wu [62] | 2000–2011 | A countries level study—South Asian country | Ordinary least square (OLS) model |
| Cheung and Lin [37] | 1995–2000 | A country-level study—China | Ordinary Least Square (OLS) model |
| Chen [63] | 2004 | A country-level study—China | Ordinary Least Square (OLS) model |
| Mohamed et al. [64] | 1990–2019 | A country level study—Egypt | ARDL method |
| Ustalar and Sanlisoy [65] | 1984–2017 | A country-level study—Turkey | Non-linear autoregressive distributed lag (NARDL) |
| Loukil 2016 [75] | 1980–2009 | A countries level study—54 developing countries | Panel threshold model |
Table 3.
Descriptive statistics of the variables.
| Statistics | EDU | FDI | RDE | TI | GDP |
|---|---|---|---|---|---|
| Mean | 2.293000 | 1.252912 | 0.103000 | 56.73333 | 5.172965 |
| Median | 2.310000 | 1.157522 | 0.110000 | 54.50000 | 5.226372 |
| Maximum | 3.060000 | 2.849580 | 0.180000 | 220.0000 | 9.144572 |
| Minimum | 1.560000 | 0.429754 | 0.000000 | 11.00000 | −1.545408 |
| Std. Dev. | 0.443584 | 0.489321 | 0.055470 | 37.60130 | 2.065283 |
| Skewness | −0.019560 | 1.048155 | −0.875986 | 2.760139 | −0.808621 |
| Kurtosis | 1.844386 | 5.080466 | 2.682458 | 12.98912 | 5.165784 |
| Jarque-Bera | 1.671218 | 10.90356 | 3.962803 | 162.8200 | 9.132617 |
| Probability | 0.433610 | 0.004289 | 0.137876 | 0.000000 | 0.010396 |
Table 4.
Unit root test results.
| Variable | ADF Test Statistics (with Trend and Intercept) | PP Test Statistics (with Trend and Intercept) | ||||
|---|---|---|---|---|---|---|
| Level | First Difference | Order of Integration | Level | First Difference | Order of Integration | |
| LnTI | −2.92 | −5.48 * | I (1) | −5.68 * | −18.33 * | I (1) |
| FDI | −4.67 * | −5.19 * | I (0), I (1) | −6.43 * | −9.32 * | I (0), I (1) |
| GDP | −3.94 * | −7.80 * | I (0), I (1) | −3.94 * | −19.18 * | I (0), I (1) |
| EDU | −2.91 | −6.48 * | I (1) | −2.96 | −5.70 * | I (1) |
| RDE | −2.60 | −4.48 * | I (1) | −2.41 | −16.90 * | I (1) |
Note: * shows significance at 5%. ADF: Augmented Dickey-Fuller; PP: Phillips-Perron.
Table 5.
Diagnostic tests results.
| Items | Test | Probability Value |
|---|---|---|
| Serial correlation | Breusch-Godfrey Serial Correlation LM Test | 0.3163 |
| Normality | Normality Test (Jarque-Bera) | 0.5126 |
| Heteroscedasticity | Breusch-Pagan-Godfrey | 0.8471 |
Source: Researcher’s calculation using E-Views 10.
Table 6.
ARDL bounds test results.
| F-Bounds Test | Null Hypothesis: No Levels Relationship | |||
|---|---|---|---|---|
| Test Statistic | Value | Significant Level | I (0) | I (1) |
| F-statistic K = 4 | 17.868 | 10% | 2.525 | 3.560 |
| 5% | 3.058 | 4.223 | ||
| 1% | 4.280 | 5.840 | ||
Table 7.
Estimated long-run coefficients.
| Selected Model: ARDL (2,2,1,0,1) Dependent Variable is LnTI | ||||
|---|---|---|---|---|
| Variable | Coefficient | Standard Error | t-Statistic | p-value |
| FDI | −0.576635 | 0.214343 | −2.690246 | 0.0176 * |
| GDP | 0.013455 | 0.023356 | 0.576096 | 0.5737 |
| EDU | 0.260810 | 0.146114 | 1.784985 | 0.0959 ** |
| RDE | 5.700958 | 1.332285 | 4.279082 | 0.0008 * |
| R-squared | 0.759168 | |||
| Adjusted R-squared | 0.552740 | |||
| F-statistic | 3.677646 | |||
| Prob(F-statistic) | 0.011534 | |||
Note: *, ** Significance at 5 percent and 10 percent level. Source: Researcher’s calculation using E-Views 10.
Table 8.
Error correction representation of the ARDL model.
| Selected Model: ARDL (2,2,1,0,1 Dependent Variable is D(LnTI(-1)) | ||||
|---|---|---|---|---|
| Variable | Coefficient | Standard Error | t-Statistic | p-Value |
| D(FDI) | −0.016211 | 0.116883 | −0.138695 | 0.8917 |
| D(EDU) | −0.059020 | 0.286751 | −0.205823 | 0.8399 |
| D(EDU(-1)) | −0.566639 | 0.274799 | −2.062009 | 0.0583 |
| D(EDU(-2)) | 0.476211 | 0.239712 | 1.986591 | 0.0669 |
| D(RDE) | −3.257514 | 1.691467 | −1.925851 | 0.0747 |
| D(RDE(-1)) | −5.740806 | 1.980127 | −2.899211 | 0.0117 |
| D(RDE(-2)) | 3.935395 | 1.492745 | 2.636348 | 0.0195 |
| ECT(-1) | −0.593810 | 0.132132 | −12.06224 | 0.0000 |
| R-squared | 0.905931 | |||
| Adjusted R-squared | 0.871275 | |||
Source: Researcher’s calculation using E-Views 10.
Table 9.
Sectoral FDI inflows to Sri Lanka (USD in millions).
| Sector | 2005 | 2010 | 2015 | 2019 |
|---|---|---|---|---|
| Manufacturing | 135.32 | 159.65 | 257.0 | 319.5 |
| Agriculture | 0.47 | 6.45 | 3.9 | 1.3 |
| Services and infrastructure | 151.41 | 350.20 | 708.8 | 867.9 |
Table 10.
Gross expenditure on research and development (GERD) by the source of funding as a % of GDP.
Publisher’s Note: MDPI stays neutral with regard to jurisdictional claims in published maps and institutional affiliations. |
© 2021 by the authors. Licensee MDPI, Basel, Switzerland. This article is an open access article distributed under the terms and conditions of the Creative Commons Attribution (CC BY) license (https://creativecommons.org/licenses/by/4.0/).
Share and Cite
MDPI and ACS Style
Adikari, A.P.; Liu, H.; Marasinghe, M. Inward Foreign Direct Investment-Induced Technological Innovation in Sri Lanka? Empirical Evidence Using ARDL Approach. Sustainability 2021, 13, 7334. https://doi.org/10.3390/su13137334
AMA Style
Adikari AP, Liu H, Marasinghe M. Inward Foreign Direct Investment-Induced Technological Innovation in Sri Lanka? Empirical Evidence Using ARDL Approach. Sustainability. 2021; 13(13):7334. https://doi.org/10.3390/su13137334
Chicago/Turabian StyleAdikari, AM.Priyangani, Haiyun Liu, and MMSA. Marasinghe. 2021. "Inward Foreign Direct Investment-Induced Technological Innovation in Sri Lanka? Empirical Evidence Using ARDL Approach" Sustainability 13, no. 13: 7334. https://doi.org/10.3390/su13137334
Note that from the first issue of 2016, this journal uses article numbers instead of page numbers. See further details here.