Article

Combining Business Model Innovation and Model-Based Analysis to Tackle the Deep Uncertainty of Societal Transitions—A Case Study on Industrial Electrification and Power Grid Management

Institute of Sustainable Development (INE), Zurich University of Applied Sciences ZHAW, Technoparkstrasse 2, 8401 Winterthur, Switzerland
*
Author to whom correspondence should be addressed.
Sustainability 2021, 13(13), 7264; https://doi.org/10.3390/su13137264
Submission received: 17 May 2021 / Revised: 9 June 2021 / Accepted: 15 June 2021 / Published: 29 June 2021
(This article belongs to the Special Issue Analyzing Development Paths of Emerging Energy Technologies)

Abstract

:
Creating new business models is crucial for the implementation of clean technologies for industrial decarbonization. With incomplete knowledge of market processes and uncertain conditions, assessing the prospects of a technology-based business model is challenging. This study combines business model innovation, system dynamics, and exploratory model analysis to identify new business opportunities in a context of sociotechnical transition and assess their prospects through simulation experiments. This combination of methods is applied to the case of a potential business model for Distribution System Operators aiming at ensuring the stability of the electrical grid by centralizing the management of flexible loads in industrial companies. A system dynamics model was set up to simulate the diffusion of flexible electrification technologies. Through scenario definition and sensitivity analysis, the influence of internal and external factors on diffusion was assessed. Results highlight the central role of energy costs and customer perception. The chosen combination of methods allowed the formulation of concrete recommendations for coordinated action, explicitly accounting for the various sources of uncertainty. We suggest testing this approach in further business model innovation contexts.

1. Introduction

Climate change mitigation requires a transition to a low-carbon society, i.e., significant reductions of greenhouse gas (GHG) emissions. The decarbonization of the energy sector is decisive to this end [1]. Thanks to several effective climate policies and technological progress, the share of power generation stemming from renewable sources (such as solar and wind) has largely increased in the previous years, and an accelerated uptake of related technologies is expected for the future [2]. Additionally, major technological changes in the industrial sectors are necessary to achieve a low-carbon transition [3]. There are several pathways to reduce GHG emissions in the industry, such as adopting highly energy-efficient technologies, implementing carbon capture and storage systems, and the electrification of production processes [4]. The strong penetration of renewables provides the necessary carbon-neutral energy sources for a clean industrial electrification.
However, the increase of renewables and the electrification of industrial processes pose major challenges to the electricity grid. On the one side, the variability and unpredictability of renewables may compromise grid stability. Therefore, additional control measures and flexibilities on the level of the distribution grid are needed to maintain the balance between supply and demand [5]. On the other side, the electrification of industrial processes increases peak demand, thus increasing grid congestion and the need to upgrade grid capacity unless alternative measures are developed [6]. An interesting option is the use of digital technologies that enable smart solutions to deploy novel flexibilities. Smart controlling of electrification technologies not only contributes to decarbonization, but also could provide flexibility services to the grid, facilitating the integration of renewables by absorbing excess energy or decreasing the demand in peak hours. Likewise, smart control can mitigate congestion problems by reallocating the peak demand [7].
While many technological solutions exist for electrification, flexibility, and smart grid control, a crucial step for their successful implementation is the formulation of appropriate business models [8,9]. Several scholars have recognized that business models play an important role in the transition dynamic; they can help as drivers for novel technologies to disrupt the regime and as coordinators between different actors [10,11]. Today, energy-related companies need to continuously monitor for new opportunities to reconfigure their business model to secure market shares, revenues, and profits [8,12]. Business model innovation (BMI) supports the transformation of traditional business models by identifying new opportunities. The process starts by understanding the changing environment, recognizing significant trends that can trigger important changes, and ends with integrating the innovative business model into the company and implementing the business idea [13].
However, there exists high uncertainty regarding the impact of the changing business environment on market development and the long-term value creation of envisioned business models [14]. Thompson and Macmillan (2010) [14] state that “high uncertainty contexts give us the ‘luxury’ of specifying a priori what will and will not be acceptable” in order to save resources and to define appropriate key actions. However, in the early exploratory stage of business model conceptualization, managers face the uncertainty and unpredictability of fast-evolving markets and may have a biased mental model of the environment [15]. In addition, business models sometimes require coordination among different actors, each with their own interests, priorities, and mental models. The situation in which decision makers are faced with multiple equally plausible futures and system models, termed “deep uncertainty”, calls for creative thinking and model-based decision support [16]. More generally, there is a research gap on the implementation, tools, and challenges of business model innovation [17], including the conceptualization of the business model and value proposition. In the specific context of the energy system, the ongoing sociotechnical transition is a highly uncertain and complex environment for incumbent companies and new players [18,19]. Several actors, such as energy utilities and Distribution System Operators (DSO), need to rapidly reconfigure their business model to adapt to this changing environment, which also entails changes for their customers. According to several authors [8,12,20,21], companies of the energy sector lack the business model innovation knowledge that helps to identify new opportunities within the energy transition.
To overcome these challenges of business model innovation, experimentation should be used to frame and understand the uncertainty of the business environment [22]. In the face of the high costs and limited feasibility of running experiments in the real world, simulation offers a low-cost alternative. For example, system dynamics (SD) is a methodology to map the interaction of many variables in complex systems and explore their behavior through simulation models [23]. In the context of business model innovation, SD has been shown to facilitate decision makers’ understanding of the impact of environmental changes [24]. Indeed, the implementation of new business models depends not only on internal factors within the company but also on new regulations, uncertainties in the market, and social acceptance. SD can capture the relationship between internal and external factors and reflect realistic situations considering different political, economic, and social circumstances [25]. This way, a clear action plan can be developed that helps coordinate the activities of different actors over time. SD has also been used to tackle deep uncertainty, using computational experimentation to yield insight from simulation models under imperfect system knowledge and uncertain future conditions [26].
Furthermore, as mentioned by Bolton and Hannon (2016) [18], the external factors can be a significant determinant of the extent to which a business model can play an important role in the transition. They argue that business models cannot be a vehicle for sociotechnical transformations without major reforms to political, regulatory, and market structures. Therefore, it is critical to analyze the impact of a sociotechnical context on the business model [27] to understand their real potential and scaling possibilities [28].
This paper addresses the research–practice gaps in business model innovation (see above) by presenting a combination of two established fields of methods (BMI and SD) and complementing them with a prospective transition analysis to provide a holistic assessment of the scalability of a novel time-based business model at the energy–industry interface. This combined framework aims at helping multiple actors develop a qualified and consolidated a priori understanding of the impact of the highly uncertain energy transition environment. The first steps consist of a customer and market characterization and the definition of a concrete business model. Next, in a participatory process, a system dynamics model is developed to simulate the diffusion of flexible electrification technologies. To determine which factors have the greatest effect on the uncertainty of model outputs, two series of computational experiments are conducted: a scenario analysis and a sensitivity analysis with statistical estimation of parameter importance. Based on the qualified understanding and the literature, a sociotechnical analysis highlights the possible barriers and drivers for the potential upscaling of the proposed business model. The aim of this approach is to support experimental learning and the co-creation of new value propositions in a cost-effective way. This methodical framework was applied to a time-based business model for a DSO (described in Section 3.1) aiming at avoiding grid congestion in a future of increased electrification. The main idea is to allow the use of redundant grid capacity (which is currently reserved to guarantee security of supply in the case of a failure of power lines) for specific loads with a certain degree of flexibility. The business model is targeted at industrial customers and requires the coordination of various actors: the DSO, utility, technology providers, and policymakers. The environment also depends on uncertain exogenous factors such as future fuel and electricity prices, technology costs, and energy and climate policy, and it is embedded in the complex context of the energy transition. We use the proposed methodical framework to answer the following questions:
  • Which circumstances favor or hinder the success of the time-based business model and the diffusion of flexible electrification technologies?
  • Which are the main leverage points for the different actors to ensure the success of the business model?
The rest of this paper is structured as follows: Section 2 reviews the state of the research in the methodologies combined in this study (BMI, SD, and sociotechnical transition frameworks), Section 3 presents the methods (description of the business model, system dynamics model and computational experiments, prospective transition framework), Section 4 presents the results, Section 5 discusses the implications of the results from a sociotechnical transition perspective as well as the methodological aspects of this study, and Section 6 summarizes the method applied and the lessons learned from this first application and formulates recommendations to the different actors.

2. Literature Review

We base our case study on the conceptual literature of business model development under uncertainty in the current context of sustainable transition from a fossil-based to a low-carbon energy system. In this section, we briefly review the relevant literature related to the applied methods.

2.1. Business Model Innovation in the Energy Transition

A business model describes how an enterprise creates value for specific customers with a positive financial profit equation. Business model innovation (BMI) is the process of creating and capturing new value by introducing a change on one or several components of an existing business model [29]. According to Frankenberger et al. (2013) [13], the BMI process consists of four different phases: initiation, ideation, integration, and implementation. In the initiation phase, a preliminary assessment is performed to understand the changing environment and recognize significant trends that can trigger important changes. The ideation phase aims at generating new business ideas. In the third phase, ideas are transformed into viable business models, and finally, in the last phase, the innovative business model can be implemented [13].
BMI is an important process in constantly evolving environments, where the primary business model is challenged and thus needs to be adapted [30]. In this kind of context with often deep uncertainty, BMI is not a matter of anticipating and foreseeing the future, but more a trial-and-error adaptation process, experimenting with variants of business model configurations [31]. Therefore, imagination, experimentation, and ongoing learning are crucial in the development of novel business models [15,32]. Experimentation with a business model is an iterative process that implies elaborating the initial value proposition into a viable business strategy, the implementation of the strategy, the incorporation of feedback from the environment, and the consequent modification of the business model [33]. Several case studies show that concurrent experimentation with different business models under uncertainty creates a variety of options that facilitate the long-term survival of a company [33,34]. The authors suggest that such simultaneous experimentation is a crucial learning strategy to cope with uncertainty in a cost-effective manner. Simultaneous experimentation involves careful selection of related experiments and a combined approach of planning, action, and learning.

2.2. System Dynamics and Exploratory Modeling

For BMI, conceptual representation (in written, pictorial, mathematical, or symbolic forms) facilitates the understanding and communication of new business model ideas within the organization and between actors [35]. Simulation modeling is a valuable tool to assess the consequences of changes in business models through conceptual representation and simulation of virtual experiments [36]. System dynamics (SD) is a methodology combining graphical representation and mathematical modeling to understand the behavior of complex systems over time [23]. This technique allows the evaluation of how a business strategy performs over time and what can be done to influence this performance [37]. SD models can capture the relationship between endogenous and exogenous dynamics, thus permitting the evaluation of a business project under different political, economic, and social circumstances [25]. Therefore, SD models can be used to facilitate the experimentation phase of BMI [22] and improve the understanding of decision makers [24].
Often, modelers and decision makers have limited knowledge of the processes shaping the business environment. Additionally, when future prospects of a business model are evaluated, it is necessary to make assumptions about the evolution of external factors, for which widely varying scenarios might be equally plausible. Therefore, multiple possible model formulations and multiple possible futures exist, with often not enough information to assess their likelihood. This situation is referred to as “deep uncertainty” [16,26]. In this case, models should not be treated as predictive tools, but rather as a way to explicitly examine modeling uncertainties [38]. Such an explorative approach to modeling consists of conducting visual or statistical analysis on an ensemble of model runs, where model structure, inputs, and parameters are varied [38]. The value of such a model-based decision-making approach lies in the capacity to answer questions such as “under which circumstances is a business model promising?” or “what is the range of plausible outcomes?” [26]. This explorative approach has been used in combination with SD in the context of future-oriented technology analysis [26] and sociotechnical transformation of energy systems [19].
For an exploratory approach, Bankes (1993) [38] argues that simple, question-specific models are better suited than more complex models that aim at a highly disaggregated and detailed description of the system. Additionally, Ghaffarzadegan et al. (2011) [39] strongly recommend the use of small SD models to facilitate experimentation and to carve out critical insights. Ghaffarzadegan et al. (2011) [39] define a small model as a model consisting of few critical stocks and a maximum of eight feedback loops. As long as the model structure captures the most dominant feedback loops and stocks, it can be used to easily identify the most important leverage points of the system. More complex models, or other modeling techniques such as agent-based modeling, can also be used to simulate the adoption of business models. Nevertheless, one of their most important drawbacks is the increase in complexity, which makes parameter identification and sensitivity analysis difficult [40].

2.3. Transition Theory and Business Models

One objective of sociotechnical transition research is to understand both the conditions under which a technological niche can disrupt the existing sociotechnical regime [41] and the role of the surrounding innovation system in this transition [42]. Such transition frameworks have proven to be helpful to analyze energy and environmental transition problems [27].
Several researchers recognize that business models play a very important role in sociotechnical transitions [11,43,44]. For example, they are seen as vehicles to disrupt the regime [44]. Alternatively, business models can themselves constitute innovations, rather than just being vectors for the diffusion of technological innovations. According to Bidmon and Knab [11], business model innovations emerge at a higher level of structuration of activities and entail the formation of new collaborations between actors. Furthermore, Wüstenhagen et al. [43] highlight that business model innovation might help to overcome some of the key barriers to the upscaling of sustainable technologies.
Nevertheless, Bolton and Hannon [18] argue that without major reforms to political, regulatory, and market structures, business model innovation alone would not be able to induce large system changes. Therefore, it is recommended to complement diffusion modeling with sociotechnical analysis to better understand the role of the broader context [27].
Van Waes et al. propose a sociotechnical transition framework to assess the upscaling potential of business models [28]. The framework distinguishes the business model context and the sociotechnical context. The first one explains not only the business model logic but also the increasing returns to adoption, i.e., how network externalities accelerate the diffusion process. The second addresses the broader impact of institutions and the industry structure. The latter describes the characteristics of relevant firms, such as size, experience, and local embeddedness. The institutions refer to the regulatory framework as well as the norms and beliefs that affect the business model scaling. In sum, all these dimensions are critical to assessing the barriers and drivers for the upscaling of innovative business models.

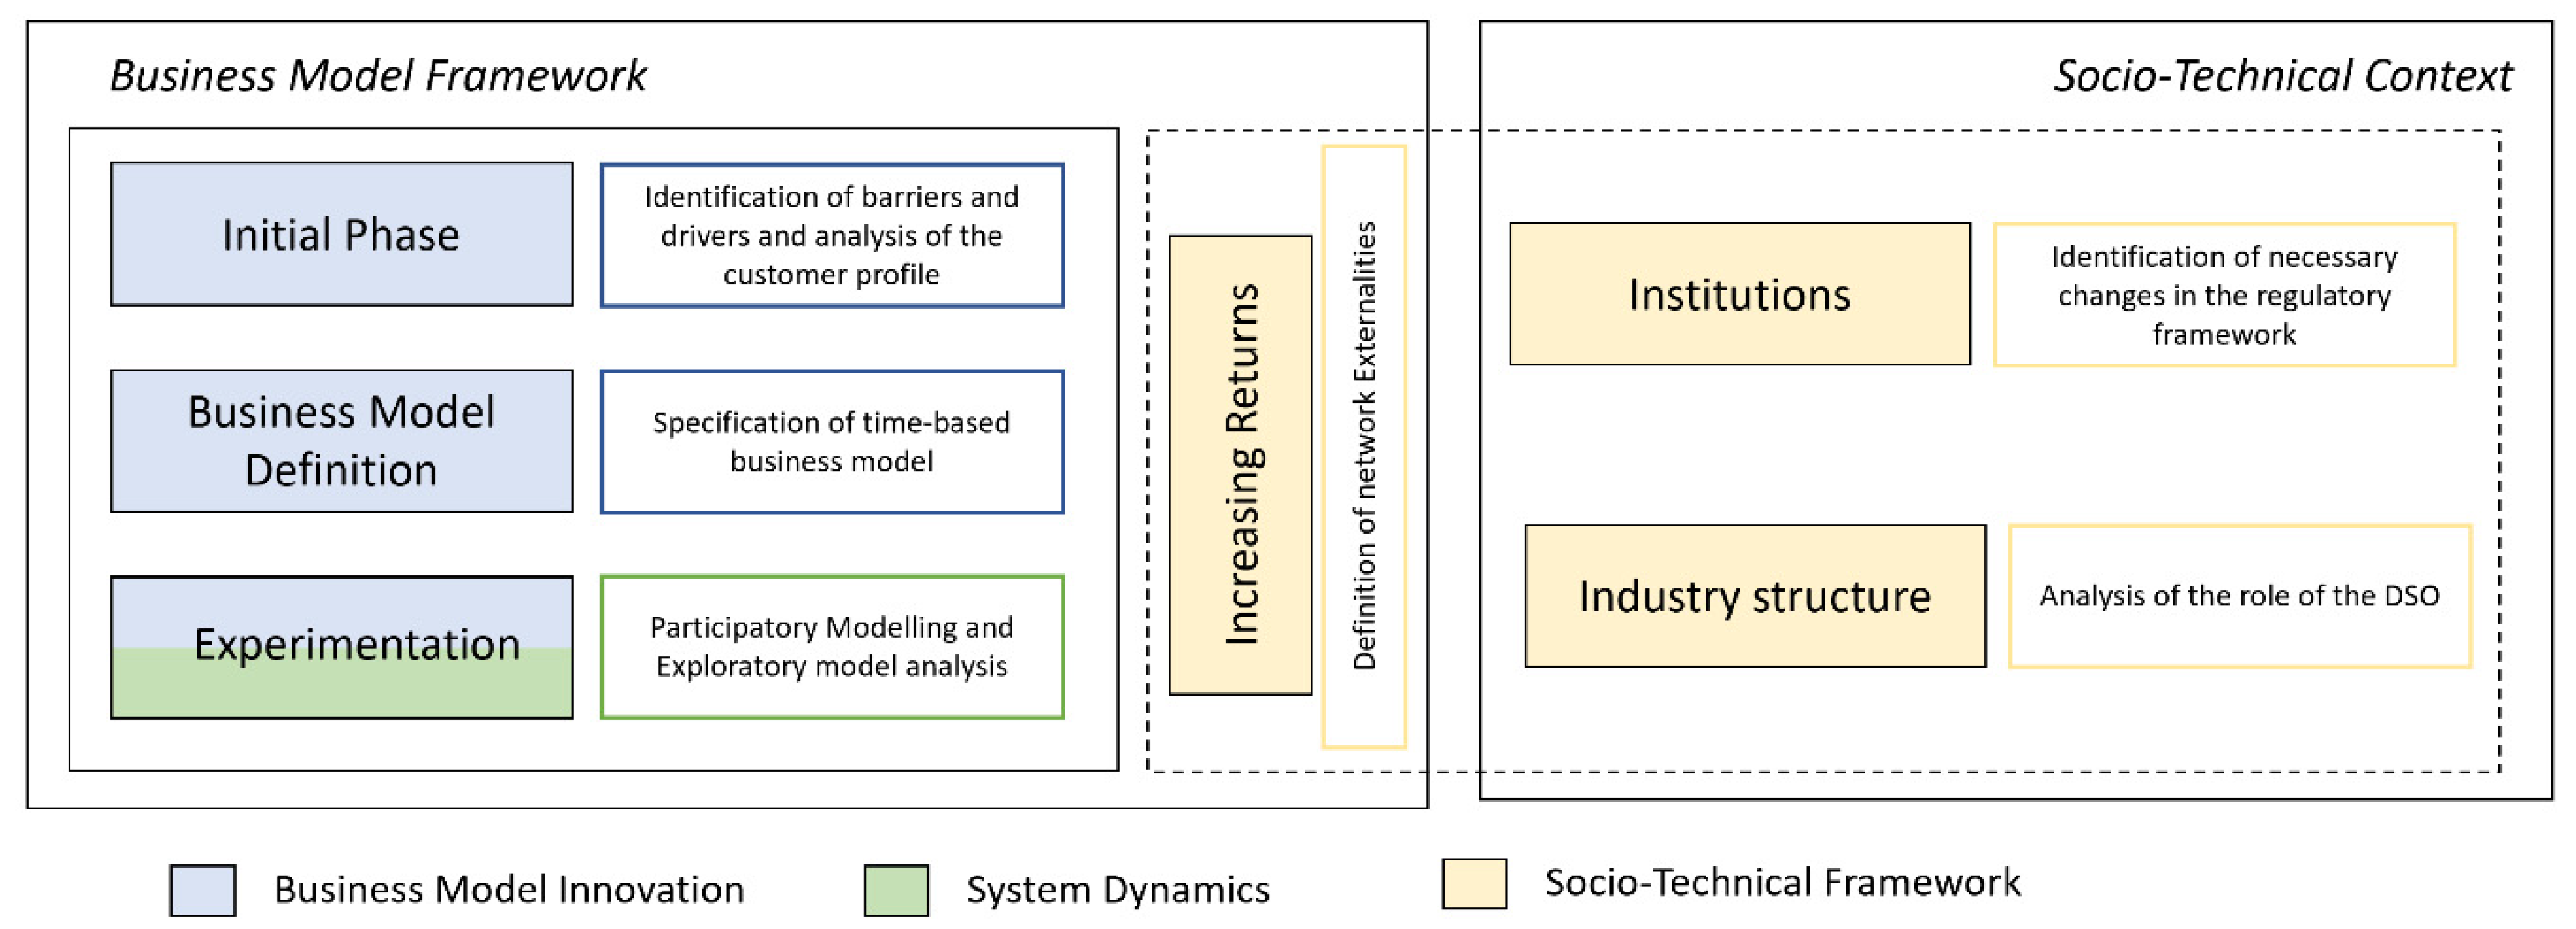
3. Materials and Methods

In this section, we develop the methodical framework and present illustrative outcomes of distinct methodical steps. Our study applies a case study design [45] contributing to a transnational research project, with the objective of designing and testing an innovative time-based flexibility business model (named the “Power Alliance” (PA) business model; see Section 3.1). This business model depends on the diffusion of flexible electrification technologies in the industrial sector. The proposed theoretical framework is illustrated in Figure 1. First, the barriers and drivers for the electrification of industrial processes were identified. Afterward, explorative interviews with potential customers were performed. In a next step, several workshops with project partners were organized to concretely define the business model. The project partners were representatives of an energy company (taking here the role of technology and business developer), a Distribution System Operator (user of the time-based business model defined here), three pilot customers (industrial customers in the service area of the DSO), an information technology company (assisting in technology development), and the interdisciplinary research team. The ten project partners are considered experts in the current and envisioned business field.
Next, an SD model was set up to simulate the diffusion of flexibility technologies. To assess the prospects of the proposed business model under various socio-economic and regulatory settings, two sorts of computational experiments were performed: scenario experiments and parametric sensitivity analysis. Finally, the sociotechnical framework from van Waes et al. (2018) was adapted to assess the scalability of the business model in its context. The feasibility of the business model from a regulatory point of view was ensured by seeking feedback from a trade association of the energy industry.

3.1. Business Model Innovation

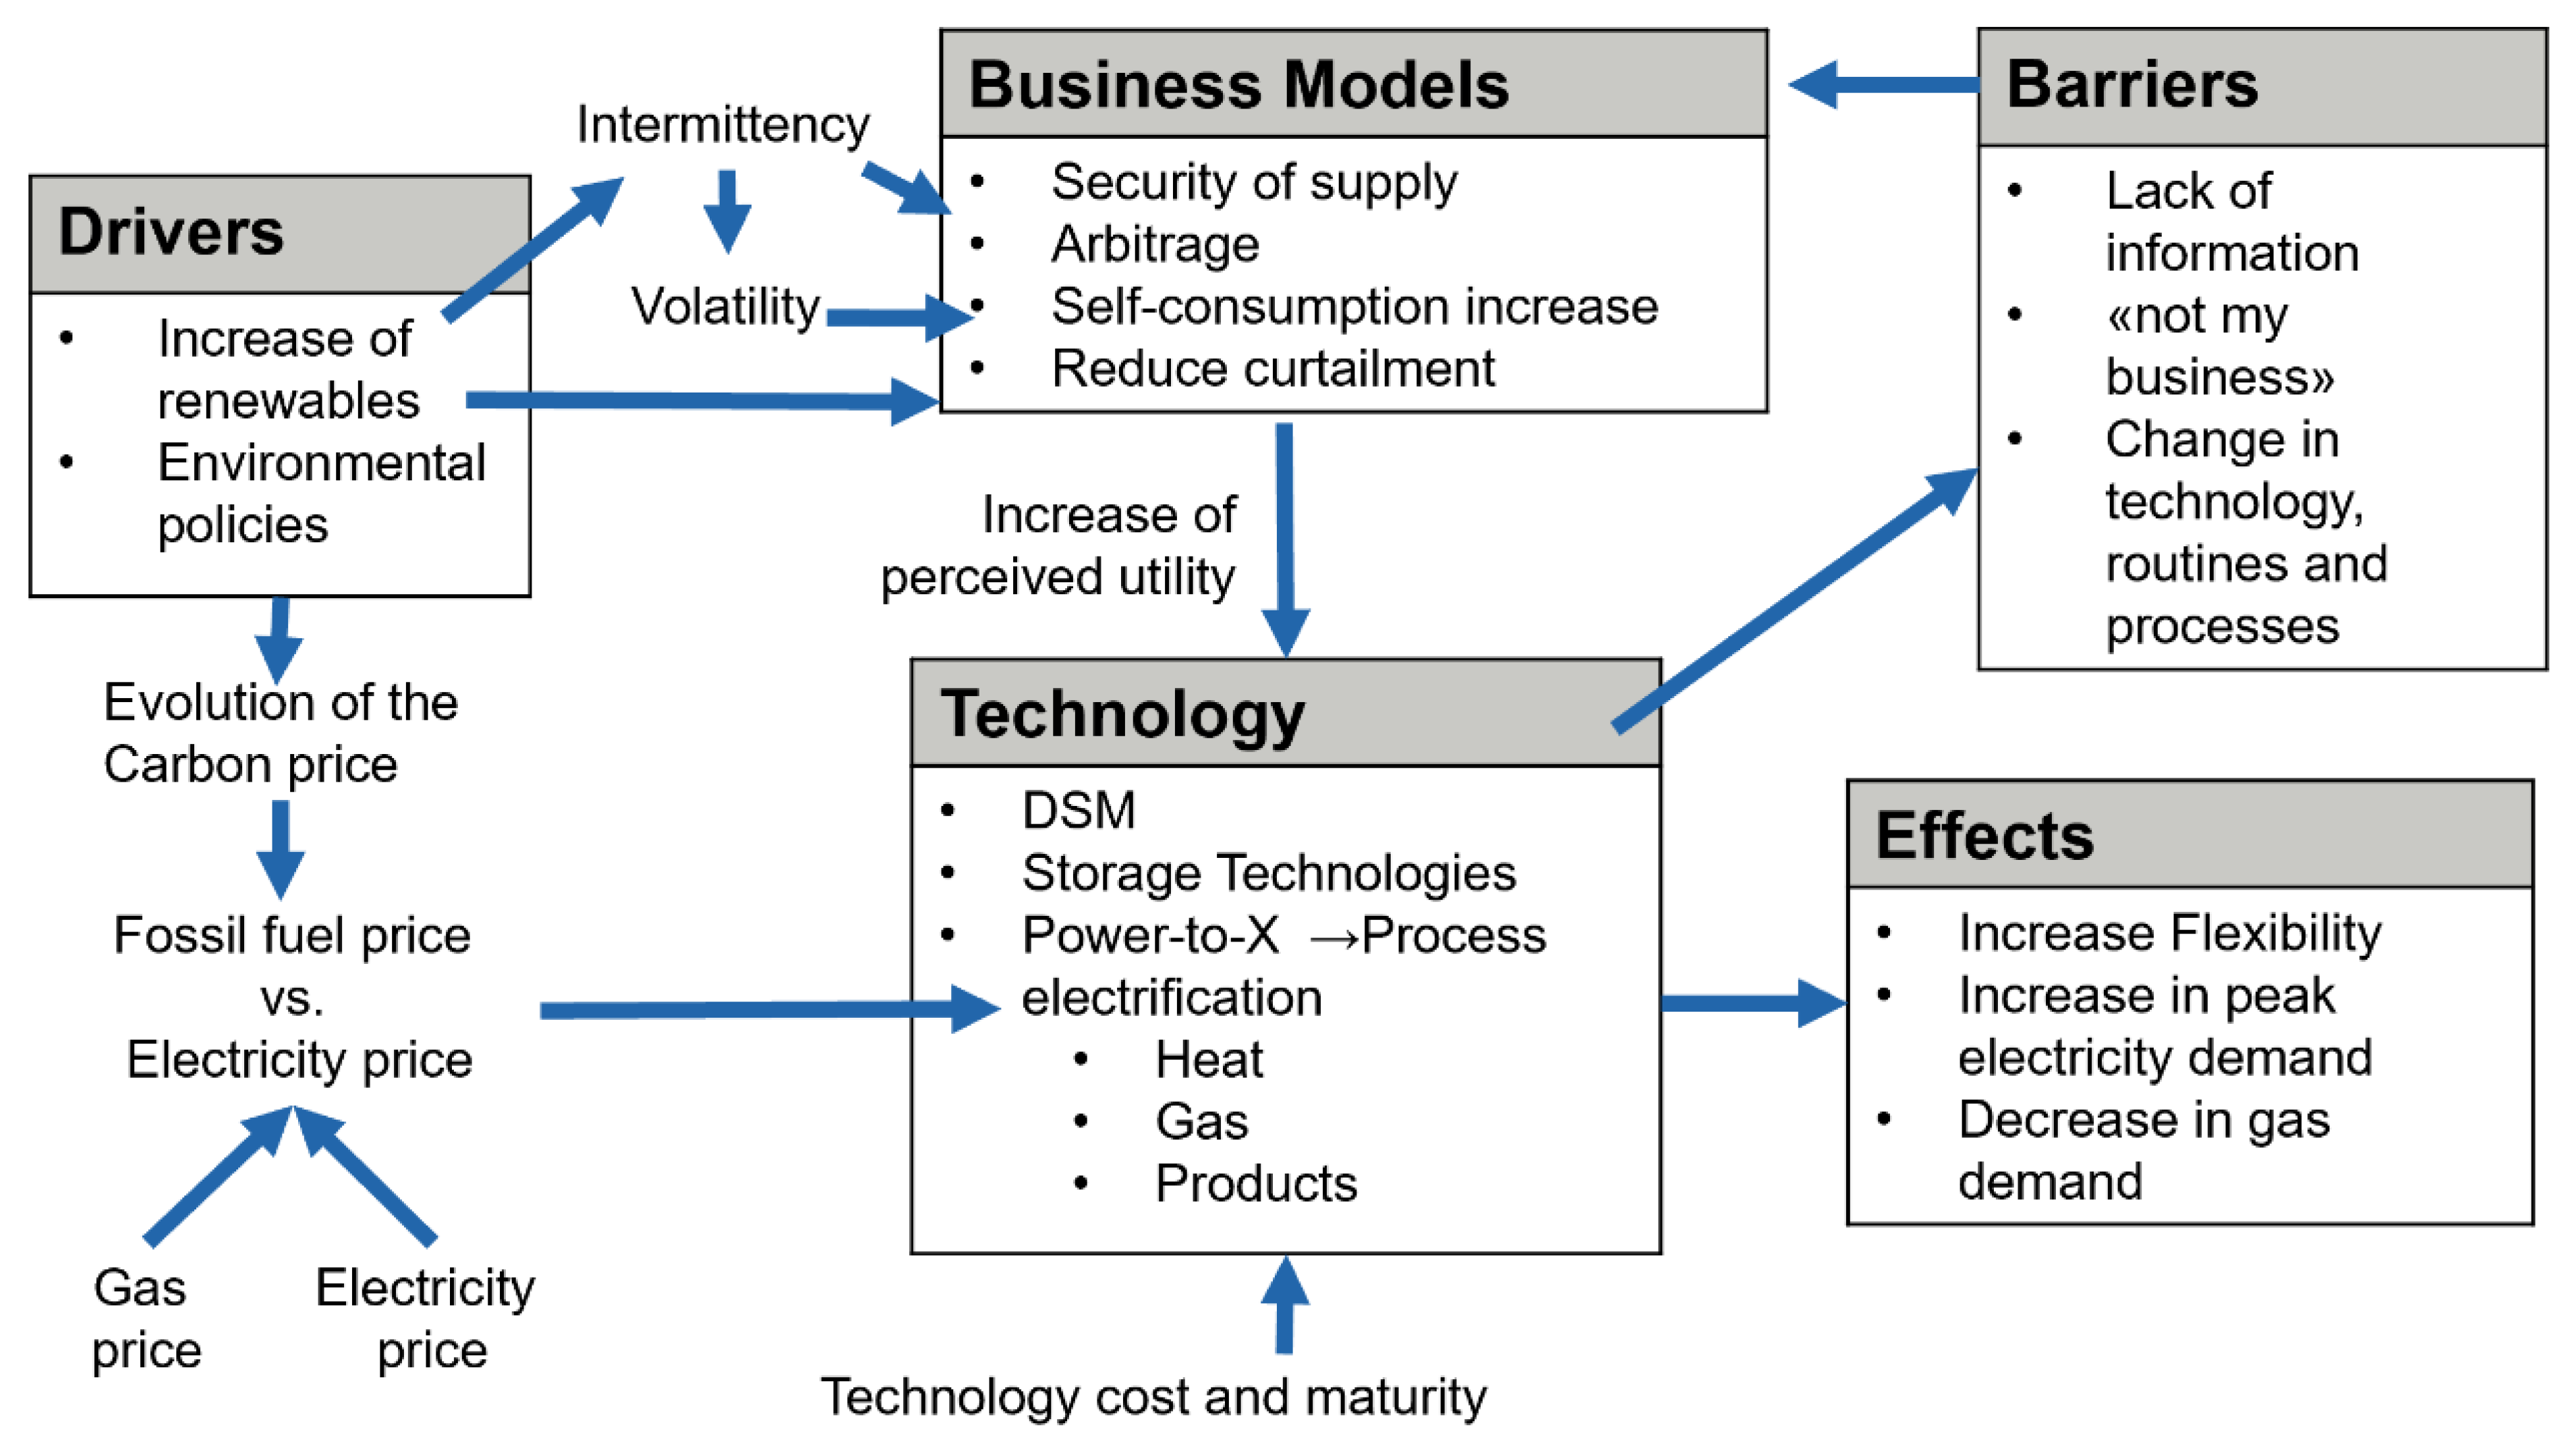
3.1.1. Socio-Technical Drivers and Barriers

The first step in specifying the business model was to characterize the drivers and barriers for the electrification of the industrial sector and the role that business models can play in assisting this process. The results of this assessment are summarized in Figure 2. A key driver of electrification in all sectors has been the increased power generation from renewable energy sources and the fast decrease of their cost [46]. The development of energy storage technologies has also greatly contributed to increased electrification, as they permit a better utilization of intermittent renewable energy sources. For some storage technologies, such as batteries or power-to-hydrogen, investment costs are projected to substantially decrease as the technology further matures [47,48]. Sector coupling, i.e., the interconnection of electricity, heat, industry, and mobility, offers various opportunities for decarbonization in the industry sector, e.g., by using hydrogen from renewable electricity to produce various chemicals [46] or by using battery capacity to provide grid frequency control and reserve capacity [49].
However, the use of electricity for industrial processes is today limited for economic reasons [50]. Electricity is comparatively more expensive than natural gas, oil, or coal. The reason for this is twofold: first, the wholesale electricity price includes not only the energy use but also the grid cost, taxes, and levies. Second, fossil fuel costs do not reflect their environmental impact, due to rather low CO2 prices and the lack of an international agreement on a carbon tax [51]. As a result, the operational cost of electric technologies is not competitive with their equivalent fossil technologies, unless a tax reform is implemented [52]. Further barriers are related to the perceived utility of electrification, load management, and flexibility technologies by industrial actors, e.g., concerns about financial and regulatory risk [53], lack of information, and lack of interest in participating in energy markets (“not-my-business” problem) [54].
Even if the potential of electrification in the industry is realized, new challenges might appear. Since massive electrification of industrial processes could increase peak electricity demand, this development, together with the large penetration of intermittent renewables, may compromise the stability of the grid and aggravate the grid congestion problems [6]. As a result, there will be a need to reinforce grid capacity, unless alternative measures are developed. An alternative is the use of digital technologies that enable smart solutions to deploy novel flexibility technologies.
To unlock this specific flexibility potential on the level of the distribution grid, new business models are required. The literature mentions several time-based flexibility business models that can be applied with the use of flexible technologies and smart grids. A classic example is the participation in the ancillary service market to provide frequency control and reserve capacity [49]. Batteries have been used for instance to reduce peak demand and profit from daily electricity price variations [55,56]. The integration of renewables is another promising business opportunity. In this case, the utility can, e.g., offer to the customers dynamic prices to incentivize the consumption of energy when large amounts of renewables are available, thus reducing curtailment [49,57,58].

3.1.2. Analyzing Customer’s Profile

The next step in the design of a business model was to analyze the potential customers. To this aim, semi-structured interviews were performed with potential pilot partners. The aim of these interviews was to understand the central jobs, pains, and gains of customers and to identify key conditions and motivations to participate in a time-based flexibility business model [59]. In total, six interviews in three different countries (Germany, Austria, and Switzerland) were performed with companies from very different economic sectors.
The interview results underline the importance of managers’ job to reduce costs while ensuring the reliable operation of their core activity. For this reason, most of the interviewed companies were considering installing or already had installed a load management system and/or an energy monitoring system to optimize their own demand.
Nevertheless, when talking about providing flexibility to the local network, the main pain points identified were the possible interference with their core activity and the needed organizational effort (transaction cost). The resulting gains of participating in a time-based flexibility business model were linked to the support of an innovative and green image and sustainability transition.

3.1.3. Design of the Power Alliance Business Model

The PA business model was designed in a series of workshops with the project partners based on the customer profile.
The PA approach proposes a technical and economical scheme to avoid grid congestions under increased electrification. The main idea is to apply demand-side load management only to a specific class of new flexible loads, the so-called “conditional loads”, which mainly emerge from sector coupling applications such as power-to-heat installations and electrolyzers for hydrogen production. These loads exhibit a significant price elasticity and are more flexible in terms of usage due to a certain storage functionality. Furthermore, these loads are not hampering the reliable operation of the companies’ core activity.
The PA business model presupposes that the currently redundant grid capacity used to provide today’s high level of security of supply—the “n-1 security”—can be utilized by conditional loads, thereby attaining additional capacity in the existing grid infrastructure. Conditional loads are subject to a simple security of supply for a certain time span, while keeping the n-1 security for all other loads [60].
The PA business model requires coordination between different actors: DSOs, utilities, technology providers, policymakers, and industrial customers. From the perspective of DSOs, the main aspects of the business model are summarized in Figure 3 using the canvas approach of Osterwalder and Pigneur (2010) [61].
The main value proposition of the PA business model is a holistic flexibility management solution wherein the service provider and DSO will carry out most of the relevant activities. This includes the installation and maintenance, as well as daily load forecast and rescheduling. The main job—reducing energy cost—is addressed by lowering the capacity-dependent part of the network tariff for their flexible loads and optimizing load management. This tariff component is an annual fee of 100 EUR/kW and is reduced to 10% of its value under the PA offer. For the case of six industrial companies, calculations have shown that this offer would greatly impact the financial attractivity, or even feasibility, of investments in flexible electrification technologies [62]. The DSO should ensure that the PA business model has minimal interference with the core activities of the company.
The target customers are those on the electricity grid level 5 (medium voltage level, typically industrial customers) who installed or are thinking about installing a flexible electrification technology. The customers are directly addressed and informed about the PA offer. This direct customer support is also the main contact channel with the customers.
The key activities of the DSO are to provide consulting services to help customers understand the offer and to perform the forecast and reschedule of the local load profiles via intelligent algorithms; therefore, software and hardware providers are the key partners.
The key resources are the physical infrastructure, such as the energy management equipment, and the human capacity to advise customers, install and maintain the equipment, and find an optimal flexibility solution for their individual needs.
The main costs are the infrastructure cost and the additional personnel cost for consulting services. Conversely, the grid expansion cost should be reduced due to the optimal use of the existing grid through regionally aggregated smart flexibility management. The main revenue streams are the connection charges and the network cost and grid use charges.
The actors involved have different incentives to participate in the PA scheme. For DSOs, the main incentives are a better plannability and control over their grid, as well as more detailed insights into grid flows, which allow them to offer attractive products. For grid customers, incentives to declare suitable loads as conditional loads comprise a significant reduction of grid fees for conditional loads (the “Power Alliance Tariff”) and an automated dynamic load management solution (the “Regional Load Shaping” solution; see Christen et al., 2019) [63], which minimizes the customers’ energy costs for conditional loads according to stock prices whenever regional grid capacity constraints allow it. Policymakers and regulatory authorities are interested in testing and supporting technical solutions that promote flexibility and help to reach environmental and GHG reduction goals. Technology providers are interested in promoting the adoption of the flexible electrification technologies, whereas electric utilities are interested in offering innovative products to their customers, such as more exact energy consumption schedules to optimize the loads and energy costs.

3.1.4. Exploration Phase

The acceptability of the PA Business model was tested by performing an online survey to potential customers (i.e., companies from the manufacturing sector). The survey was based on the Choice-Based Conjoint method. In total, 500 customers from Germany, Austria, and Switzerland were contacted; nevertheless, the response rate was very low (62 customers completed the survey). Therefore, though the results of the survey give some insights into the customers’ wishes, they are not representative enough to support solid conclusions [62].
For this reason, a system dynamic model was developed to test and explore the diffusion of the electrification technologies and the adoption of the PA business model.

3.1.5. Use Cases for Flexible Electrification Technologies

The PA business model is highly dependent on the diffusion of flexibility technologies such as batteries, power-to-heat, and power-to-hydrogen. For this reason, the necessary conditions to adopt these technologies are studied in detail using a system dynamic model (described in Section 3.2.1). For this analysis, three common use cases were selected to detail the financial advantages of the studied technologies as well as potential GHG emission reduction. These use cases were selected in workshops with members of an electric utility, a DSO, and industrial customers. In all use cases, it is assumed that the self-consumed electricity has no cost. The most important assumptions of the three use cases are presented in Table 1 and described below. The market context of the use cases refers to Germany. A more detailed breakdown of the costs and revenues for each use case is given in Section S1 of the Supplementary Materials.
The first use case, power-to-heat (PtH), considers the use of an electric boiler to generate heat in the paper industry (at a temperature requirement of about 120 °C). Electric boilers are a mature technology, with estimated investment costs between EUR 100–400 and an efficiency η P 2 H e a t between 97% and 99% [47]. The electricity can be obtained either from the electricity grid or from an installed photovoltaic system. The electric boiler can work together with an existing gas boiler (parallel operation) or independently. In parallel operation, the system can make use of the price difference between gas and electricity. A form of heat storage (such as a water boiler) is also considered to increase the flexibility of the system.
The second use case, power-to-hydrogen (PtH2), assesses the usage of an electrolyzer to generate hydrogen as a raw material for the chemical industry. It is assumed that the electrolyzer replaces a steam-methane reforming system that uses natural gas to produce hydrogen, releasing carbon monoxide and a relatively small amount of carbon dioxide. Due to economies of scale, it is expected that the cost of the electrolyzer decreases within the next years from almost 1500 EUR/kW in 2016 to 480 EUR/kW in 2050 [47]. The electrolyzer takes the electricity from the grid or from an internal source such as a photovoltaic system.
The last use case concerns the use of battery storage to increase the self-consumption share of a photovoltaic system. The battery can also be used to provide services to the grid as part of the PA business model. Furthermore, the battery can take advantage of arbitrage opportunities, buying electricity from the grid at cheap prices and selling it when the prices are high again. The capital cost of the battery is assumed to be 1200 EUR/kWh in 2016 when the simulation starts and to decrease to 290 EUR/kWh in 2050 [48].

3.2. System Dynamics Simulation

3.2.1. Model Structure
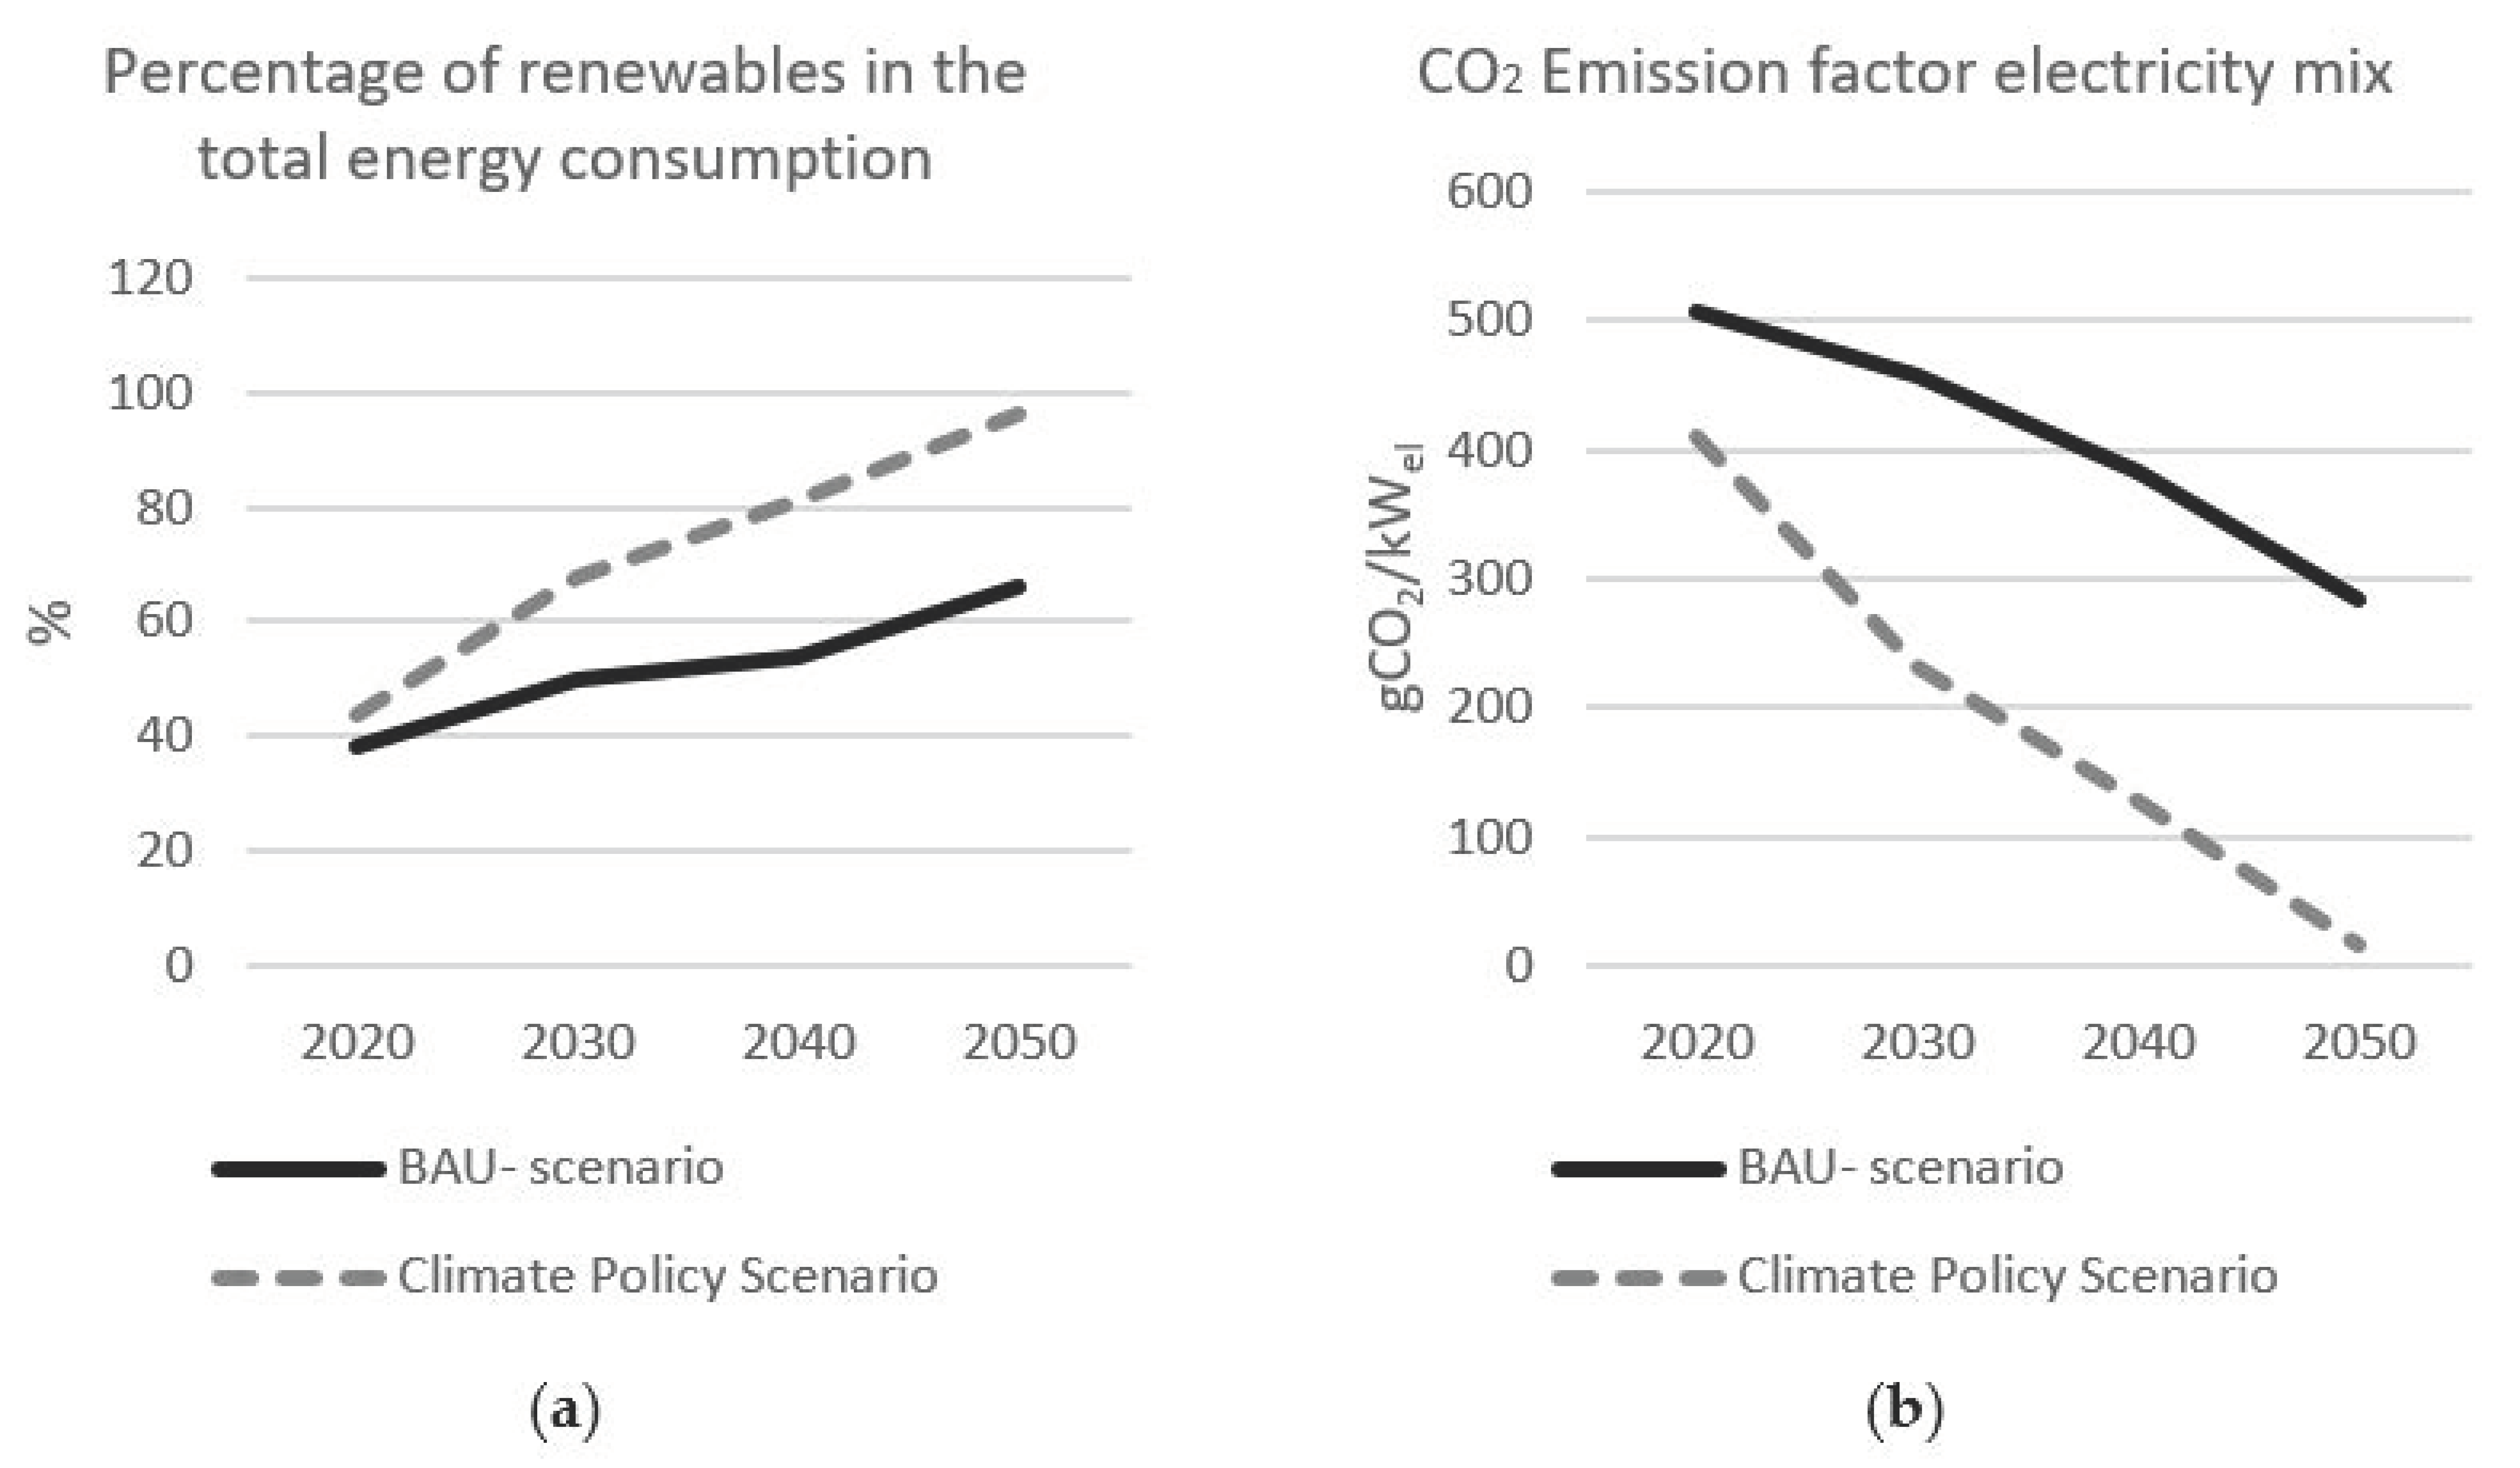
The SD model simulates the diffusion of flexible electrification technologies and the adoption of the PA offer in a local distribution grid with 45 industrial customers (Figure 4). The model simulates the diffusion of one technology at a time. The core of the model consists of three state variables, each of them representing the number of customers subscribing to a certain offer. At the beginning of the simulation, there is no flexible technology (“Flexloads”) installed; thus, all customers belong to the stock “Customers without Flexloads”. At each time step, a certain fraction of the customers may decide to switch to one of the alternative options. One possibility is to install a flexibility solution without subscribing to the load management program of the utility. Customers who choose this option are still subject to the standard grid tariff (ST). Alternatively, customers may choose to participate in the regional load shaping program and benefit from the Power Alliance Tariff (PAT). The switch to the PAT may happen either directly (customers install a flexibility solution and join the regional load management program at the same time) or indirectly by first installing a flexibility solution, and in a second step, deciding to join the load management program. In each customer stock, a fraction of the customers have their own renewable energy source (RES). For the stock “Customers without Flexloads”, the fraction of customers with RES is updated according to the chosen scenario (see Section 3.2.2), simulating the percentage of renewables in the total energy consumption as a proxy.
The model consist of two core loops a balancing loop “B” which represents the scarcity effect i.e., the maximum technical potential of the grid and the reinforcing loop “R” which is a positive feedback loop that considers network externalities, such as the familiarity effect. This network externalities correspond to the “Increasing Returns” in the sociotechnical framework from van Waes et al. (2018). The simulation model, shown in Figure 4, share a similar structure with the model developed by Kubli (2018) [67] to study the diffusion of decentralized photovoltaics. The number of customers moving from one option to another at each time step, following the flows in Figure 4, depends on the perceived utility of each decision option, as well as on the specified adjustment times (AT) for each possible switch. The factors influencing perceived utility are described below. ATs are time constants accounting for delays in the system. Indeed, it is unrealistic to assume that all customers willing to install a flexibility solution will do so immediately. Many factors may delay this decision for an individual customer, such as financial, time, and know-how constraints or organizational structures and processes. The ATs control the rate of change as follows:
r i , s , t = r p o t , i , s , t / A T i
where i represents the different type of customers ( i   ϵ {customers without flexloads, customers with flexloads and ST, customers with flexloads and ST}), and s distinguishes the customers with and without renewables installed ( s   ϵ {customers without renewables, customers with renewables}); consequently, r i , s , t is the rate of customers changing from option i 0 to option i at time step t (customers/year), r p o t , i , s , t is the number of customers planning to change from option i 0 to option i , and A T i is the adjustment time (years) corresponding to this transition.
The model considers six decision options, each corresponding to one of the flows in Figure 4 (each flow symbolizes two distinct decision options, for customers with and without RES). At each simulation time step, the model calculates the attractivity of each decision option, expressed as the share of potential customers willing to change. This attractivity depends on the perceived utility of each decision option, which in this model depends on financial aspects (payback time), social aspects (familiarity of flexible technologies and customers’ willingness to invest), and a scarcity effect. The share of customers that choose each option f i is determined using a logistic function:
f i = 1 1 + e x p [ β ( u i , 0 u i ) ]
where u x is the dimensionless utility function corresponding to each decision option x , u i , 0 is the perceived utility of the current concept, and u i is the perceived utility of the competing consumption concept. β is an empirical shape parameter. The perceived utility u x of a decision option is calculated as follows:
u x = f p a y b a c k t i m e × f c a p i t a l × f f a m i l i a r i t y × f s c a r c i t y
where all variables are dimensionless. The empirical functions used to estimate f p a y b a c k _ t i m e , f c a p i t a l , and f s c a r c i t y are described in Section S2 of the Supplementary Materials.
Familiarity S f a m is a state variable of the model and consists of two processes: the effect of word-of-mouth as a technology becoming more common, and the effect of customer relationship management by the utility. Familiarity may take values between zero and one and is initially set to 0.25 here. At each time step, S f a m is updated as follows:
d S f a m d t = ( f W O M + f C R M ) × ( 1 S f a m )
where f W O M is the effect of word-of-mouth in the current time step and f C R M the effect of customer relationship management. The latter is assumed to be constant, whereas the effect of word-of-mouth increases as the number of customers with installed flexibility technologies increases:
f W O M = C f l e x C t o t a l × r c o n t a c t
where C f l e x is the number of customers with a flexibility solution installed, C t o t a l the total number of customers, and r c o n t a c t the effective contact rate [-]. This formulation for technology diffusion was introduced by Struben and Sterman (2008) [68].
The annual cash flows in the model are the sums of costs and revenues (from the perspective of the customer) related to the installed flexibility technologies. For each use case, the breakdown of costs and revenues is given in Section 3.1.3 and Section S1 of the Supplementary Materials. An important factor for the economic viability of flexible technologies is future prices of electricity and natural gas (the latter only for the PtH and PtH2 cases). These are outside the system boundaries and assumed to increase as a function of time:
P y , x = P p r e s e n t ,   x × ( 1 + b x ) ( y 2015 )
where P y , x is the price of either gas or electricity (represented here by x ) in the year y , P p r e s e n t ,   x is the current price of x , and b x is an x -specific parameter. The current (2016) prices for electricity (energy price only) and gas (excluding the carbon tax; see next section) were set to 0.04 and 0.03 EUR/kWh, respectively. The annual price increase for electricity, b e l , is set to a default value of 3%, and the annual price increase for natural gas, b g a s , is set to 2%. The breakdown of the wholesale prices for electricity and natural gas is given in Section S3 of the Supplementary Materials.
The model was built and executed using the software Vensim DSS, version 7.3.5. The simulation period goes from 2015 to 2050, with a simulation time step of 0.0625 years. Numerical integration uses the explicit Euler method.

3.2.2. Scenarios

As the diffusion of the studied flexible technologies largely depends on uncertain climate policies, this work considers the application of two different climate scenarios. These scenarios are based on forecasts for the German energy market [51,69]. This section gives an overview of the scenarios, and the reasoning behind them is further detailed in Section S3 of the Supplementary Materials. The first scenario, the business as usual (BAU) case, assumes that no tax reform or any other additional measure is adopted to promote decarbonization. Thus, the percentage of renewables in the total energy consumption reaches only 60% by 2050 and the CO2 emission factor of the German electricity grid is approximately 300 gCO2/kWel. Furthermore, as of today in Germany, no CO2 price is charged for the use of gas as heating fuel. The Renewable Energies Act (EEG) surcharge, levied on electricity consumption to finance the development of renewable energy, starts at 6 euro cents/kWh and is phased out gradually to reach 0.8 euro cents/kWh by 2050, following the forecast of [70].
The second scenario assumes that strong policy measures are taken to support decarbonization and sector coupling. As a result, the Paris climate goals will be reached by 2050 in Germany, i.e., almost 100% of the total energy consumption can be met by using renewable energies. The CO2 emission factor of the electricity mix is 17 gCO2/kWel. To reach these goals, it is assumed that a tax reform is applied; in this case, a CO2 tax ( P C O 2 (EUR/kW)) is charged to the natural gas and a tax reduction for electricity is implemented. Concretely, the EEG surcharge is reduced to 0.05 euro cents/kWh. The aim of this policy is to promote the use of green electricity and charge fossil fuels for their CO2 emissions. Figure 5 illustrates the evolution of the scenarios over time, whereas Table 2 summarizes the most important assumptions.

3.2.3. Sensitivity Analysis

Many of the parameters used in the simulation models are subject to high uncertainty. This uncertainty arises for various reasons: first, the simulation period lies mostly in the future, so it is necessary to make assumptions regarding the future evolution of energy prices, technology costs, and taxes. Second, some parameters act as proxies for processes not explicitly represented in the model, such as the adjustment times (Equation (1)). This makes it difficult to constrain these parameters, especially in the absence of historical data that enable the calibration of the parameters. As some of the process formulations used here are widely used in SD, earlier studies give an estimation for the values of the corresponding parameters. However, these studies may apply to an entirely different context, so that transferring parameter values to a new study may be challenging. For example, most of the empirical values for the familiarity parameters come from studies on vehicles or consumer goods [68]. While these values give a rough indication of the possible parameter range, it is unclear how well they describe the attitude of industrial customers regarding their electricity consumption.
To assess the uncertainty in model outcomes and to identify the most sensitive parameters, a global parametric sensitivity analysis was conducted. The aim was to characterize the spread in model results under varying parameter values, as well as a measure of importance for each parameter. The target output variable is the number of customers that have installed a flexibility technology and a PV module and subscribe to the PA tariff at the end of the simulation ( C f u l l , 2050 ). In a first step, 2000 combinations of parameter values were generated, where the value of each parameter was varied within its plausible range. The parameters and their range are listed in Table 3. These sets were generated with the Latin Hypercube Sampling method, a stratified Monte Carlo scheme.
In a second step, parameter importance was assessed by fitting a random forest model [71] with the parameter values as predictors and C f u l l , 2030 as the dependent variable. Such a meta-modeling approach to parametric sensitivity analysis provides a ranking of parameter importance, and the possibility to evaluate the effect of different parameters graphically [72,73,74]. Among the different measures of parameter importance provided by the random forest algorithm [71], the mean decrease of accuracy was used. This measure describes the loss of model performance when the values of one parameter are randomly shuffled, i.e., converted to noise.
A crucial step of a parametric sensitivity analysis is the choice of a distribution for each parameter [75]. Here, a uniform distribution was chosen for all parameters, with the range set as reported in Table 3. Two parameters describe the PA business model: the standard network tariff (ST) and the fraction f P A T , which defines the ratio of PAT and ST. The ranges for the standard grid tariff P g r i d , S T and the investment costs for smart control P i n v , s m a r t were chosen based on scenarios provided by the project partners. The bounds for f P A T were kept wide, ranging from no discount at all ( f P A T = 1 and PAT = ST) to an aggressive strategy where PAT is only 10% of ST. The parameter b e l , representing the annual percentual change of energy price, was varied so that the resulting prices stayed within the bounds of existing forecasts [70,76], as shown in Figure 6. The parameters d P e l , m i n and d P e l , m a x reflect the volatility of electricity prices. The minimum and maximum values were selected based on scenarios provided by the project partners.
Values for parameters such as the adjustment times are typically obtained through calibration. As this study is concerned with business models that have not yet been implemented, there is no historical data available for calibration. Therefore, to define the range for these parameters, it is necessary to consider previous studies. For example, Kubli (2018) [67] obtained adjustment times between 1 and 4 years for the installation of photovoltaic panels by industrial customers. Here, the AT for the installation of smart control (ATPAT) was varied between 1 and 4 years. It was assumed that, as the installation of flexible loads represents a much greater investment, the corresponding adjustment time (ATload) is much longer (5 to 20 years). Values for the parameter β were also obtained through calibration by Kubli (2018) and ranged between 4.7 and 13 for industrial customers. For the two familiarity parameters l W O M and l C R M , Struben and Sterman (2008) suggest ranges of 0–0.3 and 0–0.02, respectively. These values are based on previous studies on consumer goods and do not necessarily describe the situation examined in this study. First, industrial customers probably behave differently from private customers and are likely more receptive to marketing efforts if the product can help their business. Second, due to the small market size, the utility can easily reach all its customers. For these reasons, the range for l C R M was set substantially higher.

3.2.4. Model Validation

To acquire confidence in the model, several workshops with practitioners were performed. In these workshops, our industrial partners, as well as members from federal authorities, verified the structure and the most important parameters of the model. We had the opportunity to corroborate the existence and importance of the different feedback loops for the real-life situation of our case study. However, due to the lack of historical data, a detailed validation of the model was not possible. Nevertheless, we verify the response of the system to extreme conditions and performed sensitivity tests as reported in Section 3.2.3. Finally, we also validated the results with practitioners and ensured that the behavior projected by the model is likely and could be explained.

4. Results

4.1. Simulation Results

For the PtH case, Figure 7a,b show the development of installed flexibility capacity in the grid for the two scenarios (BAU and climate policy (CP)) and two different assumptions on the percentage of electricity consumption stemming from the customers’ own renewable generation ( f r e n e w , 60%, and 80%). To give a sense of the importance of these new technologies, installed flexibility capacity is expressed here as a percentage of peak demand. The fraction f r e n e w has a greater influence on the diffusion of PtH in the BAU scenario than in the CP scenario, since, as mentioned before, the model assumes that the energy coming from own renewables has no cost. Consequently, the profitability of PtH increases with the percentage of own RES. Under the CP scenario, as the wholesale price is decreased for electricity and increased for natural gas, PtH is more competitive. Therefore, the percentage of renewables only has a marginal impact. The GHG emissions savings (Figure 7 c, d) are expressed as a percentage of the total emissions from process heating if all customers in the grid used a gas boiler. Clearly, the savings are larger in the CP scenario, where the electricity mix has a very low emission factor at the end of the simulation period. By contrast, PtH2 (Figure 8) shows no or very slow diffusion in all cases, and consequently a limited GHG emissions abatement potential.
For batteries (Figure 9), the diffusion takes place slightly faster under the BAU scenario at the beginning of the simulation. This is because in this scenario, the price of the electricity coming from the grid is higher, and thus the self-consumption business model is more profitable. With time, the penetration of renewables in the CP scenario is very strong and thus the associated installed battery capacity is larger than the BAU scenario. As the use case for batteries does not entail the substitution of another technology and is therefore not based on a comparison with a reference case, GHG emission savings could not be calculated.

4.2. Sensitivity Analysis

As shown in Figure 10, the speed and extent of the diffusion of flexibility technologies and the PAT offer differ greatly depending on technology, scenario, and parameter values. For PtH, under the BAU scenario, many simulations lead to zero customers until the end of the simulation, while some simulations reach a number of 19 customers (out of 45 potential customers in the simulated market). Under the CP scenario, there are fewer simulations with zero customers, and the simulations with the greatest number of customers reach a number of 28. In some simulations, the onset of customer growth occurs quite late. For PtH2, there is barely any customer growth in the BAU case, and only in a few simulations in the CP case. But even under this scenario, there is hardly any growth in the first 10 simulation years. For batteries, the spread between simulations is again rather large, with a substantial number of simulations with zero customers under both scenarios and final numbers of up to 19 and 22 customers under the BAU and CP scenarios, respectively.
The random forest algorithm calculates an estimation of the percentage of variance of the dependent variable explained by the model (see Liaw and Wiener, 2002). For the meta-models used in the sensitivity analysis, these scores are reported in Table 4. In most cases, the meta-models explain a large percentage of the variance of the dynamic model outputs, meaning that they appropriately capture the influence of parameter values on the output. However, in the case of PtH2 under the BAU scenario, this score is very low, since the number of customers at the end of the simulations is zero in nearly all simulations. For this reason, the sensitivity analysis was not carried out for this case.
For the presentation of parameter sensitivity scores in Figure 11, parameters were divided into two categories: “hard” parameters, representing technological and economic factors, and “soft” parameters, related to decision-making. This distinction is only represented graphically and had no influence on the meta-modeling process.
For PtH under the BAU scenario, the most important parameter is f r e n e w , the percentage of electricity consumption that can be covered by self-consumption of electricity produced on site from renewable sources. The next two parameters belong to the “soft” category and describe the delay in adoption of flexible technologies ( A T l o a d , r e s ) and the influence of direct marketing by the utility ( l C R M ). The grid tariff reduction factor under the PA offer ( f P A T ) and the annual energy price increase ( b e l ) are also somewhat important, while the other parameters have little to no influence on model results. Under the CP scenario, while f r e n e w is still important, A T l o a d , r e s becomes the most influential parameter. The CO2 tax P C O 2 , which is set to zero in the BAU scenario, is also quite influential in the CP scenario. For PtH2, the three most influential parameters belong to the “hard” category, i.e., f r e n e w , P C O 2 , and the number of running hours H r u n n i n g . For the “soft” parameters, A T l o a d , r e s is of intermediate importance and l C R M has little influence. In the case of batteries, there is little difference in parameter importance ranking between the two scenarios. Under both scenarios, the most influential parameter is f P A T , followed by the maximum energy price difference d P e l , m a x . Next are the two “soft” parameters A T l o a d , r e s and l C R M . Lastly, the feed-in tariff P F I T and standard grid tariff P g r i d , S T are of intermediate importance, while the remaining parameters have little influence.

5. Discussion

5.1. Prospective Transition Analysis

In this section, a transition analysis is presented, based on outcomes of the whole project (i.e., literature review, expert interviews, and simulation results). The analysis focuses on the three areas identified by van Waes et al. [28] as particularly important for the upscaling of business model innovations under transitions: institutions, industry structure, and the dynamics of increasing returns.

5.1.1. Institutions

The simulations highlighted the decisive role of institutional aspects: under current regulatory conditions where electricity is strongly charged with taxes and levies, the diffusion of power-to-heat and power-to-hydrogen is very slow. This is consistent with previous findings [50,65,77]. Here, authorities have a high leverage point to influence the adoption of flexible electrification technologies through a CO2-oriented tax reform. Furthermore, the sensitivity analysis showed that one of the most influential parameters for the adoption of these technologies is the percentage of electricity consumption that can be covered by own RES. This suggests that the promotion of electrification technologies should go hand in hand with the support of local renewables. An additional measure would be to facilitate the use of local surplus renewables by reducing their cost and thus avoiding curtailment [78]. The relatively low sensitivity of model results to the annual energy price increase suggests that these measures would be effective regardless of future energy price evolution.
There are important differences between technologies regarding the influence of environmental factors. For batteries, the simulated diffusion is almost independent of climate policy. Indeed, the use case selected here—increase of self-consumption combined with arbitrage—is already profitable under the current regulatory framework. Additionally, the diffusion of batteries is less sensitive to the fraction of own RES. On the other hand, energy price volatility and the level of a feed-in tariff are rather important determinants for the self-consumption savings and thus for the profitability of the studied use case. The battery case also differs from the two other technologies through the importance of the per-capacity grid tariff and the reduction associated with the PA offer. These differences show that if a customer can choose between different flexibility technologies, their choice may depend on the specific energy technology for their plant (e.g., the capacity to generate electricity from own sources) and their assumption regarding the future economic and regulatory environment.

5.1.2. Industry Structure

Industry structure refers to the characteristics of the firms offering the business model, which in this case is the DSO. Due to the monopolistic nature of the DSOs, these entities are subjected to strict regulations to ensure non-discriminatory access to the grid for customers and producers [79]. Nevertheless, with the large penetration of renewables and flexibilities at the distribution level, DSOs are called to redefine their role by facilitating the integration of decentralized renewables using flexibility resources to avoid the increase of grid cost [80]. These new tasks will require major changes in the regulation to incentivize DSOs to actively facilitate the energy transition while maintaining their neutrality and transparency [80,81]. Concretely, applying the PA model as an alternative to physical grid expansion entails a shift from investments to operational costs, which bears financial disadvantages for DSOs under current regulatory conditions, due to the mechanisms of grid financing [62,81]. The current regulatory framework reflects the role of DSOs in a centralized energy system and does not account for their new role, giving them little latitude to offer sustainable solutions [81]. The scalability of time-based business models such as the one proposed here will largely depend on the evolution of the legal and regulatory framework applied to DSOs.

5.1.3. Increasing Returns

With respect to increasing returns to adoption, there are two aspects worth mentioning. The first point refers to the increasing returns to adoption of the electrification technology, which are simulated in the model using the familiarity effect, a network externality by which the adoption of a technology increases when the customer gets more exposed to it. As explained in Section 3.2.1 in the simulation, the familiarity effect is determined by word-of-mouth and the customer relationships. The simulations showed that the customer relationship is a very important parameter for the adoption of power-to-heat and batteries.
The second aspect refers to the adoption of the PA business model: both customers and DSO may possibly benefit from the increasing returns to adoption of the PA offer. The more customers adopting, the better the forecasts and controllability of the local loads, which in turn may reduce the need for grid reinforcement. This could translate in the long term to a lower grid cost to the customers. However, due to the novelty of the system studied and the complexity of implementation, this effect cannot be quantified at present. Although these benefits are important for society, they might not be tangible for both actors, hampering the scalability of this business model. This is mainly due to the already mentioned strict regulations for the DSO, which at the moment do not incentivize the use of flexibility to improve the efficiency of the grid [81,82].

5.2. Methodical Approach

This paper developed a methodical framework consisting of the tailored integration of forecasting methods for business model innovation as a cost-efficient approach for experimentation under high uncertainty. Uncertainty in this case stems from two main sources: the potential for vastly different but equally plausible future economic and regulatory conditions and a lack of empirical data for model building and parameterization. In this study, system dynamics, exploratory modeling, and a sociotechnical transition framework were used for the design and analysis of a novel business model in the uncertain environment of the energy transition. First, we used the principles of BMI to identify and define new business opportunities for a DSO in the changing energy environment. After performing several customer interviews and workshops with project partners, the characteristics of the new business model were defined. The business model canvas (Figure 3) proved to be a useful tool to facilitate the discussion among the participants. For the experimentation phase, an SD model was set up to evaluate future market development and the prospects of the proposed business model under various future economic and regulatory settings. The model building process consists of mapping and operationalizing causal relationships between environmental factors, economic viability of flexibility technologies, and customers’ willingness to invest in them. This process yielded insight into market dynamics, as information was elicited from different actor groups. As the proposed business model was based on technologies that are currently rarely implemented and not well known by the target customers, there was only a limited empirical basis to build a model of the system and select values for parameters. Instead, the simulation model was constructed using well-known concepts from the literature on technological change, such as familiarity and scarcity effects. Under these conditions, a careful assessment of the uncertainties (see below) and limitations (see Section 5.3) of the model was necessary.
Making the various sources of uncertainty explicit and quantifying their effect through computational experiments is a way to gain insight from a simulation model under high uncertainty [26]. In this study, sensitivity analysis had two functions: estimating the uncertainty of model outputs arising from uncertain parameter values and identifying potential levers of action and sources of uncertainty for the implementation of the business model considered. Both types of uncertainty contributed to the large spread of model results shown in Figure 10. The former function is especially important when no historical data are available for model calibration, as in this case. The parameters categorized as “soft” in Figure 11 refer to factors that are difficult to quantify in reality. They serve as a proxy to integrate various economic, societal, and human factors in the model structure. Two “soft” parameters were highly influential: the adjustment time strongly influences the adoption of flexible technologies, and customer relationship management has a great effect on familiarity. As discussed in Section 3.2.3, a range of values was obtained from previous studies, where similar process formulations were used, but as these studies were carried out in different contexts, their values could not be directly transferred. Hence, the range for these parameters had to be kept broad, contributing to the spread of model results. Two other intrinsically uncertain parameters are the annual increase of energy price and maximum energy price difference, which is a measure of energy price volatility. The choice of a value for these parameters reflects an assumption on the future development of the power market.
While the sensitivity analysis assesses the uncertainty of model outputs due to parametric uncertainty, it does not account for other sources of uncertainty, due, e.g., to uncertainty in time-varying inputs (e.g., technology prices) and in the model formulation itself [83,84]. For a simulation study to be useful, it is crucial to address these sources of uncertainty [85]. In this study, this was done by involving actors in the model development process and eliciting parameter ranges and input values as well as causalities from experts. Additionally, the selected method allows the estimation of parameter importance at one point in time only (in this case, at the end of the simulation). Other methods for parameter importance assessment, e.g., calculating the correlation coefficient between parameter values and outputs, allow an examination of how parameter importance changes throughout the simulation [86]. On the other hand, the advantage of the random forest method applied here is that non-linear relationships between parameters and outputs, as well as interactions between parameters, are usually well captured by the statistical model.
Finally, the diffusion analysis was complemented using the sociotechnical framework developed by [28], the increasing returns and industrial structure were thoughtfully described, and the simulation results gave insight into the most important institutional aspects necessary to scale up the PA business model.
While this paper focuses on a specific case in the energy sector, we expect that the method presented here can be transferred to other business contexts or sustainability transitions. Indeed, system dynamics was shown to be a valuable tool to conceptualize the process through which firms reconfigure their business models in the context of sustainability transitions [87,88]. With its focus on (deep) uncertainty, the method applied here can complement these approaches to address the research gap in implementation and challenges of new business models (see, e.g., Geissdoerfer et al., 2018) [17].

5.3. Limitations of This Study

The simulation model was developed with the aim of understanding the drivers and barriers to the success of the proposed business model and assessing the influence of uncertain parameters and future conditions. Model structure was deliberately kept simple to facilitate participatory modeling and computational experiments, following the recommendations of Bankes (1993) [38] and Ghaffarzadegan et al. (2011) [39]. Tractability and ease of handling come at the expense of completeness and precision. Therefore, the model cannot be expected to produce realistic forecasts of market dynamics under technological change, and the results from this study should not be understood as such. For example, the assumption that all customers are identical and can choose only one flexibility technology is clearly unrealistic. Rather, the simulation model forms the basis for computational experiments, where the outcome is the identification of drivers, barriers, leverage points, and main sources of uncertainty. For the same reason, the two scenarios defined in this study are not meant to be complete and fully consistent, but to provide plausible boundary conditions for the cost structure for energy use in industrial companies under two possible future regulatory environments.
The use cases studied here only represent a small subset of the possible use cases for flexibility technologies. They were selected based on the specific needs of the industrial partners who participated in the workshops. For example, flexible loads may participate in balancing energy markets to generate revenue, or the hydrogen obtained via electrolysis may be used as an energy carrier. Additionally, for each use case, the technical specifications (e.g., installed capacity) were treated as a given. With different use cases and specifications, the study might have reached different conclusions regarding the diffusion of different technologies. In addition, the proposed methodical framework needs to be tested and probably advanced in other business model innovation settings under high uncertainty in order to prove its value for practical application.

6. Conclusions

This paper presents a tailored methodical framework to assess the prospects of innovative business models under high uncertainty, applied to a case study in the energy sector. Business model innovation methods were used to identify new opportunities for a grid operator in the context of sociotechnical transition to a low-carbon system; system dynamics and exploratory modeling approaches were used to assess under which conditions the proposed business model is promising, and a sociotechnical transition framework was used to assess the scalability of the business model. The proposed business model aims at reducing the need for grid expansion as the penetration of intermittent energy sources increases by centralizing the management of some industrial appliances that have a certain degree of flexibility. In return, customers who choose to participate get a preferential grid tariff. A system dynamic model was built to simulate the diffusion of three flexible electrification technologies upon which the success of the proposed business model depends. Analyzing the model with varying parameter values and boundary conditions yielded insights into the sensitivity of modeled diffusion to various economic, regulatory, and soft factors, i.e., to the socio-technical categories of increasing returns, institutions, and industry structure. These insights were used as inputs for the sociotechnical analysis to identify the barriers and drivers for scalability.
From the institutional point of view, this study highlighted the role of energy costs as one of the main barriers for the adoption of flexible electrification technologies, as wholesale electricity prices are not cost-competitive with fossil fuels under current regulatory conditions. Policymakers have two important leverage points to overcome this barrier: implementing a tax reform on energy carriers by including an appropriate price for GHG emissions and increasing the use of renewable generation facilities at the local scale through measures to reduce curtailment. Additionally, this study highlighted the importance of customers’ perception of the benefits and risks of new technologies, as a lack of information or a negative perception can greatly slow down the diffusion of these technologies even if they are profitable. Therefore, it is crucial for DSOs to know customers’ concerns regarding electrification technologies and load management and ensure that they are addressed by the offered products: for distribution system operators, an important insight is that under a more stringent climate policy, the diffusion of electrification technologies will likely be faster. This means that new electric loads will be attached to the grid. To reduce grid expansion costs, DSOs should be prepared to offer new incentives to promote flexibility services, such as the grid cost reduction in the proposed business model. Finally, utility companies and technology developers should start offering new complementary business models to ensure the profitability of flexible electrification technologies and to reduce their dependency on external factors. Nevertheless, it is also important to recognize that the ability of DSOs to offer innovative business models largely depends on the definition of their new role and thus the change in their regulatory framework (see below).
The purpose of combining business model innovation, system dynamics, and exploratory modeling is to understand under which circumstances a proposed business model is promising, to identify what coordinated action should be taken to create favorable conditions for a business model, and to find out where more information and knowledge are most urgently needed. A strength of this method is that it enables business model experimentation at low cost, explicitly accounting for uncertainty regarding market dynamics and future economic and regulatory conditions. Additionally, complementing this approach with a sociotechnical perspective enables the identification of the necessary contextual changes that enable innovative business models to make large changes in the system and thus trigger the transition. To ensure the diffusion of flexible electrification technologies, such changes are a carbon-oriented tax reform, increased support of decentral renewable power generation, and optimization of local renewable power use. Furthermore, the specific solution studied here is dependent on regulatory changes allowing the use of currently reserved redundant grid capacity for flexible loads and incentivizing DSOs to offer flexibility solutions.
Where there is little empirical basis for model building, insights from previous studies and theory on technological change can be leveraged to represent processes in a plausible way. We suggest applying this approach in further business model innovation contexts to improve the interplay between business model innovation, system dynamics, and sociotechnical research.

Supplementary Materials

The following are available online at https://www.mdpi.com/article/10.3390/su13137264/s1: Sections S1: Definition of use cases for flexible electrification technologies; S2: Utility functions in the system dynamic model; S3: Scenario definition.

Author Contributions

Conceptualization, J.Z.R. and S.U.-B.; methodology, J.Z.R., M.S., and S.U.-B.; software, J.Z.R., M.S., and M.W.; validation, J.Z.R. and M.W.; writing—original draft preparation, M.S. and J.Z.R.; writing—review and editing, J.Z.R., M.S., M.W., and S.U.-B.; visualization, J.Z.R., M.S., and M.W.; supervision, S.U.-B.; project administration, S.U.-B.; funding acquisition, J.Z.R., M.W., and S.U.-B. All authors have read and agreed to the published version of the manuscript.

Funding

This research was funded by Bundesamt für Energie, grant number SI/501406-01, and by Innosuisse—Schweizerische Agentur für Innovationsförderung, grant number KTI.2014.0114. The APC was funded by the ZHAW university library.

Institutional Review Board Statement

Not applicable.

Informed Consent Statement

Not applicable.

Data Availability Statement

The data presented in this study are available in this article and its Supplementary Materials.

Acknowledgments

We are grateful to the following project partners for participating in the workshops and assisting us with the business case model and use definition, parameter estimation and model validation: Yves Wymann and Joachim Bagemihl (Alpiq), Jürgen Breit (Stadtwerke Crailsheim), as well as the three pilot customers Vion GmbH, Binder GmbH and Milchwerk Crailsheim-Dinkelsbühl eG. We are grateful for the thorough comments of two anonymous reviewers.

Conflicts of Interest

The authors declare no conflict of interest.

References

  1. Rogelj, J.; Luderer, G.; Pietzcker, R.C.; Kriegler, E.; Schaeffer, M.; Krey, V.; Riahi, K. Energy system transformations for limiting end-of-century warming to below 1.5 °C. Nat. Clim. Chang. 2015, 5, 519–527. [Google Scholar] [CrossRef]
  2. Federal Ministry for Economic Affairs and Energy Bundesministerium für Wirtschaft und Energie “Erneuerbare Energien”. 2019. Available online: https://www.bmwi.de/Redaktion/DE/Dossier/erneuerbare-energien.html (accessed on 1 June 2021).
  3. Bataille, C.; Åhman, M.; Neuhoff, K.; Nilsson, L.J.; Fischedick, M.; Lechtenböhmer, S.; Solano-Rodriquez, B.; Denis-Ryan, A.; Stiebert, S.; Waisman, H.; et al. A review of technology and policy deep decarbonization pathway options for making energy-intensive industry production consistent with the Paris Agreement. J. Clean. Prod. 2018, 187, 960–973. [Google Scholar] [CrossRef] [Green Version]
  4. Napp, T.A.; Gambhir, A.; Hills, T.P.; Florin, N.; Fennell, P.S. A review of the technologies, economics and policy instruments for decarbonising energy-intensive manufacturing industries. Renew. Sustain. Energy Rev. 2014, 30, 616–640. [Google Scholar] [CrossRef]
  5. Panos, E.; Kober, T.; Wokaun, A. Long term evaluation of electric storage technologies vs alternative flexibility options for the Swiss energy system. Appl. Energy 2019, 252, 113470. [Google Scholar] [CrossRef]
  6. Baruah, P.J.; Eyre, N.; Qadrdan, M.; Chaudry, M.; Blainey, S.; Hall, J.W.; Jenkins, N.; Tran, M. Energy system impacts from heat and transport electrification. Proc. Inst. Civ. Eng. Energy 2014, 167, 139–151. [Google Scholar] [CrossRef]
  7. Ecofys. Flex-Efficiency. Ein Konzept zur Integration von Effizienz und Flexibilität bei Industriellen Verbrauchern. 2016. Available online: https://www.agora-energiewende.de/en/topics/-agothem-/Produkt/produkt/286/Flex-Efficiency/ (accessed on 1 May 2021).
  8. Richter, M. Business model innovation for sustainable energy: German utilities and renewable energy. Energy Policy 2013, 62, 1226–1237. [Google Scholar] [CrossRef] [Green Version]
  9. Helms, T.; Loock, M.; Bohnsack, R. Timing-Based business models for flexibility creation in the electric power sector. Energy Policy 2016, 92, 348–358. [Google Scholar] [CrossRef]
  10. Wainstein, M.E.; Bumpus, A.G. Business models as drivers of the low carbon power system transition: A multi-level perspective. J. Clean. Prod. 2016, 126, 572–585. [Google Scholar] [CrossRef]
  11. Bidmon, C.M.; Knab, S.F. The three roles of business models in societal transitions: New linkages between business model and transition research. J. Clean. Prod. 2018, 178, 903–916. [Google Scholar] [CrossRef]
  12. Richter, M. German utilities and distributed PV: How to overcome barriers to business model innovation. Renew. Energy 2013, 55, 456–466. [Google Scholar] [CrossRef] [Green Version]
  13. Frankenberger, K.; Weiblen, T.; Csik, M.; Gassmann, O. The 4I-framework of business model innovation: A structured view on process phases and challenges. Int. J. Prod. Dev. 2013, 18, 249. [Google Scholar] [CrossRef]
  14. Thompson, J.D.; Macmillan, I.C. Business models: Creating new markets and societal wealth. Long Range Plann. 2010, 43, 291–307. [Google Scholar] [CrossRef]
  15. Sosna, M.; Trevinyo, R.N.; Velamuri, S.R. Business model innovation through trial-and-error learning: The naturhouse case. Long Range Plann. 2010, 43, 383–407. [Google Scholar] [CrossRef]
  16. Lempert, R.; Popper, S.; Bankes, S. Shaping the Next One Hundred Years: New Methods for Quantitative, Long-Term Policy Analysis; RAND Corporation: Santa Monica, CA, USA, 2003. [Google Scholar]
  17. Geissdoerfer, M.; Vladimirova, D.; Evans, S. Sustainable business model innovation: A review. J. Clean. Prod. 2018, 198, 401–416. [Google Scholar] [CrossRef]
  18. Bolton, R.; Hannon, M. Governing sustainability transitions through business model innovation: Towards a systems understanding. Res. Policy 2016, 45, 1731–1742. [Google Scholar] [CrossRef] [Green Version]
  19. Moallemi, E.A.; de Haan, F.; Kwakkel, J.; Aye, L. Narrative-Informed exploratory analysis of energy transition pathways: A case study of India’s electricity sector. Energy Policy 2017, 110, 271–287. [Google Scholar] [CrossRef]
  20. Helms, T. Cleaner and Less Energy—Investment and Business Model Dynamics in the Energy Transition Context. Ph.D. Dissertation, University of St. Gallen, St. Gallen, Switzerland, 2015. [Google Scholar]
  21. Hannon, M. Co-Evolution of Innovative Business Models and Sustainability Transitions: The Case of the Energy Service Company (ESCo) Model and the UK Energy System. Ph.D. Thesis, University of Leeds, Leeds, UK, October 2012; pp. 1–348.
  22. Cosenz, F. Supporting start-up business model design through system dynamics modelling. Manag. Decis. 2017, 55, 57–80. [Google Scholar] [CrossRef]
  23. Sterman, J. Business Dynamics; McGraw-Hill: New York, NY, USA, 2000. [Google Scholar]
  24. Moellers, T.; von der Burg, L.; Bansemir, B.; Pretzl, M.; Gassmann, O. System dynamics for corporate business model innovation. Electron. Mark. 2019, 29, 387–406. [Google Scholar] [CrossRef] [Green Version]
  25. Geum, Y.; Lee, S.; Park, Y. Combining technology roadmap and system dynamics simulation to support scenario-planning: A case of car-sharing service. Comput. Ind. Eng. 2014, 71, 37–49. [Google Scholar] [CrossRef]
  26. Kwakkel, J.H.; Pruyt, E. Exploratory modeling and analysis, an approach for model-based foresight under deep uncertainty. Technol. Forecast. Soc. Chang. 2013, 80, 419–431. [Google Scholar] [CrossRef]
  27. Sovacool, B.K.; Hess, D.J.; Amir, S.; Geels, F.W.; Hirsh, R.; Medina, L.R.; Miller, C.; Palavicino, C.A.; Phadke, R.; Ryghaug, M.; et al. Sociotechnical agendas: Reviewing future directions for energy and climate research. Energy Res. Soc. Sci. 2020, 70, 101617. [Google Scholar] [CrossRef]
  28. van Waes, A.; Farla, J.; Frenken, K.; de Jong, J.P.J.; Raven, R. Business model innovation and socio-technical transitions. A new prospective framework with an application to bike sharing. J. Clean. Prod. 2018, 195, 1300–1312. [Google Scholar] [CrossRef]
  29. Amit, R.; Zott, C. Value creation in E-business. Strateg. Manag. J. 2001, 22, 493–520. [Google Scholar] [CrossRef]
  30. Hacklin, F.; Björkdahl, J.; Wallin, M.W. Strategies for business model innovation: How firms reel in migrating value. Long Range Plann. 2018, 51, 82–110. [Google Scholar] [CrossRef]
  31. Chesbrough, H. Business model innovation: Opportunities and barriers. Long Range Plann. 2010, 43, 354–363. [Google Scholar] [CrossRef]
  32. McGrath, R.G. Business models: A discovery driven approach. Long Range Plann. 2010, 43, 247–261. [Google Scholar] [CrossRef]
  33. Andries, P.; Debackere, K.; Looy, B.V.A.N. Simultaneous experimentation as a learning strategy: Business model development under uncertainty. Strateg. Entrep. J. 2013, 310, 288–310. [Google Scholar] [CrossRef]
  34. Dobson, K.; Boone, S.; Andries, P.; Daou, A. Successfully creating and scaling a sustainable social enterprise model under uncertainty: The case of ViaVia Travellers Cafés. J. Clean. Prod. 2018, 172, 4555–4564. [Google Scholar] [CrossRef]
  35. Demil, B.; Lecocq, X. Crafting an innovative business model in an established company: The role of artifacts. Bus. Models Model. 2015, 31–58. [Google Scholar] [CrossRef]
  36. Sterman, D.J.; Henderson, R.; Beinhocker, D.E.; Newman, I.L. Getting big too fast: Strategic dynamics with increasing returns and bounded rationality. Manag. Sci. 2007, 53, 1–32. [Google Scholar] [CrossRef]
  37. Warren, K. The dynamics of strategy. Bus. Strateg. Rev. 1999, 10, 1–16. [Google Scholar] [CrossRef]
  38. Bankes, S. Exploratory modeling for policy analysis. Oper. Res. 1993, 41, 435–449. [Google Scholar] [CrossRef] [Green Version]
  39. Ghaffarzadegan, N.; Lyneis, J.; Richardson, G.P. How small system dynamics models can help the public policy process. Syst. Dyn. Rev. 2011, 27, 22–44. [Google Scholar] [CrossRef] [Green Version]
  40. Ding, Z.; Gong, W.; Li, S.; Wu, Z. System dynamics versus agent-based modeling: A review of complexity simulation in construction waste management. Sustainability 2018, 10, 2484. [Google Scholar] [CrossRef] [Green Version]
  41. Geels, F.W. Technological transitions as evolutionary reconfiguration processes: A multi-level perspective and a case-study. Res. Policy 2002, 31, 1257–1274. [Google Scholar] [CrossRef] [Green Version]
  42. Hekkert, M.P.; Suurs, R.A.A.; Negro, S.O.; Kuhlmann, S.; Smits, R.E.H.M. Functions of innovation systems: A new approach for analysing technological change. Technol. Forecast. Soc. Chang. 2007, 74, 413–432. [Google Scholar] [CrossRef] [Green Version]
  43. Wüstenhagen, R.; Boehnke, J. Perspectives on Radical Changes to Sustainable Consumption and Production; Greenleaf Publishing: Sheffield, UK, 2008. [Google Scholar]
  44. Wirtz, B.W.; Pistoia, A.; Ullrich, S.; Göttel, V. Business models: Origin, development and future research perspectives. Long Range Plann. 2016, 49, 36–54. [Google Scholar] [CrossRef]
  45. Yin, R.K. Case Study Research: Design and Method, 3rd ed.; SAGE Publications Inc.: London, UK; Thousand Oaks, CA, USA, 2003. [Google Scholar]
  46. Philibert, C. Direct and indirect electrification of industry and beyond. Oxf. Rev. Econ. Policy 2019, 35, 197–217. [Google Scholar] [CrossRef]
  47. Estermann, T.; Pichlmaier, S.; Guminski, A.; Pellinger, C. Kurzstudie Power-to-X. 2017. Available online: https://www.ffe.de/attachments/article/761/Kurzstudie Power-to-X.pdf (accessed on 10 November 2020).
  48. Pleßmann, G.; Blechinger, P. How to meet EU GHG emission reduction targets? A model based decarbonization pathway for Europe’s electricity supply system until 2050. Energy Strateg. Rev. 2017, 15, 19–32. [Google Scholar] [CrossRef]
  49. Behrangrad, M. A review of demand side management business models in the electricity market. Renew. Sustain. Energy Rev. 2015, 47, 270–283. [Google Scholar] [CrossRef]
  50. Lechtenböhmer, S.; Nilsson, L.J.; Åhman, M.; Schneider, C. Decarbonising the energy intensive basic materials industry through electrification—Implications for future EU electricity demand. Energy 2016, 115, 1623–1631. [Google Scholar] [CrossRef] [Green Version]
  51. Agora Energiewende. Eine Neuordnung der Abgaben und Umlagen auf Strom, Wärme, Verkehr. 2018. Available online: https://www.agora-energiewende.de/veroeffentlichungen/eine-neuordnung-der-abgaben-und-umlagen-auf-strom-waerme-verkehr/ (accessed on 1 February 2021).
  52. Wei, M.; McMillan, C.A.; de la Rue du Can, S. Electrification of industry: Potential, challenges and outlook. Curr. Sustain. Energy Rep. 2019, 6, 140–148. [Google Scholar] [CrossRef]
  53. Olsthoorn, M.; Schleich, J.; Klobasa, M. Barriers to electricity load shift in companies: A survey-based exploration of the end-user perspective. Energy Policy 2015, 76, 32–42. [Google Scholar] [CrossRef]
  54. Brolin, M.; Fahnestock, J.; Rootzen, J. Industry’s Electrification and Role in the Future Electricity System—A Strategic Innovation Agenda; Research Institutes of Sweden: Göteborg, Sweden, 2017. [Google Scholar] [CrossRef]
  55. Malhotra, A.; Battke, B.; Beuse, M.; Stephan, A.; Schmidt, T. Use cases for stationary battery technologies: A review of the literature and existing projects. Renew. Sustain. Energy Rev. 2016, 56, 705–721. [Google Scholar] [CrossRef]
  56. Fitzgerald, G.; Mandel, J.; Morris, J.; Touati, H. The Economics of Battery Energy Storage: How Multi-Use, Customer-Sited Batteries Deliver the Most Services and Value to Customers and the Grid; Rocky Mountain Institute: Basalt, CO, USA, 2015; Available online: https://rmi.org/wp-content/uploads/2017/03/RMI-TheEconomicsOfBatteryEnergyStorage-FullReport-FINAL.pdf (accessed on 11 November 2020).
  57. Klobasa, M. Dynamische Simulation eines Lastmanagements und Integration von Windenergie in ein Elektrizitätsnetz auf Landesebene unter Regelungstechnischen und Kostengesichtspunkten. Ph.D. Thesis, ETH Zurich, Zurich, Switzerland, 2007. [Google Scholar]
  58. Krzikalla, N.; Achner, S.; Brühl, S. Möglichkeiten zum Ausgleich Fluktuierender Einspeisungen aus Erneuerbaren Energien; Bundesverband Erneuerbare Energie e.V.: Bochum, Germany, 2013; Available online: https://www.bee-ev.de/fileadmin/Publikationen/Studien/Plattform/BEE-Plattform-Systemtransformation_Ausgleichsmoeglichkeiten.pdf (accessed on 10 November 2020).
  59. Bettencourt, L.A.; Ulwick, A.W. The customer-centered innovation map. Harv. Bus. Rev. 2008, 86, 109–114. [Google Scholar]
  60. Bagemihl, J.; Boesner, F.; Riesinger, J.; Künzli, M.; Wilke, G.; Binder, G.; Wache, H.; Laager, D.; Breit, J.; Wurzinger, M.; et al. A market-based smart grid approach to increasing power grid capacity without physical grid expansion. Comput. Sci. Res. Dev. 2018, 33, 177–183. [Google Scholar] [CrossRef]
  61. Osterwalder, A.; Pigneur, Y. Business Model Generation: A Handbook for Visionaries, Game Changers, and Challengers; John Wiley & Sons: Hoboken, NJ, USA, 2010. [Google Scholar]
  62. Bagemihl, J.; Breit, J.; Layec, V.; West, M.; Zapata, J. Poweralliance: Von der Lokalen Lastoptimierung zur Regionalen Verteilnetzoptimierung. 2019. Available online: https://www.aramis.admin.ch/Default?DocumentID=65020&Load=true (accessed on 1 May 2021).
  63. Christen, R.; Layec, V.; Wilke, G.; Wache, H. Technical validation of the RLS smart grid approach to increase power grid capacity without physical grid expansion. In Proceedings of the 8th International Conference on Smart Cities and Green ICT Systems—SMARTGREENS, Heraklion, Greece, 3–5 May 2019; pp. 123–130. [Google Scholar] [CrossRef]
  64. Viessmann. Oil/Gas Boilers and Low Pressure Hot Water Boilers up to 22 MW. Available online: http://www.viessmann-project.hk/content/dam/vi-corporate/COM/Download/Oil-gas-boilers-and-hot-water-boilers.pdf/_jcr_content/renditions/original.media_file.download_attachment.file/Oil-gas-boilers-and-hot-water-boilers.pdf (accessed on 1 May 2019).
  65. Tractebel; Engie; Hinicio. Study on Early Business Cases for H2 in Energy Storage and More Broadly Power to H2 Applications; Fuel, Cells and Hydrogen Joint Undertaking: Brussels, Belgium, 2017. [Google Scholar]
  66. Mulder, M.; Perey, P.; Moraga, J.L. Outlook for a Dutch Hydrogen Market; Pol. No 5; Centre for Energy Economics Research (CEER): Groningen, The Netherlands, 2019. [Google Scholar]
  67. Kubli, M. Squaring the sunny circle? On balancing distributive justice of power grid costs and incentives for solar prosumers. Energy Policy 2018, 114, 173–188. [Google Scholar] [CrossRef] [Green Version]
  68. Struben, J.; Sterman, J.D. Transition challenges for alternative fuel vehicle and transportation systems. Environ. Plan. B Plan. Des. 2008, 35, 1070–1097. [Google Scholar] [CrossRef]
  69. Öko-Institut; Fraunhofer ISI. Klimaschutzszenario 2050. 2015. Available online: https://www.oeko.de/oekodoc/2451/2015-608-de.pdf (accessed on 3 June 2019).
  70. Prognos; EWI; GWS. Entwicklung der Energiemärkte—Energiereferenzprognose; Prognos: Basel, Switzerland; EWI: Köln, Germany; GWS: Osnabrück, Germany, 2014; Available online: https://www.bmwi.de/Redaktion/DE/Publikationen/Studien/entwicklung-der-energiemaerkte-energiereferenzprognose-endbericht.pdf (accessed on 3 June 2019).
  71. Liaw, A.; Wiener, M. Classification and regression by randomForest. R News 2002, 2, 18–22. Available online: https://www.r-project.org/doc/Rnews/Rnews_2002-3.pdf (accessed on 2 May 2016).
  72. Harper, E.B.; Stella, J.C.; Fremier, A.K. Global sensitivity analysis for complex ecological models: A case study of riparian cottonwood population dynamics. Ecol. Appl. 2011, 21, 1225–1240. [Google Scholar] [CrossRef] [PubMed]
  73. Coutts, S.R.; Yokomizo, H. Meta-Models as a straightforward approach to the sensitivity analysis of complex models. Popul. Ecol. 2014, 56, 7–19. [Google Scholar] [CrossRef]
  74. Speich, M.J.R.; Zappa, M.; Lischke, H. Sensitivity of forest water balance and physiological drought predictions to soil and vegetation parameters—A model-based study. Environ. Model. Softw. 2018, 102, 213–232. [Google Scholar] [CrossRef]
  75. Pianosi, F.; Beven, K.; Freer, J.; Hall, J.W.; Rougier, J.; Stephenson, D.B.; Wagener, T. Sensitivity analysis of environmental models: A systematic review with practical workflow. Environ. Model. Softw. 2016, 79, 214–232. [Google Scholar] [CrossRef]
  76. Bomberg, C.; Grundmann, R.A.; Hönniger, S.; Brauns, P.; Feske, L.; Früh, S.; Schubert, F.; Trott, T.; Zöll, J. Strommarkt 2050—Analyse Möglicher Szenarien der Entwicklung des Deutschen und Mitteleuropäischen Strommarktes bis 2050; Fachhochschule Erfurt: Erfurt, Germany, 2018; Available online: https://get.fh-erfurt.de/fileadmin/GET/Dokumente/Download/Forschung-Lenz/Studie_Strommarkt_2050.pdf (accessed on 3 May 2019).
  77. BDEW. Diskussionspapier Marktregeln für Eine Erfolgreiche Sektorkopplung; BDEW: Berlin, Germany, 2019; Available online: https://www.bdew.de/media/documents/Stn_20190528_Diskussionspapier-Marktregeln-Sektorkopplung.pdf (accessed on 10 November 2020).
  78. Golling, C.; Heuke, R.; Seidl, H.; Uhlig, J. Roadmap Power to Gas; DENA: Berlin, Germany, 2017; Available online: https://www.dena.de/fileadmin/dena/Publikationen/PDFs/2019/Roadmap_Power_to_Gas.pdf (accessed on 10 November 2020).
  79. Schröder, S.T. Parallel Feed-In Grids for Renewable Energy: Contesting the Natural Monopoly? 2009. Available online: https://tu-dresden.de/bu/wirtschaft/bwl/ee2/ressourcen/dateien/dateien/ordner_enerday/ordner_enerday2009/ordner_vortrag/schroeder_paper.pdf?lang=de (accessed on 1 February 2021).
  80. International Renewable Energy Agency (IRENA). Innovation Landscape Brief: Future Role of Distribution System Operators; International Renewable Energy Agency (IRENA): Abu Dhabi, United Arab Emirates, 2019. [Google Scholar]
  81. Edens, M.G.; Lavrijssen, S.A.C.M. Balancing public values during the energy transition—How can German and Dutch DSOs safeguard sustainability? Energy Policy 2019, 128, 57–65. [Google Scholar] [CrossRef]
  82. Ruester, S.; Schwenen, S.; Batlle, C.; Pérez-Arriaga, I. From distribution networks to smart distribution systems: Rethinking the regulation of European electricity DSOs. Util. Policy 2014, 31, 229–237. [Google Scholar] [CrossRef] [Green Version]
  83. Walker, W.E.; Harremoës, P.; Rotmans, J.; van der Sluijs, J.P.; van Asselt, M.B.A.; Janssen, P.; Krayer von Krauss, M.P. Defining uncertainty: A conceptual basis for uncertainty management in model-based decision support. Integr. Assess. 2003, 4, 5–17. [Google Scholar] [CrossRef] [Green Version]
  84. Eker, S.; Slinger, J.; van Daalen, E.; Yücel, G. Sensitivity analysis of graphical functions. Syst. Dyn. Rev. 2014, 30, 186–205. [Google Scholar] [CrossRef]
  85. Refsgaard, J.C.; van der Sluijs, J.P.; Højberg, A.L.; Vanrolleghem, P.A. Uncertainty in the environmental modelling process—A framework and guidance. Environ. Model. Softw. 2007, 22, 1543–1556. [Google Scholar] [CrossRef] [Green Version]
  86. Taylor, T.R.B.; Ford, D.N.; Ford, A. Improving model understanding using statistical screening. Syst. Dyn. Rev. 2010, 26, 73–87. [Google Scholar] [CrossRef] [Green Version]
  87. Abdelkafi, N.; Täuscher, K. Business models for sustainability from a system dynamics perspective. Organ. Environ. 2016, 29, 74–96. [Google Scholar] [CrossRef]
  88. Cosenz, F.; Noto, G. A dynamic business modelling approach to design and experiment new business venture strategies. Long Range Plann. 2018, 51, 127–140. [Google Scholar] [CrossRef]
Figure 1. Method for the exploration of innovative business models under deep uncertainty.
Sustainability 13 07264 g001
Figure 2. Barriers and drivers to the electrification of industrial processes.
Sustainability 13 07264 g002
Figure 3. Canvas for the Power Alliance business model, from the perspective of the grid operator.
Sustainability 13 07264 g003
Figure 4. Structure of the system dynamics model representing market dynamics at the scale of a local distribution grid. Boxes represent stocks, i.e., state variables; double arrows with valves represent flows, i.e., changes of the values of stocks; simple arrows represent causal relationships.
Sustainability 13 07264 g004
Figure 5. (a) Percentage of renewables in the total energy consumption for the considered scenarios; (b) CO2 emissions factor of the German electricity grid.
Sustainability 13 07264 g005
Figure 6. Future evolution of energy price. The solid line shows the future price calculated with Equation (6), using the default parameter value for the annual increase (3% per year). The stippled lines show the development with minimum and maximum parameter values.
Sustainability 13 07264 g006
Figure 7. (a,b) Installed PtH capacity, expressed as a fraction of peak demand in the local grid, for the BAU scenario (a) and the CPS scenario (b), with different percentage of electricity consumption from own renewable sources. (c,d) GHG emission savings in the PtH case, as a percentage of the emissions that would occur if none of the customers switched from the reference case (gas boiler) to PtH.
Sustainability 13 07264 g007
Figure 8. (a,b) Installed PtH2 capacity, expressed as a fraction of peak demand in the local grid, for the BAU scenario (a) and the CPS scenario (b), with different percentage of electricity consumption from own renewable sources. (c,d) GHG emission savings in the PtH2 case, as a percentage of the emissions that would occur if none of the customers switched from the reference case (steam methane reforming) to PtH2.
Sustainability 13 07264 g008
Figure 9. Installed battery capacity, expressed as a fraction of peak demand in the local grid, for the BAU scenario and the CP scenario.
Sustainability 13 07264 g009
Figure 10. Evolution of the number of customers having installed flexibility and subscribed to PAT in the 2000 sensitivity runs. The line to the right of each plot shows the kernel density estimate for the number of customers at the end of the simulation period (2050).
Sustainability 13 07264 g010
Figure 11. Parameter importance scores obtained in the sensitivity analysis. The score shown is the “mean decrease in accuracy” indicator of the random forest meta-models. The higher the score, the more influence a parameter has on model outputs.
Sustainability 13 07264 g011
Table 1. Use cases assumptions.
PtH
Installed capacity500 kWe
Investment cost100 EUR/kW[47]
Life time 30 years[47]
Efficiency 98%[47]
Efficiency of the replaced boiler98%[64]
PtH2
Capacity of the water electrolyzer 500 kW
Investment cost @20161500 EUR/kW[47]
Investment cost @2050480 EUR/kW[47]
Life time 30 years[47]
Electricity consumption per kg H255 kWh/kg[65]
Gas needed per kg H2 for the replaced SMR40 kWh/kg[66]
Batteries
Installed capacity500 kWe
Investment cost @20161192 EUR/kWh[48]
Investment cost @2050289 EUR/kWh[48]
Life time 20 years
Charging time1 h
Table 2. General assumptions of the two analyzed policy scenarios.
BAU ScenarioClimate Policy Scenario
2030205020302050
CO2 electricity mix emission factor 1CO2g/kWel50628441117
Percentage of renewables in the total energy consumption 1%38664496
CO2 price on gas 2EUR/kWh00.01 (45 EUR/TonCO2)
Electricity tax reduction (tax reform) 2EUR/kWh0up to 0.077 (see Supplementary Materials)
1 [69]; 2 [51].
Table 3. List of parameters varied in the sensitivity analysis, with their respective ranges and default values. For the parameters that appear in the model description in this report, the corresponding equations are indicated. For the other parameters, please refer to the description of the business models (BM) in Section S1 of the Supplementary Materials.
SymbolMeaningUnitsMinimum ValueMaximum ValueDefault ValueEq.
Common parameters
P g r i d , S T Standard network tariff (ST)EUR/kW5010070BM
f P A T PAT, as a fraction of STDmnl0.110.1BM
P i n v , s m a r t Investment cost smart controlEUR100500300BM
H r u n n i n g Running hours per year (PtH and PtH2 only)hours/year300070006000BM
b e l 
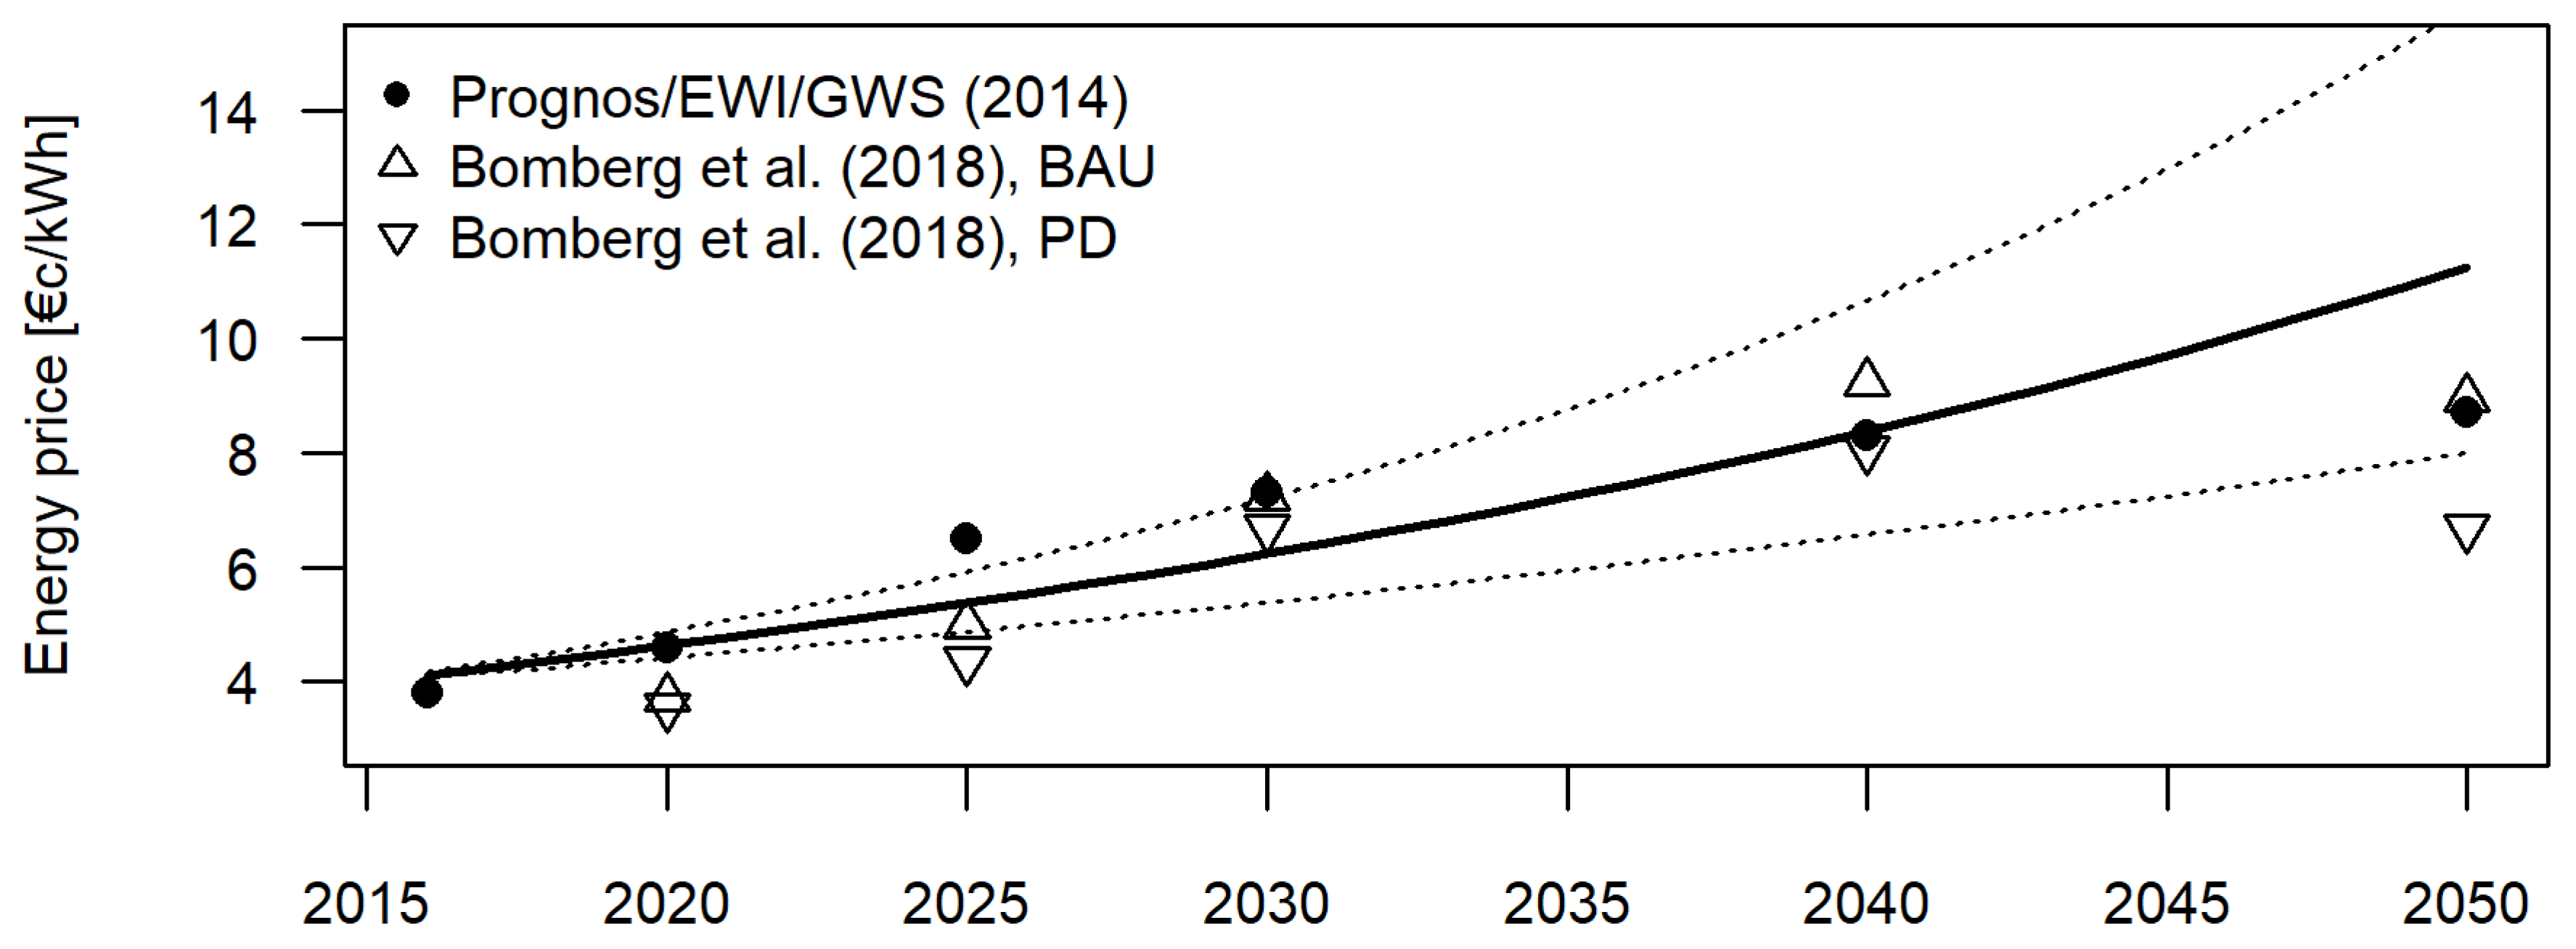
Annual percentual electricity price increaseDmnl0.020.040.038
d P e l , m i n Min electricity price differenceEUR/kWh00.040.04BM
d P e l , m a x Max electricity price differenceEUR/kWh00.10.07BM
ATloadAT flexible loadsyears520151
ATPATAT smart controlyears1521
β Shape parameter for the function linking utility to preferenceDmnl4862
r c o n t a c t Contact rateDmnl0.10.30.27
l C R M Effect of customer relationship management by utility on familiarityDmnl0.050.150.16,7
PtH parameters
η P 2 H e a t PtH efficiencyDmnl0.970.990.97BM
b g a s Annual percentual gas price increaseDmnl0.020.030.028
Battery parameters
P F I T Feed-in tariffEUR/kWh0.030.120.08BM
η B a t t Battery efficiencyDmnl0.70.90.7BM
PtH2 parameters
P H 2 Hydrogen priceEUR/kg4128BM
η H 2 Electricity consumption per kg hydrogen kWh/kg506055BM
Table 4. Percentage of the variance of model outputs explained by the random forest meta-models.
BAUCPS
PtH94.82%86.55%
PtH26.07%69.18%
Batteries84.39%84.17%
Publisher’s Note: MDPI stays neutral with regard to jurisdictional claims in published maps and institutional affiliations.

