Article

Personal Heating in Dwellings as an Innovative, Energy-Sufficient Heating Practice: A Case Study Research

Sustainability Group, ArcK Research Group, Faculty of Architecture and Arts, Hasselt University, Agoralaan Building E, 3590 Diepenbeek, Belgium
*
Author to whom correspondence should be addressed.
Sustainability 2021, 13(13), 7257; https://doi.org/10.3390/su13137257
Submission received: 1 June 2021 / Revised: 24 June 2021 / Accepted: 25 June 2021 / Published: 29 June 2021

Abstract

:
Despite the efforts to improve the energy efficiency of buildings, the actual energy consumption decreased much less than expected in recent years. Therefore, energy sufficiency is gaining attention as a complementary approach to energy efficiency. It aims to reduce the actual energy consumption of buildings by providing thermal comfort to residents in a sufficient way. This demands for alternative heating practices, such as the application of personal heating systems. Although a review of past studies shows that, in office buildings, thermal comfort can be provided with less energy by using personal heating systems, the application in a residential context is much less explored. Our hypothesis is that an innovative, energy-sufficient personal heating practice also has potential to reduce the overall energy consumption in dwellings. Therefore, this paper presents the results of a one-week case study on personal heating as an energy-sufficient heating practice in three dwellings. During the case study, the ambient temperature was reduced to 18 °C, and residents were allowed to use active and passive personal heating systems to make themselves as comfortable as possible. They were also asked to evaluate their thermal sensation and thermal comfort. The results show that, despite a lower indoor temperature, residents are able to achieve thermal comfort by using personal heating at the locations where they effectively reside. Additionally, a significant energy saving potential was found. The case study proved our hypothesis, leading to the conclusion that an innovative, sufficient personal heating practice in dwellings can be a supplementary step to reduce the energy consumption to meet the global challenges.

1. Introduction

1.1. Background

Climate change is one of the most critical problems the world is facing today [1], mainly driven by carbon and other greenhouse gas emissions [2]. To meet the global climate ambitions of the Paris agreement, the greenhouse gas emissions should be reduced from 1990 levels by at least 55% by 2030 [3]. Since the built environment is responsible for 39% of all carbon emissions and operational emissions account for 28% of all carbon emissions [4], reducing the emissions of buildings is essential to achieve future climate goals. In 2017, the residential sector represented almost 20% of the total Belgian energy consumption, of which, on average, 74% was used for heating dwellings [5,6]. Reducing the energy consumption for heating in dwellings is thus an essential part of mitigation of climate change.
The common approach to reduce heating energy consumption is to promote or impose energy efficiency measures, such as high insulation levels, air-tightness requirements, the use of energy-efficient appliances, and energy-efficient all-air heating systems. This object-centered approach aims to optimize the dwellings’ skin and the efficiency of the installations but often neglects the residents’ behavior or practices. As a result, despite stricter energy performance regulations, the actual energy consumption decreased only in recent years, and less than estimations of the energy efficiency potential suggested [7]. Energy savings by energy efficiency measures are partially nullified by the rebound and cohort effect, such as increasing the heating setpoint [8,9] or the construction of larger dwellings [10,11]. Additionally, the current efficiency strategy is implemented rather slowly. Only around 1% of the European building stock is renovated each year, while almost 75% of the building stock in Europe is energy-inefficient [3]. Moreover, the current energy efficiency strategies result in an increasing demand for building materials [12,13].
In the current common heating practice, dwellings are often heated by single-zone central heating systems controlled by a single central thermostat [14], which is developed for heating several rooms simultaneously and completely to a uniform indoor climate. As residents do not use rooms entirely and simultaneously and only stay at specific spots within a room [15,16], there is a mismatch between the effective spatial use and the common heating practice. However, the current object-centered energy efficiency approach focuses on improving the energy efficiency of the building or the heating system but does not question this current heating practice or current lifestyle.
To tackle this, in recent years, energy sufficiency has gained increasing attention as a complementary approach to reduce the absolute energy consumption of a household. On the one hand, energy sufficiency aims for living well by starting from the effective needs of the occupant (i.c., thermal comfort). On the other hand, it aims for a reduction of the overall energy consumption by questioning the provided service (i.c., the heating practice). In contrast to the object-centered energy efficiency approach, the energy sufficiency approach is resident-oriented, since it starts from the residents’ needs. As such, energy sufficiency can be defined as a state where the basic needs for energy services are met, while the ecological limits are respected [17], i.e., the provided services are reduced or substituted to fulfil the needs of the people without delivering too much. Shifting the focus from an object-centered energy efficiency approach, that is, focusing on the building skin and the heating system, toward a resident-oriented energy sufficiency approach that questions the current heating practice is essential to find opportunities to simultaneously provide thermal comfort to the residents and reduce the heating energy consumption significantly.
The limitations of traditional all-air heating systems have led to the development of personal heating appliances, such as heated chairs and hand and foot warmers. Whereas in a conventional heating practice, a uniform temperature is provided continuously in all rooms, a personal heating practice aims to provide thermal comfort to the individual resident by heating people when and where needed according to their needs. As such, personal heating can be considered as an energy sufficient heating practice by adjusting the energy service (only heating persons, not spaces, and only when and where needed). At the same time, the overall indoor temperature can be reduced, which has been proven to cause significant energy savings [18,19]. A personal heating practice can be relatively simple and quickly implemented and can be a low-cost energy-saving alternative to traditional cost- and material-intensive energy efficiency renovations.

1.2. Review of Personal Heating Studies

Many researchers have investigated personal heating, as is shown in Table 1. In these studies, different types of personal heating systems can be distinguished: chair heaters, foot and hand warmers, combinations of these appliances, radiant heating panels and other systems such as heated clothing. Most of the studies made use of climate chambers at several ambient temperatures. In studies with human test persons, the human subjects mainly were asked to sit first in an acclimatization room with a reference (comfort) temperature without making use of any personal heating. Subsequently, the human subjects had to sit in another room with an ambient temperature below the standardized comfort temperature while making use of a personal heating system. In some experiments, the test persons could control the system’s temperature; in other experiments, they had no control. During the experiment, people were asked to vote on their thermal sensation and thermal comfort. Other studies made use of a thermal manikin (study 8, 12, 14, 16) or simulations (study 6, 8, 17, 19) such as CFD (computer fluid dynamics). The different studies are briefly presented in the following subparagraphs according to the type of personal heating system, type of experiment, presence/absence of individual control, ambient temperatures, whether the study had a focus on thermal comfort or energy savings and whether a system was investigated or a heating practice.

1.2.1. Chair Heaters

Study 1 [20] used a reference ambient temperature of 18 °C and showed that a heated chair in a room of 16 °C could improve the thermal sensation from slightly cool to neutral and could also improve the thermal comfort from slightly uncomfortable to slightly comfortable. Heating the seat cushion was also found to improve the thermal sensation in unheated body parts such as hand and foot, while the back of the seat only has an effect on the thermal sensation in the back. Study 2 [21] evaluated the thermal sensation and thermal comfort when applying chair heating at three different ambient temperatures and compared it with the comfort and sensation at the same ambient temperature but without personalized heating. A distinction is made between thermal sensation and thermal comfort, as a person’s neutral thermal sensation does not always result in a comfortable environment or vice versa, especially in nonuniform environments [43]. Thermal sensation describes a conscious feeling that grades the thermal environment (commonly expressed by the 7-point ASHRAE scale ranging from cold to hot), while thermal comfort describes the satisfaction of this feeling (commonly expressed by a Likert scale ranging from very uncomfortable to very comfortable). Chair heating was found to improving the overall thermal sensation at ambient temperatures of 14 °C and 16 °C. At 18 °C, the thermal sensation was already voted as neutral without personal heating, and no significant further improvements were found when using the heated chair. When considering thermal comfort instead of thermal sensation, only substantial improvements were found at 14 °C. With personalized heating at an ambient temperature of 14 °C and 16 °C, the thermal comfort was voted slightly uncomfortable, and at 18 °C, it was voted comfortable. Study 3 [22] showed that using a heated chair can increase both thermal sensation and thermal comfort at ambient temperatures of 16 °C and 18 °C. In the coldest situation of 16 °C, in addition to the heated chair, test subjects were allowed to increase their clothing insulation. In study 4 [23], three types of office chairs were compared: two ordinary chairs and one active (heating and cooling) chair. The experiments show that the active chair could thermally satisfy the test subjects the most. In study 5 [24], a water-fed seat for vehicles was tested. During the experiment, different water temperatures were applied. They found that, in the optimal test situation (ambient temperature and water temperature), the ambient temperature could be reduced by 5.5 °C while maintaining a percentage of thermal comfort satisfaction of 90%, and even reduced by 9.3 °C with a percentage of satisfaction of 80%. In study 21 [40], a high occupancy satisfaction rate was found while using a heated chair during a 6-month field study in an office building. They also found that fast-acting heating has the potential to address the comfort needs of the occupants with minimal energy consumption.

1.2.2. Foot and Hand Warmers

As hands and feet are the most sensitive for cold environments, heating these body parts can have a positive spatial alliesthesia effect (Spatial alliesthesia means that a nonuniform environment, where different body parts experience different temperatures, will be experienced more pleasant than a uniform environment) on human subjects. In study 9 [28], conductive palm warmers and convective foot warmers were tested at several ambient temperatures and at a reference temperature of 24.5 °C, which was voted as slightly cool to neutral. During the tests, the test persons had to perform several tasks such as filling in a sudoku, solving math problems and typing. The systems were able to bring the thermal sensation of the subjects close to neutral at a temperature of 20 °C and to slightly cool at a temperature of 18 °C. When the user had control over the system, they were able to bring their comfort closer to neutral than when they had no control over the system. Zhang et al. (2015) (study 7) studied a foot warmer by using radiant lamps, discussed in Section 1.2.4. In study 22 [41], the use of an electric personal heating device (Huo xiang which is a traditional heating device in China) was investigated in natural-ventilated buildings at a temperature far below the standardized comfort temperature. A high comfort acceptability rate was found at temperatures between 8–14 °C.

1.2.3. Combination of Techniques (Chairs, Foot and Wrist Warmers)

In study 10 [29], a heated chair and a heated chair in combination with a leg warmer were tested at ambient temperatures of 14 °C, 16 °C and 18 °C. Results show that the combination of both had the most positive effect on the thermal sensation, although the difference between the chair alone and the combination of both was minor at a temperature of 18 °C. At all temperatures, the systems were able to bring the thermal sensation to slightly cool or neutral. Study 12 [31] tested insole heating, wrist heating, the combination of both and the combination with a heated chair. They showed that these systems could bring the whole-body thermal sensation at 18 °C from cool to neutral when using insole and wrist heating or even to slightly warm when combining these systems with a heated chair. When using these systems separately, the improvements of the thermal sensation of the locally heated body parts are generally better than the whole-body improvements. A thermal acceptance rate of even 97.5% was reached when using the combinations of wrist heating, insole heating and chair heating. In study 13 [32], a heated chair, heated desk mat and heated floor mat and the combination of these were tested. Results show that the effect of the heated floor mat is less than that of the other systems, and the combination of all three techniques is most effective. In contrast to some other studies, this study did not find a significant difference between an automatic and a fixed control.

1.2.4. Infrared Heaters

Several types of radiant heating, such as a complete radiant ceiling, local radiant heating panels and infrared lamps and localized floor heating, have already been studied in literature, although many more studies are focusing on radiative cooling. When using radiant heating sources, thermal discomfort can arise from radiant asymmetry. In general, people are more sensitive to asymmetric radiation caused by a warm ceiling than caused by vertical surfaces [36]. In study 18 [37], local radiant panels at a desk were tested at different ambient temperatures. Results show that, despite the radiant panels, subjects felt cooler when the ambient temperature was decreased to 17 °C and 14 °C in comparison with the thermal sensation at a reference temperature of 23 °C. In addition, the percentage of dissatisfaction due to local discomfort increased when the temperature was lowered. In combination with a heated chair, Watanabe et al. (2010) (study 14) [33] also studied a radiant heating panel placed under the desk and a radiant floor panel at an ambient room temperature of 20 °C and showed that the use of these systems corresponds to the effect of an increase of the ambient temperature of, respectively, 2.8 °C and 2.1 °C. Udayraj et al. (2018) (study 15) [34] tested a radiant heating panel in combination with a heated table pad at an ambient temperature of 15 °C and 18 °C. Results show that, when using these techniques at 15 °C, the thermal sensation was voted between slightly cool and neutral, while at 18 °C, it ranged between neutral and slightly warm. These techniques’ energy consumption was significantly higher than the other techniques they tested (heated chair with heated floor mat and the heated clothing). Study 7 [26] studied a foot warmer at several ambient temperatures, and they found that a foot warmer could improve the thermal sensation of the test subjects at lower ambient temperatures. Because the personal heating system was applied in a real office building, the heating energy savings are calculated and found to be in the range of 38% to 75%, depending on the heating setpoint and outdoor temperature.

1.2.5. Other Techniques

In study 15 [34], electrically heated clothing was tested, among other things, at an ambient temperature of 15 °C and 18 °C. It was found that heated clothing has a better effect on the whole body’s thermal sensation than a heated radiant panel with a heated table pad or a heated chair with a heated floor mattress. Comparing the energy consumption of the used techniques showed that the heated clothing consumes significantly less than the other strategies. Study 19 [39] on the recently developed Embr Wave wristband showed that this low-power device can improve the whole body thermal sensation, thermal comfort and pleasantness with 0.5 to 1 scale unit, which corresponds with an ambient temperature increase of 2–3 °C. In study 23 [42], different combinations of radiant heating and heated clothing were tested at 13 °C and 15 °C. It was found that personal heating can effectively provide thermal comfort to the occupants and that direct clothing heating is much more efficient in providing comfort.

1.3. Research Gap and Hypothesis

As Table 1 shows, many studies demonstrated the potential of personal heating systems to increase the occupants’ thermal comfort. However, only a few studies investigated personal heating as energy-saving solution, as confirmed by Veselý and Zeiler [44] and Rawal et al. [45], who stated that there is—up to now—little focus on the power use of personal heating, cooling or ventilation.
Even more importantly, from the point of view of energy sufficiency, these studies focus mostly on evaluating a specific personal heating system (e.g., a heated chair) rather than investigating the personal heating practice itself. For the latter, including the environment where the occupant performs the heating practice is essential. It can be found that most of the studies are focusing on office environments where the activities are mostly static and human positions are mostly limited to sitting at a desk. Therefore, the findings of these studies cannot be extrapolated to residential buildings due to the more dynamic behavior in a residential context. Additionally, most experiments are done in a steady-state lab environment, where the test subjects are removed from the real world and are only involved in the experiment for a maximum of a few hours. Real-life studies on personal heating systems and/or practices are limited, and real-life studies on personal heating practices in a residential environment where residents change location, activities and clothing (including additional blankets) rapidly, are missing. Our hypothesis is that personal heating has potential as an innovative energy sufficient heating practice in dwellings to provide thermal comfort with less energy than the traditional heating practice. Therefore, the following sections of this paper present a real-life case study in three dwellings in which the potential of personal heating practice has been investigated in a residential context from the point of view of both thermal comfort and energy savings. Demonstrating the potential of a personal heating practice in dwellings can stimulate the heating sector and governments to rethink the current energy efficiency approach by adding energy sufficiency as an additional approach to reduce the global energy demand.

2. Materials and Methods

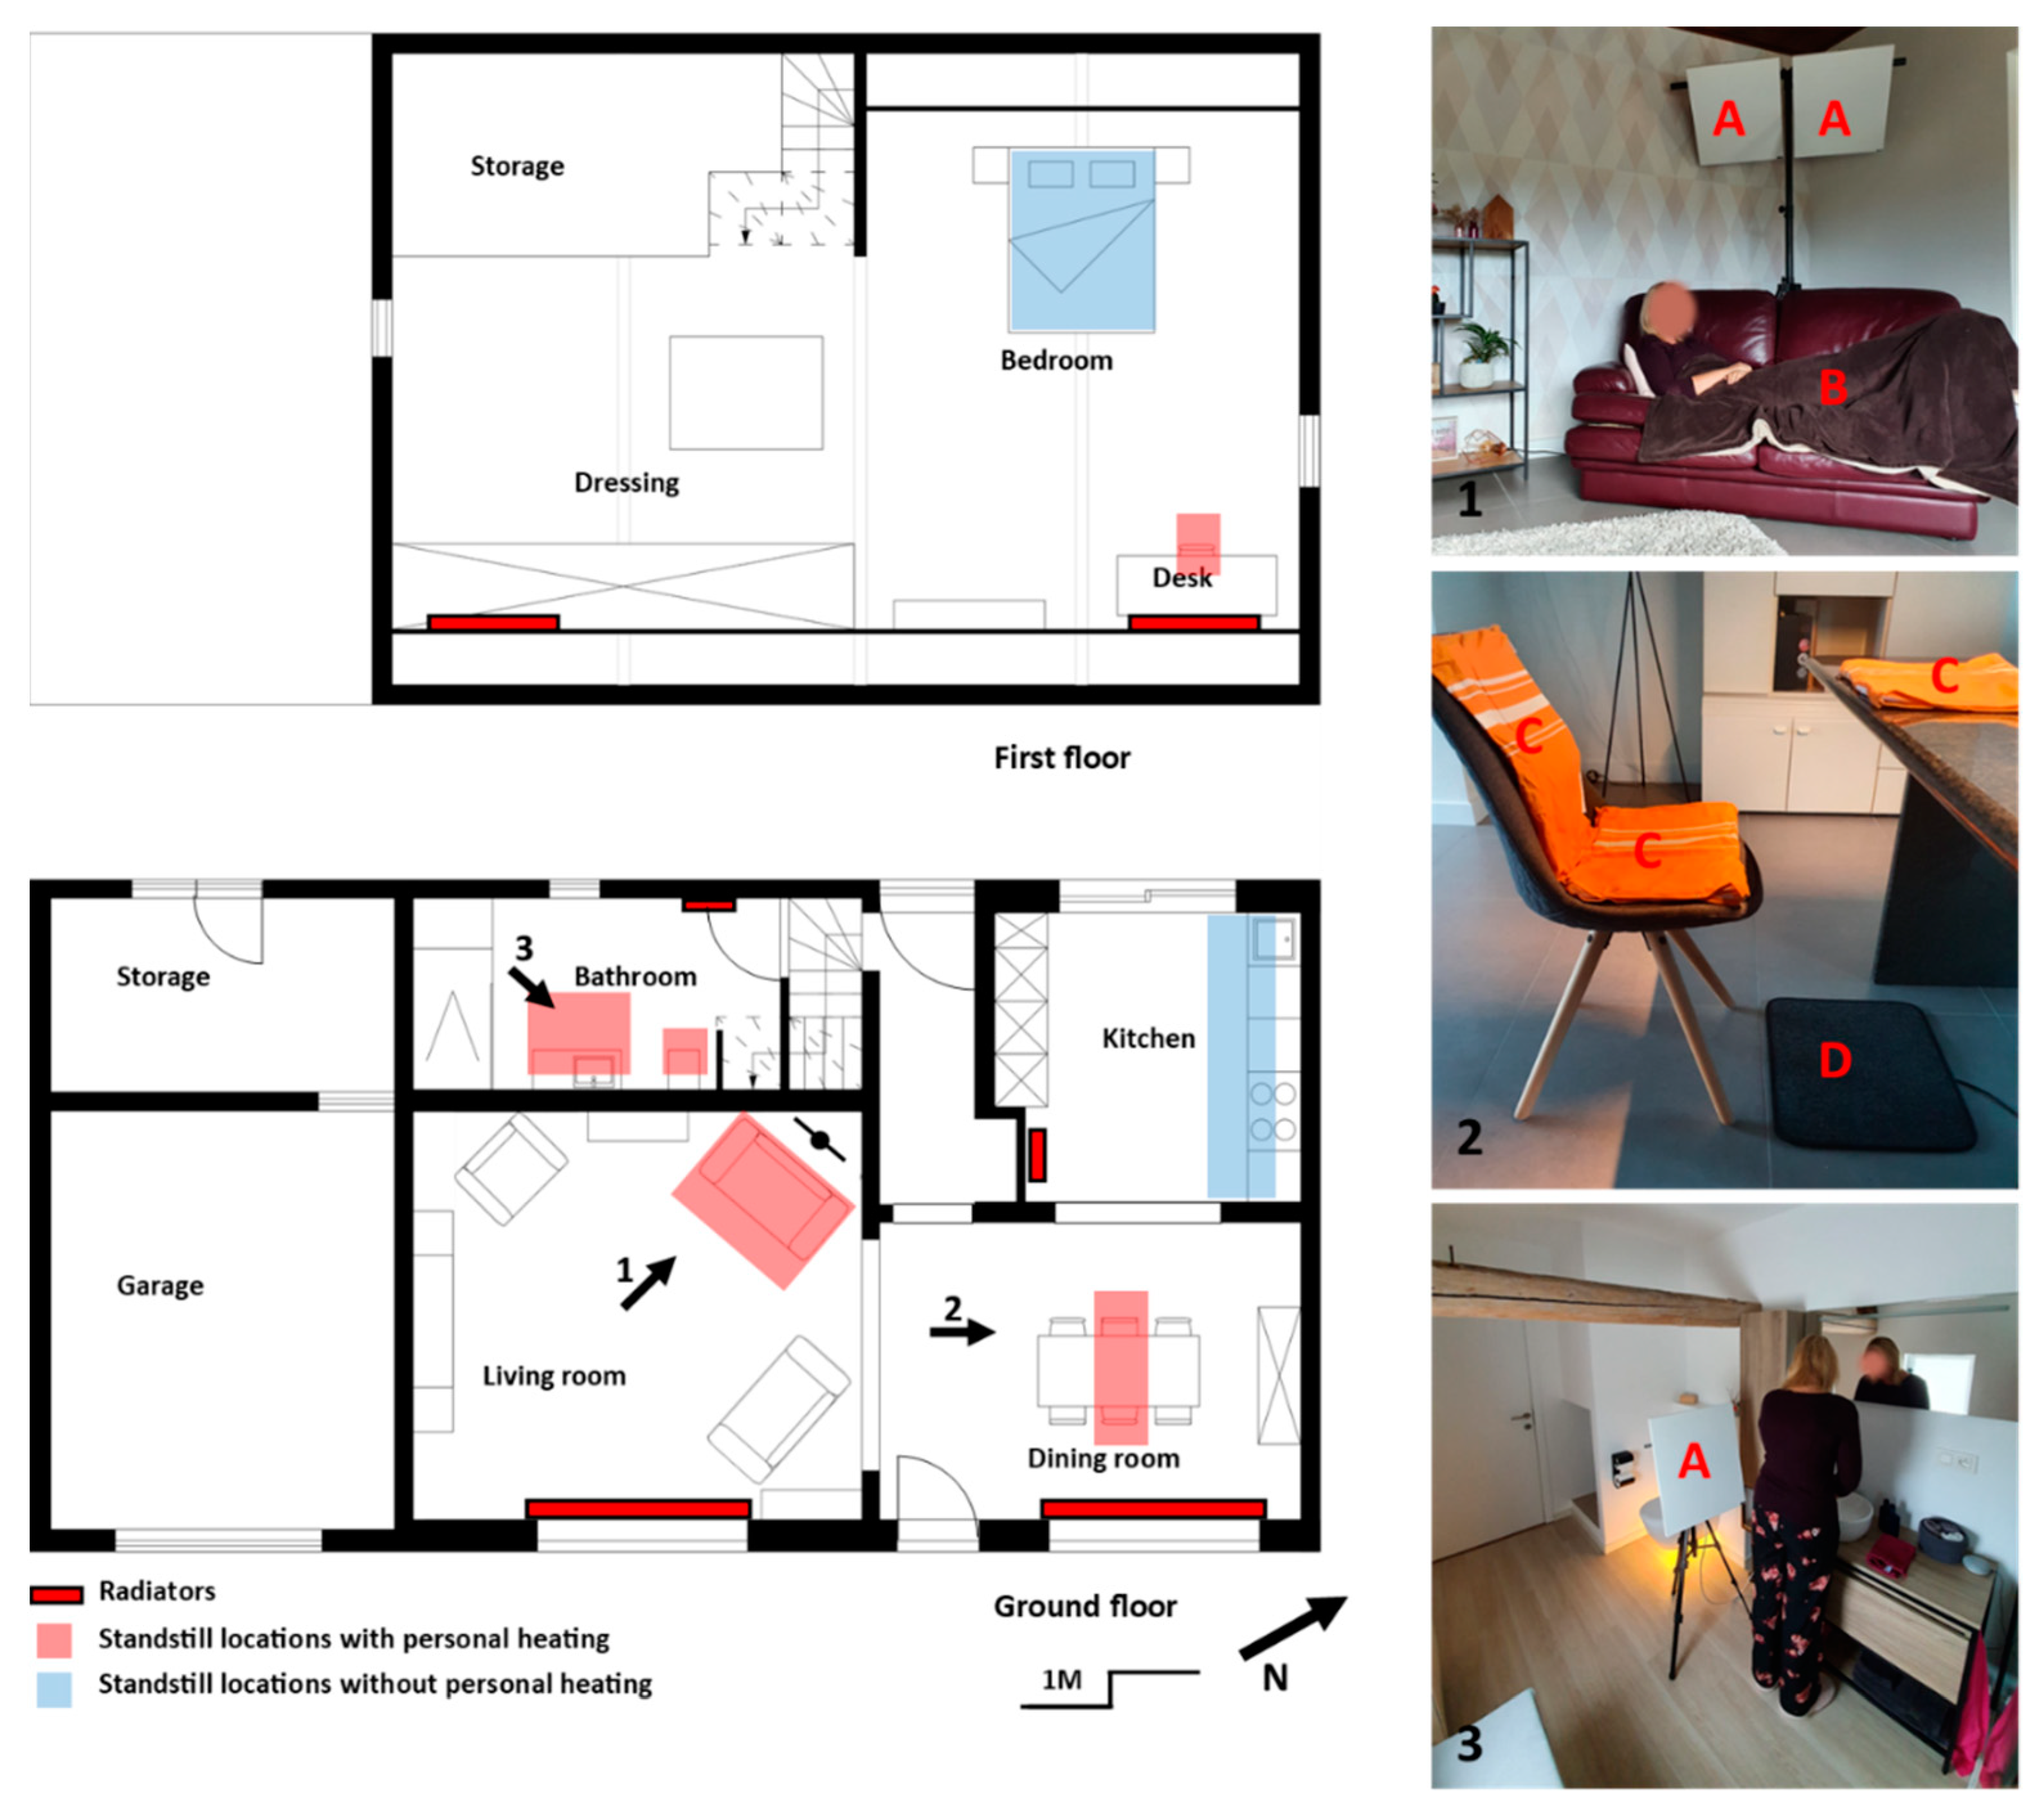
2.1. Experiment Description

Between December 2019 and February 2020, an in-depth case study research was conducted on the implementation of a personal heating practice in three different dwellings for at least one week (Table 2). The involved dwellings are weakly or only partially insulated. Five residents participated in the experiment, three men and two women between 25 and 30 years old. The residents were asked to lower the indoor temperature to 18 °C. Simultaneously, they were provided with a range of personal heating systems to improve their thermal comfort at locations where they effectively stay and perform activities, also called standstill locations. The standstill locations in these dwellings with the same residents were analyzed in a previous study in which the exact location of the resident was monitored during one week [10,11]. Five generic standstill locations were defined: an area in the bathroom, the bed, the dining/kitchen table, the kitchen worktop and the couch in the living room. Additionally, in this previous study, the common heating practice of the residents, the indoor temperature in the dwellings and the residents’ thermal sensation were measured, and they are used as a reference in this study on personal heating practice. Furthermore, the overall heating energy consumption for heating was measured in dwelling 3 during the case study with a lower ambient temperature.

2.2. Implemented Personal Heating Systems

At the start of the experiment, four different low-cost, off-the-shelf personal heating elements were installed at different locations in the dwelling (Figure 1). The residents were allowed to control and move the elements during the experiment to improve their thermal comfort. Firstly, three infrared heating panels of 350 W (Redwell WE-Line) were installed, of which two panels were placed on a large tripod in the living room and one panel on a small tripod in the bathroom. A power switch for the power plug of the infrared panels was installed to turn them on and off, but their power could not be controlled. Secondly, the residents in the living room were provided with two heated blankets (130 cm × 180 cm) with a maximum power of 120 W (Medisana HDW) controlled by a remote controller with four heating levels. Thirdly, four heated cushions (30 cm × 40 cm) with a maximum power of 100 W (beurer HK-35) were provided in several locations, i.e., the dining table, the kitchen table and the desk. Similar to the blankets, the cushions can be controlled by a remote with three heating levels. Finally, two heated floor mats (40 cm × 50 cm) with a maximum power of 20 W were added to the heated cushions to ensure thermal comfort at the residents’ feet. Table 3 shows an overview of the maximum power of the different personal heating systems.

2.3. Evaluation Methods

2.3.1. Survey

During the experiment, the residents were asked to evaluate their thermal sensation and thermal comfort through a two-minute, “right-here-right-now” smartphone survey [46]. They were asked to fill in the survey when staying at one of the standstill locations for a longer time and performing an activity, with a minimum of one response per day, e.g., when they watched television or while cooking. Consequently, the number of responses depends on the number and the type of activities the residents performed during the experimental period.
The survey asked about the thermal sensation as well as the thermal comfort of the residents. For the thermal sensation, the commonly used 7-point ASHRAE scale from cold to hot was used, and the thermal comfort was asked by a 6-point Likert scale from very uncomfortable to very comfortable.
A total of eight questions was asked each time in the following order (Table 4):
The clothing level was defined as very light clothing (t-shirt and shorts), light clothing (t-shirt and trousers), casual clothing (light sweater and trousers), heavy clothing (thick sweater and trousers) and an additional blanket. In addition to the questions of the survey, the time of response was automatically registered.

2.3.2. Diary

Because the resident only evaluates his/her thermal comfort at certain times (“right-here-right-now” survey when staying at a standstill location for a longer period of time), the survey data do not provide any insight into the residents’ thermal comfort while circulating in the building, other inconveniences or the reason behind a particular behavior that could not be noted in the survey. Therefore, in addition, the residents were asked to write their general experiences and comments in a diary at the end of each day.

2.3.3. Energy and Temperature Loggers

The indoor temperature of each room of the three dwellings was measured every 15 min with a hobo u12-012 data logger. The dataloggers were placed close to the standstill locations at the height of the residents, e.g., on the coffee table in the living room. For the outdoor temperature, monthly average temperature values, measured by the Royal Meteorological Institute of Belgium measured in the city of Ukkel [47], are used, because measurements with data loggers are less accurate.
Multiple energy loggers (Profile 194670369) were installed to measure the energy consumption of the different personal heating systems during the experiment. When multiple personal heating elements were used simultaneously in one place, such as a heated cushion in combination with a heated floor mat at the desk, the total energy consumption of the combination of elements was measured. The energy consumption of the radiation panels was measured separately.
Additionally, the total gas consumption for heating in dwelling 3 was measured by making use of the installed gas meter. It was not possible to measure the energy consumption of the traditional heating system to a sufficiently detailed level for dwelling 1 and dwelling 2.

2.4. Statistical Data Analysis

In this research, several parameters are evaluated. For the outdoor temperature, monthly average values are used as provided by the Royal Meteorological Institute of Belgium [47].
For the indoor ambient temperature, average values are calculated for the main rooms of the three dwellings for the reference period (Ref.) and for the period of the experiment with personal heating systems (Exp.). For each period, distinction is made between the average temperature for the entire period, including measured temperatures during inoccupancy and night setback, and the average temperature during occupation. The average temperature for the entire period is used for calculations of the energy-saving potential. The average temperature during occupation is used to interpret the “right-here-right-now” thermal comfort survey results. Results can be found in Section 3.1.
The thermal sensation and thermal comfort votes were analyzed based on the number of votes. For each point of the Likert scale, the percentage of votes is calculated compared to the total number of votes. Both the results per individual resident as well as the average results for all residents are given. To avoid a dominant effect of the votes of residents who voted more often than others, the average thermal sensation and thermal comfort is calculated as a weighted average of all residents. Results are presented in Section 3.3. No further statistical analysis was done on the data since the limited number of participants and the limited dataset does not allow for statistical significance estimations.
The energy-saving potential is calculated by normalizing the measured actual heating energy consumption in dwelling 3 by the method of heating degree days [48]. Based on the average number of heating degree days from the last ten years in Belgium, the yearly energy consumption can be calculated. The energy savings are quantified by subtracting the energy consumption of the personal heating systems from the energy savings obtained by lowering the ambient temperature. The yearly consumption of the personal heating systems is calculated by the measured energy consumption during an average heating period in Belgium.

2.5. Limitations of This Research

Limitations of this first investigation of personal heating practices in a residential context show challenges for future research. As in this study, only a small number of Flemish residents between 25 and 30 years old were involved; additional research for other age groups and in other climatic or cultural contexts is needed since perceptions and preferences are age-dependent and diverse for every climate and culture [49]. The experiment only lasted for a relatively short period during winter due to the need for heating, and so long-term experiments should be considered in the future. Additionally, all dwellings involved in this research did not comply with the current building standards. Investigating the application of personal heating in new high-performance buildings as a complementary heating practice might show additional benefits.

3. Results

3.1. Environment

3.1.1. Outdoor Temperature

The outdoor temperature in the winter period of 2019–2020 was higher than in an average Belgian winter. Table 5 shows the monthly average and the monthly maximum and minimum outdoor temperature. The monthly mean temperature varied between 5.9 °C in January and 7 °C in February.

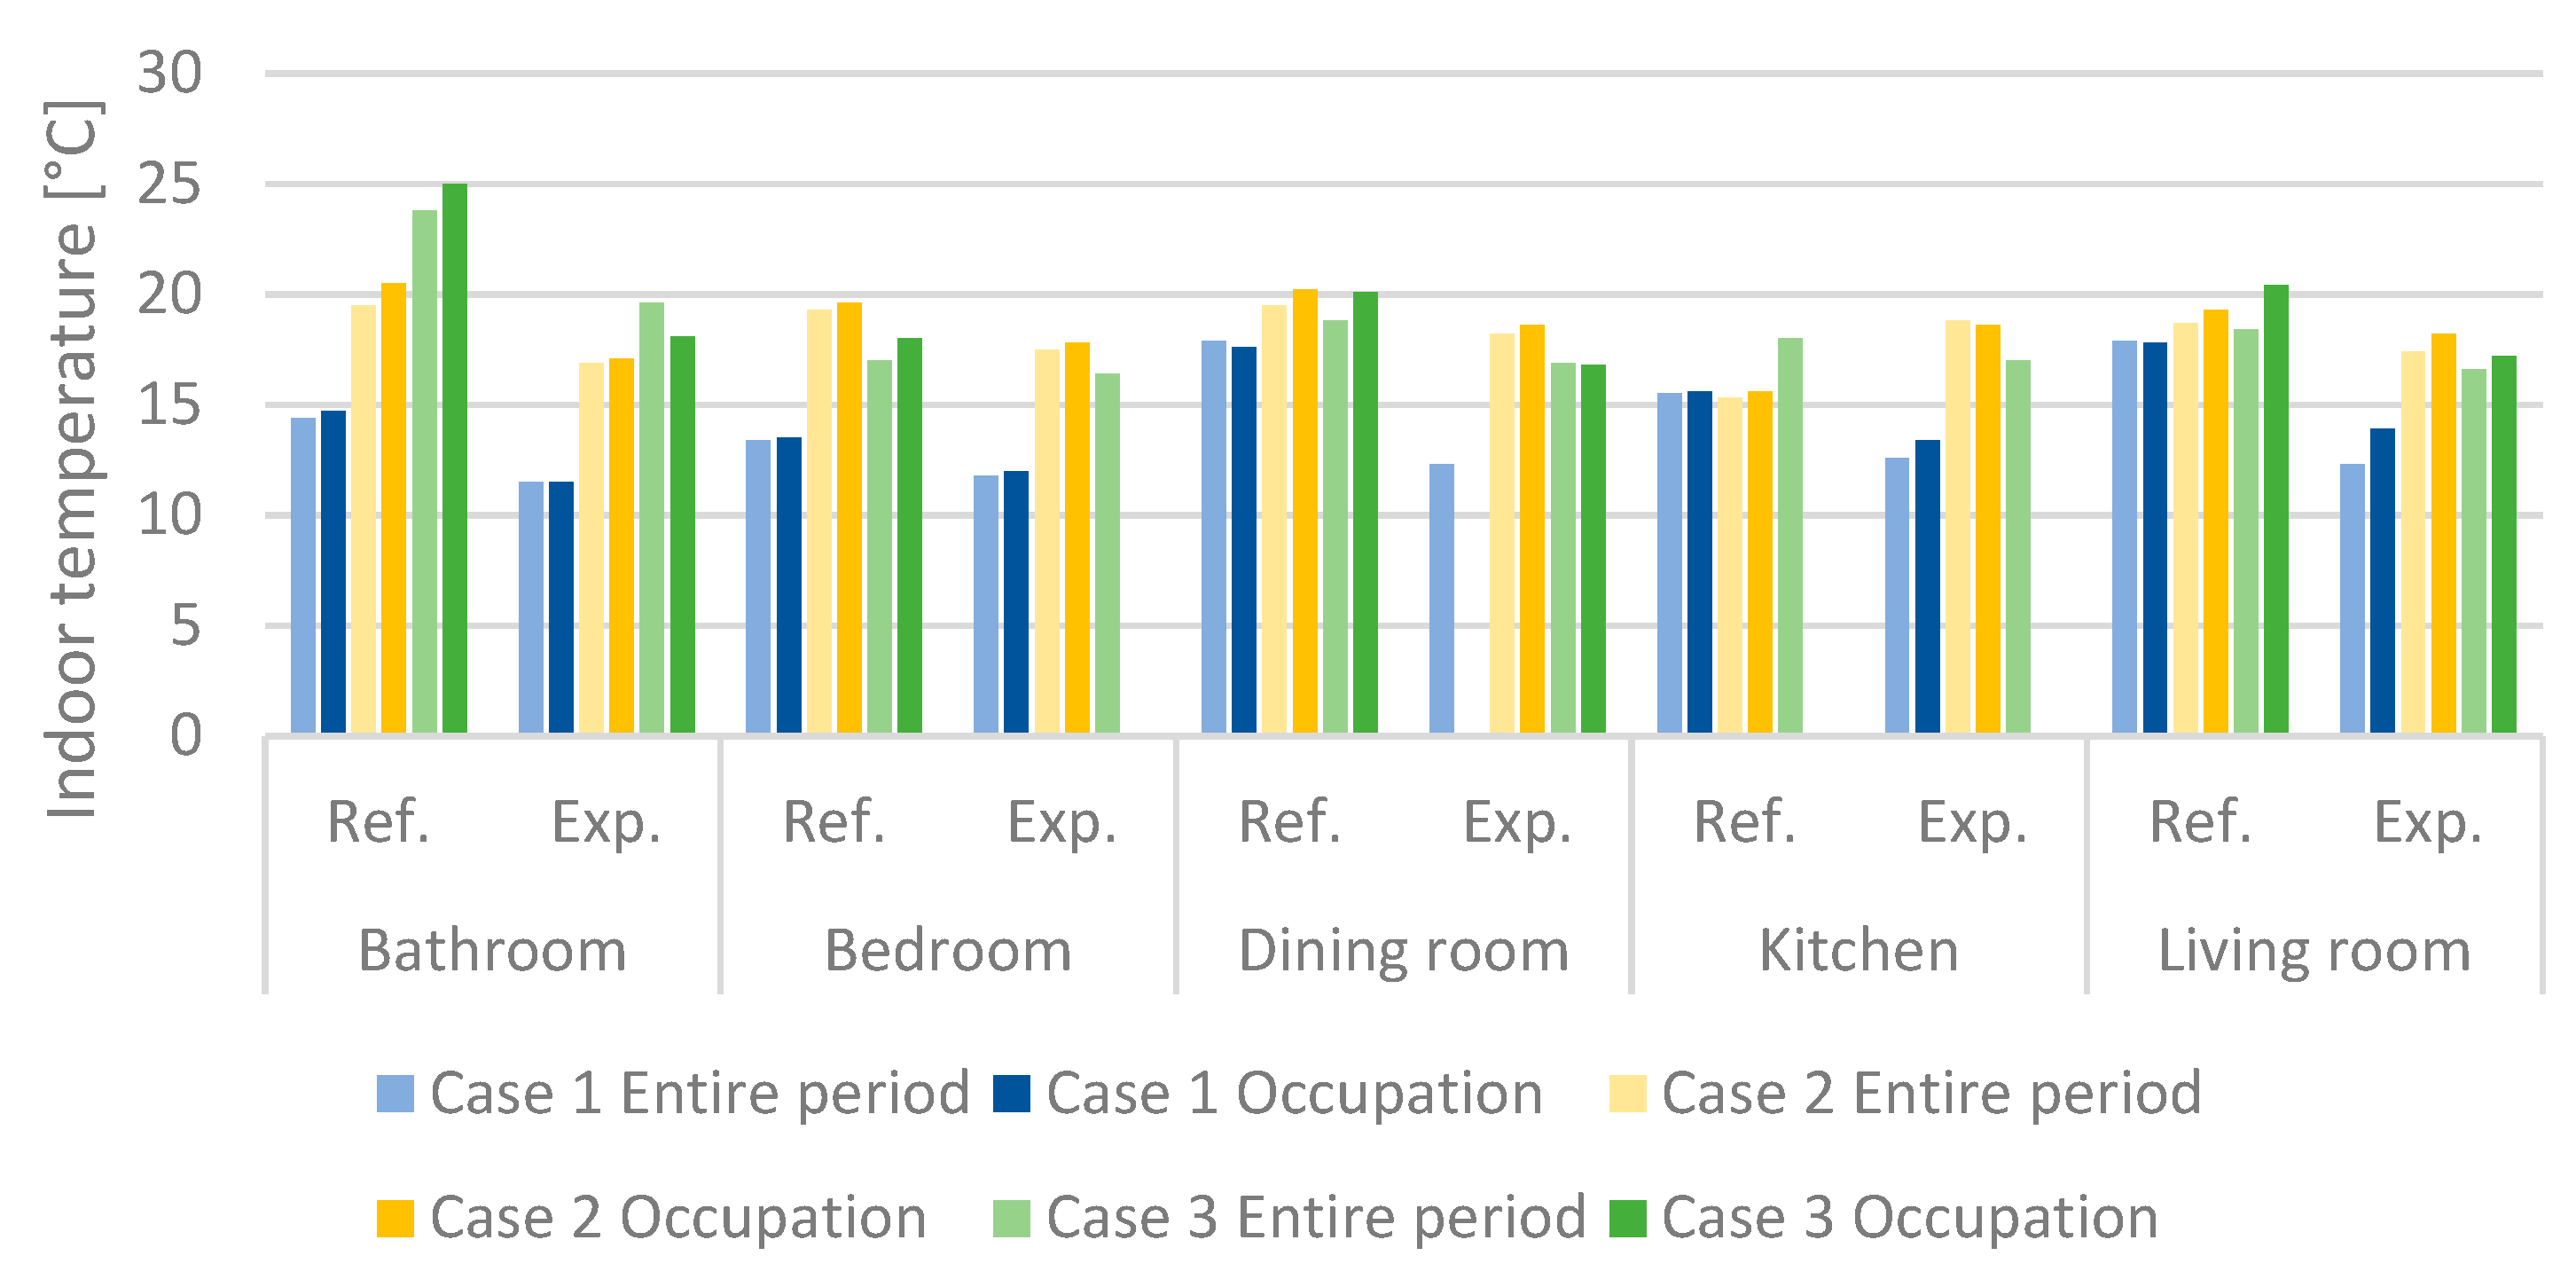
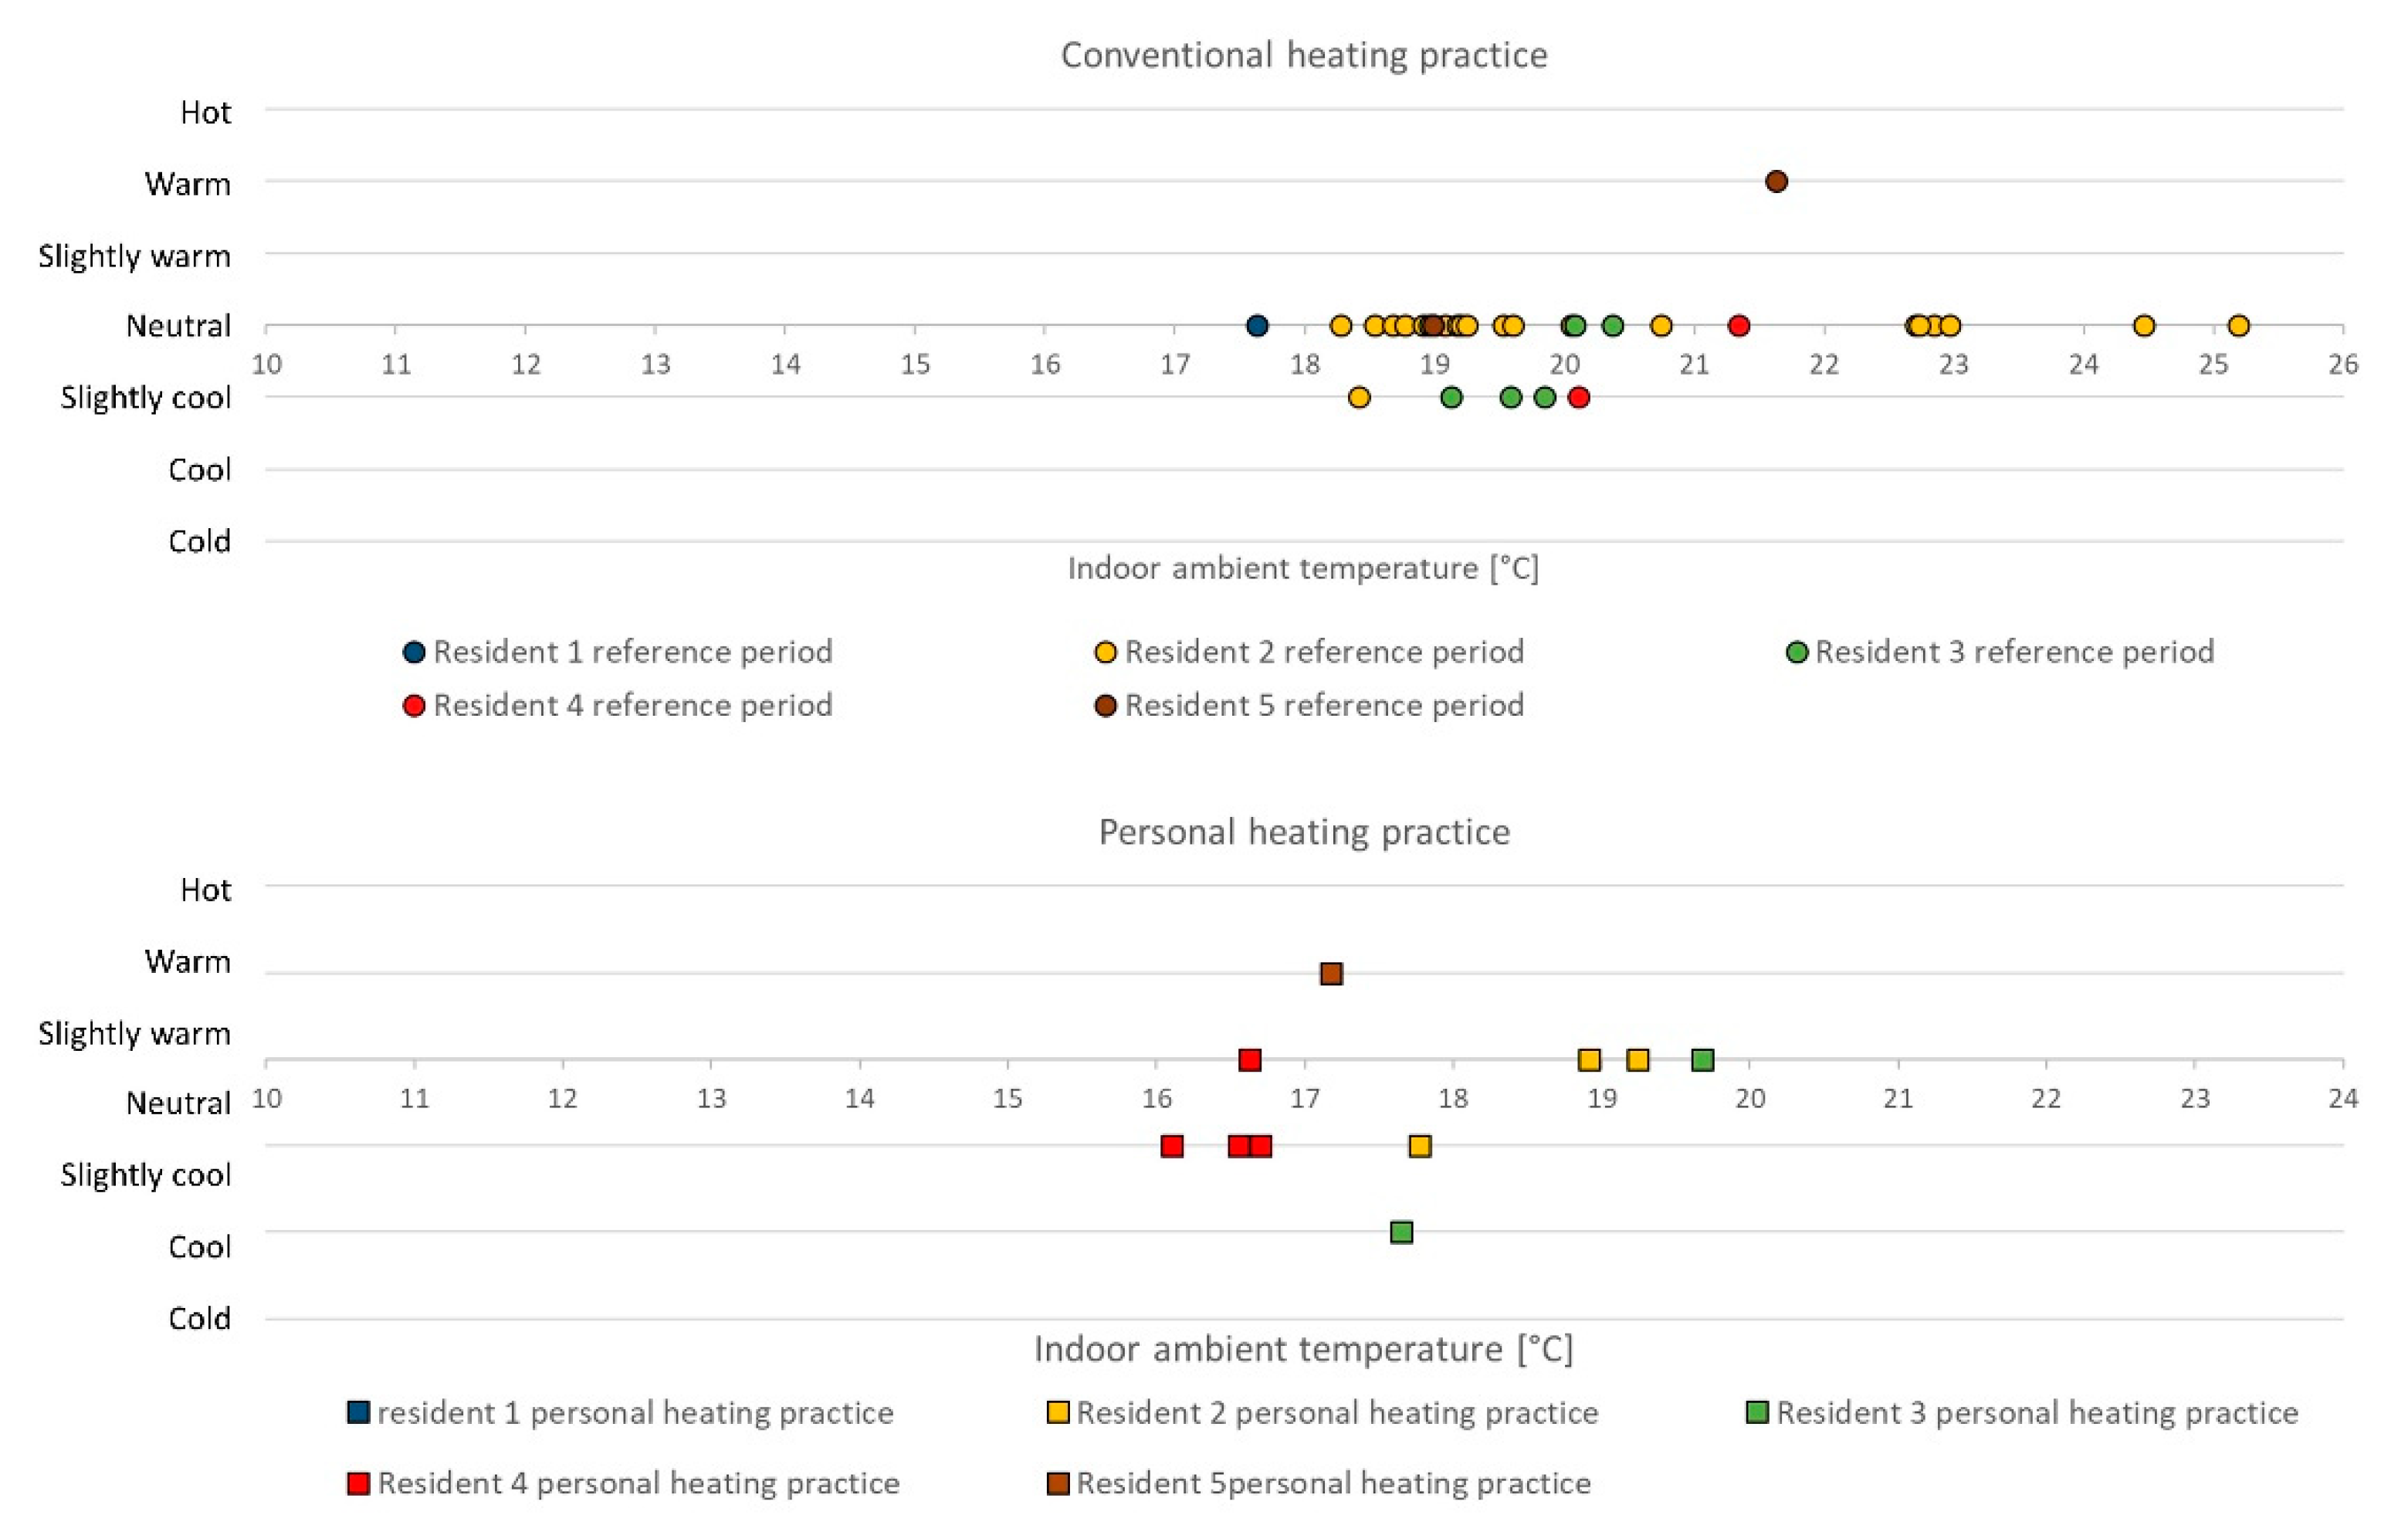
3.1.2. Indoor Temperature

Although residents were asked to lower the indoor temperature to 18 °C, Figure 2 shows that the actual temperature varied over time and across different dwellings. In dwelling 1 (blue bars in Figure 2), the temperature during the experiment was very low due to the limitations of the installed electric accumulation and electric convection heaters, but it appeared that the temperature during the reference period was also lower than in an average dwelling. At the moment of responding to the survey questions (Occupation), the average temperature in dwelling 1 was 15.8 °C during the reference period with the common heating practice and 12.7 °C during the experiment with the personal heating systems. The resident of dwelling 1 did not use the dining room during the experiment, causing a no information on the temperature during occupation in the dining room. In dwelling 2 (yellow bars in Figure 2), the average occupancy temperature was 19.4 °C during the reference period and ±18.6 °C during the experiment. In dwelling 3 (green bars in Figure 2), the average occupancy temperature during the reference period was 20.8 °C and 17.4 °C during the experiment. The residents of dwelling 3 did not evaluate their thermal comfort in the kitchen, causing no information on the temperature in this room during occupation.

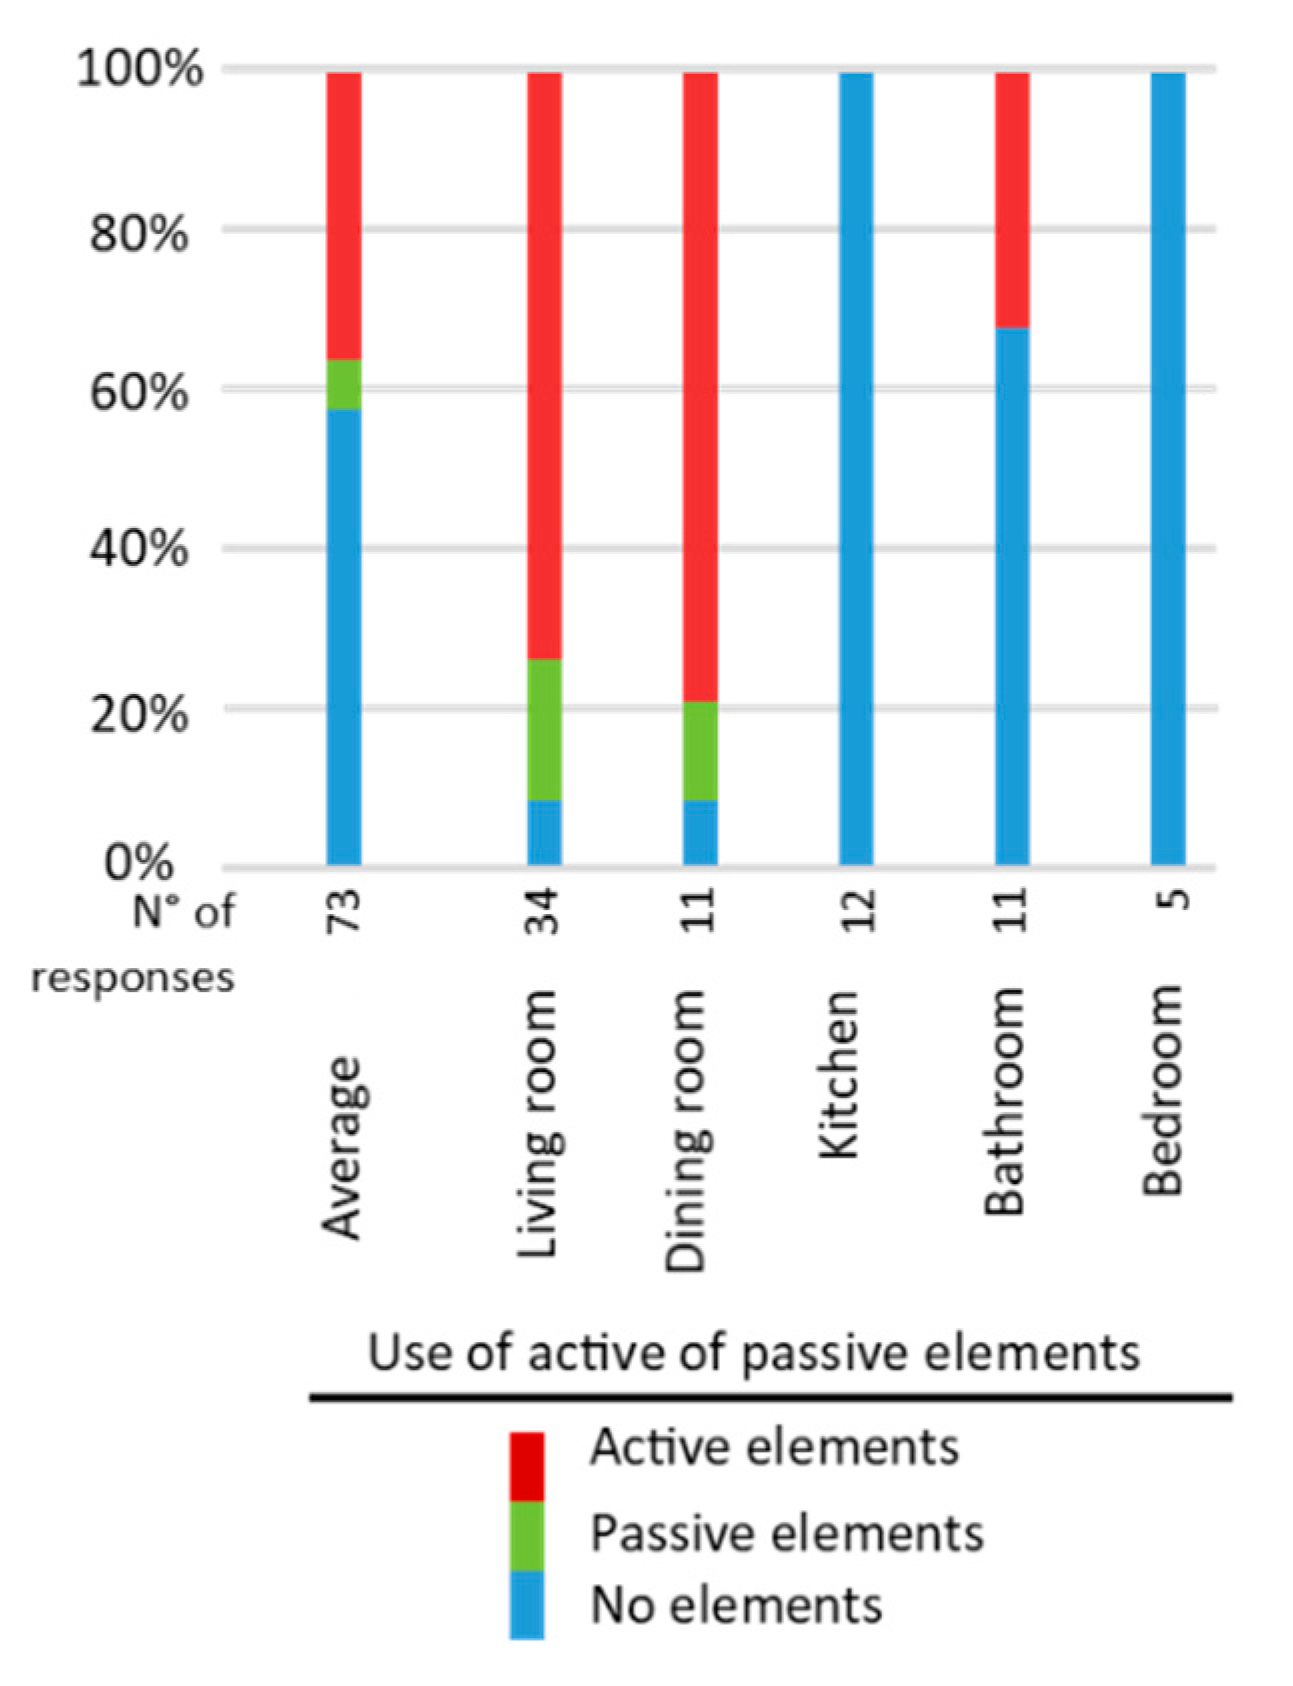
3.2. Diaries on the Personal Heating Practice

During the experiment, the residents noted their experience toward thermal comfort with the personal heating practice in a diary on a daily basis. Overall, the residents experienced the personal heating practice as comfortable despite the lower indoor temperature. However, the residents did not always use the personal heating system since, sometimes, they only stayed for a short period of time, especially in the morning, at specific locations, such as the bathroom or the kitchen table. Most of the residents noted that they did not use personal heating in the bathrooms, because it required a certain period of time to achieve the maximum radiation temperature. Resident 5 did use personal heating in the bathroom, but she stated that she turned it on before entering the bathroom in order to experience the maximum temperature when entering the room.
Some residents also noted that they were uncomfortable due to cold hands while working at their computer.
In the evening, the residents used the personal heating systems more often. During these moments, the residents were mostly comfortable with the personal heating practice. Despite the lower temperature, the residents did not experience discomfort while circulating through their dwellings. However, one resident noted that she experienced a cold and uncomfortable feeling when she entered a cold house. The different residents also noted that they preferred one system above the other. The analysis of the diaries shows that residents 1, 4, and 5 preferred the heated blanket above the radiation panel, whereas residents 2 and 3 preferred to use the radiation panel instead of the heated blanket.
Since this research made use of off-the-shelf systems, because its focus was on evaluating the heating practice and not on the evaluation of the systems themselves, residents experienced some issues with the systems, themselves. A first comment was the required power cables to feed the elements, which were perceived as disturbing in everyday life and not practical to use. With regard to the heated blanket, the heating wires were noticeable and disturbed one of the residents. Additionally, the control of the heated blanket was not precise enough to provide the desired amount of heat for thermal comfort. Some residents, especially resident 2, mentioned that level 1 was already too warm, while others used the maximum level during some moments. In real-life applications, the personal heating systems themselves can be further developed, but this is outside the scope of this research.

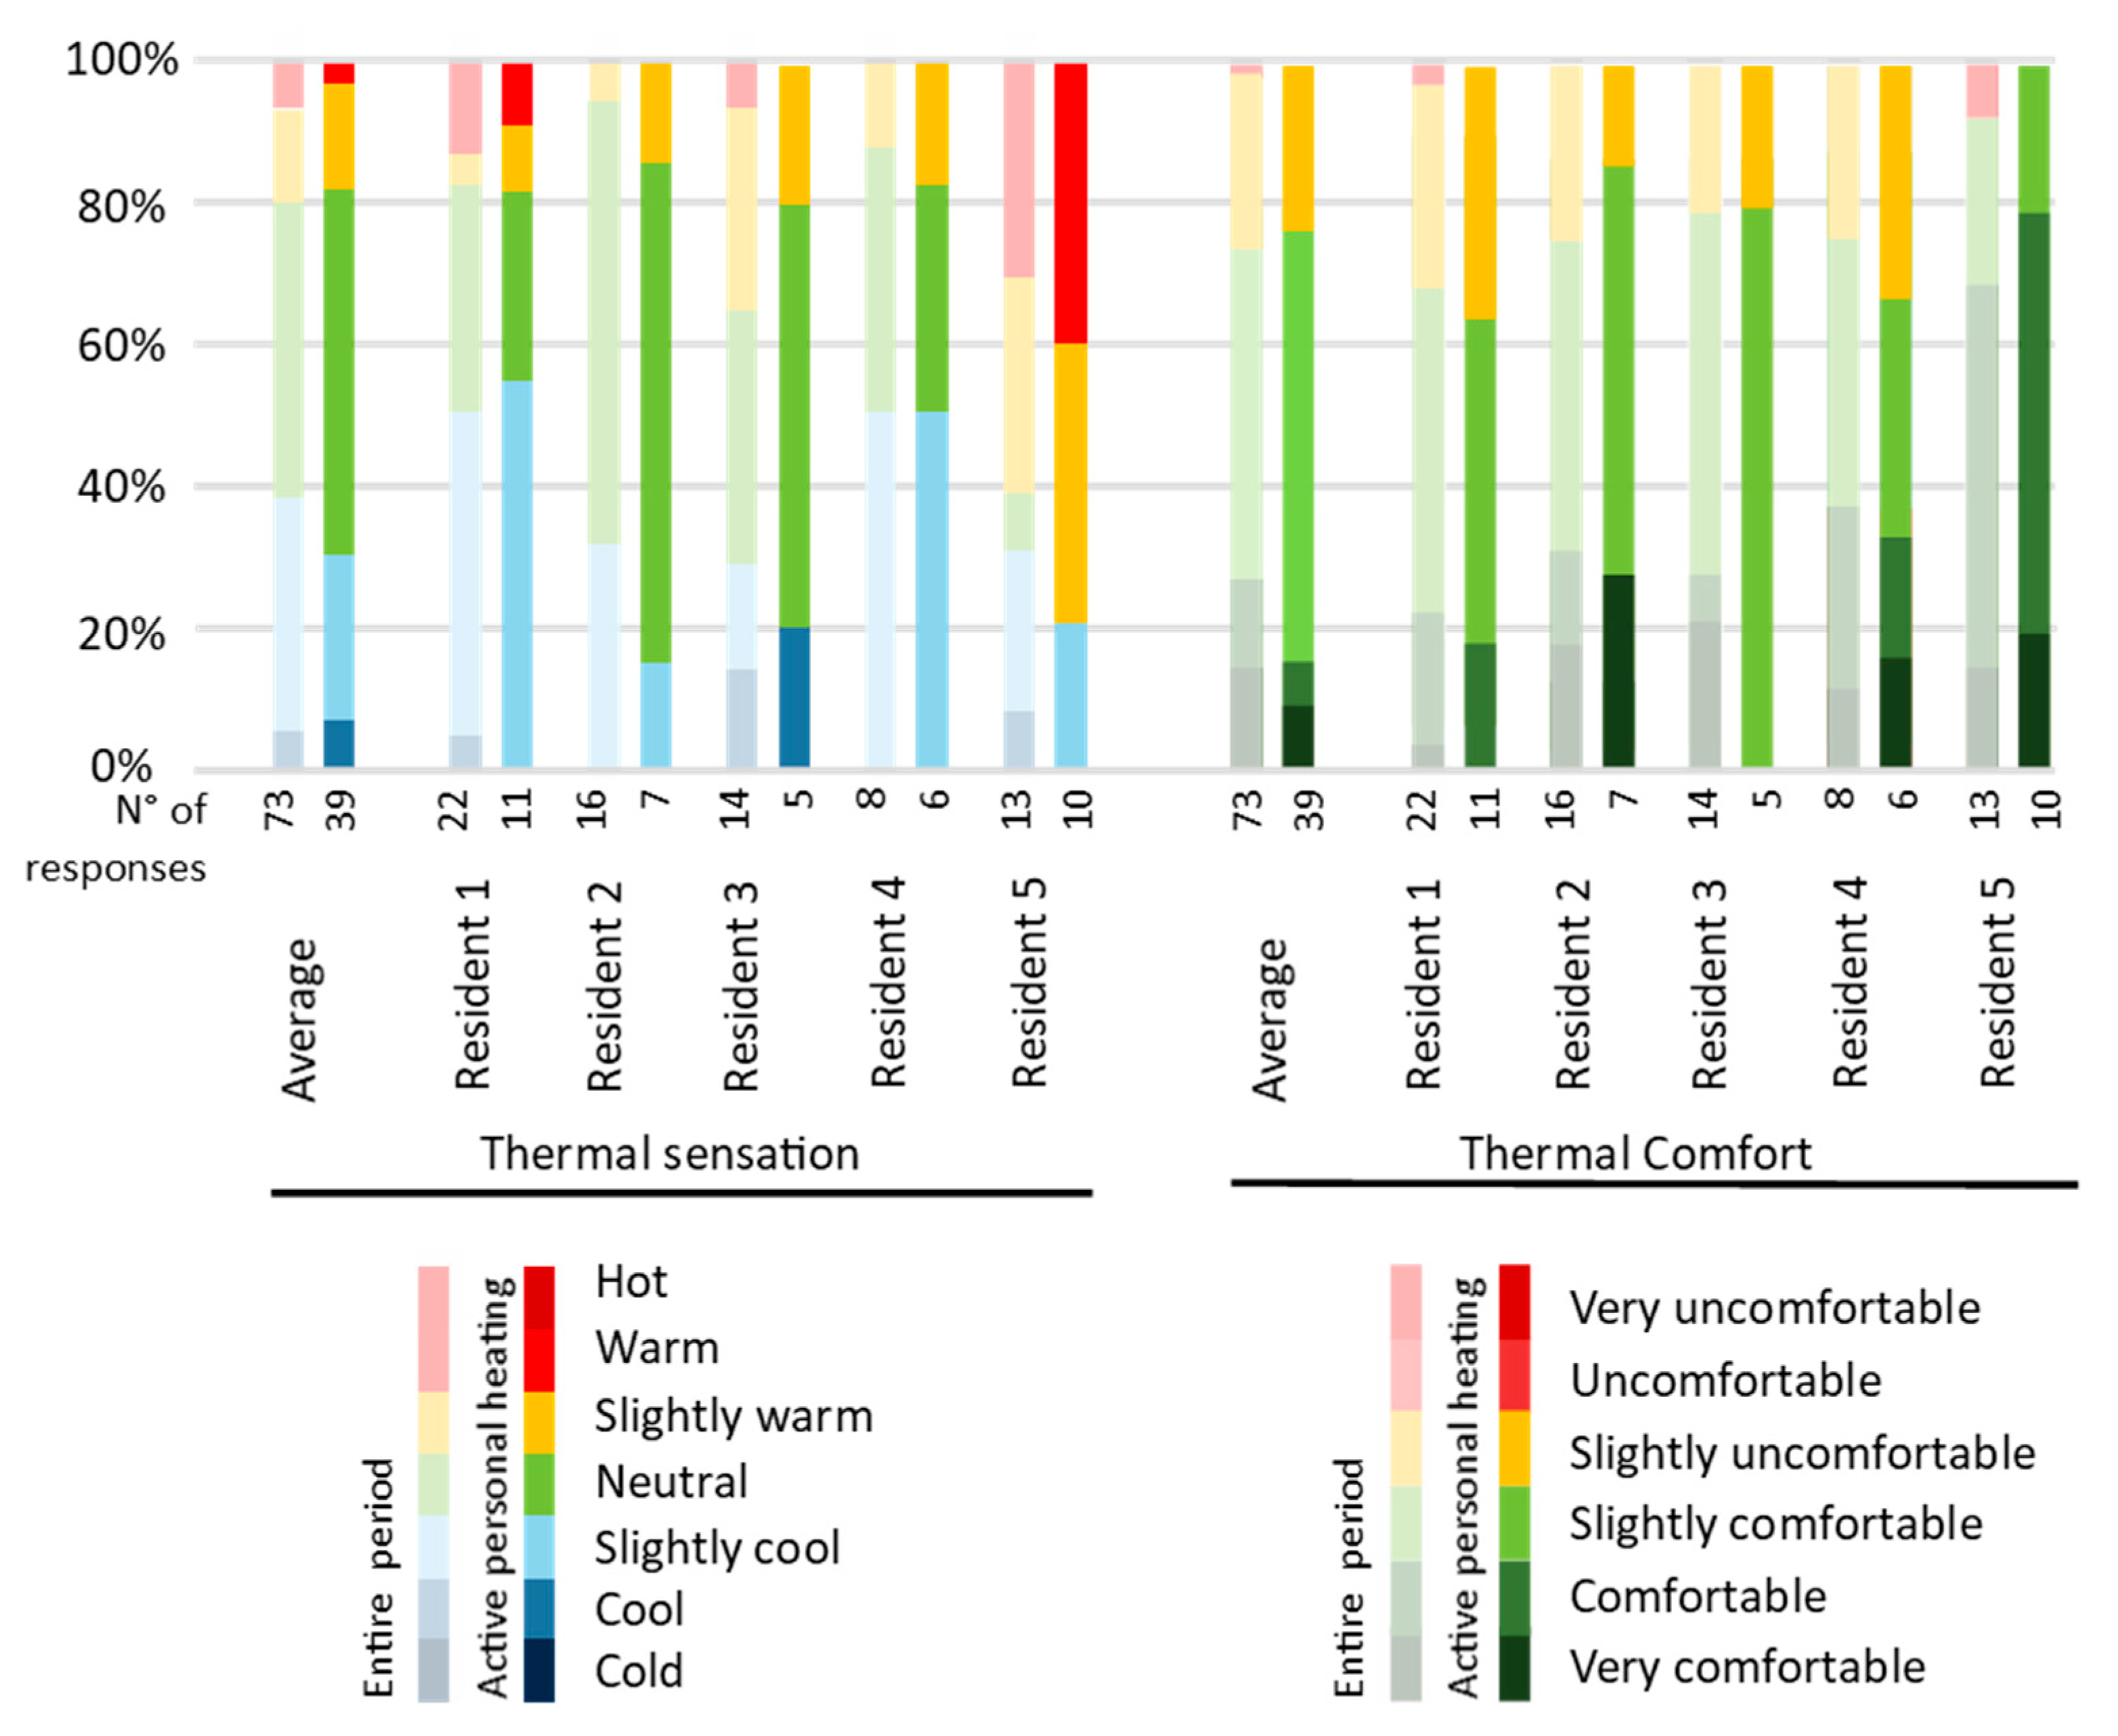
3.3. Thermal Comfort Results Collected by the “Right Here Right Now” Survey

During the experimental period, residents were asked to evaluate the personal heating practice by a “right-here-right-now” survey. A total of 73 answers was collected by the five residents involved in this experiment. In Figure 3, the reported thermal sensation and thermal comfort are presented during the periods when the residents made use of active personal heating systems (dark bars) as well as during the entire experiment when they stayed at a specific location for a longer period of time (making use of a personal heating system or not, light bars).
With regard to thermal sensation during the entire period (Figure 3, left, light bars), despite the lower indoor temperature in the dwellings, residents felt, on average 63% of the time, “neutral” (43%) or “warmer than neutral” (20%). In 36% of the answers, residents reported feeling “cooler than neutral”, of which only four times did they report feeling “cool” (6%). With regard to thermal comfort (Figure 3, right, light bars), it appears that, on average in 74% of their answers, the residents felt “slightly comfortable” or even “very comfortable”. More specifically, the residents felt “slightly comfortable” (46%), “comfortable” (13%) or “very comfortable” (15%). For 25% of the answers, residents felt “slightly uncomfortable”, and only in 3% (two times in total) of the answers did the residents evaluate the indoor environment as “uncomfortable”. A lower thermal sensation was mainly found in the dining room and the bathroom, whereas a lower thermal comfort was mainly found in the dining room and the bedroom.
However, the residents did not always make use of the personal heating systems, depending on the location and due to several reasons, such as slow response, no need during the short occupation time or because they were comfortable without active personal heating systems. Active personal heating systems were primarily used in the living (75%) and dining room (79%). In the kitchen and the bedroom, no elements were used, and in the bathroom, only resident 5 made extensively use of the active personal heating (Figure 4).
The thermal sensation and thermal comfort when the residents made use of the active personal heating systems are also presented in Figure 3 (dark bars). While using active personal heating systems, 39 responses were collected. The average thermal sensation while using active personal heating systems slightly increased (Figure 3, left, dark bars). At 70% of the answers, residents felt “neutral” (53%) or “warmer than neutral” (27%), and in 30%, the residents felt “slightly cool” (23%) or “cool” (7%). With regard to thermal comfort (Figure 3, right, dark bars), the residents reported at 76% of the answers to be “slightly comfortable” or higher, and 24% of the answers, “slightly uncomfortable”. More specifically, residents reported 61% of the answers as “slightly comfortable”, 6% as “comfortable” and even 10% as “very comfortable”.
In general, it can be found that residents were (slightly) comfortable with the indoor climate during most of the situations and that the active personal heating systems had a positive effect on their thermal sensation and thermal comfort. However, differences can be found between the different residents and different rooms. Therefore, the results of the individual rooms are discussed more in detail in the following subsections. First, the thermal sensation and thermal comfort of the room during the whole experiment are discussed, followed by the discussion of the thermal sensation and thermal comfort while making use of the provided active personal heating elements. Subsequently, the reported thermal sensation of each individual resident while making use of active personal heating is compared with the thermal sensation reported during the reference period. Additionally, the underlying reason why residents did not use the active personal heating elements is discussed based on the data from their diaries.

3.3.1. Living Room

Thermal Sensation and Thermal Comfort in the Living Room during the Entire Experimental Period

In the living room, residents generally spent their time on the couch for activities such as watching television or eating. During the entire experiment in the living room, resident 1 wore very light clothing in 40% of the answers and casual clothing in 60% of the answers. The clothing level of resident 2 varied between light clothing (25%), casual clothing (25%), heavy clothing (25%) and clothing with an additional blanket (25%). Resident 3 wore light clothing (20%), casual clothing (20%), 20% heavy clothing and 40% clothing with an additional blanket. Resident 4 wore 66% very light clothing and one of the three times an additional blanket in the living room. The clothing level of resident 5 varied between light clothing (15%), casual clothing (50%) and clothing with an additional blanket 30%.
During the experiment, the residents quoted their thermal sensation in the living room most times as “neutral” (48%) or “higher than neutral” (27%), and 25% found it “cooler than neutral” (voted as “slightly cool” and once as “cool”) (Figure 5). The residents experienced the indoor climate mostly as “slightly comfortable” (43%) or “comfortable or higher” (42%). Only 15% of the time, the residents experienced it “slightly uncomfortable” (12%) or “uncomfortable” (3%). The lower thermal sensation and lower comfort can mainly be assigned to three residents: resident 1, living in dwelling 1 with a much lower ambient temperature (Figure 2), resident 5, and resident 2, who did not always use an active personal heating element.

Thermal Sensation and Thermal Comfort in the Living Room While Making Use of Active Personal Heating Elements

In the living room, during 68% of the answers, the residents used the heated blanket(s), the infrared panels or a combination of them. No large differences were found between the residents, except resident 1, who used it more often (90%). Resident 1 mostly used a combination of the radiation panel (80% of the time) and the heated blanket (90%), while residents 2 and 3 used the radiation panel more often (40% and 66%) than the heated blanket (20% and 33%). Residents 4 and 5 only evaluated their thermal comfort while using the heated blanket.
According to the diary of the residents, the main reason for not using the heating element is that they did not experience a cold feeling due to a previous activity, such as cooking, showering or entering the dwelling from outside, or were using a passive element such as an additional blanket.
When residents used the heating elements, they wore mostly light or casual clothing, except resident 4, who wore very light clothing. During the active personal heating, they quoted their thermal sensation in 45% of the time as “neutral”, 35% “warmer than neutral” and, in 20%, “cooler than neutral” (Figure 5). Similar to the thermal sensation, the thermal comfort was quoted higher when using a personal heating element: 52% “slightly comfortable”, 42% “comfortable or higher” and only 6% “slightly uncomfortable”, which is related to a cooler thermal sensation. The lower thermal sensation and thermal comfort while using personal heating are only experienced by resident 1, living in the dwelling with a low ambient temperature.
Figure 6 compares the reported thermal sensation during the common heating practice without personal heating and during the experiment when the temperature is reduced, and the residents made use of active personal heating. During the reference period, resident 1 wore similar clothing as during the experiment. However, he used an additional blanket more often. Most of the time, residents 2, 3 and 4 wore heavier clothing during the reference period than during the experiment (respectively, heavy clothing, casual clothing and casual clothing). Resident 5 mostly used an additional blanket during the reference period.
As shown in Figure 6, the residents felt mostly neutral during the conventional heating practice (reference period) at temperatures between 17 and 21 °C. During the experiment, the indoor temperature ranged from below 16 °C to 19.2 °C. It can be concluded that, many times, the residents felt “cooler than neutral” when the temperature was below 16 °C. A temperature above 17 °C mostly resulted in a thermal sensation above “neutral”. The lower indoor temperatures can be related to resident 1.
As such, it can be found that the thermal sensation when using personal heating elements at a temperature between 17 °C to 19 °C is comparable and even higher than the common heating practice at a temperature above 20 °C. Moreover, on average, the residents wore heavier clothing during the reference period. However, there seems to be a lower limit to the base temperature in the dwelling to make it possible to create a thermal comfortable environment with additional personal heating elements.
During the survey, residents were asked if they experienced local discomfort. The residents noted that local discomfort was mainly experienced due to colder hands, feet or face (nose). Sometimes, they experienced a bit too warm feet or legs due to the heated blanket as local discomfort, although this did not result in overall discomfort.
According to the diary, the residents experienced the provided personal heating elements differently. Residents 1, 4 and 5 experienced the heated blanket as an element that provided the most comfort since it is very instant, while residents 2 and 3 experienced the infrared heating thermally more comfortable since the heat was more spread and was less direct than the heated blanket. Residents 2 and 3 experienced the heated blanket sometimes as too warm. They also noted that their hands were the most difficult to heat.

3.3.2. Dining Room

Thermal Sensation and Thermal Comfort in the Dining Room during the Entire Experimental Period

In the dining room, residents spent most of their time at the dining table for two different activities: for eating or for working at the computer. Resident 1 did not use the dining room during the entire experimental period. Resident 2 wore light (33%), casual (33%) and heavy clothing (33%) during the experiment. Resident 3 only wore heavy clothing, while resident 4 only wore casual clothing during the experiment at the dining table. Resident 5 wore mostly casual clothing (75%), and once she wore an additional blanket (25%). In combination with the clothing level, the indoor climate in the dining room was, half of the time, experienced as “slightly cool” (52% of the time), 35% of the time as “neutral” and 13% of the time as “warmer than neutral” (Figure 7). The residents experienced the indoor climate at 42% of the time “slightly uncomfortable”, 46% of the time “slightly comfortable” and once as “comfortable”. The thermal sensation results are valid for all residents, except resident 1, who did not use or evaluate his comfort in the dining room. The thermal comfort of resident 5 deviates from that of the other residents, but this is mainly linked to her activity at this location, i.e., only eating. While eating, the residents sometimes experienced a “slightly cool” environment, but they still were “slightly comfortable” with the situation. On the other hand, when the residents used this place to work, they were more likely to experience it as “slightly uncomfortable”.

3.3.3. Thermal Sensation and Thermal Comfort in the Dining Room While Making Use of Active Personal Heating Elements

Almost 80% of the time, the residents used the provided active personal heating systems at the dining table, i.e., the heated cushions or sometimes the infrared panels. No significant differences are found between the residents; however, resident 2 used the radiation panels during the days at the dining table. While using active personal heating at the dining table, the residents wore casual or heavy clothing. The overall thermal sensation during these moments was voted 44% of the time as “slightly cool”, 31% as “neutral” and 25% as “warmer than neutral” (Figure 7). The thermal comfort of the residents was voted as 38% “slightly uncomfortable”, 38% “slightly comfortable” and 25% of the time as “comfortable”. The lower thermal sensation and comfort can mainly be related to working at the dining table. This corresponds to the need for personal heating elements that was noticed by some of the residents. Some residents moved the infrared panels to the dining table while working on their computer to increase their thermal comfort. Despite the active personal heating systems, local discomfort was often experienced at the hands and feet while working at the dining table.
In Figure 8, a comparison is made between the reported thermal sensation during the conventional heating practice without personal heating (reference period) and during the experiment while using active personal heating. During the reference period, the residents wore similar clothing as during the experimental study; however, resident 3 and 5 used an additional blanket more often. During the reference period, the thermal sensation was mainly voted as “neutral” at indoor temperatures between 17.6 °C and 25.2 °C. It can be found that the personal heating systems did not always succeed in providing a “neutral” thermal sensation to the residents at temperatures below 18 °C. At temperatures above 18 °C, the environment was experienced as “neutral”; however, only limited responses were registered. The lower thermal sensation is related to working at the computer.
In the dining room, the residents often experienced local discomfort at their hands and feet, especially while working at the computer. Therefore, residents 2 and 3 moved the infrared panels from the living room to the dining room. One of the residents also noted that the heated floor mat created an unpleasant feeling at his feet.

3.3.4. Kitchen

Kitchen Worktop

At the kitchen worktop, mainly used for activities such as cooking, no personal heating systems were placed or used. According to the predicted mean vote [50], the higher activity level is enough to reach a “neutral” thermal sensation at 18 °C. Although only seven responses were collected at the kitchen worktop, results show that one resident once felt “slightly cool”, residents voted the indoor climate four times as “neutral” and two times as “warmer than neutral”. During all these moments, the residents felt three times “slightly comfortable”, three times “comfortable” and once very comfortable.
No significant difference can be found between the thermal sensations at the kitchen worktop when the overall temperature was decreased compared to the thermal sensation at the reference temperature.

Kitchen Table

The kitchen table was only used by residents 2 and 3, which resulted in only five responses. Additionally, residents did not use an active personal heating element during the experiment at the kitchen table. The residents noted that they did not use the personal heating elements, because they used the place only for a short period. A slightly lower thermal sensation can be noticed at the kitchen table during the experiment compared to the reference period, which is a logical consequence since no personal heating systems were used.

3.3.5. Bathroom

In the bathroom, a total of 11 responses were collected; however, only during six times was the personal heating system used, mainly by resident 5 (five times). This fact resulted in a “slightly cool” (63%) and “warmer than neutral” (38%) (only by resident 5) thermal sensation. Despite the lower thermal sensation, residents experienced it mostly as “slightly comfortable” (50%) or as “comfortable or higher” (38%) and 12% as “slightly uncomfortable”.
The personal heating element (radiation panel) in the bathroom was mainly used by resident 5. The other residents did not use it, since they used the bathroom only for a short time. According to their diary, they found it not useful to use the radiation panel or found that the panel’s response time was too slow, which ranges between 3–5 min to reach the maximum radiation temperature. The fact that the residents did not use the radiation panel or the radiation panel did not reach the maximum temperature is one of the reasons for the cooler thermal sensation in the bathroom. Resident 5 used the radiation panel in the bathroom, but she also turned it on before entering the bathroom to experience the maximum radiation temperature when entering the room.

3.4. Energy-Saving Potential

The energy-saving potential of a personal heating practice can be determined by the reduction of the overall heating setpoint of the common heating system, while adding personal heating to ensure or even increase the thermal comfort experience of the residents (simulated in Figure 9). More specifically, reducing the setpoint of the current heating practice will typically result in a lower energy consumption and also in a lower thermal sensation of the resident. With a small additional amount of energy, the thermal sensation can be improved to neutral by using personal heating. In order to save as much energy as possible, the current setpoint should be lowered as much as possible, making sure thermal comfort can still be achieved. As demonstrated in Section 4.3, at an indoor air temperature around 17 or 18 °C, thermal comfort can be ensured both at standstill locations by using personal heating as well as during circulation through the dwelling when no personal heating can be used. The energy consumption of the personal heating systems should be as low as possible.

3.4.1. Energy Consumption of the Personal Heating Systems during the Experiment

The total energy consumption was measured on each standstill location during the experiment by an energy logger (a separation was made between the radiation panels and the conductive heating elements). The energy consumption depends on the operating time and the settings on the controller. Table 6 shows the combined maximum power and the actual energy consumption at each standstill location in the different dwellings during the experiment. It was found that the energy consumption of the personal heating systems was the highest in the living room (1 kWh/day), which is in line with the occupancy patterns, especially when residents do not work at home. In the living room, the largest share of energy was consumed by the infrared panels (0.8 kWh/day). At the dining table, the residents of dwellings 2 and 3 used a variety of personal heating systems. The residents of dwelling 2 moved the infrared panels from the living room to the dining room for one day when they worked at home. An average energy consumption of 0.09 kWh was used each day in the dining room. As already noted, no personal heating systems were used in the kitchen. In the bathroom, only in dwelling 3, one resident made extensively use of the provided infrared panel. However, the radiation panel used only 0.06 kWh per day since the time spent in the bathroom was relatively short.
On average, based on all three cases involved in the experiment, the personal heating systems consumed 1.10 kWh per day. A comparison of the measured energy consumption of the different systems shows that the infrared panels consumed much more energy than the conductional heating elements.

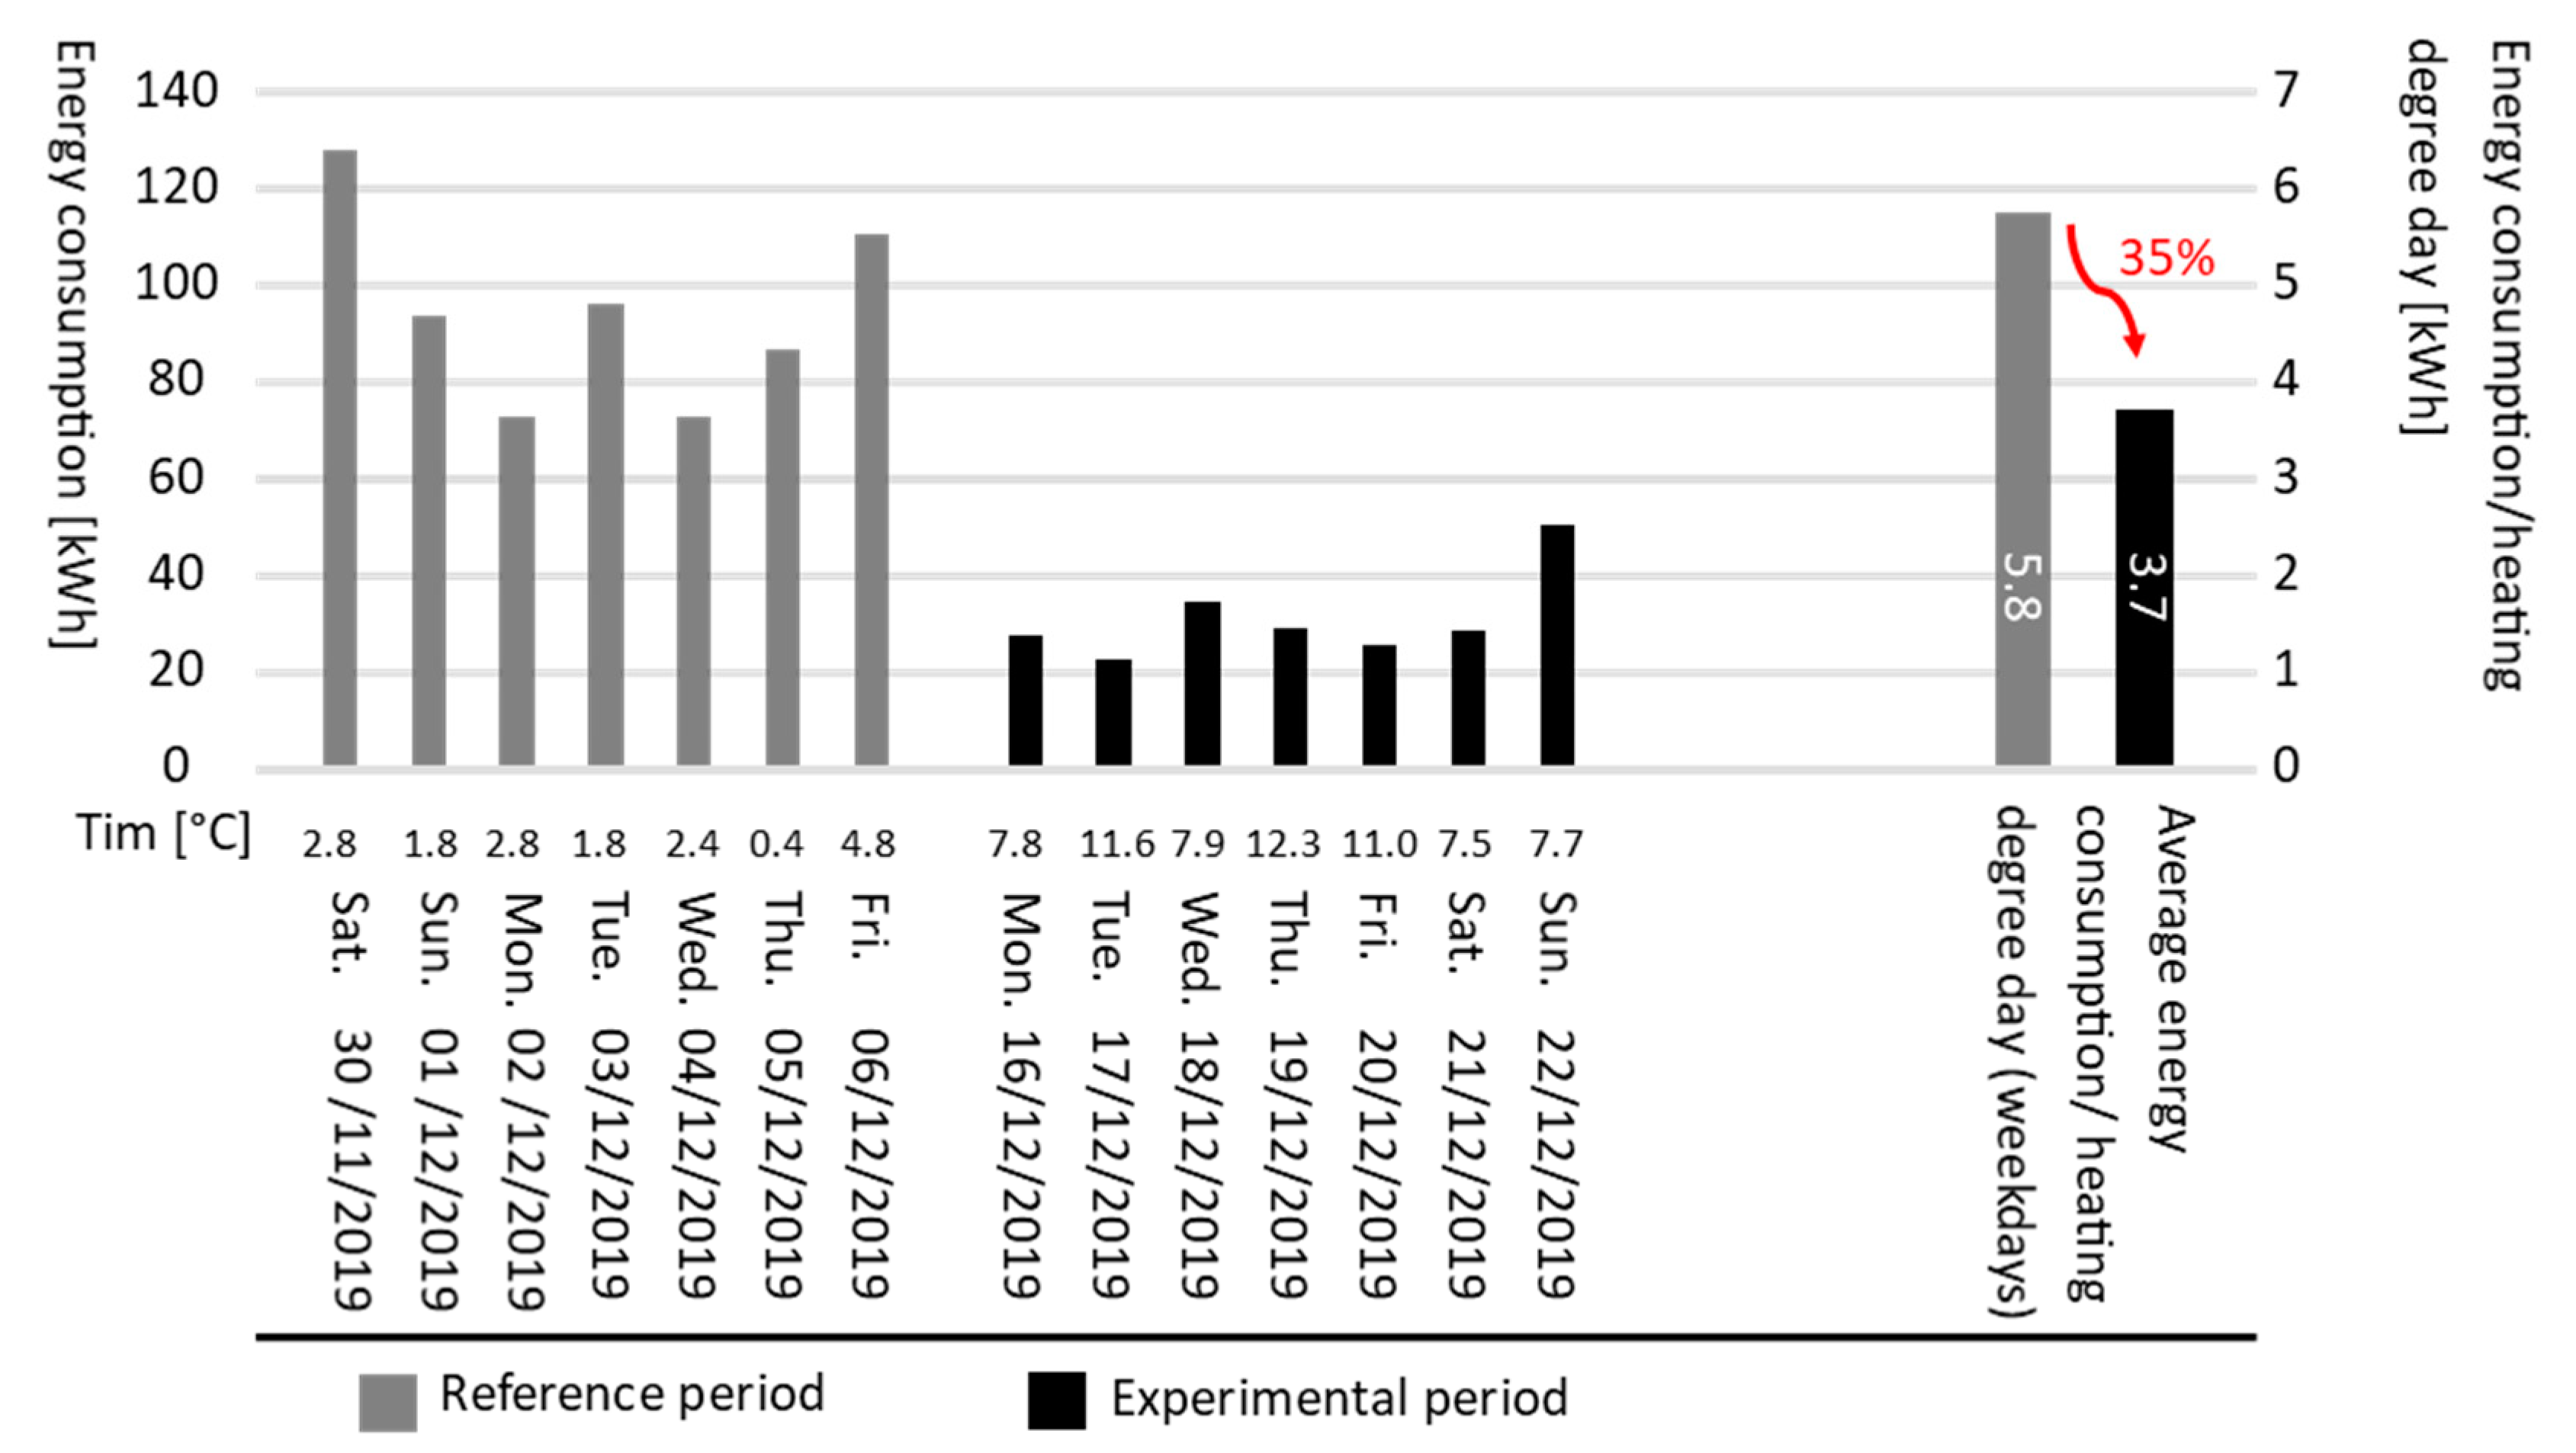
3.4.2. Energy Savings by Reducing the Heating Set-Point

Energy savings by the personal heating practice are realized by the reduction of the overall air temperature. Studies [51,52,53] have shown that lowering the ambient temperature in dwellings during the winter period from 21 °C to 19 °C can save 23% to 35% of the heating energy, depending on the outdoor climate and the energy performance of the dwelling. Generally, by lowering the heating setpoint by one degree, between 6–10% of the heating energy can be saved [23,54,55]. In the case of lowering the indoor temperature from 21 °C to 18 °C, theoretically, 18% to 30% of the heating energy can be saved. However, these energy savings do not include the energy consumption of personal heating systems.
In order to quantify the energy savings when lowering the ambient temperature in the case study research, the heating energy consumption of the gas boiler was measured in dwelling 3 during the reference period and during the experiment while implementing personal heating. Although the actual energy savings largely depend on the building characteristics and the outdoor climate, this case study research gives an indication of the energy savings that could be achieved. Dwelling 3 is only partially insulated (roof and two facades); it is provided with double glazing and has single glazing at the front facade, which is not insulated. The dwelling is heated by a condensing boiler, controlled by a single thermostat and radiators with thermostatic valves placed in every room. The dwelling has a simulated EPC value of 283 kWh/m2year. During the reference period, the indoor temperature was set at 21 °C, meaning that the house was heated to 21 °C according to the program (6h30–7h30 and 17h30–22h00 during weekdays and 8h30–23h00 during the weekend) and set back to 17 °C in the other periods. The radiators were set to the maximum except in the bedroom, where they were set to the minimum (anti-frost).
The actual energy consumption measured in dwelling 3 includes heating and domestic hot water production, which remains the same for the reference period and the experimental period. Therefore, the energy consumption for domestic hot water, which is, on average, 20% of the yearly energy consumption [56], is subtracted from the actual energy consumption (±6.9 kWh/day in dwelling 3). The actual heating energy consumption of each day from dwelling 3 is visualized in Figure 10, including the corresponding outdoor temperature, which fluctuates every day.
It can be found that 5.8 kWh/heating degree day of energy was used during the reference week, and 3.7 kWh/heating degree day was used during the experimental week (Figure 10). As a result, the total heating energy consumption was reduced by 35% by lowering the comfort temperature to 18 °C.
Since the calculation of heating degree days is based on an average indoor temperature of 18 °C, the energy savings by reducing the indoor temperature are probably underestimated. Therefore, the heating degree days could be corrected by lowering the average indoor temperature in dwelling 3 to 16.8 °C during the experiment. In addition, the base temperature when heating is required could be lowered.

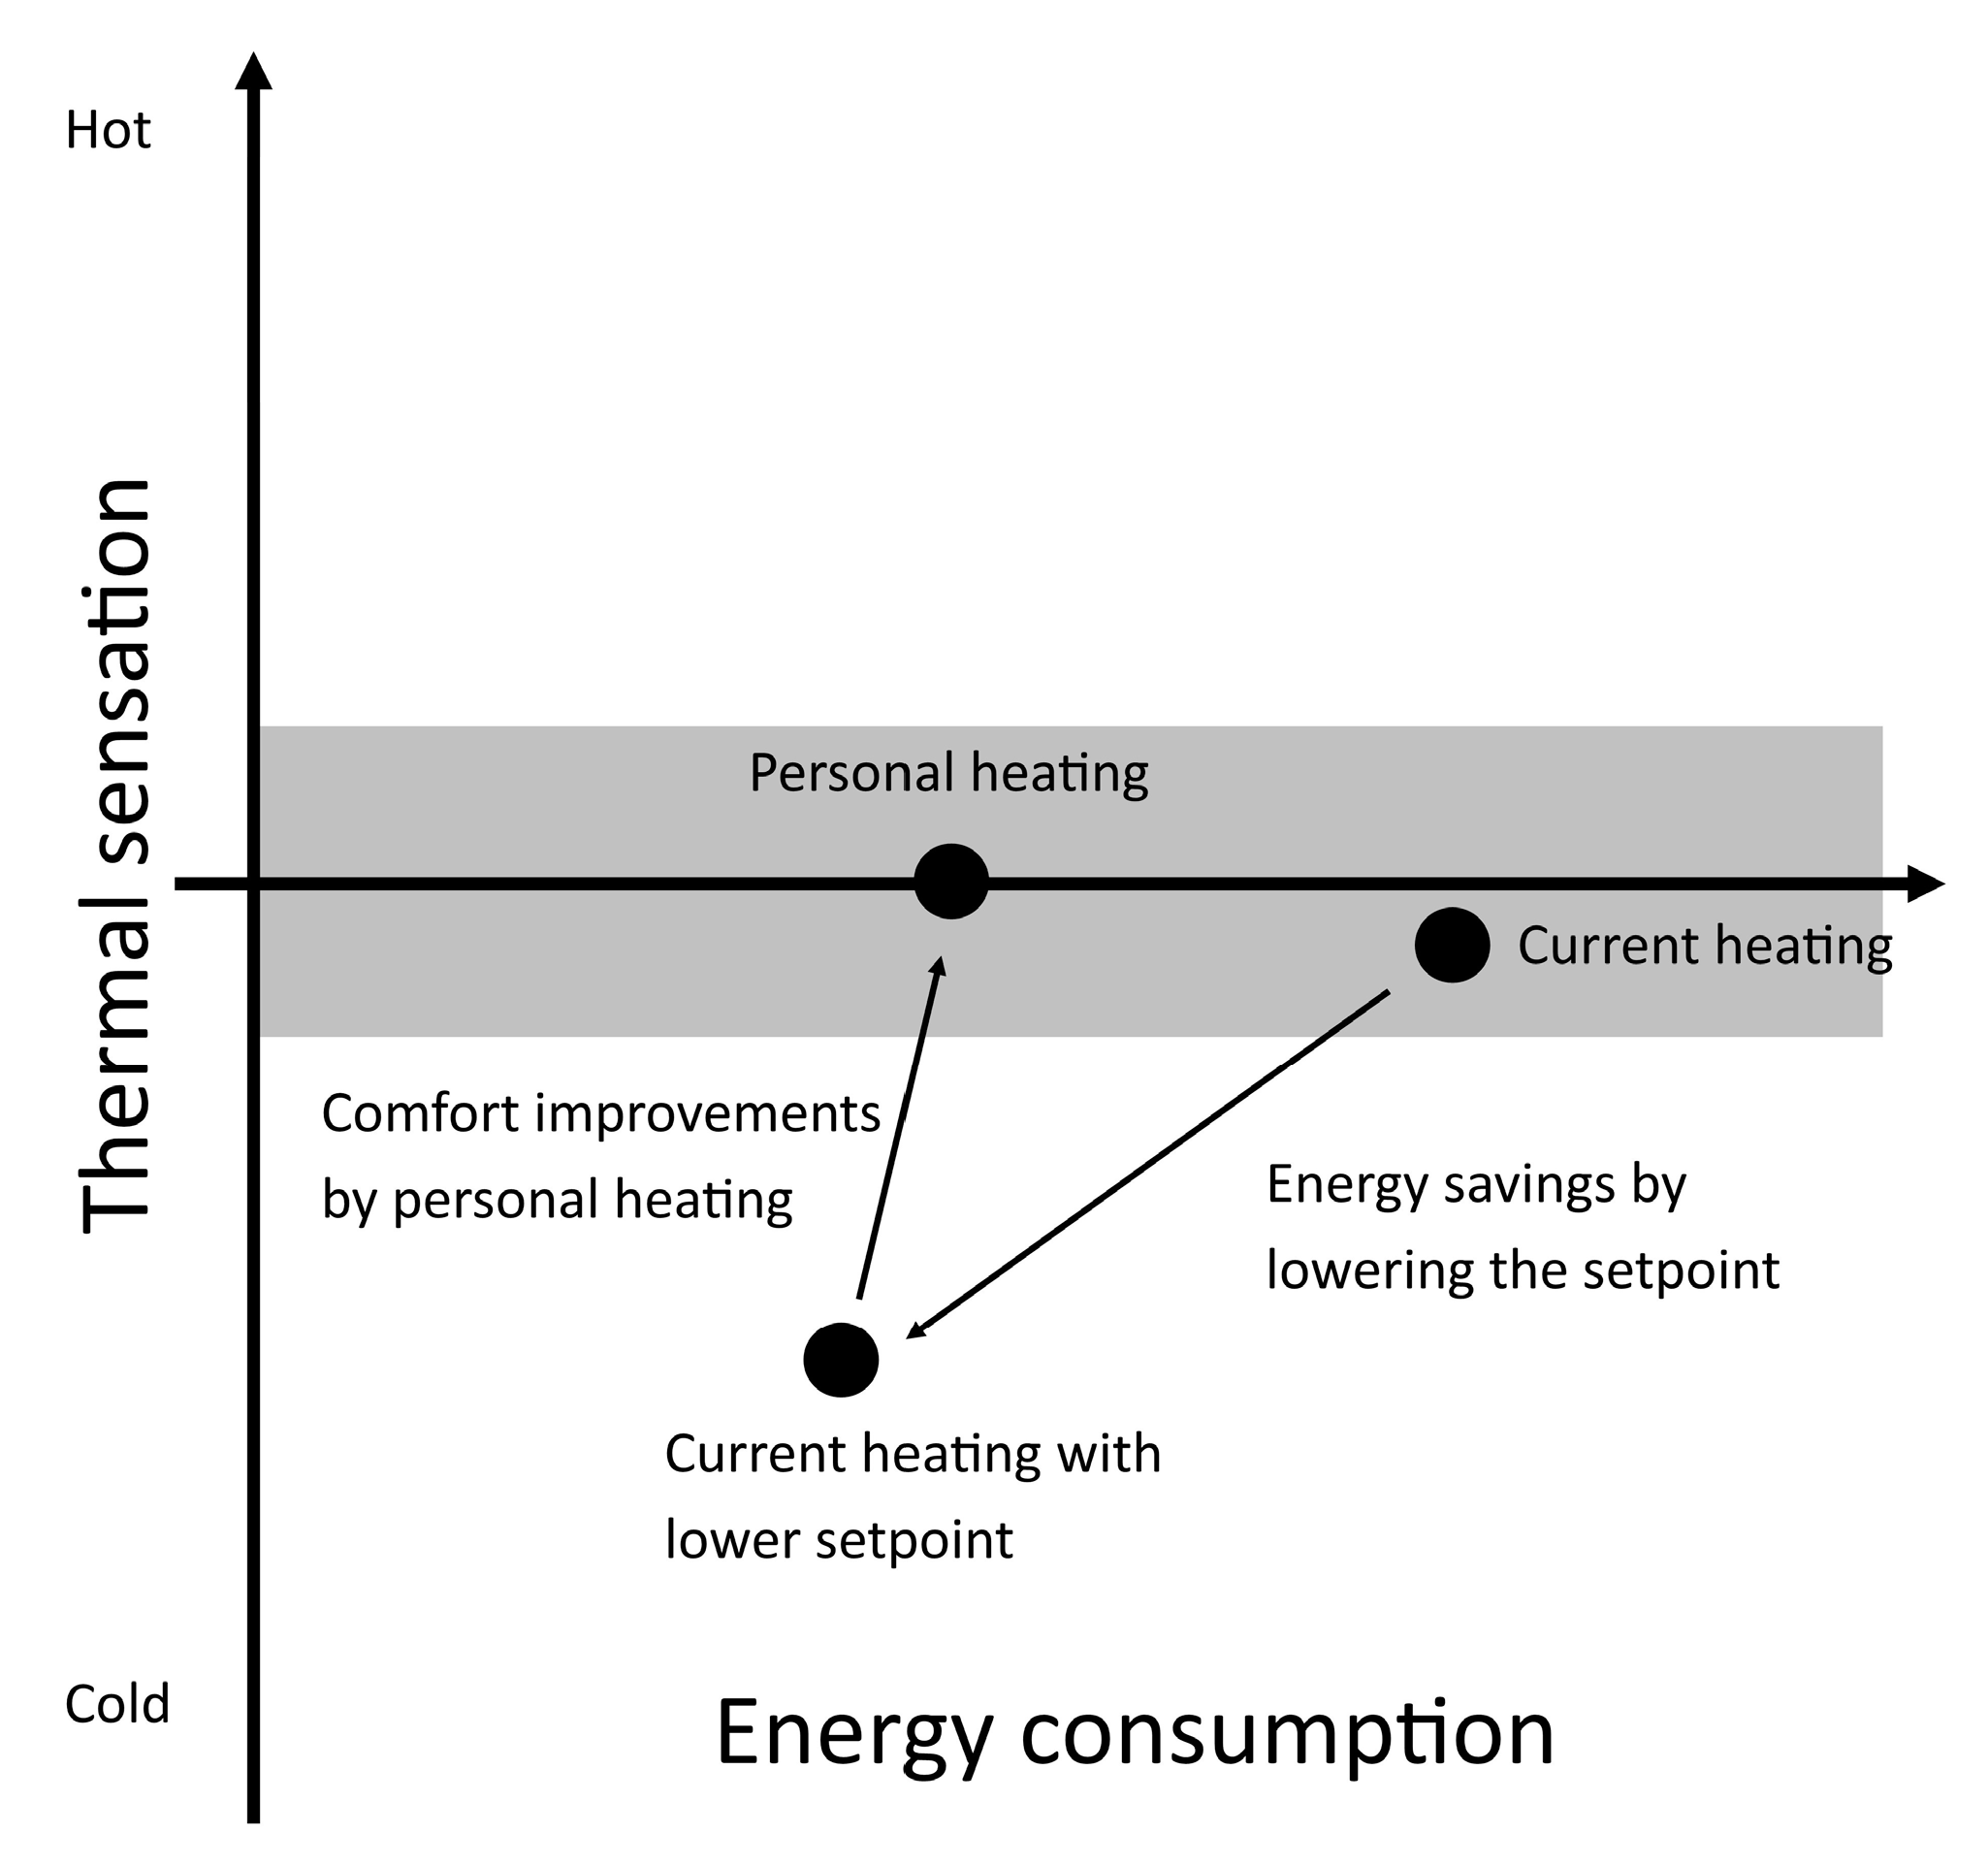
3.4.3. Energy-Saving Potential of a Personal Heating Practice

To estimate the net energy savings of a personal heating practice, the additional energy consumption of the personal heating systems should be considered. In Belgium, there were 2581 heating degree days on average per year during the past 10 years. Based on the energy consumption measured in dwelling 3, 14,890 kWh would be used by the common heating practice, and 9623 kWh would be consumed when the indoor temperature is reduced. The energy consumption of the personal heating system can be calculated based on 1.1 kWh/day during the heating season, which is in Belgium from September till May (242 days), resulting in 266 kWh of energy consumed by the personal heating systems per year. Taking the energy consumption of the personal heating systems into account, an energy saving of 34% could be reached.
The measured energy savings in the experiment correspond with the calculated energy savings found in literature. Humphreys et al. [19] estimated the energy savings in a residential context in Edinburgh to 33% by calculating the difference in degree days, when the room temperature would be reduced from 20 °C to 15 °C and personal heating is provided. They assumed the personal heating would use 20% of the estimated energy difference, which they noted as perhaps an over-estimation. Zhang et al. [28] simulated energy savings in an office building with three stories and dimensions of 90 × 60 m when extending the temperature range to 18 °C and found energy savings between 32% and 65%, depending on the outdoor climate. In addition, they found that the personal heating elements used less than 3% of the HVAC energy consumption. Verhaart et al. [53] modeled the energy-saving potential of personal heating based on several studies. Based on Zhangs’ building model (three stories—90 × 60 m), he found that 35% of the HVAC energy could be saved by reducing the heating setpoint from 21.5 °C to 18 °C. One percent of these savings was used to compensate the residents’ thermal comfort with personal heating systems, mainly conductive-based systems, which results in 34% of energy consumption savings during winter. Based on energy simulations, Foda et al. [32] estimated the energy saving potential of localized floor heating in a shopping mall and found that 17% of the annual energy could be saved when the indoor temperature was reduced to 18 °C.

4. Discussion

4.1. Evaluation of Personal Heating with Regard to Thermal Comfort

Despite several limitations, such as the limited number of dwellings involved during a limited period of time and the use of off-the-shelf systems, this research showed that a personal heating practice has the potential to provide thermal comfort to residents, while reducing the energy consumption significantly. In the living room, the potential is already very high, as residents were comfortable in 94% of the situations, even when using available off-the-shelf systems. In the dining room, discomfort was mainly experienced while working at the computer. Residents reported mainly local discomfort at their hands or feet. Therefore, additional personal heating systems could be installed and evaluated. However, the optimization of the systems is out of the scope of this research. When additional personal heating systems are installed, the energy consumption increases, which results in lower energy savings. However, a study on effective spatial use in dwellings [15,16] showed that the time spent in the dining room working on the computer is limited, especially compared to the time spent in the living room. In addition, the moments spent working at home are usually limited to a few days of the week. In the bathroom, the response time of the radiant panel was too long, so residents did not use the system. Only resident 5, who turned on the panel a few minutes before entering the room, experienced the maximum radiation. At the kitchen worktop, the residents did not need any personal heating systems due to the activity level and the heat produced by appliances such as the cooking plate. At the kitchen table, the residents did not use the provided elements.
The controls of the off-the-shelf systems were not accurate enough, which was considered a limitation and can probably have a negative effect on the thermal comfort of the residents during the experiment. Improved controls should be investigated, as research has shown that individual control is a crucial factor in the performance of personal heating systems [25,28]. Vesely et al. [44] reviewed several studies on the thermal comfort and energy performance of personal conditioning systems and concluded that individual control is beneficial with respect to thermal comfort. However, individual control is highly dependent on user behavior and can also lead to reduced comfort or increased energy consumption.
The personal heating systems used in this study were all grid-powered to allow measurement of the energy consumption, but this required power cables to the various personal heating systems. These power cables were reported as disturbing, negatively affecting the overall experience and use of the systems, e.g., at the kitchen table. Portable battery-powered systems, such as heated pillows or blankets, could provide opportunities to improve the user-friendliness of personal heating. Alternatively, personal heating systems could be integrated into furniture or the building, such as a heated couch or integrated infrared heating panels. The potential for thermal comfort of improved and more user-friendly personal heating systems should be investigated in further research over a longer period of time.
It was also found that some of the residents were sometimes comfortable by using passive personal heating by means of a regular blanket or just by adapting their clothing level (e.g., in the living room with a regular blanket or in the kitchen by wearing slippers). O’Brien and Gunay [57] found that clothing has a significant impact on residents’ thermal comfort. However, the exact temperature for thermal comfort by adjusting clothing depends on the residents’ preferences and the climatic region and culture.

4.2. Effective Thermal Sensation in Relation to the Predicted Mean Vote

Becker et al. [58] questioned the relationship between the actual thermal sensation and the calculated predicted mean vote according to Fangers’ PMV approach in 189 dwellings during the winter. They found that the actual thermal comfort votes were significantly higher than the predicted thermal sensation, which means that residents can be neutral at a lower temperature than the prescribed comfort temperature of 21 °C.
Figure 11 shows the relation between the effective thermal sensation votes and the predicted mean vote during the reference period and the active personal heating. Datapoints on the left of the reference line represent moments when the residents voted a higher thermal sensation than predicted, while datapoints on the right of the reference line represent a lower thermal sensation than predicted.
A comparison of the thermal sensation votes and the related predicted mean vote during the reference period in the case studies show that residents experienced the indoor climate many times warmer than predicted (Figure 11, left), especially when wearing very light clothing. However, when residents wore an additional blanket, the effective thermal sensation was lower than predicted.
Figure 11 (right) shows the relation between the thermal sensation experience while using active personal heating at the reduced temperature and the predicted mean vote with the lower indoor temperature. It can be found that the residents experience the indoor climate as mostly warmer than predicted, which can be related to the use of the active personal heating systems. However, two times, the residents voted their thermal sensation as lower than predicted by the PMV. During these moments, the residents wore heavy clothing while working at their computer in the dining room and used a heated cushion at their chair. This, again, shows that residents found it more difficult to reach their thermal comfort at a lower indoor temperature while working at the computer.

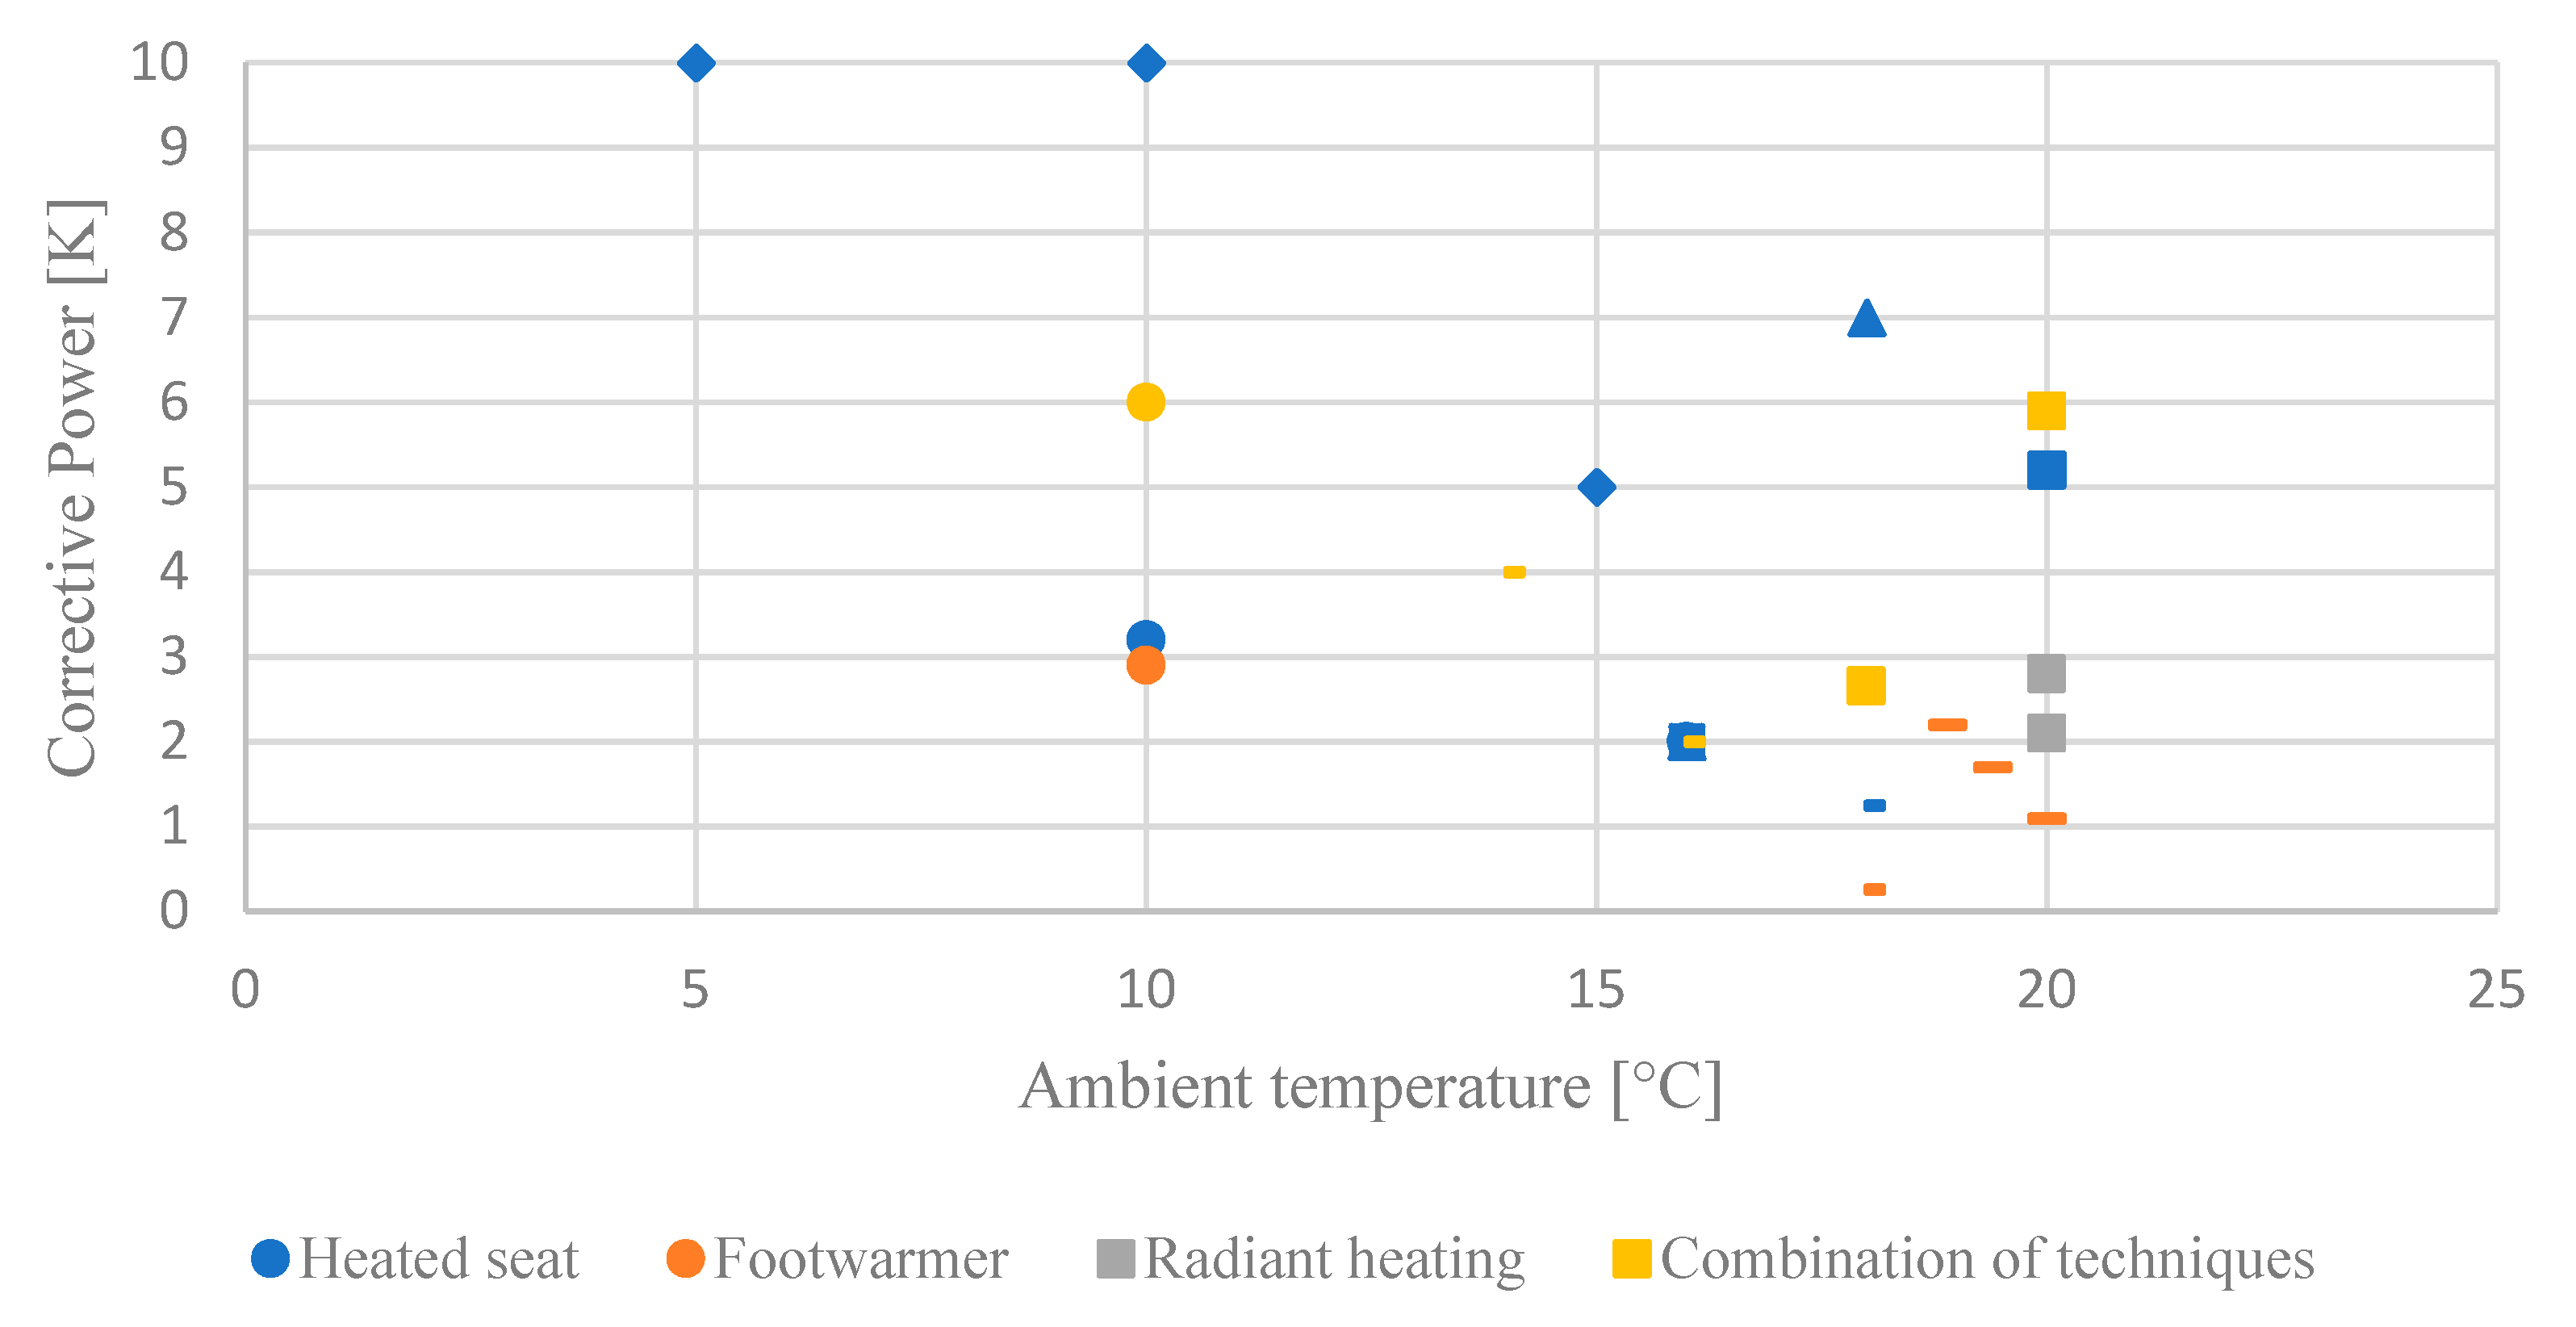
4.3. Effectiveness of the Different Personal Heating Systems

Zhang et al. [59] introduced the term “corrective power” to quantify the effectiveness of personal heating systems. Corrective power (CP) is defined as the temperature difference between two situations in which equal thermal sensation is achieved. To obtain the CP value of a system, a reference temperature is required at which thermal sensation is evaluated the same as when the system is used. Figure 12 shows the CP of studies reviewed by Zhang et al. [59], Watanabe et al. [33] and Oi et al. [30]. In general, it is found that the highest corrective power can be achieved with a heated chair, followed by a combination of techniques (in most cases, chair heating, foot heating and wrist heating). However, CP scores depend on several factors, such as the type of heated elements and the test conditions. When comparing the CP values within the study of Watanabe et al. [33] (squares in Figure 12), it appears that the combination of radiant floor heating, radiant under-desk heating and a heated seat achieves a higher corrective power than the individual systems. However, the difference from the CP on the heated seat, alone, is minor. Moreover, Oi et al. [30] (circles in Figure 12) tested a heated chair and a foot warmer, which both achieved a CP of 3 separately, while they achieved a CP of 6 when combined.
In this study, the different personal heating systems are not evaluated separately, but the thermal sensation during the experiment is related to the thermal sensation during the reference period. It was found that the corrective power in the living room was around 3 K on average. On average, a similar thermal sensation was found at 18 °C during the experiment as at 21 °C during the reference period. In the dining room, a similar thermal sensation was found, on average, at 20 °C during the reference period, which resulted in a CP of 1–2 K. In the other rooms, not enough responses on the thermal sensation were registered to calculate the corrective power. The CP values found in this study are lower than those presented in Figure 12; however, this research investigated personal heating in a real environment for a longer period of time.

4.4. Evaluation of Personal Heating with Regard to Energy Savings

This paper showed an energy-saving potential in the concept of personal heating in dwellings occupied by a single person or one couple. However, the actual energy savings depend on the building characteristics, the outdoor climate and the residents’ behavior. Therefore, further experiments should be done in a larger number of dwellings with different numbers of occupants. Nevertheless, according to the energy saving potential found, a personal heating practice still has a large potential to save energy when the dwelling is occupied by multiple residents, as the average energy consumption of the personal heating system applied was only 1% of the energy saved by lowering the indoor temperature.
In addition, the dwellings involved in this research were older and weakly insulated dwellings, which have a larger energy demand than newer well-insulated dwellings. This resulted in typically higher energy savings by reducing the indoor temperature. A reduction of the indoor temperature in well-insulated dwellings may result in a shorter heating season or even no heating at all to reach the base temperature of 18 °C (assumed in this research). Furthermore, in deep energy renovations, a comfort temperature is not always achieved, especially in very cold periods, because low-temperature heating cannot always be installed (e.g., on the upper floors). During these periods, personal heating can be used as an additional heating system. However, the personal heating practice should be further investigated in well-insulated dwellings.

4.5. A personal Heating Practice in Relation to the Global Challenges

Although studies on personal heating are limited in comparison with personal cooling or ventilation [45], the existing studies (presented in Table 1) already showed that personal heating has a potential to provide the same or a higher level of thermal comfort to the residents. This study expands the current research by focusing on the personal heating practice in a residential environment by means of a case study instead of focusing on the office environments mostly evaluated in climate chambers in existing studies.
Additionally, only a few studies investigated the energy saving potential of a personal heating practice [44,45,60]. Even though personal heating was initially not developed for the sake of energy savings, the consciousness about the global climate problems made researchers and industry investigating different opportunities for energy savings. These energy-saving opportunities are in line with the more recent research domain of energy sufficiency, focusing on fulfilling the needs of the occupants within the ecological limits [55]. When considering heating practices, heat should be provided when and where needed to provide thermal comfort to the residents instead of heating the complete building to a comfortable ambient temperature. As such, we should not only focus on the current energy-efficient technologies but also question and rethink our current practices at the same time in order to tackle the climate problems [61]. In this context, personal heating can act as one of the multiple options.

5. Conclusions

As a contribution to reducing the global energy consumption and reaching the climate goals, this study provided insights into personal heating as an innovative sufficient heating practice in dwellings that can complement the current energy-efficiency approach. The case study research in real dwellings expanded existing studies that focus on personal heating in office buildings and lab experiments.
Within the limitations and context of this research, the hypothesis formulated at the start of this research can be confirmed. It was found that personal heating has potential as an energy sufficient heating practice in dwellings by reducing the indoor temperature and implementing personal heating systems at the standstill locations where residents effectively spend their time. It is found that the residents are mostly able to make themselves comfortable at reduced indoor temperatures by making use of active personal heating systems at the standstill locations. Additionally, significant energy savings were realized by the personal heating practice due to the reduced indoor temperature setpoint. Although the personal heating systems were off-the-shelf systems and therefore not optimized for the cases, the results are promising. In further research, the personal heating systems should be optimized to improve the user-friendliness of the personal heating systems. The personal heating practice should also be investigated for a longer period of time within a larger sample of case studies. Additionally, the study can be extended to other climatic regions to investigate the potential of personal heating practice to reduce the global energy demand while still providing comfort to the residents.

Author Contributions

Supervision, G.V. and E.K.; Writing—riginal draft, N.V.L.; Writing—review & editing, G.V. and E.K. All authors have read and agreed to the published version of the manuscript.

Funding

This research was funded by a special research fund of Hasselt University allocated by the Flemish government.

Institutional Review Board Statement

The study was conducted according to the guidelines of the Declaration of Helsinki, and submitted by the Social and Societal Ethics Committee of Hasselt University.

Informed Consent Statement

Informed consent was obtained from all subjects involved in the study.

Conflicts of Interest

The authors declare no conflict of interest.

References

  1. World Economic Forum. Global Challenges. 2020. Available online: https://www.weforum.org/focus/global-challenges-20 (accessed on 11 March 2021).
  2. IPCC. Climate Change 2013: The Physical Science Basis. Contribution of Working Group I to the Fifth Assessment Report of the Intergovernmental Panel on Climate Change; IPCC: Cambridge, UK; New York, NY, USA, 2013; p. 1535. [Google Scholar]
  3. European Commission. Energy Performance of Building Directive. 2020. Available online: https://ec.europa.eu/energy/topics/energy-efficiency/energy-efficient-buildings/energy-performance-buildings-directive_en (accessed on 3 March 2021).
  4. Abergel, T.; Dean, B.; Dulac, J. Towards a zero-emission, efficient, and resilient buildings and construction sector: Global Status Report 2017. UN Environ. Int. Energy Agency Paris Fr. 2017, 22, 1–48. [Google Scholar]
  5. FODEConomie. Analyse van Het Energieverbruik van Huishoudens in Belgie; FOD Economie, K.M.O.; Middenstand en Energie: Brussels, Belgium, 2018.
  6. Jespers, K.; Dufait, N. Energiebalans Vlaanderen 1990–2017; Vlaams Energieagentschap: Brussels, Belgium, 2019. [Google Scholar]
  7. Thomas, S.; Brischke, L.A.; Thema, J.; Kopatz, M. Energy Sufficiency Policy: An Evolution of Energy Efficiency Policy or Radically New Approaches? Eceee: Stockholm, Sweden, 2015. [Google Scholar]
  8. Fischer, C.C.; Tibbetts, K.J.; Morgan, D.; Ceder, G. When less is more. Nat. Mater. 2006, 5, 641–646. [Google Scholar] [CrossRef]
  9. Hamilton, I.G.; Summerfield, A.J.; Shipworth, D.; Steadman, J.P.; Oreszczyn, T.; Lowe, R.J. Energy efficiency uptake and energy savings in English houses: A cohort study. Energy Build. 2016, 118, 259–276. [Google Scholar] [CrossRef] [Green Version]
  10. Lorek, S.; Spangenberg, J.H. Energy sufficiency through social innovation in housing. Energy Policy 2019, 126, 287–294. [Google Scholar] [CrossRef]
  11. Rees, W.E. The ecological crisis and self-delusion: Implications for the building sector. Build. Res. Inf. 2009, 37, 300–311. [Google Scholar] [CrossRef] [Green Version]
  12. Kovacic, I.; Reisinger, J.; Honic, M. Life Cycle Assessment of embodied and operational energy for a passive housing block in Austria. Renew. Sustain. Energy Rev. 2018, 82, 1774–1786. [Google Scholar] [CrossRef]
  13. Röck, M.; Saade, M.R.M.; Balouktsi, M.; Rasmussen, F.N.; Birgisdottir, H.; Frischknecht, R.; Habert, G.; Lützkendorf, T.; Passer, A. Embodied GHG emissions of buildings-The hidden challenge for effective climate change mitigation. Appl. Energy 2020, 258, 114107. [Google Scholar] [CrossRef]
  14. Peeters, L.; Van Der Veken, J.; Hens, H.; Helsen, L.; D’Haeseleer, W. Control of heating systems in residential buildings: Current practice. Energy Build. 2008, 40, 1446–1455. [Google Scholar] [CrossRef]
  15. Van Loy, N.; Verbeeck, G.; Knapen, E. Analysis of accurate spatial use patterns within rooms for optimizing heating systems. In Young Researchers in Sustanable Building; CTU: Prague, Czech Republic, 2019. [Google Scholar]
  16. Van Loy, N.; Verbeeck, G.; Knapen, E. Potential of spatial use patterns for developing localized conditioning systems to reduce energy consumption. In E3S Web of Conferences; EDP Sciences: Bucharest, Romania, 2019; Volume 111. [Google Scholar]
  17. Darby, S.; Fawcett, T. Energy Sufficiency: A Concept Paper for ECEEE; European Council for an Energy-Efficient Economy, Environmental Change Institute, University of Oxford: Oxford, UK, 2018; Available online: https://www.energysufficiency.org/static/media/uploads/site-8/library/papers/sufficiency-introduction-final-oct2018 (accessed on 15 October 2020).
  18. Bierwirth, A.; Thomas, S. Energy sufficiency in buildings. In ECEEE Workshop ‘Energy Sufficiency: Key Messages for Policy Makers’; Eceee: Geneva, Switzerland, 2018. [Google Scholar]
  19. Humphreys, M.; Nicol, F.; Roaf, S. Keeping warm in a cooler house. Hist. Scotl. Tech. Pap. 2011, 14, 1–28. [Google Scholar]
  20. Deng, Q.; Wang, R.; Li, Y.; Miao, Y.; Zhao, J. Human thermal sensation and comfort in a non-uniform environment with personalized heating. Sci. Total. Environ. 2017, 578, 242–248. [Google Scholar] [CrossRef]
  21. Yang, H.; Cao, B.; Zhu, Y. Study on the effects of chair heating in cold indoor environments from the perspective of local thermal sensation. Energy Build. 2018, 180, 16–28. [Google Scholar] [CrossRef]
  22. Pasut, W.; Zhang, H.; Arens, E.; Zhai, Y. Energy-efficient comfort with a heated/cooled chair: Results from human subject tests. Build. Environ. 2015, 84, 10–21. [Google Scholar] [CrossRef] [Green Version]
  23. Pasut, W.; Zhang, H.; Arens, E.; Kaam, S.; Zhai, Y. Effect of a heated and cooled office chair on thermal comfort. HVAC R Res. 2013, 19, 574–583. [Google Scholar]
  24. Zhang, Y.F.; Wyon, D.P.; Fang, L.; Melikov, A.K. The influence of heated or cooled seats on the acceptable ambient temperature range. Ergonomics 2007, 50, 586–600. [Google Scholar] [CrossRef] [PubMed]
  25. Shahzad, S.; Calautit, J.K.; Calautit, K.; Hughes, B.; Aquino, A.I. Advanced personal comfort system (APCS) for the workplace: A review and case study. Energy Build. 2018, 173, 689–709. [Google Scholar] [CrossRef] [Green Version]
  26. Zhang, H.; Arens, E.; Taub, M.; Dickerhoff, D.; Bauman, F.; Fountain, M.; Pasut, W.; Fannon, D.; Zhai, Y.; Pigman, M. Using footwarmers in offices for thermal comfort and energy savings. Energy Build. 2015, 104, 233–243. [Google Scholar] [CrossRef] [Green Version]
  27. Kong, M.; Dang, T.Q.; Zhang, J.; Khalifa, H.E. Micro-environmental control for efficient local heating: CFD simulation and manikin test verification. Build. Environ. 2019, 147, 382–396. [Google Scholar] [CrossRef]
  28. Zhang, H.; Arens, E.; Kim, D.; Buchberger, E.; Bauman, F.; Huizenga, C. Comfort, perceived air quality, and work performance in a low-power task–ambient conditioning system. Build. Environ. 2010, 45, 29–39. [Google Scholar] [CrossRef] [Green Version]
  29. He, Y.; Wang, X.; Li, N.; He, M.; He, D. Heating chair assisted by leg-warmer: A potential way to achieve better thermal comfort and greater energy conservation in winter. Energy Build. 2018, 158, 1106–1116. [Google Scholar] [CrossRef]
  30. Oi, H.; Yanagi, K.; Tabata, K.; Tochihara, Y. Effects of heated seat and foot heater on thermal comfort and heater energy consumption in vehicle. Ergonomics 2011, 54, 690–699. [Google Scholar] [CrossRef]
  31. Luo, M.; Arens, E.; Zhang, H.; Ghahramani, A.; Wang, Z. Thermal comfort evaluated for combinations of energy-efficient personal heating and cooling devices. Build. Environ. 2018, 143, 206–216. [Google Scholar] [CrossRef] [Green Version]
  32. Veselý, M.; Molenaar, P.; Vos, M.; Li, R.; Zeiler, W. Personalized heating-Comparison of heaters and control modes. Build. Environ. 2017, 112, 223–232. [Google Scholar] [CrossRef] [Green Version]
  33. Watanabe, S.; Melikov, A.K.; Knudsen, G.L. Design of an individually controlled system for an optimal thermal microenvironment. Build. Environ. 2010, 45, 549–558. [Google Scholar] [CrossRef]
  34. Li, Z.; Ke, Y.; Wang, F.; Yang, B. A study of thermal comfort enhancement using three energy-efficient personalized heating strategies at two low indoor temperatures. Build. Environ. 2018, 143, 1–14. [Google Scholar]
  35. Foda, E.; Sirén, K. Design strategy for maximizing the energy-efficiency of a localized floor-heating system using a thermal manikin with human thermoregulatory control. Energy Build. 2012, 51, 111–121. [Google Scholar] [CrossRef]
  36. Lodi, C.; Magli, S.; Contini, F.M.; Muscio, A.; Tartarini, P. Improvement of thermal comfort and energy efficiency in historical and monumental buildings by means of localized heating based on non-invasive electric radiant panels. Appl. Therm. Eng. 2017, 126, 276–289. [Google Scholar] [CrossRef]
  37. Melikov, A.K.; Langkilde, G.; Rasmussen, L.W. Human response to local heating for use in connection with low enthalpy ventilation. Proc. ROOMVENT 1998, 315321, 315–322. [Google Scholar]
  38. Conceição, E.; Lúcio, M.M.J. Evaluation of thermal comfort conditions in a localized radiant system placed in front and behind two students seated nearby warmed curtains. Build. Environ. 2010, 45, 2100–2110. [Google Scholar] [CrossRef]
  39. Wang, Z.; Warren, K.; Luo, M.; He, X.; Zhang, H.; Arens, E.; Chen, W.; He, Y.; Hu, Y.; Jin, L.; et al. Evaluating the comfort of thermally dynamic wearable devices. Build. Environ. 2020, 167, 106443. [Google Scholar] [CrossRef]
  40. Kim, J.; Bauman, F.; Raftery, P.; Arens, E.; Zhang, H.; Fierro, G.; Andersen, M.; Culler, D. Occupant comfort and behavior: High-resolution data from a 6-month field study of personal comfort systems with 37 real office workers. Build. Environ. 2019, 148, 348–360. [Google Scholar] [CrossRef]
  41. Zhou, L.; Li, N.; He, Y.; Zhang, J.; Lu, J.; Han, Y. Field Study on Thermal Comfort and Adaptive Behaviours with a Personal Heating Device in Hunan. In Proceedings of the Soil and Recycling Management in the Anthropocene Era, Harbin, China, 12–15 July 2019; Springer Science and Business Media LLC: Singapore, 2020; pp. 669–677. [Google Scholar]
  42. Wang, H.; Xu, M.; Bian, C. Experimental comparison of local direct heating to improve thermal comfort of workers. Build. Environ. 2020, 177, 106884. [Google Scholar] [CrossRef]
  43. Zhang, Y.; Zhao, R. Relationship between thermal sensation and comfort in non-uniform and dynamic environments. Build. Environ. 2009, 44, 1386–1391. [Google Scholar] [CrossRef]
  44. Veselý, M.; Zeiler, W. Personalized conditioning and its impact on thermal comfort and energy performance—A review. Renew. Sustain. Energy Rev. 2014, 34, 401–408. [Google Scholar] [CrossRef] [Green Version]
  45. Rawal, R.; Schweiker, M.; Kazanci, O.B.; Vardhan, V.; Jin, Q.; Duanmu, L. Personal comfort systems: A review on comfort, energy, and economics. Energy Build. 2020, 214, 109858. [Google Scholar] [CrossRef]
  46. Guerra-Santin, O.; Tweed, C.A. In-use monitoring of buildings: An overview of data collection methods. Energy Build. 2015, 93, 189–207. [Google Scholar] [CrossRef]
  47. KMI. Klimatologische Overzichten. Available online: https://www.meteo.be/nl/klimaat/klimatologisch-overzicht (accessed on 21 January 2021).
  48. Eurostat. Energy Statistics-Cooling and Heating Degree Days. 2020. Available online: https://ec.europa.eu/eurostat/cache/metadata/en/nrg_chdd_esms.htm (accessed on 29 January 2021).
  49. Chen, C.-F.; Hong, T.; de Rubens, G.Z.; Yilmaz, S.; Bandurski, K.; Bélafi, Z.D.; De Simone, M.; Bavaresco, M.V.; Wang, Y.; Liu, P.-L.; et al. Culture, conformity, and carbon? A multi-country analysis of heating and cooling practices in office buildings. Energy Res. Soc. Sci. 2020, 61, 101344. [Google Scholar] [CrossRef]
  50. Standardization, I.O.f. ISO 7730 2005-11-15 Ergonomics of the Thermal Environment: Analytical Determination and Interpretation of Thermal Comfort Using Calculation of the PMV and PPD Indices and Local Thermal Comfort Criteria. Management 2005, 3, e615. [Google Scholar]
  51. Ghahramani, A.; Zhang, K.; Dutta, K.; Yang, Z.; Becerik-Gerber, B. Energy savings from temperature setpoints and deadband: Quantifying the influence of building and system properties on savings. Appl. Energy 2016, 165, 930–942. [Google Scholar] [CrossRef] [Green Version]
  52. Hoyt, T.; Arens, E.; Zhang, H. Extending air temperature setpoints: Simulated energy savings and design considerations for new and retrofit buildings. Build. Environ. 2015, 88, 89–96. [Google Scholar] [CrossRef] [Green Version]
  53. Verhaart, J.J.; Vesely, M.M.; Zeiler, W.W. Personal heating: Effectiveness and energy use. Build. Res. Inf. 2015, 43, 346–354. [Google Scholar] [CrossRef] [Green Version]
  54. Nicol, F.; Humphreys, M.; Roaf, S. Adaptive Thermal Comfort: Principles and Practice; Routledge: London, UK, 2012. [Google Scholar]
  55. Bierwirth, A.; Thomas, S. Energy Sufficiency in Buildings: Concept Paper; Eceee: Geneva, Switzerland, 2019. [Google Scholar]
  56. Fuentes, E.; Arce, L.; Salom, J. A review of domestic hot water consumption profiles for application in systems and buildings energy performance analysis. Renew. Sustain. Energy Rev. 2018, 81, 1530–1547. [Google Scholar] [CrossRef]
  57. O’Brien, W.; Gunay, H.B. The contextual factors contributing to occupants’ adaptive comfort behaviors in offices-A review and proposed modeling framework. Build. Environ. 2014, 77, 77–87. [Google Scholar] [CrossRef]
  58. Becker, R.; Paciuk, M. Thermal comfort in residential buildings-Failure to predict by Standard model. Build. Environ. 2009, 44, 948–960. [Google Scholar] [CrossRef]
  59. Zhang, H.; Arens, E.; Zhai, Y. A review of the corrective power of personal comfort systems in non-neutral ambient environments. Build. Environ. 2015, 91, 15–41. [Google Scholar] [CrossRef] [Green Version]
  60. André, M.; De Vecchi, R.; Lamberts, R. User-centered environmental control: A review of current findings on personal conditioning systems and personal comfort models. Energy Build. 2020, 222, 110011. [Google Scholar] [CrossRef]
  61. Marignac, Y. Energy Sufficiency as Part of Climate Action. 2019. Available online: www.climatedialogue.eu (accessed on 17 June 2021).
Figure 1. Standstill locations in dwelling 3 with personal heating (red) and without personal heating (blue). Personal heating elements implemented at the standstill locations where additional heating is required (red) in, respectively, the living room (1), dining room (2) and bathroom (3) in dwelling 3. (A) Radiation panels, (B) heated blanket, (C) heated cushions, (D) heated floor mat.
Sustainability 13 07257 g001
Figure 2. Mean indoor ambient temperature in different rooms of the three dwellings with the common heating practice (ref.) and during the experimental set-up with personal heating (exp.). A distinction is made between the temperatures during the entire measurement period and the temperatures at the moment of responding to the survey questions (Occupation). The temperatures in the kitchen of case 2 contain presumably measuring errors due to the location of the data logger.
Sustainability 13 07257 g002
Figure 3. Thermal sensation and thermal comfort in the different rooms during the entire experimental period while using active, passive or no personal heating.
Sustainability 13 07257 g003
Figure 4. Use of active personal heating elements, passive personal elements (such as a blanket) or no elements.
Sustainability 13 07257 g004
Figure 5. Thermal sensation and thermal comfort in the living room during the entire experiment (while using active, passive or no personal heating) and while making use of active personal heating.
Sustainability 13 07257 g005
Figure 6. Thermal sensation during the conventional heating practice (ref.) and during the experimental set-up with personal heating (exp.) in the living room.
Sustainability 13 07257 g006
Figure 7. Thermal sensation and thermal comfort in the dining room during the entire experiment (while using active, passive or no personal heating) and while making use of active personal heating.
Sustainability 13 07257 g007
Figure 8. Thermal sensation during the common heating practice and while making use of active personal heating in the dining room.
Sustainability 13 07257 g008
Figure 9. Schematic energy saving potential by personal heating.
Sustainability 13 07257 g009
Figure 10. Heating energy consumption and average heating energy consumption per degree day during the reference period and the experiment with personal heating in dwelling 3.
Sustainability 13 07257 g010
Figure 11. Relation between the actual thermal sensation experience and the predicted mean vote during the reference period (current heating practice) (figure left) and the active personal heating practice (figure right).
Sustainability 13 07257 g011
Figure 12. Corrective power of personalized heating systems as a function of the ambient temperature, based on the studies reviewed by Zhang (2015) and the results of study of Deng et al. [20], He et al. [29] and Luo et al. [31]. Corrective power results of the same study are represented by the same symbol.
Sustainability 13 07257 g012
Table 1. Overview of previous studies on personalized heating systems.
Ref.Type of SystemType of
Experiment
(N° Subjects)
Individual ControlAmbient Temperature [°C]Comfort/EnergySystem/Practice
Study 1[20]Heated chairClimate chamber (32)No16Thermal comfortSystem
Study 2[21]Heated chairClimate chamber (13)Yes14, 16, 18Thermal comfortSystem
Study 3[22]Heated chairClimate chamber (23)Yes18, 16Thermal comfortSystem
Study 4[23]Heated chairClimate chamber (30)Yes18, 16Thermal comfortSystem
Study 5[24]Heated chairClimate chamber (24)No22, 18, 15Thermal comfortSystem
Study 6[25]Heated chairSimulations--Thermal comfort/energy System/practice
Study 7[26]Foot warmers (radiant)Office building (16)Yes20, 19.4, 18.9Thermal comfort/energySystem
Study 8[27]Foot warmerThermal manikin/simulations--Thermal comfortSystem
Study 9[28]Palm warmer
Foot warmer
Climate chamber (18)No/Yes18, 20Thermal comfort/energySystem
Study 10[29]Heated chair
Leg-warmer
Climate chamber (16)Yes14, 16, 18, 22Thermal comfort/energySystem
Study 11[30]Heated seat
Foot warmer
Heated seat + foot warmer
Climate chamber (8)-20, 10Thermal comfortSystem
Study 12[31]Heated chair
Heated wrist pad
Heated insole
Climate chamber (20)/thermal manikin-18Thermal comfort/energySystem
Study 13[32]Heated chair
Heated desk mat
Heated floor mat
Climate chamber (13)Yes18Thermal comfort/energySystem
Study 14[33]Heated chair
Under-desk radiant heating panel
Floor radiant heating panel
Thermal manikin-20Thermal comfortSystem
Study 15[34]Radiant panel with heated table pad
Heated chair with floor mattress
Heated clothing
Climate chamber (14)Yes15, 18Thermal comfortSystem
Study 16[35]Localized floor heatingThermal manikin--Thermal comfortSystem
Study 17[36]Electric radiant panelsSimulation-18Thermal comfortSystem
Study 18[37]Electric radiant panelsClimate chamber (18)-20, 17, 14Thermal comfortSystem
Study 19[38]Electric radiant panelsSimulation--Thermal comfortSystem
Study 20[39]Wrist heaterClimate chamber (49)No/Yes20, 23, 26Thermal comfortSystem
Study 21[40]Heated seatOffice buildingYes-Thermal comfortSystem
Study 22[41]Floor heaterResidential buildings 8–14Thermal comfortSystem
Study 23[42]Radiant heater, heated clothingClimate chamber (20) 13–15Thermal comfortSystem
Table 2. Overview of involved dwellings.
Dwelling 1Dwelling 2Dwelling 3
ResidentsSingle, 25–35 years old, man (n° 1)Couple, 25–35 years old, man (n° 2) and woman (n° 3)Couple, 25–35 years old, man (n° 4) and woman (n° 5)
Dwelling size162 m2215 m2148 m2
Building year1990Before 1945 (renovated in 1972)Before 1945 (partially renovated in 2019)
EPC 1496 kWh/m2year370 kWh/m2283 kWh/m2
Heating systemElectric accumulation heaters (living, veranda) and electric heatersCentral heating on fuel oil with radiators and floor heating (dining room and bathrooms)Energy-efficient central heating on gas with radiators
1 The energy performance certificate (EPC) gives the theoretical energy consumption for standard indoor and outdoor climatic conditions and a standard occupant and takes into account the insulation level and installations but not the actual occupant behavior or actual climate. So, this score only represents the energy performance quality of the building and its systems, not the real energy consumption.
Table 3. Overview of the maximum power of the different personal heating systems.
Infrared PanelHeated
Blanket
Heated
Cushions
Floor Mat
Maximum power350 W120 W100 W20 W
ControlsON–OFF4 heating levels and OFF3 heating levels and OFFON–OFF
Table 4. Questions of the thermal comfort survey including the question type.
QuestionQuestion Type
1Where are you exactly? (position within the room)Single option
2In which pose are you? (standing, sitting, lying)Single option
3Which activity are you performing?Multiple options
4How do you experience the indoor temperature right now? (thermal sensation)Likert scale
5What is your thermal comfort right now? (thermal comfort)Likert scale
6Which clothing type are you wearing? Multiple options
7How did you come to this comfort state? (e.g., just performed an activity or used a personal heating element)Open questions
8Do you experience any local discomfort? Where and how?Open question
Table 5. Monthly mean, monthly average maximum and minimum outdoor air temperatures [47].
December 2019January 2020February 2020
Average outdoor temperature5.9 °C5.9 °C7.0 °C
Minimum outdoor temperature−2.5 °C−2.4 °C−0.9 °C
Maximum outdoor temperature15.4 °C12.4 °C16.6 °C
Days minimum outdoor temperature < 0 °C662
Days maximum outdoor temperature < 0 °C000
Average winter outdoor temperature3.9 °C3.3 °C3.7 °C
Table 6. Energy consumption at the different standstill locations in the different dwellings.
Living Room
Couch
Dining Room
Dining Table
Kitchen
Worktop/
Table
BathroomTotal/
Day
Type of Element(2×) Infrared Panel(2×) Blanket(2×) Infrared Panel(4×) Cushions (2×) Floor Mat(4×) Cushions
(2×) Floor Mat
(1×) Infrared Panel
Combined maximum power700 W240 W700 W440 W440 W350 W
Total energy consumption during the experimentCase 1
10 days
11.68 kWh1.13 kWh0 kWh0 kWh0 kWh0.03 kWh1.28 kWh
Case 2
7 days
3.35 kWh1.38 kWh1.19 kWh0.32 kWh0 kWh0.01 kWh0.89 kWh
Case 3
7 days
5.18 kWh1.96 kWh0 kWh0.24 kWh0 kWh0.43 kWh1.11 kWh
Average energy consumption/day0.80 kWh0.20 kWh0.06 kWh0.03 kWh0 kWh0.02 kWh1.10 kWh
Publisher’s Note: MDPI stays neutral with regard to jurisdictional claims in published maps and institutional affiliations.

