
Modeling the Factors Enhancing the Implementation of Green Procurement in the Pakistani Construction Industry

 ,
, 
Abstract
:1. Introduction
2. Literature Review
3. Research Methodology
3.1. Data Collection and Analysis Methods
3.2. Survey Statistics and Demography of the Respondents
3.3. Categorization of the Factors
4. Results and Discussion
4.1. Assessment of Measurement Model
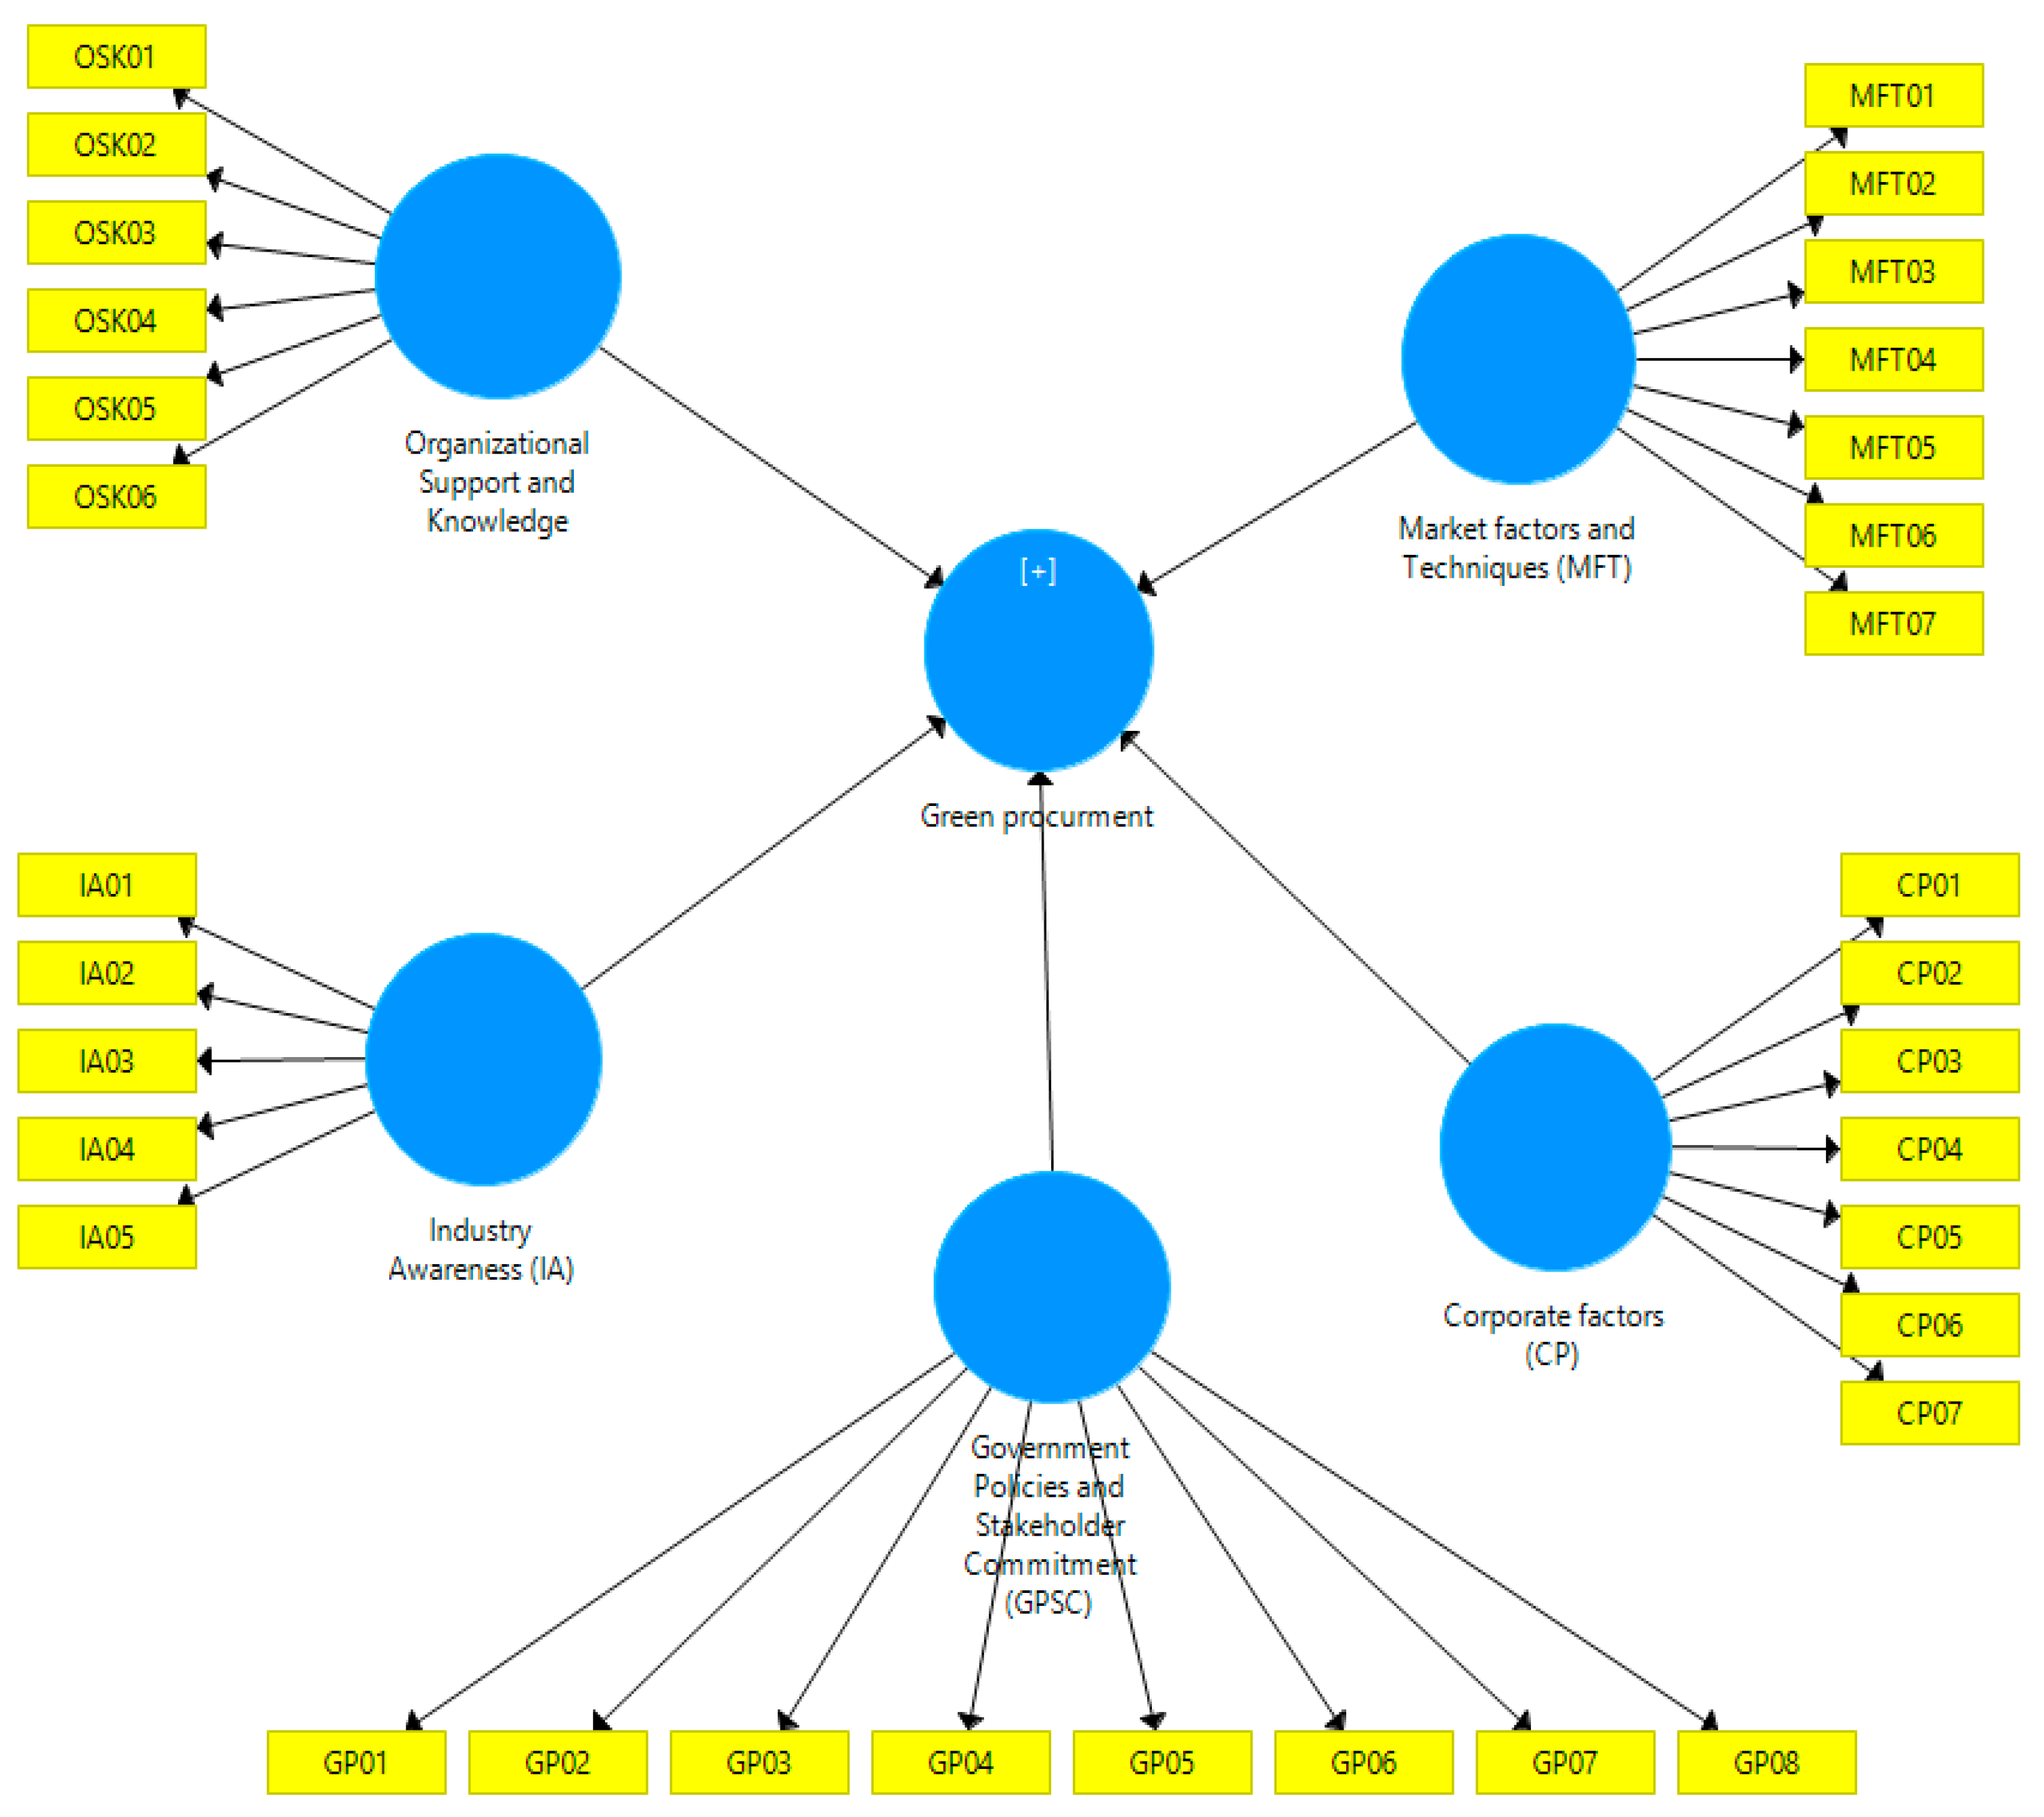
4.2. Assessment of Structural Model
4.3. Assessment of Overall Model
5. Conclusions
6. Practical Implication and Contribution
7. Limitations and Future Studies
Author Contributions
Funding
Data Availability Statement
Acknowledgments
Conflicts of Interest
References
- Stasiak-Betlejewska, R.; Potkány, M. Construction Costs Analysis and its Importance to the Economy. Procedia Econ. Finance 2015, 34, 35–42. [Google Scholar] [CrossRef] [Green Version]
- Talpur, M.A.H.; Napiah, M.; Chandio, I.A.; Khahro, S.H. Research Framework Focusing Transportation Accessibility Planning, Computer Based Modeling and Transportation Policy Outlines for Remote Regions of Developing World. Res. J. Environ. Earth Sci. 2013, 5, 32–40. [Google Scholar] [CrossRef]
- Yan, H.; Shen, Q.; Fan, L.C.; Wang, Y.; Zhang, L. Greenhouse gas emissions in building construction: A case study of One Peking in Hong Kong. Build. Environ. 2010, 45, 949–955. [Google Scholar] [CrossRef] [Green Version]
- Wong, J.K.; Li, H.; Wang, H.; Huang, T.; Luo, E.; Li, V. Toward low-carbon construction processes: The visualisation of predicted emission via virtual prototyping technology. Autom. Constr. 2013, 33, 72–78. [Google Scholar] [CrossRef]
- Varnäs, A.; Berit, B.; Charlotta, F. Environmental consideration in procurement of construction contracts: Current practice, problems and opportunities in green procurement in the Swedish construction industry. J. Clean. Prod. 2009, 17.13, 1214–1222. [Google Scholar] [CrossRef]
- Yılmaz, M.; Adem, B. Sustainability in construction sector. Sustain. Cities Soc. 2015, 195, 2253–2262. [Google Scholar] [CrossRef] [Green Version]
- Thakur, A.K.; Pappu, A.; Thakur, V.K. Resource efficiency impact on marble waste recycling towards sustainable green construction materials. Curr. Opin. Green Sustain. Chem. 2018, 13, 91–101. [Google Scholar] [CrossRef]
- Vyas, S.; Ahmed, S.; Parashar, A. BEE (Bureau of energy efficiency) and Green Buildings. Int. J. Res. 2014, 1, 23–32. [Google Scholar]
- Dixon, W. The Impacts of Construction and the Built Environment; Briefing Notes; Willmott-Dixon Group: Letchworth Garden City, UK, 2010. [Google Scholar]
- Bohari, A.A.M.; Skitmore, M.; Xia, B.; Teo, M.; Khalil, N. Key stakeholder values in encouraging green orientation of construction procurementThe path towards greening the Malaysian construction industry. J. Clean. Prod. 2020, 270, 1–11. [Google Scholar] [CrossRef]
- Ali, T.H.; Akhund, M.A.; Memon, N.A.; Memon, A.H.; Imad, H.U.; Khahro, S.H. Application of Artifical Intelligence in Construction Waste Management. In 2019 8th International Conference on Industrial Technology and Management (ICITM); IEEE: Cambridge, UK, 2019; pp. 50–55. [Google Scholar] [CrossRef]
- Yang, S.; Su, Y.; Wang, W.; Hua, K. Research on Developers’ Green ProcurementBehavior Based on the Theory of Planned Behavior. Sustainability 2019, 11, 2949. [Google Scholar] [CrossRef] [Green Version]
- Kofoworola, O.F.; Gheewala, S.H. Estimation of construction waste generation and management in Thailand. Waste Manag. 2009, 29, 731–738. [Google Scholar] [CrossRef] [PubMed]
- Salam, M.A. An empirical investigation of the determinants of adoption of green procurement for successful green supply chain management. In Proceedings of the 4th IEEE International Conference on Management of Innovation and Technology, (ICMIT), Bangkok, Thailand, 21–24 September 2008. [Google Scholar]
- Alqadami, A.T.; Zawawi, N.A.W.A.; Rahmawati, Y.; Alaloul, W.; Alshalif, A.F. Key Success Factors of Implementing Green Procurement inPublic Construction Projects in Malaysia. IOP Conf. Ser. Earth Environ. Sci. 2020, 498, 012098. [Google Scholar] [CrossRef]
- Zhu, Q.; Geng, Y.; Sarkis, J. Motivating green public procurement in China: An individual level perspective. J. Environ. Manag. 2013, 126, 85–95. [Google Scholar] [CrossRef] [PubMed]
- Li, Y.; Xu, L.; Sun, T.; Ding, R. The impact of project environmental practices on environmental and organizational performance in the construction industry. Int. J. Manag. Proj. Bus. 2020, 13, 367–387. [Google Scholar] [CrossRef]
- Wong, J.K.W.; Chan, J.K.S.; Wadu, M.J. Facilitating effective green procurement in construction projects: An empirical study of the enablers. J. Clean. Prod. 2016, 135, 859–871. [Google Scholar] [CrossRef]
- Ali, Y.; Saad, T.; Sabir, M.; Muhammad, N.; Salman, A.; Zeb, K. Integration of green supply chain management practices in construction supply chain of CPEC. Manag. Environ. Qual. Int. J. 2020, 31, 185–200. [Google Scholar] [CrossRef]
- Zhu, Q.; Sarkis, J. An inter-sectoral comparison of green supply chain management in China: Drivers and practices. J. Clean. Prod. 2006, 14, 472–486. [Google Scholar] [CrossRef]
- Green Council. Report of the Research Study on the Current Status and Direction for Green Purchasing in Hong Kong; Green Council: Hong Kong, China, 2010. [Google Scholar]
- Shen, L.; Zhang, Z.; Long, Z. Significant barriers to green procurement in real estate development. Resour. Conserv. Recycl. 2017, 116, 160–168. [Google Scholar] [CrossRef]
- Faith-Ell, C. The Application of Environmental Requirements in Procurement of Road Maintenance in Sweden. Ph.D. Thesis, Land and Water Resources Engineering, Royal Institute of Technology, Stockholm, Sweden, 2005. [Google Scholar]
- Musa, N.D.; Buniamin, S.; Johari, N.H.; Ahmad, N.; Hanim, F.; Abdul Rashid, A. Key indicators towards the implementation of green government procurement in Malaysia. World Appl. Sci. J. 2013, 28, 127–135. [Google Scholar]
- Yu, T.; Shi, Q.; Zuo, J.; Chen, R. Critical factors for implementing sustainable construction practice in HOPSCA projects: A case study in China. J. Sustain. Cities Soc. 2018, 37, 93–103. [Google Scholar] [CrossRef]
- Ofori, G. Greening the construction supply chain in Singapore. Eur. J. Purch. Supply Manag. 2000, 6, 195–206. [Google Scholar] [CrossRef]
- Simion, C.P.; Nicolescu, C.; Vrîncut, M. Green Procurement in Romanian Construction Projects. A Cluster Analysis of the Barriers and Enablers to Green Procurement in Construction Projects from the Bucharest-Ilfov Region of Romania. Sustainability 2019, 11, 6231. [Google Scholar] [CrossRef] [Green Version]
- Zhang, Y. Construction of Bid Evaluation Index System in Government Public Project Green Procurement in China Based on D-S Evidence Theory. Sustainability 2020, 12, 651. [Google Scholar] [CrossRef] [Green Version]
- Walker, H.; Di Sisto, L.; McBain, D. Drivers and barriers to environmental supply chain management practices: Lessons from the public and private sectors. J. Purch. Supply Manag. 2008, 14, 69–85. [Google Scholar] [CrossRef]
- Diabat, A.; Govindan, K. An analysis of the drivers affecting the implementation of green supply chain management. Resour. Conserv. Recycl. 2011, 55, 659–667. [Google Scholar] [CrossRef]
- Yang, W.; Zhang, Y. Research on factors of green purchasing practices of Chinese. J. Bus. Manag. Econ. 2012, 3, 222–231. [Google Scholar]
- Rehman, U.U.; Shafiq, M.; Ali, H.; Abdullah, M. Green and sustainable construction practices impact on Organizational Development. Eur. J. Soc. Impact Circ. Econ. 2020. [Google Scholar] [CrossRef]
- Adetunji, I.; Price, A.D.; Fleming, P. Achieving sustainability in the construction supply chain. Proc. Inst. Civ. Eng. Eng. Sustain. 2008, 161, 161–172. [Google Scholar] [CrossRef] [Green Version]
- Love, P.E.; Irani, Z.; Edwards, D.J. A seamless supply chain management model for construction. Supply Chain Manag. Int. J. 2004, 9, 43–56. [Google Scholar] [CrossRef]
- Testa, F.; Annunziata, E.; Iraldo, F.; Frey, M. Drawbacks and opportunities of green public procurement: An effective tool for sustainable production. J. Clean. Prod. 2016, 112, 1893–1900. [Google Scholar] [CrossRef]
- Humphreys, P.; Matthews, J.; Kumaraswamy, M. Pre-construction project partnering: From adversarial to collaborative relationships. Supply Chain Manag. Int. J. 2003, 8, 166–178. [Google Scholar] [CrossRef]
- Carter, C.R.; Dresner, M. Purchasing’s role in environmental management: Cross-functional development of grounded theory. J. Supply Chain. Manag. 2001, 37, 12–27. [Google Scholar] [CrossRef]
- Lam, P.T.; Chan, E.H.; Poon, C.S.; Chau, C.K.; Chun, K.P. Factors affecting the implementation of green specifications in construction. J. Environ. Manag. 2010, 91, 654–661. [Google Scholar] [CrossRef]
- Ruparathna, R.; Hewage, K. Sustainable procurement in the Canadian construction industry: Challenges and benefits. Can. J. Civ. Eng. 2015, 42, 417–426. [Google Scholar] [CrossRef]
- Russell, J. Underwriting process for construction contract bonds. J. Manag. Eng. 1992, 8, 63–80. [Google Scholar] [CrossRef]
- Liu, B.; Huo, T.; Liao, P.C.; Yuan, J.; Sun, J.; Hu, X. A special Partial Least Squares (PLS) path decision modeling for bid evaluation of large construction projects. KSCE J. Civ. Eng. 2017, 21, 579–592. [Google Scholar] [CrossRef]
- Durdyev, S.; Ihtiyar, A.; Banaitis, A.; Thurnell, D. The construction client satisfaction model: A PLS-SEM approach. J. Civ. Eng. Manag. 2018, 24, 31–42. [Google Scholar] [CrossRef]
- Memon, A.H.; Rahman, I.A. SEM-PLS Analysis of inhibiting factors of cost performance for large construction projects in Malaysia: Perspective of Clients and Consultants. Sci. World J. 2014, 165158. [Google Scholar] [CrossRef] [Green Version]
- Becker, J.M.; Klein, K.; Wetzels, M. Hierarchical latent variable models in PLS-SEM: Guidelines for using reflective-formative type models. Long Range Plan. 2012, 45, 359–394. [Google Scholar] [CrossRef]
- Hair, J.F.; Ringle, C.M.; Sarstedt, M. PLS-SEM: Indeed a silver bullet. J. Mark. Theory Pract. 2011, 19, 139–152. [Google Scholar] [CrossRef]
- Hooper, D. Exploratory Factor Analysis. In Approaches to Quantitative Research–Theory and Its Practical Application; A Guide to Dissertation Students; Chen, H., Ed.; Oak Tree Press: Cork, Ireland, 2012. [Google Scholar]
- Taofeeq, D.M.; Adeleke, A.Q.; Lee, C.K. Individual factors influencing contractors’ risk attitudes among Malaysian construction industries: The moderating role of government policy. Int. J. Constr. Manag. 2019, 1–20. [Google Scholar] [CrossRef]
- Hair, J.F., Jr.; Sarstedt, M.; Matthews, L.M.; Ringle, C.M. Identifying and Treating Unobserved Heterogeneity with FIMIX-PLS: Part I–Method. Eur. Bus. Rev. 2016, 28, 63–76. [Google Scholar] [CrossRef]
- Sekaran, U.; Bougie, R. Research Methods for Business: A Skill Building Approach, 7th ed.; John Wiley & Sons: Hong Kong, China, 2016. [Google Scholar]
- Hulland, J. Use of partial least squares (PLS) in strategic management research: A review of four recent studies. Strateg. Manag. J. 1999, 20, 195–204. [Google Scholar] [CrossRef]
- Geffen, C.; Rothenberg, S. Sustainable development across firm boundaries: The critical role of suppliers in environmental innovation. Int. J. Oper. Prod. Manag. 2000, 20, 166–186. [Google Scholar] [CrossRef] [Green Version]
- Götz, O.; Liehr-Gobbers, K.; Krafft, M. Evaluation of structural equation models using the partial least squares (PLS) approach. In Handbook of Partial Least Squares; Springer: Berlin/Heidelberg, Germany, 2010; pp. 691–711. [Google Scholar]
- Henseler, J.; Ringle, C.M.; Sinkovics, R.R. The use of partial least squares path modeling in international marketing. In New Challenges to International Marketing; Emerald Group Publishing Limited: Bingley, UK, 2009; pp. 277–319. [Google Scholar]
- Chin, W.W. The partial least squares approach to structural equation modeling. Mod. Methods Bus. Res. 1998, 295, 295–336. [Google Scholar]
- Hair, J.F.; Black, W.C.; Babin, B.J.; Anderson, R.E. Multivariate Data Analysis: Global Edition; Pearson: London, UK, 2010. [Google Scholar]
- Aibinu, A.A.; Ling, F.Y.Y.; Ofori, G. Structural equation modelling of organizational justice and cooperative behaviour in the construction project claims process: Contractors’ perspectives. Constr. Manag. Econ. 2011, 29, 463–481. [Google Scholar] [CrossRef]
- Hair, J.F.; Risher, J.J.; Sarstedt, M.; Ringle, C.M. When to use and how to report the results of PLS-SEM. Eur. Bus. Rev. 2019, 31, 2–24. [Google Scholar] [CrossRef]
- Hassan, A.K.; Adeleke, A.Q. The Effects of Project Triple Constraint on Malaysia Building Projects. Soc. Sci. Humanit. J. 2019, 3, 1222–1238. [Google Scholar]
- Ismayana, M.P.; Adeleke, A.Q. The Influence of Organizational Culture on Construction Risk Management Among Kuantan Malaysian Construction Industry: A Partial Least Square Structural Equation Modeling Approach. Soc. Sci. Humanit. J. 2020, 4, 1693–1704. [Google Scholar]
- Cohen, J. Statistical Power Analysis for the Behavioral Sciences; Routledge: Oxfordshire, UK, 2013. [Google Scholar]
- Wang, Y.M.; Chin, K.S. Some alternative models for DEA cross-efficiency evaluation. Int. J. Prod. Econ. 2010, 128, 332–338. [Google Scholar] [CrossRef]
- Vinzi, V.E.; Trinchera, L.; Amato, S. PLS path modeling: From foundations to recent developments and open issues for model assessment and improvement. In Handbook of Partial Least Squares; Springer: Berlin/Heidelberg, Germany, 2010; pp. 47–82. [Google Scholar]
- Wetzels, M.; Odekerken-Schröder, G.; Van, O.C. Using PLS path modeling for assessing hierarchical construct models: Guidelines and empirical illustration. MIS Q. 2009, 33, 177–195. [Google Scholar] [CrossRef]
- Akter, S.; Ambra, J.D.; Ray, R. An evaluation of PLS based complex models: The roles of power analysis, predictive relevance and GoF index. In Proceedings of the Seventeenth Americas Conference on Information Systems (AMCIS 2011), Detroit, MI, USA, 4–8 August 2011. [Google Scholar]
- Akter, S.; Ambra, J.D.; Ray, P. Trustworthiness in Health information services: An assessment of a hierarchical model with mediating and moderating effects using partial least squares (PLS). J. Am. Soc. Inf. Sci. Technol. 2011, 62, 100–116. [Google Scholar] [CrossRef] [Green Version]


| No. | Factors | Source |
|---|---|---|
| 1. | Government and non-government organization’s demand. (e.g., green label scheme) | [5,16,18] |
| 2. | Environmental regulation made obligatory by Government | [16,18,22,30,39] |
| 3. | Formation of standards (e.g., evaluation criteria, green specification, suppliers’ ISO 14000 certification) | [5,14,16,18,22,30,39] |
| 4. | Requirements of the client in the tender | [16,18,22,30] |
| 5. | Stakeholders’ mutual understanding between themselves on green procurement | [5,18,30] |
| 6. | Stakeholders’ mutual commitment between themselves on green procurement | [4,14,18,22,30,39] |
| 7. | Compliance, monitoring and audit on suppliers | [18,22] |
| 8. | Cooperation with stakeholders regarding the environment | [5,16,18,30,39] |
| 9. | Corporate environmental vision | [14,16,18,22,30] |
| 10. | Commitments by Executive management | [14,18,22,30,39] |
| 11. | Mid-level managers’ support | [14,18,22] |
| 12. | Business benefits understood properly | [14,18,22] |
| 13. | Staff training/green procurement program and sustainability policy by organization | [5,14,16,18,30,39] |
| 14. | Key staff’s incentive programs and implementation of green procurement goal to the job description | [16,18,22,39] |
| 15. | Availability of sustainability expertise and dedicated resources to support green procurement and decision making | [5,14,18,30,39] |
| 16. | Coordination within the department. (e.g., sustainability expertise and procurement staff) | [5,14,18,22,39] |
| 17. | System of continuous review, monitoring and tracking | [5,18] |
| 18. | International trends (e.g., customer awareness) | [5,14,16,18,22,30] |
| 19. | Strategies adopted by competitors | [16,18,22] |
| 20. | Strategies adopted by affiliated companies | [18] |
| 21. | Strategies adopted by other progressive companies. (within or outside your sector) | [16,18,39] |
| 22. | Schemes adopted by government (e.g., Housing Authority) | [5,16,18,30,39] |
| 23. | Green product’s information should be available from a reliable database | [18,30,39] |
| 24. | According to specifications, potential information from suppliers should be adopted carefully | [5,18,22,30] |
| 25. | Demands of green characteristics for performance-based specification should be clear | [16,18,39] |
| 26. | Green technology for construction purpose should be available | [5,14,18,22,30] |
| 27. | Project’s adequate life cycle should be considered | [5,18] |
| 28. | Selection of materials according to their recyclability | [14,18,22,30] |
| 29. | Selection of materials according to their low risks to the environment | [5,18,22,30,39] |
| 30. | For assessment of building’s green performance, facilities of cross-reference should be available (e.g., BEAM-Plus) | [16,18] |
| 31. | Model clauses of green specifications should be available | [14,16,18] |
| 32. | Green procedures or practices should be adopted. (e.g., waste management) | [5,14,18,22,30,39] |
| 33. | Product’s design according to its less consumption of material or energy | [14,16,18,22,30] |
| 34. | Designing products from recycled or reused material | [14,18,22,30] |
| Description | Frequency | Percentage |
|---|---|---|
| Academic Qualification | ||
| Bachelor of Engineering (B.E) | 45 | 58.4 |
| Diploma | 12 | 15.6 |
| Bachelor of Technology (B.Tech) | 1 | 1.3 |
| Master of Philosophy (M.Phil) | 1 | 1.3 |
| Master of Engineering (ME) | 18 | 23.4 |
| Size of Projects | ||
| Above 10 Million Rupees | 71 | 92.2 |
| Less than 10 Million Rupees | 6 | 7.8 |
| Experience | ||
| Less than 10 years | 35 | 45.46 |
| 10 to 20 Years | 23 | 29.87 |
| Above 20 Years | 19 | 24.67 |
| Working Position | ||
| Managerial Level | 23 | 29.87 |
| Engineering Level | 31 | 40.26 |
| Planners | 8 | 10.39 |
| Directors | 15 | 19.48 |
| Variables | Component | ||||
|---|---|---|---|---|---|
| 1 | 2 | 3 | 4 | 5 | |
| Formation of standards (e.g., evaluation criteria, green specification, suppliers’ ISO 14000 certification) | 0.789 | 0.134 | 0.041 | 0.112 | −0.021 |
| Requirements of the client in tender | 0.777 | 0.113 | −0.063 | 0.309 | 0.088 |
| Government and non-government organization’s demand (e.g., green label scheme) | 0.706 | 0.051 | 0.369 | 0.055 | 0.334 |
| Green procedures or practices should be adopted (e.g., waste management) | 0.696 | 0.375 | 0.229 | 0.028 | 0.152 |
| Designing products for recycling, reuse, component parts and recovery of material | 0.664 | 0.494 | 0.115 | −0.055 | 0.256 |
| Stakeholders’ mutual understanding between themselves on green procurement | 0.647 | 0.188 | 0.334 | 0.277 | 0.136 |
| Environmental regulation made obligatory by Government | 0.589 | −0.006 | 0.365 | 0.365 | 0.117 |
| Stakeholders’ mutual commitment between themselves on green procurement | 0.558 | 0.193 | 0.331 | 0.003 | 0.448 |
| Products being designed to alleviate or lower the environmental during construction | 0.383 | 0.726 | 0.044 | 0.125 | 0.099 |
| Mid-level managers’ support | 0.260 | 0.650 | −0.118 | 0.367 | 0.118 |
| Green product’s information should be available from reliable database | 0.072 | 0.615 | 0.120 | 0.615 | 0.326 |
| Business benefits understood properly | 0.225 | 0.527 | 0.286 | 0.398 | −0.051 |
| Selection of materials according to their recyclability | 0.177 | 0.510 | 0.187 | 0.287 | 0.262 |
| Demands of green characteristics for performance-based specification should be clear | 0.289 | 0.505 | 0.361 | 0.197 | 0.219 |
| Staff training/green procurement program and sustainability policy by organization | 0.322 | 0.474 | 0.146 | 0.167 | 0.226 |
| Project’s adequate life cycle should be considered | 0.107 | 0.179 | 0.743 | 0.230 | 0.185 |
| Corporate environmental vision | 0.383 | 0.168 | 0.680 | 0.180 | 0.196 |
| Green technology for construction purpose should be available | 0.134 | 0.358 | 0.678 | 0.314 | 0.087 |
| Cooperation with stakeholders regarding the environment | 0.213 | 0.262 | 0.553 | 0.162 | 0.551 |
| According to specifications potential information from suppliers should be adopted carefully | 0.076 | 0.242 | 0.532 | 0.354 | 0.258 |
| Coordination within department (e.g., sustainability expertise and procurement staff) | 0.236 | 0.353 | 0.530 | 0.202 | 0.139 |
| Commitments by Executive management | 0.455 | −0.021 | 0.519 | 0.270 | 0.327 |
| Compliance, monitoring and audit on suppliers | 0.356 | 0.138 | 0.028 | 0.825 | 0.072 |
| For assessment of building’s green performance, facilities of cross-reference should be available (e.g., BEAM-Plus) | 0.242 | 0.222 | 0.412 | 0.722 | 0.084 |
| Model clauses of green specifications should be available | 0.068 | 0.115 | 0.214 | 0.708 | 0.227 |
| Key staff’s incentive programs and implementation of green procurement goal to job description | 0.130 | 0.255 | 0.111 | 0.702 | 0.090 |
| System of continuous review, monitoring and tracking | 0.010 | 0.145 | 0.221 | 0.513 | 0.194 |
| Availability of sustainability expertise and dedicated resources to support green procurement and decision making | 0.404 | 0.342 | 0.377 | 0.439 | 0.257 |
| Schemes adopted by government (e.g., Housing Authority) | 0.147 | 0.053 | 0.141 | 0.298 | 0.800 |
| International trends (e.g., customer awareness) | 0.319 | 0.122 | 0.340 | 0.113 | 0.657 |
| Strategies adopted by other progressive companies (within or outside your sector) | 0.344 | 0.278 | 0.144 | 0.186 | 0.619 |
| Selection of materials according to their low risks to the environment | 0.104 | 0.474 | 0.193 | −0.119 | 0.617 |
| Strategies adopted by affiliated companies | 0.117 | 0.483 | 0.187 | 0.305 | 0.616 |
| Strategies adopted by competitors | 0.099 | 0.288 | 0.428 | 0.187 | 0.549 |
| Product’s design according to its less consumption of material or energy | 0.416 | 0.268 | 0.275 | 0.238 | 0.516 |
| Construct | Factor Code | Factor Loading |
|---|---|---|
| Government Policies and Stakeholder Commitment (GPSC) | GP01 | 0.789 |
| GP02 | 0.777 | |
| GP03 | 0.706 | |
| GP04 | 0.696 | |
| GP05 | 0.664 | |
| GP06 | 0.647 | |
| GP07 | 0.589 | |
| GP08 | 0.558 | |
| Organizational Support and Knowledge (OSK) | OSK01 | 0.726 |
| OSK02 | 0.65 | |
| OSK03 | 0.615 | |
| OSK04 | 0.527 | |
| OSK05 | 0.51 | |
| OSK06 | 0.505 | |
| Corporate factors (CP) | CP01 | 0.743 |
| CP02 | 0.68 | |
| CP03 | 0.678 | |
| CP04 | 0.553 | |
| CP05 | 0.532 | |
| CP06 | 0.53 | |
| CP07 | 0.519 | |
| Industry Awareness (IA) | IA01 | 0.825 |
| IA02 | 0.722 | |
| IA03 | 0.708 | |
| IA04 | 0.702 | |
| IA05 | 0.513 | |
| Market factors and Techniques (MFT) | MFT01 | 0.8 |
| MFT02 | 0.657 | |
| MFT03 | 0.619 | |
| MFT04 | 0.617 | |
| MFT05 | 0.616 | |
| MFT06 | 0.549 | |
| MFT07 | 0.516 |
| Constructs | Cronbach’s Alpha | Composite Reliability | Average Variance Extracted (AVE) |
|---|---|---|---|
| Corporate factors (CP) | 0.886 | 0.91 | 0.592 |
| Government Policies and Stakeholder Commitment (GPSC) | 0.92 | 0.934 | 0.64 |
| Industry Awareness (IA) | 0.854 | 0.893 | 0.626 |
| Market factors and Techniques (MFT) | 0.87 | 0.898 | 0.561 |
| Organizational Support and Knowledge | 0.901 | 0.921 | 0.662 |
| Construct | Variable | CP | GPSC | IA | MFT | OST |
|---|---|---|---|---|---|---|
| CP | CP01 | 0.783 | 0.513 | 0.606 | 0.668 | 0.627 |
| CP02 | 0.754 | 0.616 | 0.484 | 0.569 | 0.523 | |
| CP03 | 0.752 | 0.477 | 0.499 | 0.607 | 0.582 | |
| CP04 | 0.788 | 0.554 | 0.488 | 0.576 | 0.634 | |
| CP05 | 0.778 | 0.509 | 0.655 | 0.711 | 0.731 | |
| CP06 | 0.772 | 0.607 | 0.633 | 0.697 | 0.709 | |
| CP07 | 0.76 | 0.656 | 0.461 | 0.581 | 0.57 | |
| GP | GP01 | 0.461 | 0.766 | 0.395 | 0.425 | 0.464 |
| GP02 | 0.458 | 0.783 | 0.324 | 0.439 | 0.469 | |
| GP03 | 0.638 | 0.866 | 0.543 | 0.523 | 0.499 | |
| GP04 | 0.428 | 0.751 | 0.506 | 0.516 | 0.537 | |
| GP05 | 0.588 | 0.78 | 0.482 | 0.569 | 0.612 | |
| GP06 | 0.697 | 0.864 | 0.632 | 0.684 | 0.646 | |
| GP07 | 0.604 | 0.784 | 0.585 | 0.49 | 0.492 | |
| GP08 | 0.663 | 0.8 | 0.568 | 0.635 | 0.587 | |
| IA | IA01 | 0.49 | 0.616 | 0.841 | 0.613 | 0.535 |
| IA02 | 0.621 | 0.569 | 0.775 | 0.681 | 0.665 | |
| IA03 | 0.638 | 0.446 | 0.683 | 0.658 | 0.641 | |
| IA04 | 0.604 | 0.498 | 0.899 | 0.704 | 0.616 | |
| IA05 | 0.601 | 0.413 | 0.741 | 0.648 | 0.601 | |
| MFT | MFT01 | 0.606 | 0.419 | 0.499 | 0.671 | 0.484 |
| MFT02 | 0.584 | 0.569 | 0.551 | 0.794 | 0.558 | |
| MFT03 | 0.645 | 0.607 | 0.6 | 0.78 | 0.665 | |
| MFT04 | 0.562 | 0.489 | 0.674 | 0.722 | 0.589 | |
| MFT05 | 0.666 | 0.463 | 0.619 | 0.805 | 0.724 | |
| MFT06 | 0.716 | 0.528 | 0.744 | 0.857 | 0.684 | |
| MFT07 | 0.576 | 0.579 | 0.587 | 0.617 | 0.501 | |
| OSK | OSK01 | 0.573 | 0.58 | 0.51 | 0.527 | 0.766 |
| OSK02 | 0.692 | 0.522 | 0.431 | 0.601 | 0.754 | |
| OSK03 | 0.644 | 0.443 | 0.578 | 0.671 | 0.806 | |
| OSK04 | 0.686 | 0.571 | 0.664 | 0.754 | 0.838 | |
| OSK05 | 0.704 | 0.546 | 0.624 | 0.641 | 0.833 | |
| OSK06 | 0.716 | 0.618 | 0.727 | 0.726 | 0.878 |
| Constructs | CP | GPSC | IA | MFT | OSK |
|---|---|---|---|---|---|
| Corporate factors (CP) | 0.77 | ||||
| Government Policies and Stakeholder Commitment (GPSC) | 0.721 | 0.8 | |||
| Industry Awareness (IA) | 0.718 | 0.645 | 0.791 | ||
| Market factors and Techniques (MFT) | 0.825 | 0.682 | 0.749 | 0.817 | |
| Organizational Support and Knowledge | 0.819 | 0.679 | 0.748 | 0.806 | 0.814 |
| GoF GoF Criteria |
|---|
| GoF = √communalityXRsquare |
| Communality = 0.5 |
| R2 effect small = 0.02, Medium = 0.13, Large = 0.26 |
| Range of GoF values: |
| Thus |
| GoF = (0<GoF<1) |
| GoFSmall = √(0.5X 0.02) = 0.10 |
| GoFMedium = √(0.5X 0.13) = 0.25 |
| GoFLarge = √(0.5X 0.26) = 0.36 |
Publisher’s Note: MDPI stays neutral with regard to jurisdictional claims in published maps and institutional affiliations. |
© 2021 by the authors. Licensee MDPI, Basel, Switzerland. This article is an open access article distributed under the terms and conditions of the Creative Commons Attribution (CC BY) license (https://creativecommons.org/licenses/by/4.0/).
Share and Cite
Khahro, S.H.; Memon, A.H.; Memon, N.A.; Arsal, A.; Ali, T.H. Modeling the Factors Enhancing the Implementation of Green Procurement in the Pakistani Construction Industry. Sustainability 2021, 13, 7248. https://doi.org/10.3390/su13137248
Khahro SH, Memon AH, Memon NA, Arsal A, Ali TH. Modeling the Factors Enhancing the Implementation of Green Procurement in the Pakistani Construction Industry. Sustainability. 2021; 13(13):7248. https://doi.org/10.3390/su13137248
Chicago/Turabian StyleKhahro, Shabir Hussain, Aftab Hameed Memon, Nafees Ahmed Memon, Ali Arsal, and Tauha Hussain Ali. 2021. "Modeling the Factors Enhancing the Implementation of Green Procurement in the Pakistani Construction Industry" Sustainability 13, no. 13: 7248. https://doi.org/10.3390/su13137248
APA StyleKhahro, S. H., Memon, A. H., Memon, N. A., Arsal, A., & Ali, T. H. (2021). Modeling the Factors Enhancing the Implementation of Green Procurement in the Pakistani Construction Industry. Sustainability, 13(13), 7248. https://doi.org/10.3390/su13137248