
Assessment of Occupational Exposure to BTEX in a Petrochemical Plant via Urinary Biomarkers

 , ,
, , 
Abstract
:1. Introduction
2. Materials and Methods
2.1. Sample Collection and Exposure Assessment
2.2. Analysis of BTEX and Urine Biomarkers
2.3. Multivariate Analysis
2.4. Human Risk Assessment
3. Results
4. Discussion
4.1. Cancer Risk Assessment
4.2. Multivariate Analyses of BTEX and Urine Biomarkers
5. Conclusions
Author Contributions
Funding
Institutional Review Board Statement
Informed Consent Statement
Data Availability Statement
Conflicts of Interest
References
- Hazrati, S.; Rostami, R.; Fazlzadeh, M.; Pourfarzi, F. Benzene, toluene, ethylbenzene and xylene concentrations in atmospheric ambient air of gasoline and CNG refueling stations. Air Qual. Atmos. Health 2016, 9, 403–409. [Google Scholar] [CrossRef]
- European Commission (EC). Directive 2004/37/EC of the European Parliament and of the Council of 29 April 2004 on the Protection of Workers from the Risks Related to Exposure to Carcinogens or Mutagens at Work (Sixth Individual Directive within the Meaning of Article 16(1) of Council Directive 89/391/EEC). OJ L 229, pp. 23–34. Available online: https://eur-lex.europa.eu/LexUriServ/LexUriServ.do?uri=OJ:L:2004:229:0023:0034:EN:PDF (accessed on 22 April 2021).
- European Commission (EC). Directive 2000/39/EC of 8 June 2000 Establishing a First List of Indicative Occupational Exposure Limit Values in Implementation of Council Directive 98/24/EC on the Protection of the Health and Safety of Workers from the Risks Related to Chemical Agents at Work. OJ L 142, pp. 47–50. Available online: https://eur-lex.europa.eu/legal-content/EN/TXT/PDF/?uri=CELEX:32000L0039&from=en (accessed on 22 April 2021).
- European Commission (EC). Directive 2009/161/EU of 17 December 2009 Establishing a Third List of Indicative Occupational Exposure Limit Values in Implementation of Council Directive 98/24/EC and Amending Commission Directive 2000/39/EC. OJ L 338, pp. 87–89. Available online: https://eur-lex.europa.eu/legal-content/EN/TXT/PDF/?uri=CELEX:32009L0161&from=DA (accessed on 22 April 2021).
- Official Gazette of Republic of Serbia (OG RS). Policy on Preventive Measures for Safe and Health Work from the Risks Related to Chemical Agents; OG RS 106/2008: Belgrade, Serbia, 2008; pp. 1–16. [Google Scholar]
- Moridzadeh, M.; Dehghani, S.; Rafiee, A.; Hassanvand, M.S.; Dehghani, M.; Hoseini, M. Assessing BTEX exposure among workers of the second largest natural gas reserve in the world: A biomonitoring approach. Environ. Sci. Pollut. Res. Int. 2020, 27, 44519–44527. [Google Scholar] [CrossRef]
- Rafiee, A.; Delgado-Saborit, J.M.; Sly, P.D.; Amiri, H.; Hoseini, M. Lifestyle and occupational factors affecting exposure to BTEX in municipal solid waste composting facility workers. Sci. Total Environ. 2019, 15, 540–546. [Google Scholar] [CrossRef]
- OG RS 96/2011. Policy on Preventive Measures for Safe and Healthy Work when Exposed to Carcinogen or Mutagen; Official Gazette of Republic of Serbia (OG RS): Belgrade, Serbia, 2011; pp. 1–9.
- Tompa, A.; Mátyás, G.; Jakab, J.M. Risk management among benzene-exposed oil refinery workers. Int. J. Hyg. Environ. Health 2005, 208, 509–516. [Google Scholar] [CrossRef] [PubMed]
- Bolden, L.B.; Kwiatkowski, F.C.; Colbron, T. New Look at BTEX: Are Ambient Levels a Problem? Environ. Sci. Technol. 2015, 49, 5261–5276. [Google Scholar] [CrossRef]
- Manini, P.; De Palma, G.; Andreoli, R.; Poli, D.; Mozzoni, P.; Folesani, G.; Mutti, A.; Apostoli, P. Environmental and biological monitoring of benzene exposure in a cohort of Italian taxi drivers. Toxicol. Lett. 2006, 167, 142–151. [Google Scholar] [CrossRef] [PubMed]
- International Agency for Research on Cancer (IARC). IARC Monographs on the Evaluation of Carcinogenic Risks to Humans, Volume 100F; IARC: Lyon, France, 2012; pp. 249–295. [Google Scholar]
- Arnold, S.M.; Angerer, J.; Boogaard, P.J.; Hughes, M.F.; O’Lone, R.B.; Robison, S.H.; Schnatter, A.R. The use of biomonitoring data in exposure and human health risk assessment: Benzene case study. Crit. Rev. Toxicol. 2013, 43, 119–153. [Google Scholar] [CrossRef] [Green Version]
- USEPA. Supplementary Guidance for Conducting Health Risk Assessment of Chemical Mixtures; U.S. Environmental Protection Agency: Washington, DC, USA, 2000.
- World Health Organization. Air Quality Guidelines (Chapter 5.2 Benzene), 2nd ed.; WHO Regional Office for Europe: Copenhagen, Denmark, 2000. [Google Scholar]
- USEPA. Integrated Risk Information System (IRIS) on Benzene; National Center for Environmental Assessment, Office of Research and Development: Washington, DC, USA, 2002.
- USEPA. Risk Assessment Guidance for Superfund Volume I: Human Health Evaluation Manual (Part F, Supplemental Guidance for Inhalation Risk Assessment, EPA-540-r-070e002); Office of Superfund Remediation and Technology Innovation Environmental Protection Agency: Washington, DC, USA, 2010.
- USEPA. Integrated Risk Information System (IRIS); U.S. Environmental Protection Agency: Washington, DC, USA, 2011. Available online: http://www.epa.gov/IRIS/ (accessed on 27 April 2021).
- Edokpolo, B.; Yu, Q.J.; Connell, D. Health Risk Assessment for Exposure to Benzene in Petroleum Refinery Environments. Int. J. Environ. Res. Public Health 2015, 12, 595–610. [Google Scholar] [CrossRef] [PubMed] [Green Version]
- National Institute for Occupational Safety and Health (NIOSH). Manual of Analytical Methods Method 1501, Hydrocarbons, Aromatic, Issue 3; U.S. Department of Health and Human Services: Washington, DC, USA, 2003.
- National Institute for Occupational Safety and Health (NIOSH). Method 8305 for Phenol and p-Cresol in Urine, Issue Manual of Analytical Methods; U.S. Department of Health and Human Services: Washington, DC, USA, 1994.
- Schettgen, T.; Alt, A.; Dewes, P.; Kraus, T. Simple and sensitive GC/MS-method for the quantification of urinary phenol, o- and m-cresol and ethylphenols as biomarkers of exposure to industrial solvents. J. Chromatogr. B Anal. Technol. Biomed. Life Sci. 2015, 15, 93–100. [Google Scholar] [CrossRef]
- National Institute for Occupational Safety and Health (NIOSH). Method 8300 for Hippuric Acid in Urine, Issue 2, Manual of Analytical Methods; U.S. Department of Health and Human Services: Washington, DC, USA, 1995.
- Kaiser, H.F. The application of electronic computers to factor analysis. Educ. Psychol. Meas. 1960, 20, 141–151. [Google Scholar] [CrossRef]
- Melikian, A.A.; Qu, Q.; Shore, R.; Li, G.; Li, H.; Jin, X.; Cohen, B.; Chen, L.; Li, Y.; Yin, S.; et al. Personal exposure to different levels of benzene and its relationships to the urinary metabolites S-phenylmercapturic acid and trans,trans-muconic acid. J. Chromatogr. B 2002, 778, 211–221. [Google Scholar] [CrossRef]
- Inoue, O.; Seiji, K.; Watanabem, T.; Kasahara, M.; Nakatsuka, H.; Yin, S.; Li, G.; Cai, S.; Jin, C.; Ikeda, M. Mutual metabolic suppression between benzene and toluene in man. Arch. Occup. Environ. Heath 1988, 60, 15–20. [Google Scholar] [CrossRef]
- Qu, Q.; Melikian, A.A.; Li, G.; Shore, R.; Chen, L.; Cohen, B.; Yin, S.; Kagan, M.R.; Li, H.; Meng, M.; et al. Validation of biomarkers in humans exposed to benzene: Urine metabolites. Am. J. Ind. Med. 2000, 37, 522–531. [Google Scholar] [CrossRef]
- Carrieri, M.; Tranfo, G.; Pigini, D.; Paci, E.; Salamon, F.; Scapellato, M.L.; Fracasso, M.E.; Manno, M.; Bartolucci, G.B. Correlation between environmental and biological monitoring of exposure to benzene in petrochemical industry operators. Toxicol. Lett. 2010, 192, 17–21. [Google Scholar] [CrossRef] [PubMed]
- Waidyanatha, S.; Rothman, N.; Fustinoni, S.; Smith, M.T.; Hayes, R.B.; Bechtold, W.; Dosemeci, M.; Guilan, L.; Yin, S.; Rappaport, S.M. Urinary benzene as a biomarker of exposure among occupationally exposed and unexposed subjects. Carcinogenesis 2001, 22, 279–286. [Google Scholar] [CrossRef] [PubMed] [Green Version]
- Manini, P.; De Palma, G.; Andreoli, R.; Poli, D.; Petyx, M.; Corradi, M.; Mutti, A.; Apostoli, P. Biological monitoring of low benzene exposure in Italian traffic policemen. Toxicol. Lett. 2008, 181, 25–30. [Google Scholar] [CrossRef]
- Kivistö, H.; Pekari, K.; Peltonen, K.; Svinhufvud, J.; Veidebaum, T.; Sorsa, M.; Aitio, A. Biological monitoring of exposure to benzene in the production of benzene and in a cokery. Sci. Total Environ. 1997, 199, 49–63. [Google Scholar] [CrossRef]
- Navasumrit, P.; Chanvaivit, S.; Intarasunanont, P.; Arayasiri, M.; Lauhareungpanya, N.; Parnlob, V.; Settachan, D.; Ruchirawat, M. Environmental and occupational exposure to benzene in Thailand. Chem. Biol. Interact. 2005, 153–154, 75–83. [Google Scholar] [CrossRef]
- Mirkova, E.; Lalchev, S.; Alexandrova, E.; Antov, G.; Panev, T.; Tchohadjieva, D.; Gavrilova, N. Cytogenetic effects in lymphocytes of Bulgarian petroleum refinery workers chronically exposed to benzene: Comparisons of the cytokinesis—Block micronucleus assay and metaphase chromosome analysis. Eur. J. Genet. Mol. Toxicol. 1999, 1999, 1–25. [Google Scholar]
- Lovreglio, P.; Barbieri, A.; Carrieri, M.; Sabatini, L.; Fracasso, M.E.; Doria, D.; Drago, I.; Basso, A.; D’Errico, M.N.; Bartolucci, G.B.; et al. Validity of new biomarkers of internal dose for use in the biological monitoring of occupational and environ-mental exposure to low concentrations of benzene and toluene. Int. Arch. Occup. Environ. Health 2010, 83, 341–356. [Google Scholar] [CrossRef]
- Rekhadevi, P.V.; Rahman, M.F.; Mahboob, M.; Grover, P. Geno-toxicity in filling station attendants exposed to petroleum hydrocarbons. Ann. Occup. Hyg. 2010, 54, 944–954. [Google Scholar] [CrossRef] [Green Version]
- Pierce, C.H.; Chen, Y.L.; Dills, R.L.; Kalman, D.A.; Morgan, M.S. Toluene metabolites as biological indicators of exposure. Toxicol. Lett. 2002, 129, 65–76. [Google Scholar] [CrossRef]
- Inoue, O.; Kannoa, E.; Kasaia, K.; Ukaib, H.; Okamotob, S.; Ikedab, M. Benzylmercapturic acid is superior to hippuric acid and o-cresol as a urinary marker of occupational exposure to toluene. Toxicol. Lett. 2004, 147, 177–186. [Google Scholar] [CrossRef]
- Periago, J.F.; Prado, C. Evolution of occupational exposure to environmental levels of aromatic hydrocarbons in service stations. Ann. Occup. Hyg. 2005, 49, 233–240. [Google Scholar] [CrossRef] [PubMed] [Green Version]
- Ukai, H.; Kawai, T.; Inoue, O.; Maejima, Y.; Fukui, Y.; Ohashi, F.; Okamoto, S.; Takada, S.; Sakurai, H.; Ikeda, M. Comparative evaluation of biomarkers of occupational exposure to toluene. Int. Arch. Occup. Environ. Health 2007, 81, 81–93. [Google Scholar] [CrossRef] [PubMed]
- Truchon, G.; Tardif, R.; Brodeur, J. O-cresol: A good indicator of exposure to low levels of toluene. Appl. Occup. Environ. Hyg. 1999, 14, 677–681. [Google Scholar] [CrossRef]
- Chalbot, M.C.; Vei, I.C.; Kavouras, I.G.; Bartzis, I. Effects of smoking on the levels of urinary biomarkers of aromatic hydrocarbons in oil refinery workers. Stoch. Environ. Res. Risk Assess. 2012, 26, 731–738. [Google Scholar] [CrossRef]
- Carrieri, M.; Bonfiglio, E.; Scapellato, M.L.; Maccà, I.; Tranfo, G.; Faranda, P.; Paci, E.; Bartolucci, G.B. Comparison of exposure assessment methods in occupational exposure to benzene in gasoline filling-station attendants. Toxicol. Lett. 2006, 162, 146–152. [Google Scholar] [CrossRef] [PubMed]
- Fustinoni, S.; Rossella, F.; Campo, L.; Mercadante, R.; Bertazzi, P.A. Urinary BTEX, MTBE and naphthalene as biomarkers to gain environmental exposure profiles of the general population. Sci. Total Environ. 2010, 15, 2840–2849. [Google Scholar] [CrossRef] [PubMed]
- Tunsaringkarn, T.; Siriwong, W.; Rungsiyothin, A.; Nopparatbundit, S. Occupational exposure of gasoline station workers to BTEX compounds in Bangkok, Thailand. Int. J. Occup. Environ. Med. 2012, 3, 117–125. [Google Scholar]
- Mrdjanović, J.; Šolajić, S.; Dimitrijević, S.; Đan, I.; Nikolić, I.; Jurišić, V. Assessment of micronuclei and sister chromatid exchange frequency in the petroleum industry workers in province of Vojvodina, Republic of Serbia. Food Chem. Toxicol. 2014, 69, 63–68. [Google Scholar] [CrossRef] [PubMed]
- Moolla, R.; Curtis, C.J.; Knight, J. Occupational exposure of diesel station workers to BTEX compounds at a bus depot. Int. J. Environ. Res. Public Health 2015, 12, 4101–4115. [Google Scholar] [CrossRef] [PubMed] [Green Version]
- Hopf, N.B.; Kirkeleit, J.; Bratveit, M.; Succop, P.; Talaska, G.; Moen, B.E. Evaluation of exposure biomarkers in offshore workers exposed to low benzene and toluene concentrations. Int. Arch. Occup. Environ. Health 2012, 85, 261–271. [Google Scholar] [CrossRef] [PubMed] [Green Version]
- Popitanu, C.; Cioca, G.; Copolovici, L.; Iosif, D.; Munteanu, F.-D.; Copolovici, D. The Seasonality Impact of the BTEX Pollution on the Atmosphere of Arad City, Romania. Int. J. Environ. Res. Public Health 2021, 18, 4858. [Google Scholar] [CrossRef] [PubMed]


| Workplace | Task (Job Description) | Exposure to BTEX |
|---|---|---|
| Production process supervisor | Performing basic diagnostic tests, checking the performance of machines after replacement or repair | High |
| Steam and turbine compressor operator | Performing basic diagnostic tests, checking the performance of steam and turbine compressors to obtain high-pressure steam for the production process, sealing and repairing the high-pressure pipeline | High |
| Fraction operator | Monitoring of the fractionation process parameters | High |
| Field man | Daily maintenance works according to schedules in the field, patrolling the plant sites for dissembling or assembling tasks | High |
| Warehouse and manipulation engineer | Operating pumps for transporting fluid, measuring levels of raw materials in storage tanks, open pipeline valves, patrolling the warehouse equipment (storage tanks and pipelines) | High |
| Mechanical engineer | Monitoring equipment and machines at the plant, testing damaged machine parts to determine the level of repair necessary, reparation and replacement | High |
| Working shift manager | Patrolling the production units and managing the optimal production process during the shift | High |
| System maintenance and repair engineer | Cutting, threading, grooving, bending, and welding of the high-pressure pipeline and tanks, repairs according to the schedule | High |
| Board man | Process system control | High |
| Petrol hydrogenation | Monitoring operation parameters on the section, opening of the valve block at a specific point, required to maintain optimum production | High |
| Raw materials and product chief | Responsible for receipt and delivery of raw materials and final products | High |
| Plant supervisor for machines and equipment | Monitoring the cutting, threading, grooving, bending, and welding of the high-pressure pipeline and tank repair | High |
| Accountant | Dealing with financial issues | Low |
| Plant manager | Low | |
| Deputy plant manager | Occasional visits to the plant, carrying out tasks according to work systematization | Low |
| Safety manager | In charge of occupational safety and health for the company, occasional on-site visits | Low |
| Legal officer | In charge of legal issues in the company | Low |
| Quality manager | Monitoring implementation of standards and improvement of product quality | Low |
| Sales manager | In charge of the relationship with customers and ensuring customer satisfaction | Low |
| Investment and development manager | In charge of development and innovation of the plant and processes | Low |
| Deputy manager for production | Occasional visits to plant to ensure implementation of standards, planning and monitoring of maintenance tasks | Low |
| Typist | Low | |
| Helper | Low | |
| Fire safety officer | In charge of fire safety and protection | Low |
| Parameter | Unit | Value |
|---|---|---|
| Pollutant concentration (C) | mg m−3 | - |
| Inhalation rate (IRa) | m3 h−1 | 0.83 |
| Exposure duration adult (EDa) | Hour day−1 | 8 |
| Body weight, adult (BWa) | kg | 70 |
| Days per week exposure (D) | Day | 5 |
| Weeks of exposure (Wk) | Week | 48 |
| Years of exposure (YE) | Years | 30 |
| Years in lifetime (YL) | Years | 70 |
| Slope factor | mg kg−1 day−1 | 0.029 |
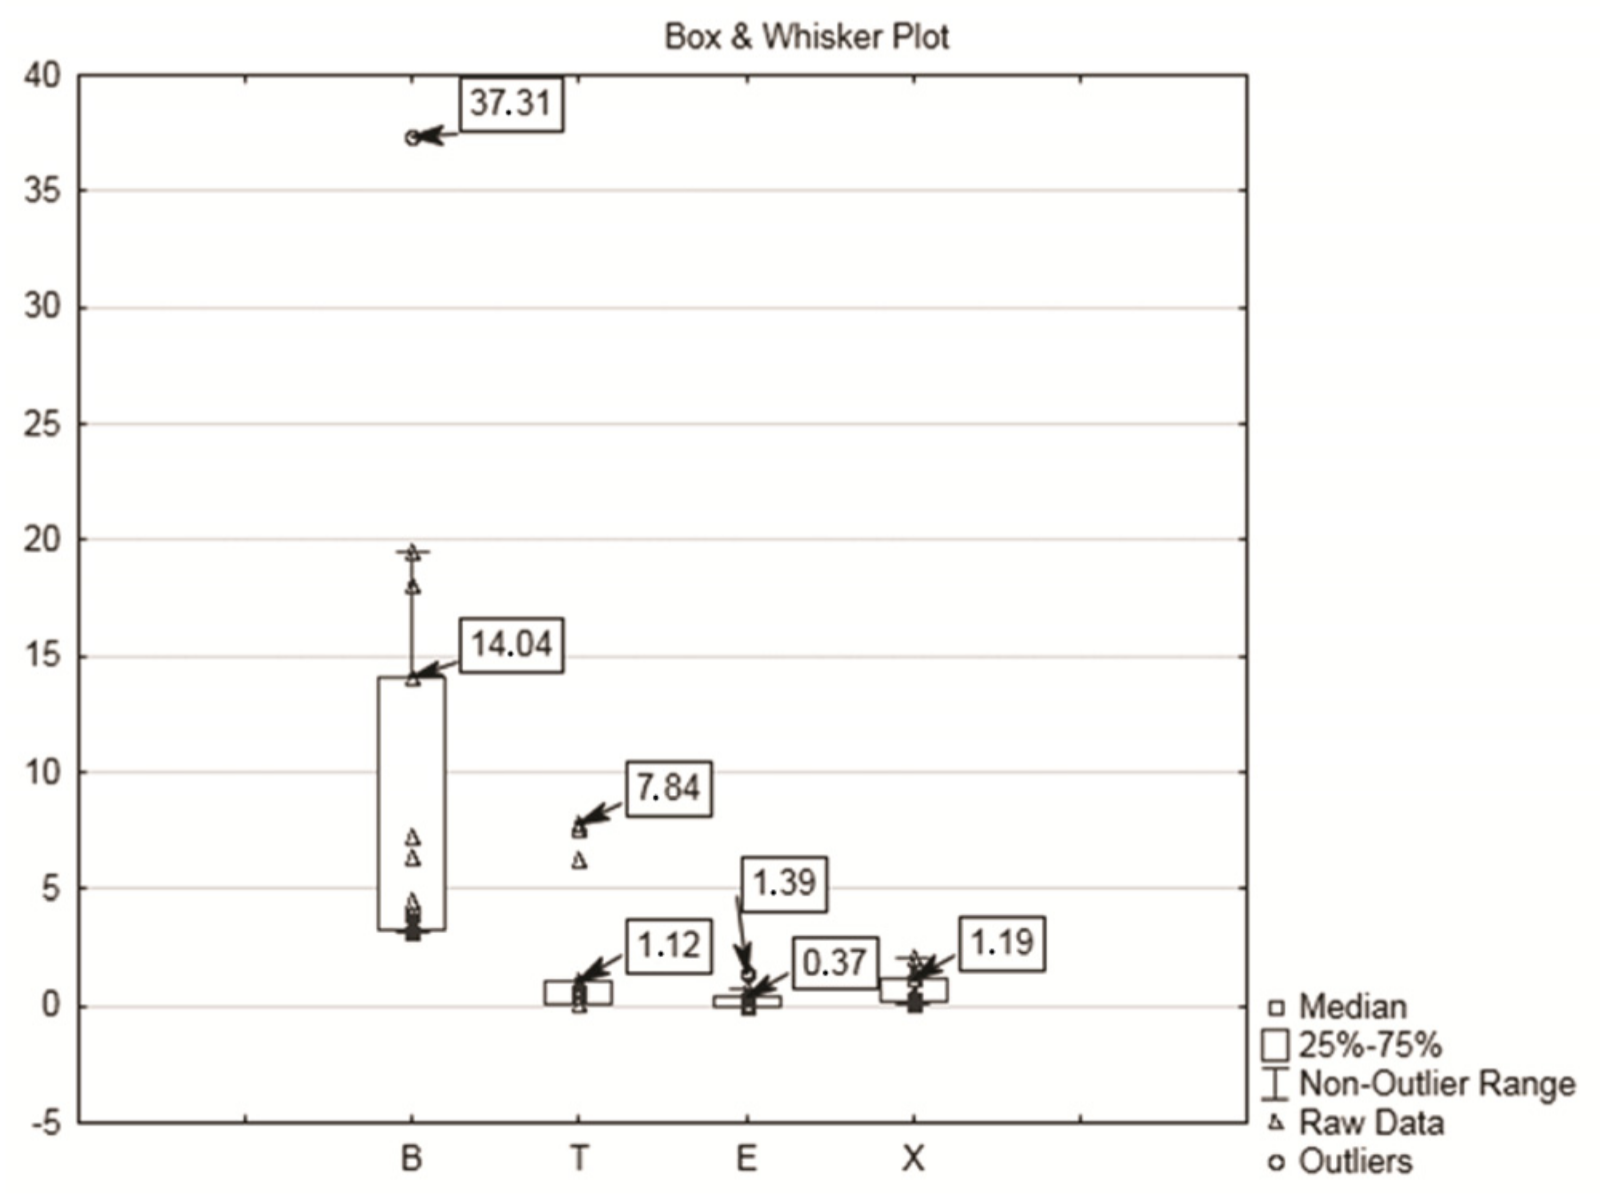
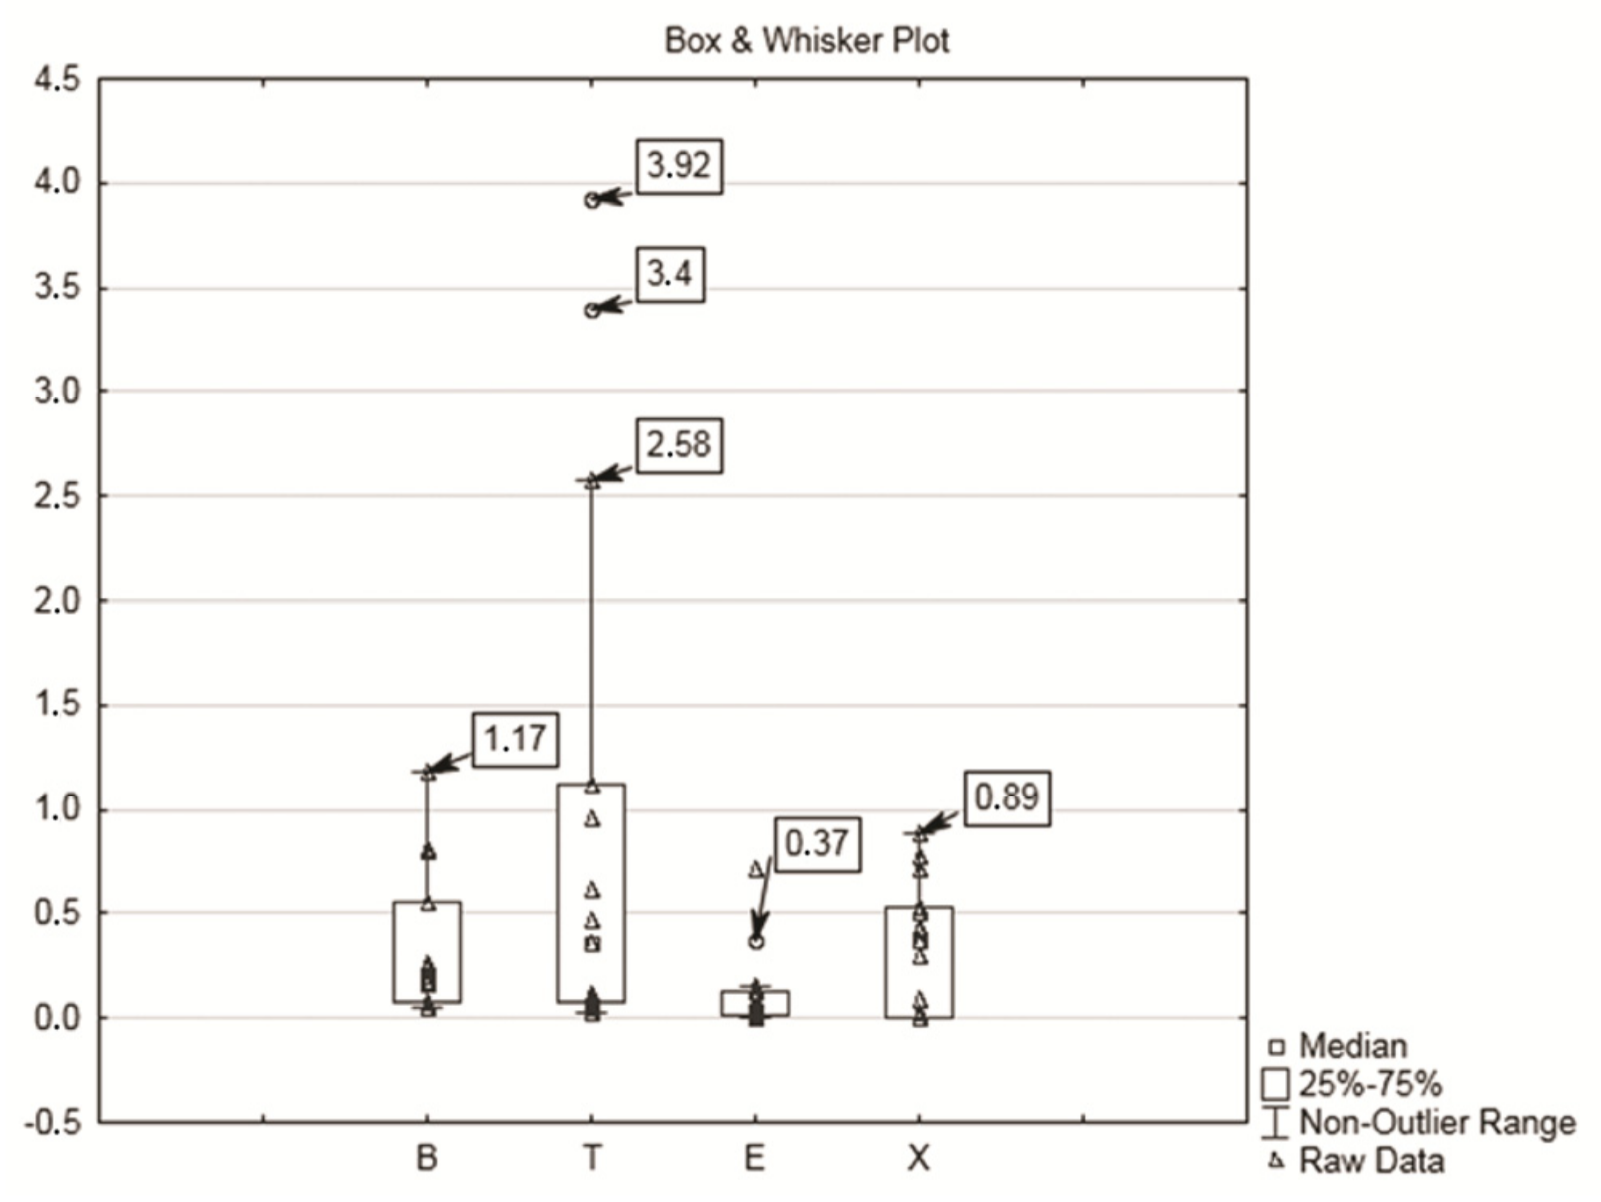
| BTEX from Ambient Air | Exposure Groups | Investigation Data (mg m−3) | Relevant Comparison Data | ||||||
|---|---|---|---|---|---|---|---|---|---|
| Minimum | Maximum | Mean | SD | RSD | OEL Values | ||||
| Benzene | High | 3.18 | 32.11 | 10.1 | 10.36 | 100.11 | 3.25 | ||
| Low | 0.07 | 1.18 | 0.39 | 0.36 | 90.49 | ||||
| Toluene | High | 0.06 | 7.84 | 1.78 | 2.87 | 160.95 | 192 | ||
| Low | 0.03 | 3.92 | 0.93 | 1.30 | 139.56 | ||||
| Ethylbenzene | High | 0.05 | 1.56 | 0.33 | 0.51 | 155.61 | 442 | ||
| Low | 0.02 | 0.71 | 0.14 | 0.21 | 153.37 | ||||
| Xylene | High | 0.06 | 2.02 | 0.60 | 0.63 | 104.37 | 221 | ||
| Low | 0.04 | 0.89 | 0.42 | 0.29 | 67.89 | ||||
| Urine biomarkers | Control group mean values | BEI values | |||||||
| Phenol | mg g−1 of creatinine | High | 0.78 | 100.9 | 14.03 | 12.20 | 86.74 | 2.77 | 250 |
| Low | 0.43 | 33.48 | 12.63 | 25.30 | 200.32 | ||||
| Hippuric acid | mg g−1 of creatinine | High | 20.67 | 143 | 70.63 | 37.97 | 53.97 | 2.41 | 1.60 |
| Low | 0.37 | 73.2 | 20.43 | 18.38 | 90.06 | ||||
| o-Cresol | mg g−1 of creatinine | High | 0.01 | 0.79 | 0.12 | 0.22 | 183.33 | n.d. | 0.3 |
| Low | 0.01 | 0.2 | 0.02 | 0.04 | 0.1 | ||||
| p-Cresol | mg g−1 of creatinine | High | 1.27 | 9.55 | 3.35 | 2.42 | 72.24 | 5.30 | n.a. |
| Low | 0.87 | 4.40 | 2.44 | 1.13 | 46.36 | ||||
| Creatinine | dL−1 | High | 0.90 | 2.60 | 1.69 | 0.50 | 29.91 | 2.03 | - |
| Low | 0.64 | 2.66 | 1.49 | 0.50 | 33.70 | ||||
| Workplace | Benzene Concentration (mg m−3) | E (mg kg−1 day−1) | EL (mg kg−1 day−1) | Cancer Risk |
|---|---|---|---|---|
| Steam and turbine compressor operator | 37.31 | 3.303 | 0.778 | 2.26 × 10⁻² |
| Raw materials and final product engineer | 19.44 | 1.721 | 0.405 | 1.18 × 10⁻² |
| Field man | 18.06 | 1.599 | 0.377 | 1.09 × 10⁻² |
| Mechanical engineer | 14.04 | 1.243 | 0.293 | 8.49 × 10⁻³ |
| Warehouse operator | 7.23 | 0.640 | 0.151 | 4.37 × 10⁻³ |
| System maintenance and repair workers | 6.35 | 0.562 | 0.132 | 3.84 × 10⁻³ |
| Supervisor for machines and equipment | 4.46 | 0.395 | 0.093 | 2.69 × 10⁻³ |
| Production process supervisor | 3.96 | 0.350 | 0.083 | 2.39 × 10⁻³ |
| Shift manager | 3.61 | 0.319 | 0.075 | 2.18 × 10⁻³ |
| Fractionator operator | 3.37 | 0.295 | 0.069 | 2.04 × 10⁻³ |
| Boardman | 3.33 | 0.286 | 0.067 | 2.01 × 10⁻³ |
| Petrol hydrogenation operator | 3.30 | 0.281 | 0.066 | 2.00 × 10⁻³ |
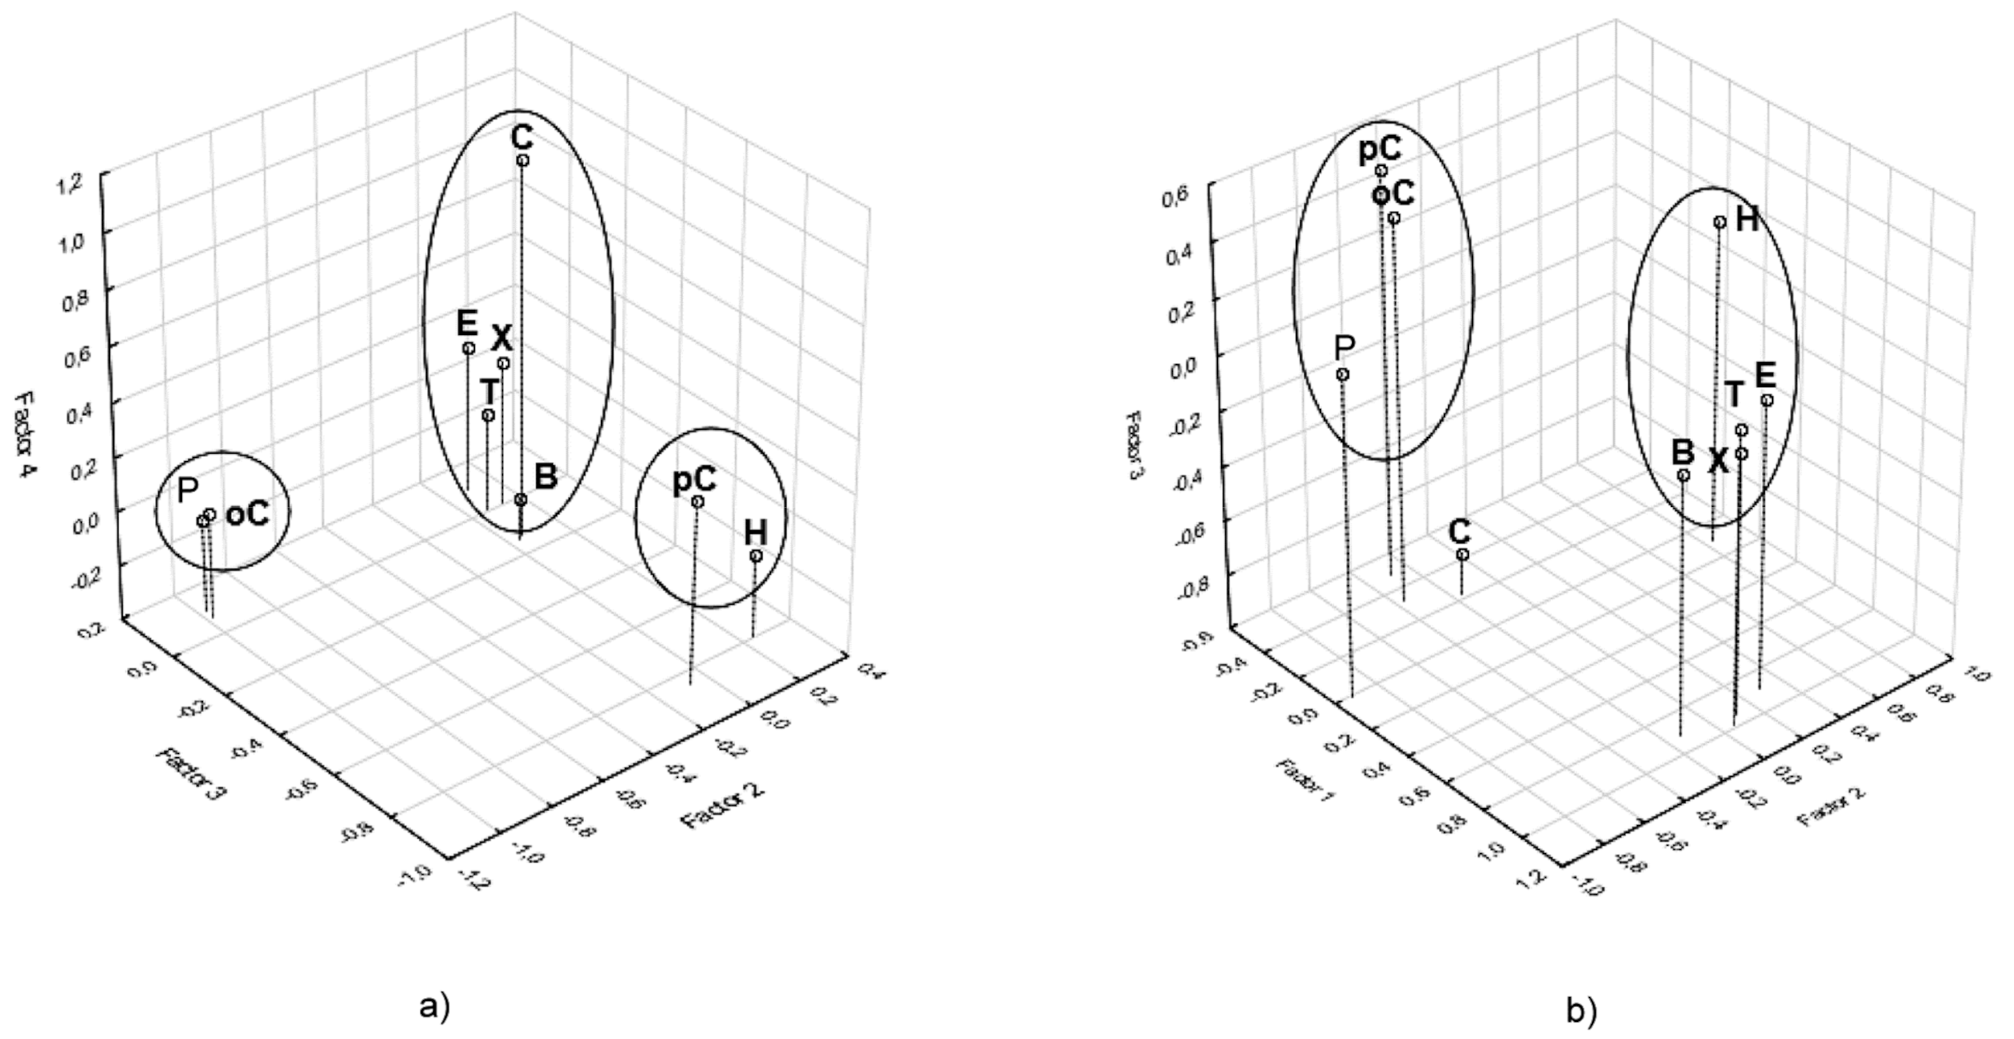
| Variable | Low-Exposure Group | High-Exposure Group | |||||
|---|---|---|---|---|---|---|---|
| HF1 | HF2 | HF3 | HF4 | WF1 | WF2 | WF3 | |
| B | 0.891 | 0.039 | −0.142 | −0.242 | 0.918 | −0.143 | −0.047 |
| T | 0.991 | 0.072 | 0.008 | −0.036 | 0.988 | 0.066 | 0.067 |
| E | 0.927 | 0.091 | 0.102 | 0.151 | 0.892 | 0.298 | 0.059 |
| X | 0.951 | 0.131 | 0.003 | 0.140 | 0.943 | 0.118 | −0.049 |
| C | 0.034 | 0.058 | −0.129 | 0.981 | −0.230 | −0.159 | −0.845 |
| H | 0.093 | 0.247 | −0.801 | −0.090 | 0.103 | 0.844 | 0.191 |
| P | −0.124 | −0.981 | 0.070 | −0.006 | 0.011 | −0.927 | 0.178 |
| oC | −0.085 | −0.972 | 0.102 | −0.060 | −0.336 | −0.364 | 0.403 |
| pC | −0.094 | −0.069 | −0.851 | 0.277 | −0.482 | −0.291 | 0.486 |
| Eigenvalue | 3.77 | 2.02 | 1.39 | 1.00 | 4.14 | 1.74 | 1.17 |
| % Total variance | 41.9 | 22.5 | 15.39 | 11.1 | 45.9 | 19.3 | 13.0 |
| Cumulative % variance | 41.9 | 64.3 | 79.73 | 90.9 | 45.9 | 65.3 | 78.2 |
Publisher’s Note: MDPI stays neutral with regard to jurisdictional claims in published maps and institutional affiliations. |
© 2021 by the authors. Licensee MDPI, Basel, Switzerland. This article is an open access article distributed under the terms and conditions of the Creative Commons Attribution (CC BY) license (https://creativecommons.org/licenses/by/4.0/).
Share and Cite
Mihajlović, V.; Grba, N.; Suđi, J.; Eichert, D.; Krajinović, S.; Gavrilov, M.B.; Marković, S.B. Assessment of Occupational Exposure to BTEX in a Petrochemical Plant via Urinary Biomarkers. Sustainability 2021, 13, 7178. https://doi.org/10.3390/su13137178
Mihajlović V, Grba N, Suđi J, Eichert D, Krajinović S, Gavrilov MB, Marković SB. Assessment of Occupational Exposure to BTEX in a Petrochemical Plant via Urinary Biomarkers. Sustainability. 2021; 13(13):7178. https://doi.org/10.3390/su13137178
Chicago/Turabian StyleMihajlović, Višnja, Nenad Grba, Jan Suđi, Diane Eichert, Smilja Krajinović, Milivoj B. Gavrilov, and Slobodan B. Marković. 2021. "Assessment of Occupational Exposure to BTEX in a Petrochemical Plant via Urinary Biomarkers" Sustainability 13, no. 13: 7178. https://doi.org/10.3390/su13137178
APA StyleMihajlović, V., Grba, N., Suđi, J., Eichert, D., Krajinović, S., Gavrilov, M. B., & Marković, S. B. (2021). Assessment of Occupational Exposure to BTEX in a Petrochemical Plant via Urinary Biomarkers. Sustainability, 13(13), 7178. https://doi.org/10.3390/su13137178