Article

Soil Health Beneath Amended Switchgrass: Effects of Biochar and Nitrogen on Active Carbon and Wet Aggregate Stability

Department of Agricultural and Environmental Sciences, Tennessee State University, Nashville, TN 37209, USA
*
Author to whom correspondence should be addressed.
Sustainability 2021, 13(13), 7176; https://doi.org/10.3390/su13137176
Submission received: 20 April 2021 / Revised: 11 June 2021 / Accepted: 18 June 2021 / Published: 25 June 2021

Abstract

:
Perennial crops, like switchgrass (Panicum virgatum L.), are important for bioenergy production and long-term carbon sequestration. Biochar, a byproduct of certain bioenergy production processes, is also identified as a potential tool for carbon sequestration and soil quality improvements, especially in marginal soils. Despite the focus on switchgrass, soil health characteristics under switchgrass production for biomass are unclear. This study focused on identifying the effects of four N rates (0, 17, 34, and 67 kg N ha−1) and biochar application (0 and 9 Mg ha−1) in a 3-year switchgrass field study on a silt loam soil. Soil active carbon (AC) and wet aggregate stability (WAS) were the indicators used to assess soil health. Our results indicated a decline in both AC and WAS over the study period, similar to other studies. Wet aggregate stability declined from 32% in 2018 to 15% in 2019. There were some significant differences between treatments, but no defined trends were observed. A decline in AC from 301 mg C kg soil−1 to 267 mg C kg soil−1 was also observed over the three-year period. Nitrogen rate also affected AC in the last year of study. Several possible explanations for the observed changes are proposed; however, a definitive mechanism is still unknown, thus future research is essential to improve our understanding and provide wider acceptance.

1. Introduction

Biofuels are considered an important component to reach the renewable energy goals of the United States; however, the sustainability of biofuel crop production remains questionable [1,2,3]. Switchgrass (Panicum virgatum L.) production as a lignocellulosic feedstock has received much attention as a way to achieve the 30 × 30 target for replacing 30% of fossil fuel with biofuels [4]. Since large areas of land will be needed for switchgrass production to meet such goals, it is important to understand its impact on soil health to maintain its sustainability. Several studies indicate the impacts of perennial grass production on soil properties; however, these studies have mainly focused on their carbon sequestration potential and soil fertility characteristics [5,6]. Evaluation of the sustainability of switchgrass production practices and assessment of soil health using various indicators of soil quality are needed.
Soil health or quality can be assessed by making observations and measurements of various soil processes and properties called soil health indicators [7]. These indicators can help assess soil health by linking functional relationships of different soil characteristics and correlating their changes with changes in land management and environmental impacts [8]. Soil aggregate stability and active carbon content are key indicators of soil health and the environmental sustainability of various agricultural management practices [9].
Active carbon is a small but relatively labile portion of soil organic matter, which is readily available as a food source for soil microbes and, therefore, helps maintain a healthy soil food web [10]. Since active carbon serves as a food or energy source for the soil microbial population, it is positively correlated with other soil indicators like organic matter, aggregate stability, microbial biomass, and respiration. Studies have demonstrated that active carbon is a “leading indicator” to understand responses to modifications in crop and soil management. Additionally, its response to management processes occurs much sooner (usually years sooner) in comparison to total organic matter content [7]. According to Weil et al. [11], fractions of soil organic carbon (SOC) that represent the active C pool, and serve as sensitive indicators of changes in management-induced soil quality, including microbial biomass C [12,13], particulate organic matter [14,15], and soil carbohydrates measured as anthrone-reactive C [16,17]. Based on the Cornell CASH protocol, the active carbon content can lead to a long-term increase in the total organic matter of soil through management practices such as low tillage and the addition of organic matter from various sources [10].
Wet aggregate stability is the ability of soil aggregates to resist disruption when outside forces are applied (i.e., rain drop action) [10]. It measures the physical ability of a soil to maintain its structure and aggregation under high rainfall conditions or where rapid wetting (like irrigation) occurs after a long dry period. Wet aggregate stability is considered a good indicator for assessing both the physical and biological status of the soil. Studies have shown that soils with low aggregate stability often form surface crusts and compacted surface layers, which can result in negative impacts on seed germination, soil air exchange, low water infiltration, and water holding capacity. This can lead to runoff, erosion, and flooding risks downstream during heavy rainfall, and a higher risk of drought stress later. Low aggregate stability also leads to difficulties in draining excess water making field management difficult [7,10].
Biochar is a carbon-rich, porous byproduct from heating natural organic materials in a relatively low temperature and low oxygen process known as pyrolysis [18]. Biochar is a more stable form of charcoal and difficult to break, which means it can remain in soils for hundreds to thousands of years [19]. Lately, the addition of biochar as a soil amendment has been gaining immense attention due to its soil sequestration properties and improvements in soil health [20]. Biochar is believed to have several soil health-related benefits including C sequestration, bioenergy generation, reduction of nitrous oxide emissions from agricultural soils, and stimulation of soil microbial activity, sorption of pesticides and nutrients, improvement in soil structure and water holding capacity, and control of soil-borne diseases [21].
Research on soil aggregate stability in biochar amended soils is insufficient to make conclusions [22]. Some studies have shown a positive correlation between biochar application and soil aggregation. Ma et al. [23] reported an increase in soil aggregate stability and water availability in a Mollisol after three years of biochar application; however, the field was intensively cultivated for at least 50 years before the experiment. In another study, Busscher et al. [24] reported an increase in aggregation by mixing biochar from pecan with switchgrass biomass (ground to pass 6 mm sieve); however, the aggregation was significantly lower when soil was treated with biochar only and not mixing with switchgrass. From such results, Mukherjee and Lal [22] concluded that a positive effect on soil aggregate stability would require the presence of a substrate (i.e., switchgrass) along with biochar as an amendment. The contrasting results from various studies clearly indicate the need for more research regarding how biochar affects aggregation and if another substrate, plant-roots, mycorrhizal fungi, or active C source might be needed to increase aggregate stability in biochar-amended soils.
The continuous focus on converting marginal and agricultural lands to the production of switchgrass and other bioenergy crops validates the need to study the impact of switchgrass systems on soil health. Current research on switchgrass focus on its potential as a bioenergy crop and SOC sequestration, but not on soil health. Moreover, studies on the effect of switchgrass on soil physical properties are short-term (<5 years) and the results from these studies have contrasting results [25,26]. Data on soil health indicators, such as aggregate stability and active carbon, can be useful input parameters for process-based models, which are designed to understand the potential of switchgrass and other bioenergy crops to improve soil quality. Since biochar addition to soil is irreversible, it is very important to have a complete understanding of the mechanisms of biochar interaction with soil under different scenarios over time, before large scale application of biochar to agricultural land is fully exploited [21].
Thus, the objective of this project was to determine the changes in soil aggregate stability and active carbon over time as a response to different nitrogen and biochar treatments in a switchgrass production system.

2. Materials and Methods

2.1. Field Methods

The experiment was conducted at the Tennessee State University Agricultural Research and Education Center located in Ashland City, TN. The switchgrass research plot was established on a Lindside silt loam soil (Fine-silty, mixed, active, mesic, fluvaquentic Eutrudepts, occasionally flooded). Glyphosate (Roundup Weathermax) containing surfactant was applied in September 2011 at a rate of 3.1 kg ha−1. Soil samples were collected prior to planting at 0–15 cm depth using a soil probe (Table 1).
To enhance establishment potential, the entire field was sprayed with glyphosate again at a rate of 1.7 kg a.i. ha−1 with surfactant in April 2012. Seeds were purchased from Bamert Seed Company (Muleshoe, TX, USA) for the Alamo variety (lowland variety) of switchgrass. Seeds were planted in May 2012 using a Hay Buster 77 No-till seed drill with 18 cm row spacing. In 2013, buffers were mowed to create four blocks, each containing 8 plots of size 3.2 m × 4.87 m with a 2.43 m buffer between blocks. Following planting, Paraquat dichloride (Gramoxone) was applied at a rate of 0.77 kg a.i. ha−1 to the entire field. In May 2013, the switchgrass plots were fertilized with ammonium nitrate at a rate of 67 kg N ha−1. In addition, plots were sprayed with the herbicide nicosulfuron and metsulfuron methyl at the rate of 59 g a.i. ha−1 and 16 g a.i. ha−1, respectively, to reduce johnsongrass (Sorghum halepense).
In May 2014, biochar (CoolTerra, pinewood at 500 °C) was applied by broadcasting onto an established switchgrass field at 0 Mg ha−1 and 9 Mg ha−1. Characteristics of the biochar used are listed in Table 2. Nitrogen (N), in the form of ammonium nitrate, was dissolved in distilled water and applied using a backpack sprayer at 4 different rates (0, 17, 34, and 67 kg N ha−1). In plots receiving biochar applications, the nitrogen was applied after the biochar was applied. Potash was also broadcast to all plots at a rate of 74 kg K ha−1 before applying biochar and nitrogen. Similar treatments of N fertilizer were continued for each successive year in spring. In addition to N fertilizer, potash was applied at a rate of 74 kg K ha−1 in April 2018, and dolomite (100% purity) was applied in May 2018 at the rate of 4367 kg ha−1.
Soil samples were collected in 2017, 2018, and 2019 at a 0 to 15 cm depth (8 homogenized samples per plot) with a soil probe. In 2017, soil samples were only collected from the 0 and 67 kg N ha−1 treatments with and without biochar. In 2018 and 2019, soil samples were collected from all treatments. Sample collection was based on The Cornell Soil Health Testing Laboratory guideline. Samples were placed in plastic food storage bags with ice packs after removing any debris, small rocks, roots, and plant material in the soil samples and sent to the Cornell Soil Health Testing Laboratory (Ithaca, NY, USA) for wet aggregate stability and active carbon analyses. For 2017, soil samples were oven-dried at 60 °C before sending them for analysis, while for 2018 and 2019, samples were sent with no drying.

2.2. Laboratory Methods

2.2.1. Biochar Analysis

The pinewood biochar used in the study was analyzed for total carbon, total nitrogen, moisture content, phosphorus (P), potassium (K), magnesium (Mg), and calcium (Ca) content. Total carbon and moisture content were analyzed by Midwest Laboratories, Inc. (Omaha, NE, USA). To measure total carbon content, ASTM D 5373 (mod) method was used, and moisture content was measured using SM 2540 G-(1997) method. Biochar P, K, Mg, and Ca were measured using Mehlich 3 ICP and CEC was measured using M3 summation at A&L Great Lakes Laboratories (Fort Wayne, IN, USA). Results of these analyses can be found in Table 1.

2.2.2. Wet Aggregate Stability

Samples were measured using a Cornell Rainfall Simulator that steadily rained on a sieve containing a known weight of soil aggregates with a diameter between 0.25 mm and 2 mm.
The air-dried soil samples were placed on stacked sieves of 2.0 mm, 0.25 mm, and a catch pan. The dried soil was shaken for 15 s on a Tyler Coarse Sieve Shaker to separate out aggregates of 0.25 to 2.0 mm size for analysis. A single layer of aggregates from 0.25 to 2.0 mm (about 30 g) was spread on a 0.25 mm sieve (200 mm diameter). Sieves were placed at a distance of 500 mm (20 inches) below a rainfall simulator, which delivered individual drops of 4.0 mm diameter. The test was run for 5 min and delivered 12.5 mm of water (approximately 0.5 inches) as drops to each sieve. The fraction of stable soil aggregates (WSA) was calculated using the following equation:
WSA = Wstable/Wtotal
where
Wstable = Wtotal − (Wslaked + Wstones)
where W = weight (g) of stable soil aggregates (stable), total aggregates tested (total), aggregates slaked out of the sieve (slaked), and stones retained in the sieve (stones). Corrections were made for stones [9].

2.2.3. Active Carbon

The active carbon content of the soil was measured using a method adapted from Weil et al. [10,11].
Soil was air dried and sieved to 2 mm. A 2.5 g sample of air-dried soil was placed in a 50 mL centrifuge tube filled with 20 mL of 0.02 M potassium permanganate (KMnO4). The soil and KMnO4 were shaken for 2 min to oxidize the active carbon in the sample. The sample tube was allowed to settle for 8 min, pipetted into another tube, and diluted with distilled water. Absorbance was measured at 550 nm and compared against a standard calibration curve for KMnO4 and converted to mg active C per kg soil [9].

2.3. Statistical Analysis

Data was statistically analyzed using Two-Way ANOVA, GLM procedure, and post hoc tests with SAS data analysis software (Version 9.4, Cary, NC, USA) for data analysis. Significant differences between treatments and time for active carbon and wet aggregate stability were identified using two-way ANOVA. Error bars in the data represent standard error. Data were compared over years and treatments. The effect of presence or absence of biochar was also analyzed within all years. When years were compared, averages across the same treatments were used to ensure the same treatments and number of plots are compared between years.

3. Results

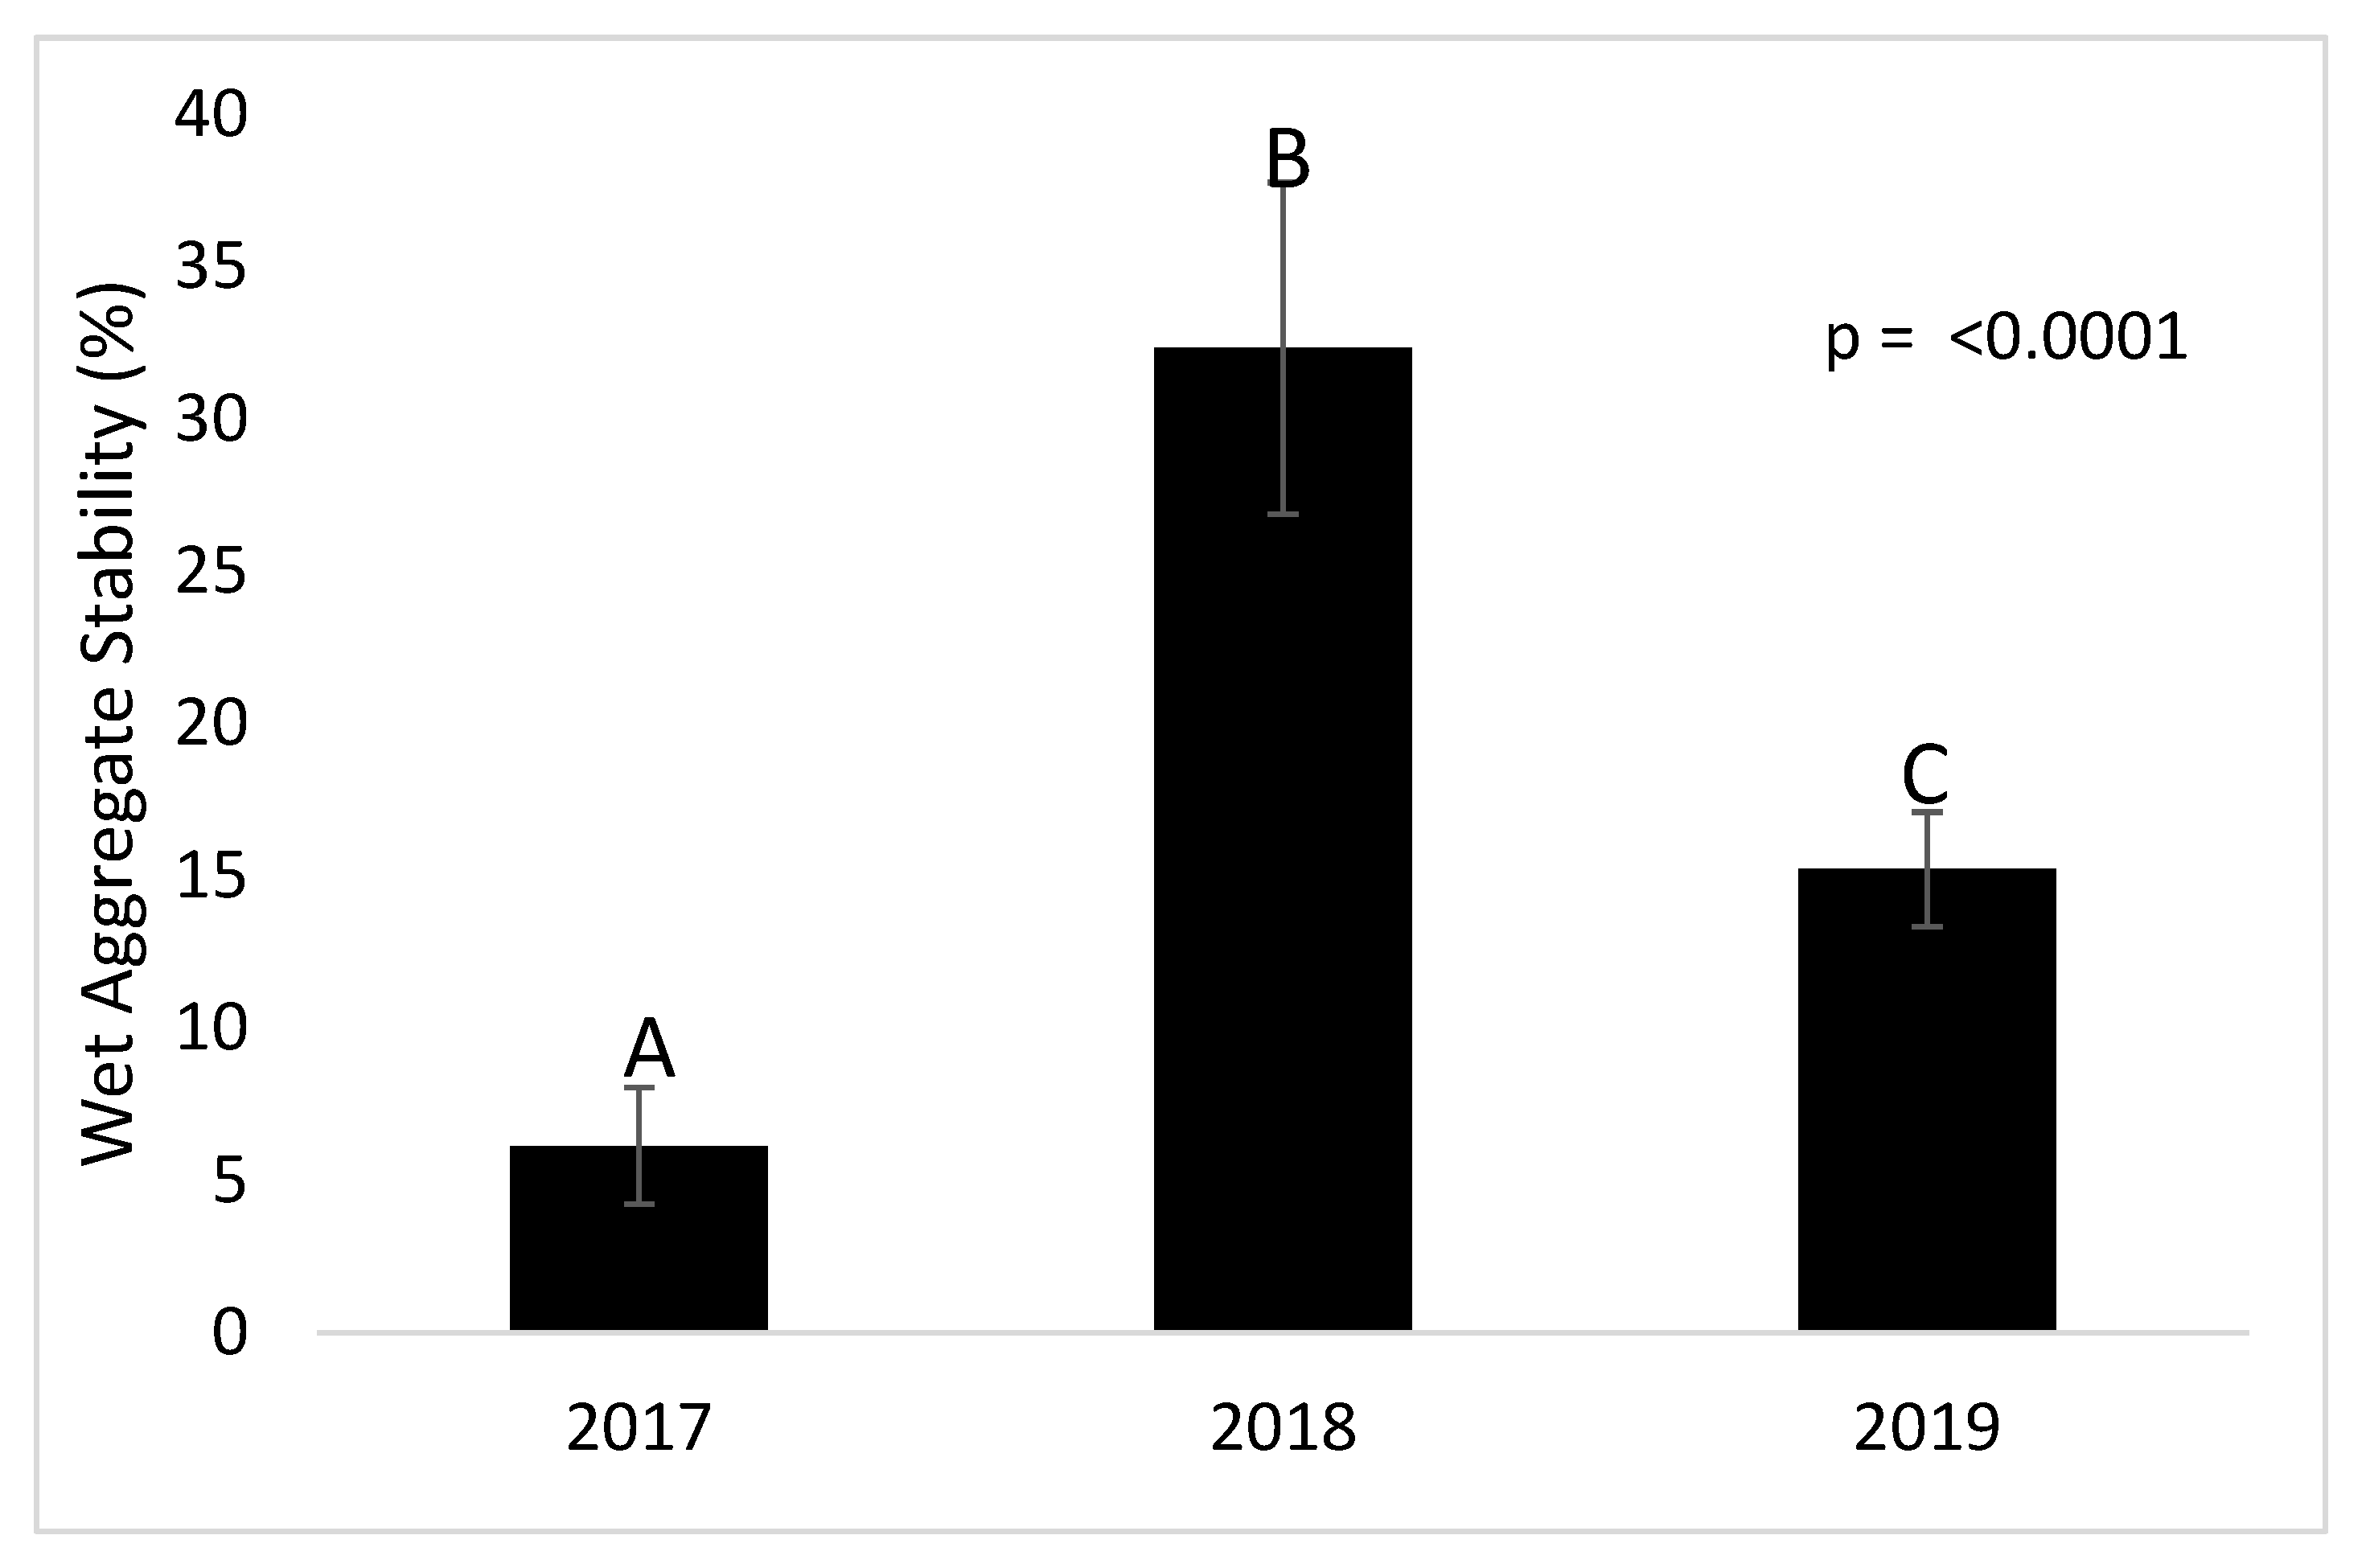
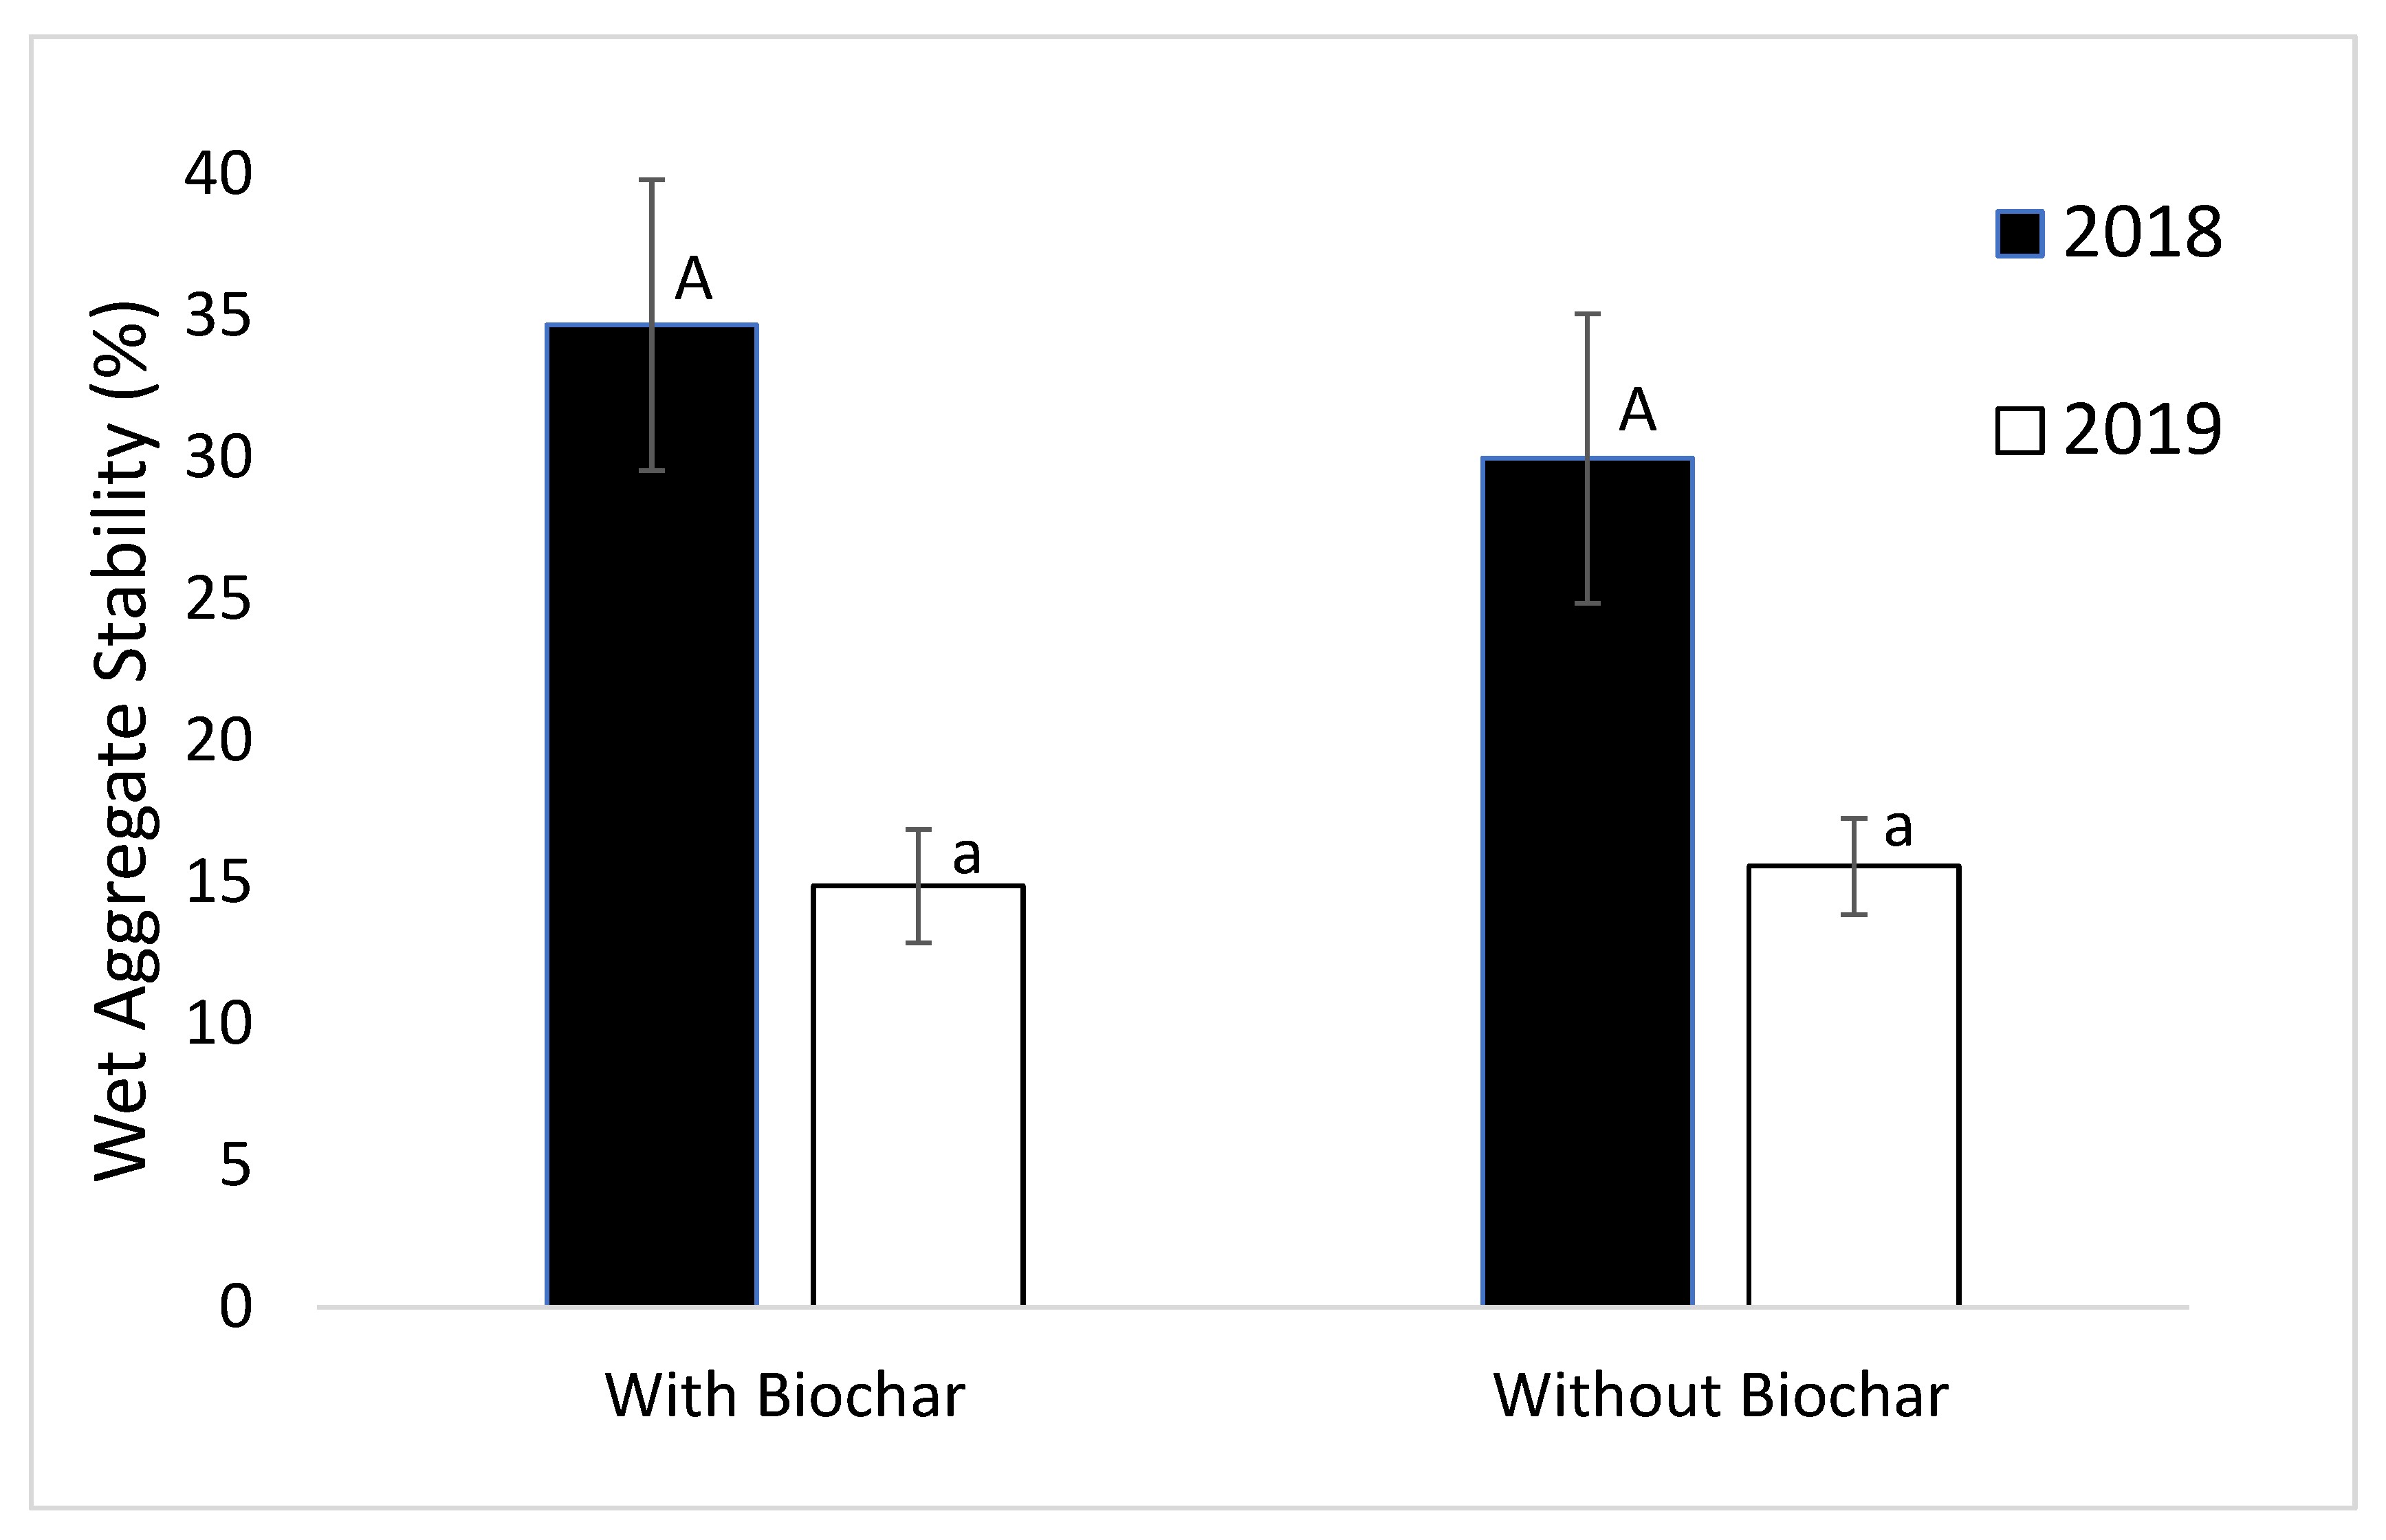
3.1. Wet Aggregate Stability (WAS)

Year had a significant effect on WAS (p < 0.0001) (Figure 1).
In 2018, the average WAS (32.33%) was significantly higher than 2017 and 2019. However, it is important to consider that 2017 soil samples were dried before sending for analysis while 2018 and 2019 samples were shipped at ambient soil moisture content, which may have some effect on the results for that year. In 2018, the application of biochar had no effect on WAS (p = 0.06) (Figure 2).
Additionally, in 2018, there were numerical differences for plots without biochar where treatments with greater N fertilization rates had lower WAS (Table 3). In 2019, no significant effect of different biochar or N fertilizer treatments was observed.

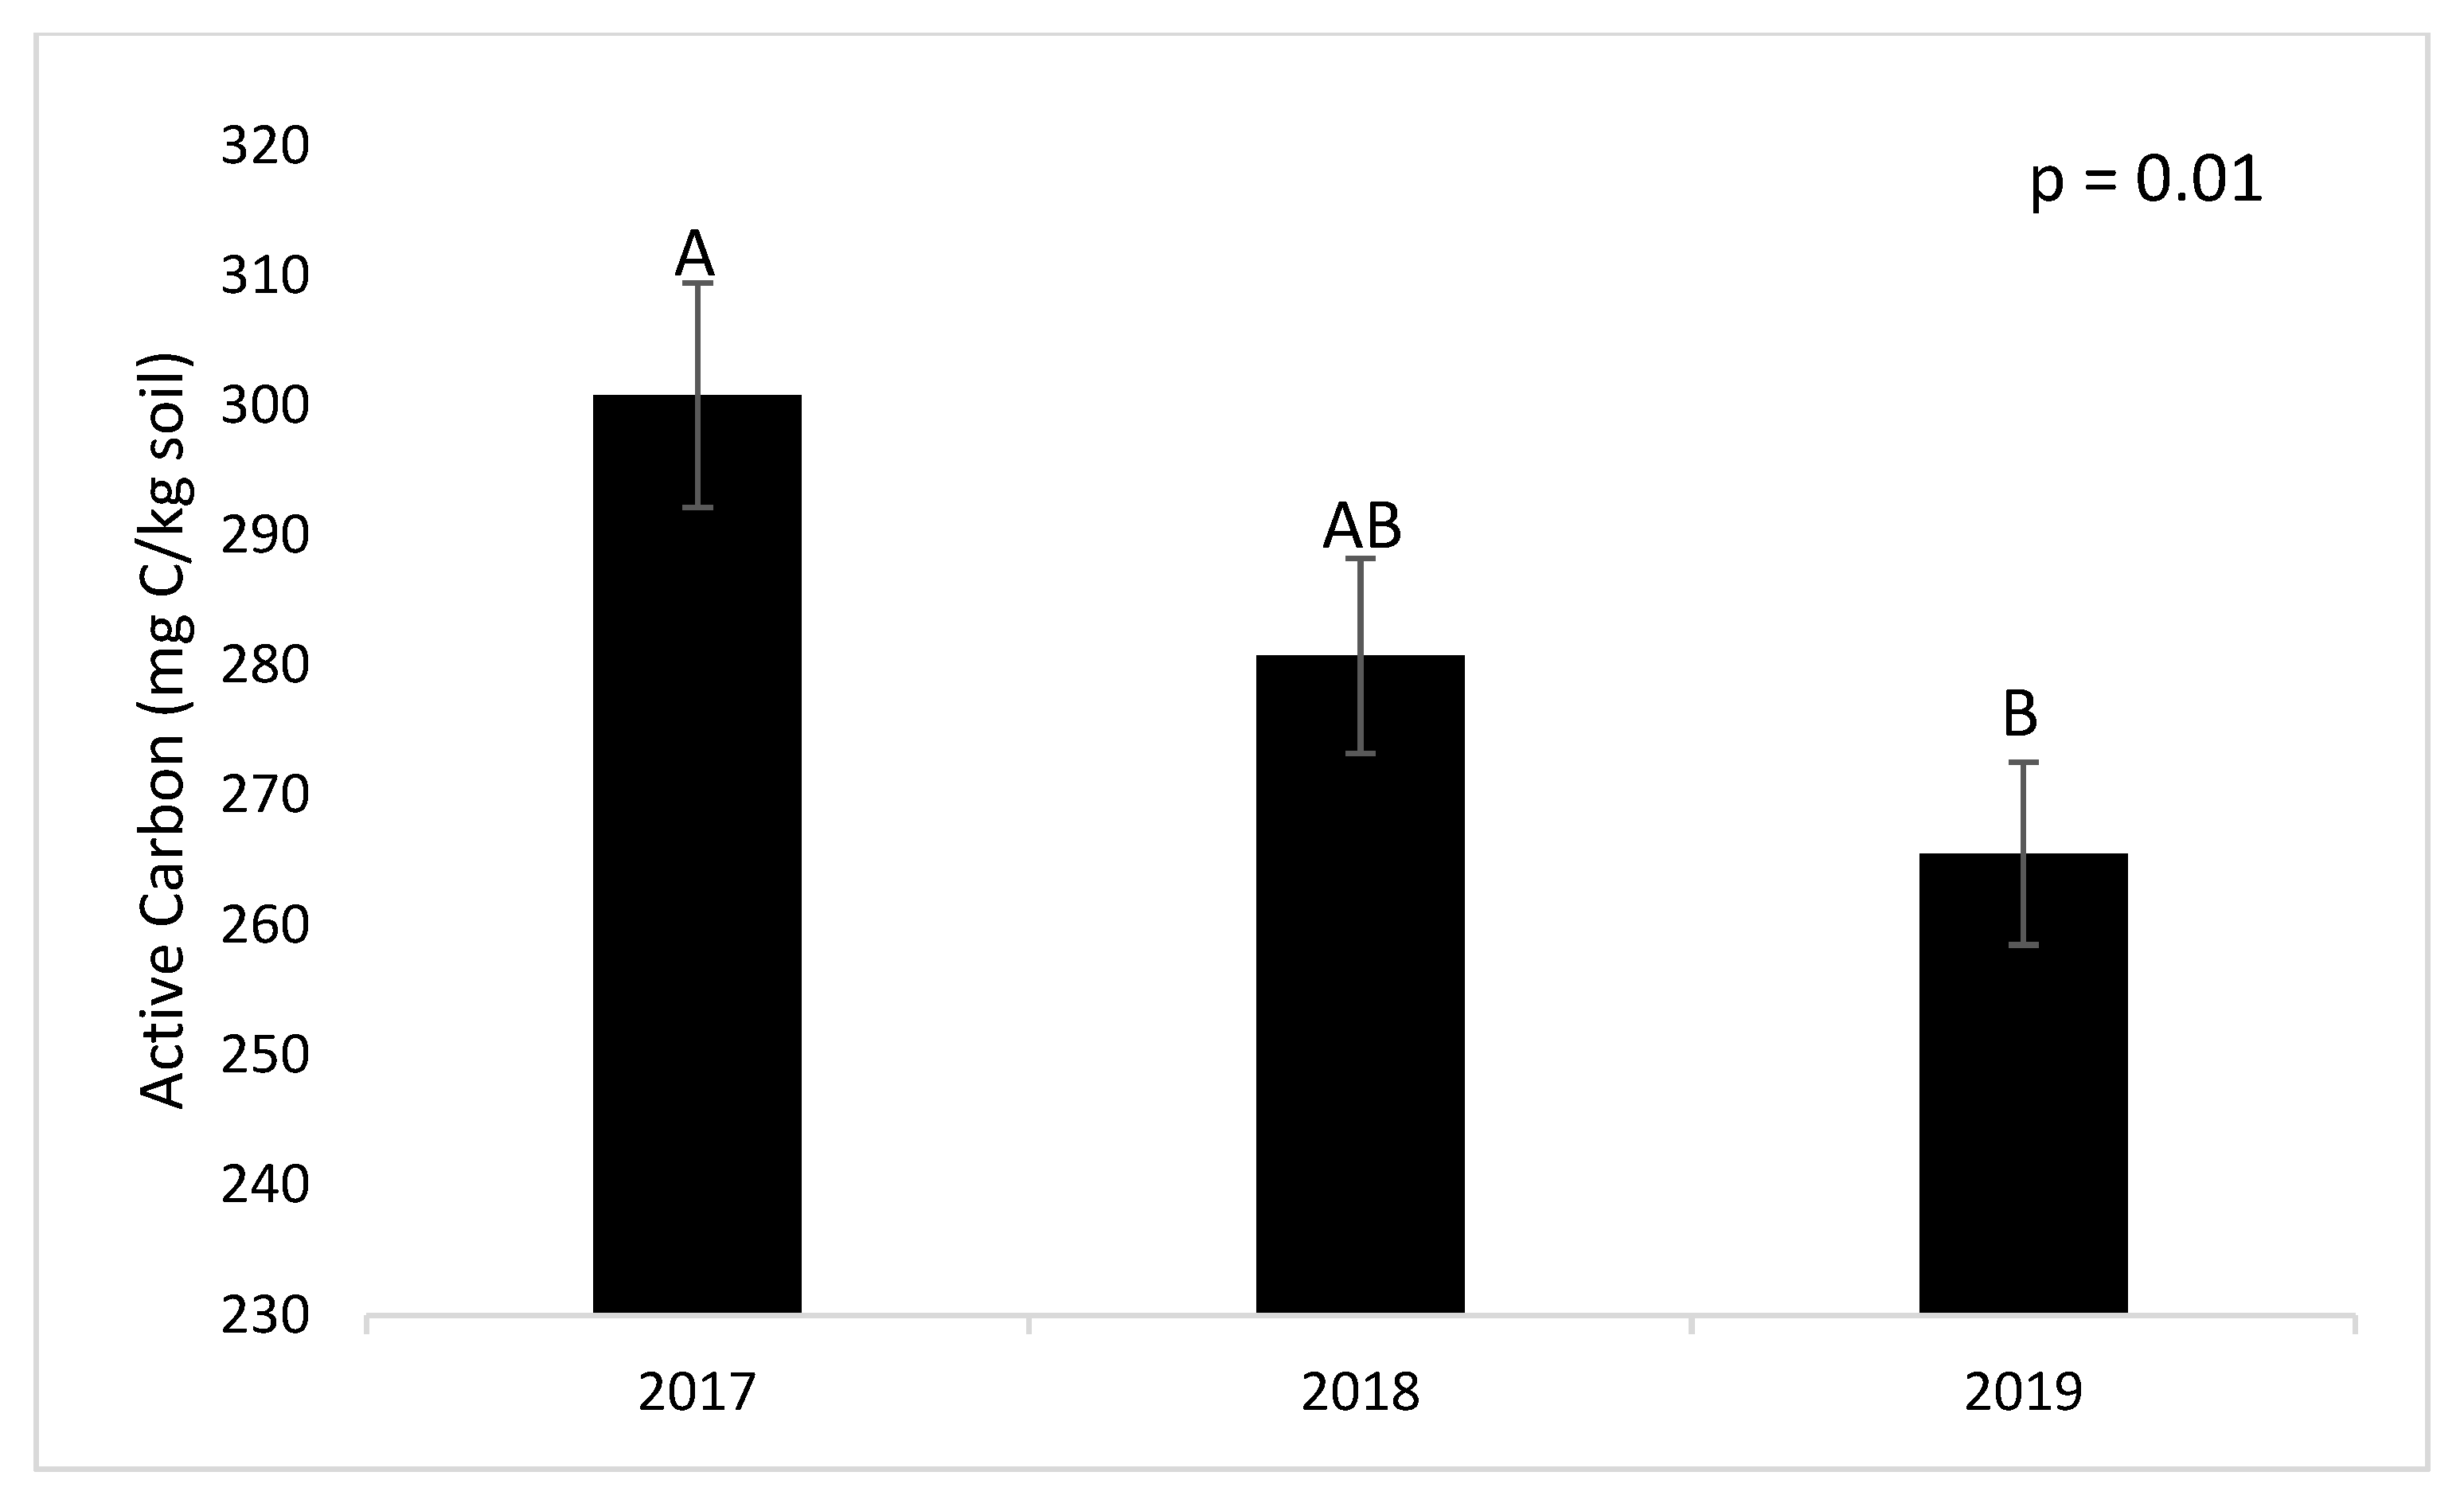
3.2. Active Carbon (AC)

Similar to WAS, a significant effect of time (years) was observed for AC (p = 0.01) from 2017 to 2019 (Figure 3).
A decline in soil active carbon content was observed throughout the study period. No significant effect of different treatments was observed in 2017. In 2018, N fertilizer rate and biochar did not show any direct significant effect on AC. However, the interaction between these treatments did show some differences (Figure 4).
It was observed that the 34 kg N ha−1 treatment with no biochar application was significantly higher than the 17 kg N ha−1 (p = 0.04) and 67 kg N ha−1 treatments (p = 0.03) (Table 4). A significant effect of N fertilizer rate was observed in 2019 (Figure 4), where the highest N fertilizer rate had significantly higher AC content as compared to plots with 17 kg N ha−1 (p = 0.04). Biochar application did not show any effect on active carbon content of the soil.

4. Discussion

4.1. Aggregate Stability

Research on soil health assessment is a growing field, where the complexities and various functions of soil are analyzed so that soil can be managed sustainably for both agricultural and environmental requirements [8]. Our study observed that WAS in the second year (2018) of the experiment was significantly higher than the first (2017) and the third (2019) year. Oven drying the soil samples for a long period prior to analysis might have impacted the results for 2017; however, a significant decline in WAS was observed in 2019. Since aggregate stability is impacted by factors like organic matter content and exudates from plant roots, the oven temperature (60 °C) for a prolonged period may have affected this. Available information on impacts of switchgrass production on water stable aggregates indicate variable responses. Similar to our results, a study by Stewart et al. [27] found no significant effect of four N fertilizer rates (0, 60, 120, and 180 kg ha−1) on aggregate stability in a switchgrass field over a 9-year period. In the same study, switchgrass did improve the aggregate stability at 0–30 cm depth; however, in that study, switchgrass was established on marginal land that was previously under conventional crop production (wheat, corn, soybean, milo, and oats) for over 20 years and was also degraded in soil organic carbon. Sollins et al. [28] also identified pH as one of the significant controllers of aggregate stability. Several studies observed that the lower pH of tropical soils enhanced soil aggregate stability [29,30]. Amezketa [31] suggested that an increase in soil pH can promote the dispersion of clay particles and reduce aggregate stability. A study by Blanco-Canqui et al. [25] observed that the switchgrass management significantly reduced the strength of the aggregates of near surface soils as compared with row crops and pasture systems. The study suggested that lower soil disturbance and the permanent root systems of switchgrass are likely to buffer the compaction of aggregates. In the same study, data showed that switchgrass significantly reduced aggregate density and had the lowest tensile strength of aggregates among other vegetation types (cropland, pasture, and forest). Contrary to this, another study reported an increase in water stable aggregates by 34.9% under switchgrass production in a three-year experiment. However, prior to the establishment of experimental plots, this area was under continual production for more than 40 years and managed with conventional tillage practices [9]. It is likely that the perennial grass with its extensive root system, after long periods of tillage and other agricultural disturbance, led to increased stability of aggregates in the earlier years of switchgrass production. Several studies have suggested that establishing perennial vegetation following intensive crop cultivation has positive impacts on soil aggregation with improvements in the root system, microbial biomass, and mycorrhizae [32,33]. The second year of our study (four years after biochar addition) did show biochar addition had higher numerical WAS than no biochar treatments; however, these differences were not significant. Novak et al. [34] suggested that the response to biochar application by both soils and crops is highly variable because it is linked to biochar attributes and soil properties. A meta-analysis of 114 studies on biochar concluded that the ability of biochar to increase crop yields and affect soil properties is highly variable [35].
Verheijen [36] suggested that biochar affects soil aggregate formation by interaction within soil organic matter, minerals, and microorganisms. Another study observed improved aggregate stability and a significant correlation between soil organic matter and aggregation in soil; however, the experimental area was under intensive agriculture (50 years) and used for nutrient depletion experiments for 10 years prior to the study [23]. A four-year study on silty clay loam soil similar to our study, found no significant effect of miscanthus biochar (8 t C ha−1 and 25 t C ha−1) on soil aggregate stability. This study reported a significant increase in aggregate stability with the addition of un-pyrolyzed feedstock (Miscanthus straw at 8 t C ha−1) as compared to control plots (soil) and biochar treatments had no significant effects [37]. Overall, it is likely that the benefits of biochar on soil aggregate stability are more prominent on marginal soils or soils under prior long-term crop production.
The meta-analysis studies focusing on the effects of biochar on soil have suggested that biochar amendments are most likely beneficial for acidic, degraded, and coarse-textured soils [38,39]. The feedstock of the biochar is also important in determining its effect on soil aggregate stability, and several studies have reported that straw biochars induce the greatest improvements in aggregate stability and outperform woodchip biochars [40,41]. Therefore, the conclusions regarding the effect of biochar on aggregate stability are contradictory. Our study found no effect of either biochar or N on aggregate stability.

4.2. Active Carbon (AC)

Our results indicated a decline in AC content over three years of analysis. We did observe some significant differences among treatments in the second year, where the AC content of treatments with an N rate of 34 kg ha−1 and no biochar application were higher, however, there were no specific trends. In contrast, during the third year, we observed the highest N rate treatments had the highest AC content. According to Moebis-Clune et al. [10], active carbon is a leading soil health indicator since it responds to management changes much earlier than organic matter content. Possibly, the application of lime and potash in 2018 might be responsible for a decline in active carbon content in 2019, even though we did not observe any changes in soil pH in the year following lime application, it is possible that, due to the more optimal conditions provided, the soil microbial communities were able to decompose larger portions of active carbon in the soil. Currently, there is no other research focused on the effect of switchgrass production or biochar application on AC content of the soil. There are a few studies that focused on changes in particulate organic matter (POM) content under switchgrass or as a result of biochar application. Particulate organic matter content of the soil is suggested to be somewhat similar to the active carbon content and highly correlated [10,42]. Particulate organic matter is determined using a more complex and labor-intensive wet-sieving and/or chemical extraction procedure as compared to AC content.
A 6-year rice paddy field study by Tian et al. [43] observed a significant increase in particulate organic carbon of soil after applying pinewood biochar at the rate of 6 t ha−1 each year; however, in our study, biochar was only applied once during the establishment year. In another study, the establishment of switchgrass barriers increased the coarse POM content at 0–15 cm depth; however, the increase was not statistically different from other cropped areas [44]. Dou et al. [45] found significant differences in POM between switchgrass and conventional crops, after 4 and 9 years of establishment. Another study found no significant difference between the POM of a switchgrass field and land under an annual row crop system in a 7-year study [46].
Several studies suggest that roots of warm season prairie grasses (C4) like switchgrass are coarse, high in lignin, longer lived, contain fewer primary roots of larger diameters, and are more resistant to decay than the roots of cool season grass (C3) [47,48,49]. This may be one of the factors affecting POM of soils under switchgrass. Additionally, as we sampled the soil to a depth of 15 cm, the benefits of perennial grasses on soil properties are likely to occur in deeper soil horizons [46]. For example, a study by Blanco-Canqui et al. [44] observed improved soil aggregation under switchgrass at 15 to 60 cm depth.

4.3. Biochar and Soil Properties

The interaction between biochar and soil can potentially affect the soil nutrient dynamic in different ecosystems. In a study by Liang et al. [50], soil pH was increased by a maximum 0.35 units after 2 years of biochar application at 30, 60 and 90 t ha−1 on a calcareous soil. In our study, biochar application did not result in changes in soil pH on a Lindside silt loam soil. Some studies suggest that fresh biochar can potentially be a source of nutrients and release large amounts of N (23–635 mg kg−1) and P (46–1664 mg kg−1) [51,52]; however, no increase in soil nitrate, ammonium or P is observed in our study (2018, 2019). Biomass feedstock and pyrolysis temperature greatly affect the nutrient content of biochar [53]. For instance, swine manure biochar produced at pyrolysis temperature 400 °C contained 3.2% N and 6.1%P [53] while at same production temperature Arundo donax biochar had 0.69%N and 0.13%P [52]. The elemental composition of pine wood biochar (500 °C) used in this study is similar to other studies using pinewood biochar [54]. In a study by Gaskin et al. [55], pine wood biochar produced at 400 °C (pH 7.54) was applied in a field at 11 and 22 Mg ha−1 on a loamy sand soil (pH 5.59) and showed no significant increase in soil pH, and some increase in soil N, P and K; however, unlike our study, this study was conducted on a low fertility soil with a history of continuous conventional tillage. Additionally, the low quantity of base cations and low ash content of pine wood biochar can be responsible for its lack of significant effects on soil pH [54].

5. Conclusions

The multiple benefits of biochar make it a potentially attractive tool for sustainable soil health; however, research thus far has many contradictions, which may imply the variable nature of biochar and its inability to be applied across multiple different landscapes. Based on the results of our study, application of biochar increased total carbon content of the soil and did not negatively impact the measured soil health indicators, showing its potential to be used as a soil amendment. The effects of higher nitrogen fertilizer rates are unclear and do not improve AC content and WAS, thus lower rates of N fertilizer may be applied without affecting these soil health characteristics. Based on previous studies, the type and rate of biochar application along with the previous history of the field may have more impact on soil health. A deeper understanding of the mechanisms involved is required to identify the effects of biochar on soil health, its use with nitrogen fertilizer, and its benefits in a switchgrass production system. Some of the challenging questions for future studies may include: (1) to identify how and under what conditions biochar applications can reach the desired benefits, with similar questions for switchgrass production and related soil health benefits, (2) how, mechanistically, switchgrass and biochar responses vary under different soil, climate and management conditions.

Author Contributions

Conceptualization, J.P.d.K.; methodology, J.P.d.K., P.S., C.R. and R.L.; validation, P.S.; investigation, P.S., C.R. and R.L., data curation, P.S. and J.P.d.K.; writing—orginal draft preparation, P.S.; writing—review and editing, J.P.d.K., P.S., C.R. and R.L.; supervision, J.P.d.K. and R.L., project administration, J.P.d.K.; funding acquisition, J.P.d.K. All authors have read and agreed to the published manuscript.

Funding

This research was funded by USDA-NIFA 1890 Extension Formula Funds.

Institutional Review Board Statement

Not applicable.

Informed Consent Statement

Not applicable.

Data Availability Statement

The data presented in this study are available on request from the corresponding author.

Acknowledgments

The authors would like to thank Robert Regan, Ekundayo Adeleke, Lahiru Gamage, Kyle McGeary, Nicole Witzel, Harinder Singh, Bir B Singh, Edmund Tetteh, and Shivam Chawla for their assistance with fieldwork. The authors would also like to thank Bharat Pokharel for his assistance with data analysis.

Conflicts of Interest

The authors declare no conflict of interest.

References

  1. Fargione, J.; Hill, J.; Tilman, D.; Polasky, S.; Hawthorne, P. Land clearing and the biofuel carbon debt. Science 2008, 319, 1235–1238. [Google Scholar] [CrossRef] [Green Version]
  2. Gelfand, I.; Sahajpal, R.; Zhang, X.; Izaurralde, R.C.; Gross, K.L.; Robertson, G.P. Sustainable bioenergy production from marginal lands in the US Midwest. Nature 2013, 493, 514–517. [Google Scholar] [CrossRef]
  3. Tiemann, L.K.; Grandy, A.S. Mechanisms of soil carbon accrual and storage in bioenergy cropping systems. GCB Bioenergy 2015, 7, 161–174. [Google Scholar] [CrossRef]
  4. Office of Energy Efficiency and Renewable Energy; USDOE. Alternative fuel transportation program; replacement fuel goal modification. Fed. Regist. 2007, 72, 12041–12060. [Google Scholar]
  5. Follett, R.F.; Pruessner, E.G.; Samson-Liebig, S.E.; Kimble, J.M.; Waltman, S.W. Carbon sequestration under CRP in the historic grassland soils of the USA. In Soil Carbon Sequestration and the Greenhouse Effect; Lal, R., Ed.; Spec. Publ. No. 57; SSSA: Madison, WI, USA, 2001; pp. 27–40. [Google Scholar]
  6. Schmer, M.R.; Liebig, M.A.; Vogel, K.P.; Mitchell, R.B. Field-scale soil property changes under switchgrass managed for bioenergy. GCB Bioenergy 2011, 3, 439–448. [Google Scholar] [CrossRef] [Green Version]
  7. Seifu, W.; Elias, E. Soil quality attributes and their role in sustainable agriculture: A review. Int. J. Plant Soil Sci. 2018, 26, 1–26. [Google Scholar] [CrossRef]
  8. Hubanks, H.; Deenik, J.; Crow, S. Getting the dirt on soil health and management. In Reference Module in Earth Systems and Environmental Sciences; Elsevier: Oxford, UK, 2018. [Google Scholar] [CrossRef]
  9. Ontl, T.A.; Cambardella, C.A.; Schulte, L.A.; Kolka, R.K. Factors influencing soil aggregation and particulate organic matter response to bioenergy crops across a topographic gradient. Geoderma 2015, 255–256, 1–11. [Google Scholar] [CrossRef] [Green Version]
  10. Moebius-Clune, B.N.; Moebius-Clune, D.J.; Gugino, B.K.; Idowu, O.J.; Schindelbeck, R.R.; Ristow, A.J.; van Es, H.M.; Thies, J.E.; Shayler, H.A.; McBride, M.B.; et al. Comprehensive Assessment of Soil Health: The Cornell Framework Manual, 3rd ed.; Cornell University: Ithaca, NY, USA, 2016; Available online: http://www.css.cornell.edu/extension/soil-health/manual.pdf (accessed on 24 June 2021).
  11. Weil, R.R.; Islam, K.R.; Stine, M.A.; Gruver, J.B.; Samson-Liebig, S.E. Estimating active carbon for soil quality assessment: A simplified method for laboratory and field use. Am. J. Altern. Agric. 2003, 18, 3–17. [Google Scholar]
  12. Kennedy, A.C.; Papendiek, R.I. Microbial characteristics of soil quality. J. Soil Water Conserv. 1995, 50, 243–248. [Google Scholar]
  13. Islam, K.R.; Weil, R.R. Soil quality indicator properties in mid-Atlantic soils as influenced by conservation management. J. Soil Water Conserv. 2000, 55, 69–78. [Google Scholar]
  14. Janzen, H.H.; Campbell, C.A.; Brandt, S.A.; Lafond, G.P.; Townley-Smith, L. Light fraction organic matter in soils from long term crop rotations. Soil Sci. Soc. Am. J. 1992, 56, 1799–1806. [Google Scholar] [CrossRef] [Green Version]
  15. Wander, M.M.; Bidart, M.G. Tillage practice influences on the physical protection, bioavailability and composition of particulate organic matter. Biol. Fert. Soils 2000, 32, 360–367. [Google Scholar] [CrossRef]
  16. DeLuca, T.H.; Keeney, D.R. Soluble organics and extractable nitrogen in paired prairie and cultivated soil of central Iowa. Soil Sci. 1993, 155, 219–228. [Google Scholar] [CrossRef]
  17. Saviozzi, A.; Biasci, A.; Riffaldi, R.; Levi-Minzi, R. Long-term effects of farmyard manure and sewage sludge on some soil biochemical characteristics. Biol. Fert. Soils 1999, 30, 100–106. [Google Scholar] [CrossRef]
  18. Lehmann, J.; Joseph, S. Biochar for environmental management: An introduction; in Biochar for environmental management. Sci. Technol. 2009, 1, 1–12. [Google Scholar]
  19. Chmidt, M.W.; Skjemstad, J.O.; Jager, C. Carbon isotope geochemistry and nanomorphology of soil black carbon: Black chernozemic soils in central Europe originate from ancient biomass burning. Glob. Biogeochem. Cycles 2002, 16, 1123. [Google Scholar]
  20. Lehmann, J.; Gaunt, J.; Rondon, M. Bio-char sequestration in terrestrial ecosystems—A review. Mitig. Adapt. Strat. Glob. Chang. 2006, 11, 403–427. [Google Scholar] [CrossRef]
  21. Lone, A.H.; Najar, G.R.; Ganie, M.A.; Sofi, J.A.; Ali, T. Biochar for sustainable soil health: A review of prospects and concerns. Pedosphere 2015, 25, 639–653. [Google Scholar] [CrossRef]
  22. Mukherjee, A.; Lal, R. Biochar impacts on soil physical properties and greenhouse gas emissions. Agronomy 2013, 3, 313–339. [Google Scholar] [CrossRef] [Green Version]
  23. Ma, N.; Zhang, L.; Zhang, Y.; Yang, L.; Yu, C.; Yin, G.; Doane, T.; Zhu, P.; Ma, X. Biochar improves soil aggregate stability and water availability in a mollisol after three years of field application. PLoS ONE 2016, 11, e0154091. [Google Scholar] [CrossRef]
  24. Busscher, W.J.; Novak, J.M.; Evans, D.E.; Watts, D.W.; Niandou, M.A.S.; Ahmedna, M. Influence of pecan biochar on physical properties of a Norfolk loamy sand. Soil Sci. 2010, 175, 10–14. [Google Scholar] [CrossRef] [Green Version]
  25. Blanco-Canqui, H.; Lal, R.; Lemus, R. Soil aggregate properties and organic carbon for switchgrass and traditional agricultural systems in the southeastern United States. Soil Sci. 2005, 170, 998–1012. [Google Scholar] [CrossRef]
  26. Blanco-Canqui, H. Energy crops and their implications on soil and environment. Agron. J. 2010, 102, 403–419. [Google Scholar] [CrossRef]
  27. Stewart, C.; Follet, R.; Pruessner, E.; Varvel, G.; Vogel, K.; Mitchell, R. Nitrogen and harvest effects on soil properties under rainfed switchgrass and no till corn over 9 years: Implications for soil quality. GCB Bioenergy 2015, 7, 288–301. [Google Scholar] [CrossRef]
  28. Sollins, P.; Homann, P.; Caldwell, B.A. Stabilization and destabilization of soil organic matter: Mechanisms and controls. Geoderma 1996, 74, 65–105. [Google Scholar] [CrossRef]
  29. Idowu, O.J. Relationships between aggregate stability and selected soil properties in humid tropical environment. Commun. Soil Sci. Plant Anal. 2003, 34, 695–708. [Google Scholar] [CrossRef]
  30. Russell, A.E.; Kivlin, S.N.; Hawkes, C.V. Tropical tree species effects on soil pH and biotic factors and the consequences for macroaggregate dynamics. Forests 2018, 9, 184. [Google Scholar] [CrossRef] [Green Version]
  31. Amezketa, E. Soil aggregate stability: A review. J. Sustain. Agric. 1999, 14, 83–151. [Google Scholar] [CrossRef]
  32. Miller, R.M.; Jastrow, J.P.D.K. Hierarchy of root and mycorrhizal fungal interactions with soil aggregation. Soil Biol. Biochem. 1990, 22, 570–584. [Google Scholar] [CrossRef]
  33. Jastrow, J.P.D.K.; Miller, R.M.; Lussenhop, J. Contributions of interacting biological mechanisms to soil aggregate stabilization in restored prairie. Soil Biol. Biochem. 1998, 30, 905–916. [Google Scholar] [CrossRef]
  34. Novak, J.M.; Ippolito, J.A.; Lentz, R.D.; Spokas, K.A.; Bolster, C.H.; Sistani, K.; Trippe, K.M.; Phillips, C.L.; Johnson, M.G. Soil health, crop productivity, microbial transport, and mine spoil response to biochars. Bioenerg. Res. 2016, 9, 454–464. [Google Scholar] [CrossRef]
  35. Biederman, L.A.; Harpole, W.S. Biochar and its effects on plant productivity and nutrient cycling: A meta-analysis. GCB Bioenergy 2013, 5, 202–214. [Google Scholar] [CrossRef]
  36. Verheijen, F.G.A.; Jeffery, S.; Bastos, A.C.; van der Velde, M.; Diafas, I. Biochar Application to Soils: A Critical Scientific Review on Effects on Soil Properties, Processes and Functions; Office for the Official Publications of the European Communities: Luxemberg, 2010. [Google Scholar]
  37. O’Toole, A.; Moni, C.; Weldon, S.; Schols, N.; Carnol, M.; Bosman, B.; Rasse, D. Miscanthus biochar had limited effects on soil physical properties, microbial biomass, and grain yield in a four-year field experiment in Norway. Agriculture 2018, 8, 171. [Google Scholar] [CrossRef] [Green Version]
  38. Jeffery, S.; Verheijen, F.G.A.; van der Velde, M.; Bastos, A.C. A quantitative review of the effects of biochar application to soils on crop productivity using meta-analysis. Ecosyst. Environ. 2011, 144, 175–187. [Google Scholar] [CrossRef]
  39. Crane-Droesch, A.; Abiven, S.; Jeffery, S.; Torn, M.S. Heterogeneous global crop yield response to biochar: A meta-regression analysis. Environ. Res. Lett. 2013, 8. [Google Scholar] [CrossRef]
  40. Liu, Z.; Chen, X.; Jing, Y.; Li, Q.; Zhang, J.; Huang, Q. Effects of biochar amendment on rapeseed and sweet potato yields and water stable aggregate in upland red soil. Catena 2014, 123, 45–51. [Google Scholar] [CrossRef]
  41. Sun, F.; Lu, S. Biochars improve aggregate stability, water retention, and pore-space properties of clayey soil. J. Plant Nutr. Soil Sci. 2014, 177, 26–33. [Google Scholar] [CrossRef]
  42. Cambardella, C.A.; Gajda, A.M.; Doran, J.W.; Weinhold, B.J.; Kettler, T.A. Estimation of particulate and total organic matter by weight loss-on-ignition. In Assessment Methods for Soil Carbon; Lal, R., Kimble, J.F., Follett, R.F., Stewart, B.A., Eds.; Lewis Publishers: Boca Raton, FL, USA, 2001; pp. 349–359. [Google Scholar]
  43. Tian, J.; Wang, J.; Dippold, M.; Gao, Y.; Blagodatskaya, E.; Kuzyakov, Y. Biochar affects soil organic matter cycling and microbial functions but does not alter microbial community structure in a paddy soil. Sci. Total Environ. 2016, 556, 89–97. [Google Scholar] [CrossRef] [PubMed]
  44. Blanco-Canqui, H.; Gilley, J.; Eisenhauer, D.; Jasa, P.; Boldt, A. Soil carbon accumulation under switchgrass barriers. Agron. J. 2014, 106, 2185–2192. [Google Scholar] [CrossRef] [Green Version]
  45. Dou, F.G.; Hons, F.M.; Ocumpaugh, W.R.; Read, J.C.; Hussey, M.A.; Muir, J.P. Soil organic carbon pools under switchgrass grown as a bioenergy crop compared to other conventional crops. Pedosphere 2013, 23, 409–416. [Google Scholar] [CrossRef]
  46. Marquez, C.O.; Victor, G.J.; Schultz, R.C.; Isenhart, T.M. Assessment of soil aggradation through soil aggregation and particulate organic matter by riparian switchgrass buffers. Agronomy 2017, 7, 76. [Google Scholar] [CrossRef] [Green Version]
  47. Weaver, J.E.; Zink, E. Length of life of roots of ten species of perennial range and pasture grasses. Plant Physiol. 1946, 21, 201–217. [Google Scholar] [CrossRef] [PubMed] [Green Version]
  48. Hetrick, B.; Kitt, D.G.; Wilson, G. Mycorrhizal dependence and growth habitat of warm-season and cool-season grass prairie plants. Can. J. Bot. 1988, 66, 1376–1380. [Google Scholar] [CrossRef]
  49. Tufekcioglu, A.; Raich, J.; Isenhart, T.; Schultz, R. Fine root dynamics, coarse root biomass, root distribution, and soil respiration in a multispecies riparian buffer in Central Iowa, USA. Agrofor. Syst. 1999, 44, 163–174. [Google Scholar] [CrossRef]
  50. Liang, F.; Li, G.; Lin, Q.; Zhao, X. Crop yields and soil properties in the first 3 years after biochar application to a calcareous soil. J. Integr. Agric. 2014, 13, 525–532. [Google Scholar] [CrossRef]
  51. Mukherjee, A.; Zimmerman, A.R. Organic carbon and nutrient release from a range of laboratory-produced biochars and biochar–soil mixtures. Geoderma 2013, 193, 122–130. [Google Scholar] [CrossRef]
  52. Zheng, H.; Wang, Z.; Deng, X.; Zhao, J.; Luo, Y.; Novak, J.; Herbert, S.; Xing, B. Characteristics and nutrient values of biochars produced from giant reed at different temperatures. Bioresour. Technol. 2013, 130, 463–471. [Google Scholar] [CrossRef]
  53. Ding, Y.; Liu, Y.; Liu, S.; Li, Z.; Tan, X.; Huang, X.; Zeng, G.; Zhou, L.; Zheng, B. Biochar to improve soil fertility. A review. Agron. Sustain. Dev. 2016, 36, 36. [Google Scholar] [CrossRef] [Green Version]
  54. Al-Wabel, M.I.; Hussain, Q.; Usman, A.R.; Ahmad, M.; Abduljabbar, A.; Sallam, A.S.; Ok, Y.S. Impact of biochar properties on soil conditions and agricultural sustainability: A review. Land Degrad. Dev. 2018, 29, 2124–2161. [Google Scholar] [CrossRef]
  55. Gaskin, J.W.; Speir, R.A.; Harris, K.; Das, K.C.; Lee, R.D.; Morris, L.A.; Fisher, D.S. Effect of peanut hull and pine chip biochar on soil nutrients, corn nutrient status, and yield. Agron. J. 2010, 102, 623–633. [Google Scholar] [CrossRef] [Green Version]
Figure 1. Changes in wet aggregate stability (%) over a three-year period. Different letters indicate significant differences at α = 0.05. Error bars represent standard error.
Sustainability 13 07176 g001
Figure 2. Effect of biochar application on wet aggregate stability within each year. Different letters indicate a significant difference (α = 0.05) within each year. Error bars represent standard error.
Sustainability 13 07176 g002
Figure 3. Changes in active carbon (mg C/kg soil) over a three-year period. Different letters indicate significant differences at α = 0.05 between years. Error bars represent standard error.
Sustainability 13 07176 g003
Figure 4. Effect of N fertilizer rate on active carbon (mg C kg soil−1) within each year. Different letters indicate significant differences at α = 0.05 within each year. Error bars represent standard error.
Sustainability 13 07176 g004
Table 1. Soil nutrient content for 2014. (Control—no N or biochar application, 0 N + Bio—only biochar, N1—17 kg N ha−1, N2—34 kg N ha−1, N3—67 kg N ha−1, Bio = biochar).
Treatments
NutrientControl0 N + BioN1N2N3N1 + BioN2 + BioN3 + Bio
Potassium (K) mg kg−110773.861.564.864.567.069.868.8
Calcium (Ca) mg kg−131322780275828622858288028192964
Magnesium (Mg) mg kg−1202192185199195196196208
Boron (B) mg kg−10.600.480.500.530.530.530.500.53
Iron (Fe) mg kg−137.340.535.837.340.038.538.338.8
Manganese (Mn) mg kg−1276239247272259297263269
Sodium (Na) mg kg−117.517.018.317.021.317.020.318.0
Zinc (Zn) mg kg−16.385.533.584.105.083.985.084.85
Nitrate (NO3) mg kg−11.501.501.251.251.251.001.501.25
Ammonium (NH4+) mg kg−121.515.016.317.314.516.816.015.0
Total Carbon (C) %1.191.071.141.091.091.121.091.14
Total Nitrogen (N) %0.120.100.100.110.100.110.100.10
Table 2. Characteristics of biochar used in the study.
FeedstockPinewood
Pyrolysis temp500 °C
pH6.13
CEC4.73 cmolc kg−1
Total Carbon63.50%
Moisture6.58%
Phosphorus (P)26.67 mg kg−1
Potassium (K)292 mg kg−1
Magnesium (Mg)49.33 mg kg−1
Calcium (Ca)478.67 mg kg−1
Table 3. LSmeans of wet aggregate stability (%) indicating significant difference within each year (2018 and 2019) among eight combination treatments. Different letters after means indicate significant differences at α = 0.05 within each year.
Biochar
(Yes or No)
N Rate
(kg ha−1)
2018
LSmean WAS
2019
LSmean WAS
Yes038.7 (A)16.0 (a)
No033.6 (AB)16.0 (a)
Yes1734.2 (AB)14.8 (a)
No1729.7 (AB)16.5 (a)
Yes3432.2 (AB)15.0 (a)
No3428.5 (B)15.1 (a)
Yes6733.6 (AB)13.8 (a)
No6728.1 (B)14.8 (a)
Table 4. LSmeans for active carbon (mg C kg−1 soil) for each year (2018 and 2019) showing the effect of interaction between N rate and biochar treatment within each year. Different letters after means indicate significant differences at α = 0.05 within years.
Biochar
(Yes or No)
N Rate
(kg ha−1)
2018
LSmean AC
2019
LSmean AC
Yes0272 (AB)266 (ab)
No0276 (AB)267 (ab)
Yes17300 (AB)264 (ab)
No17261 (B)226 (b)
Yes34268 (AB)267 (ab)
No34308 (A)277 (ab)
Yes67275 (AB)286 (a)
No67257 (B)280 (a)
Publisher’s Note: MDPI stays neutral with regard to jurisdictional claims in published maps and institutional affiliations.

