Article

An Optimization Scheme of Balancing GHG Emission and Income in Circular Agriculture System

1
Key Laboratory of Ecosystem Network Observation and Modeling, Institute of Geographical Sciences and Natural Resources Research, Chinese Academy of Sciences, Beijing 100101, China
2
University of Chinese Academy of Sciences, Beijing 100049, China
3
Yellow River Delta Modern Agricultural Engineering Laboratory, Institute of Geographic Sciences and Natural Resources Research, Chinese Academy of Sciences, Beijing 100101, China
4
UN Environment-International Ecosystem Management Partnership (UNEP-IEMP), Beijing 100101, China
5
Department of Grassland Science, College of Grassland Science and Technology, China Agricultural University, Beijing 100193, China
*
Author to whom correspondence should be addressed.
Sustainability 2021, 13(13), 7154; https://doi.org/10.3390/su13137154
Submission received: 12 April 2021 / Revised: 15 June 2021 / Accepted: 19 June 2021 / Published: 25 June 2021
(This article belongs to the Special Issue Agroecological Approaches for Soil Health and Water Management)

Abstract

:
With the rapid development of circular agriculture in China, balancing agricultural income and environmental impact by adjusting the structure and scale of circular agriculture is becoming increasingly important. Agriculture is a major source of greenhouse gas and income earned from agriculture drives sustainable agricultural development. This paper built a multi-objective linear programming model based on greenhouse gas emission and agricultural product income and then optimized the structure and scale of circular agriculture using Beiqiu Farm as a case study. Results showed that greenhouse gas emission was mainly from manure management in livestock industry. While the agriculture income increased by 64% after optimization, GHG emission increased by only 12.3%. The optimization made full use of straw, manure and fodder, but also minimized soil nitrogen loss. The results laid a generalized guide for adjusting the structure and scale of the planting and raising industry. Measures for optimizing the management of manure were critical in achieving low agricultural carbon emissions in future agricultural development efforts.

1. Introduction

Circular agriculture is the inevitable drive towards sustainable development of agricultural production [1]. The combination of planting and breeding is one good way to realize resource utilization, prevent pollution and reduce application of fertilizers in farmlands. This effort contributes to reducing agricultural non-point source pollution and increasing income from agriculture. In China, circular agriculture is promoted as a top-down national political drive [2]. China has explored several new modes of agricultural production such as recycling wastes via biogas digesters and compost. This has been possible through the combination of planting and breeding during small-scale peasant economy. Based on local conditions, farmers have promoted ecological circular agricultural models, such as rice-fish symbiosis, pig-biogas fruits, and forest economies [3]. Scholars have focused on making circular agricultural systems workable and able to generate more income, ignoring the appropriate size and variety between farming and breeding. As a result, there is still the issue of excessive agricultural waste in circular agriculture that is leading to environmental pollution. Therefore, the optimization of agricultural development by adjusting the structure and scale of planting and breeding for increased agricultural economic benefits remains challenging.
The mathematical model and programming techniques, such as linear programming, dynamic programming, genetic algorithms, particle swarm optimization and multi-objective planning have been widely used in solving the problem of agricultural structure and scale of adjustment [4]. Most of these studies adjust the structure and scale of agriculture based on resource consumption. An agricultural water-energy-food sustainable management (AWEFSM) model which incorporates multi-objective programming, nonlinear programming and intuitionistic fuzzy numbers into a general framework, was developed for sustainable management of limited water-energy-food resource by identifying tradeoffs of water, energy and land resources across various sub-areas and crops [5]. Some studies consider the relationship between food and energy, others focus on the balance across nutritional needs of animals and feed supplies, and yet others analyze labor and water requirements and income [6,7]. Not many studies link agricultural greenhouse gas emission to agricultural economic benefit and agricultural waste disposal. A multi-objective regional optimization model was therefore built to identify optimum land management adaptations to climate change [8]. It is not difficult to find that Pareto-based multi-objective optimization methods are well-suited for explorations of trade-offs and synergies [9].
As a major agricultural country, agricultural development in China has its own problems. The environmental problems caused by the rapid agricultural development and the low agricultural income continue to attract increasing attention. In particular, the growing demand for food will compete with the effort to mitigate Greenhouse Gas (GHG) emissions and adapt to climate change. The Food and Agriculture Organization (FAO) of the United Nations pointed out in its report that the global agricultural GHG emission in 2014 was 5.442 billion tons of carbon dioxide equivalent [10]. Of this, China emitted 708 million tons, accounting for 13.51% of the global agricultural GHG emission and making it the country with the largest agricultural GHG emission in the world. Studies show that the input of nitrogen and phosphorus fertilizers in plantation industry will increase by 2.7–3.4 times in the future. The input of nitrogen fertilizer alone will result in an annual emission of 3 billion tons of CO2 equivalent [11]. Compared with crop production, the livestock sector contributes more to GHG emissions. As a country with the largest livestock production in the world, China’s GHG emissions from the livestock industry was increased from 137.423 million tons to 150.563 million tons from 2000 to 2014, of which emissions from gastrointestinal fermentation of livestock and manure management systems were the two key sources, accounting for 65.58–73.23% [12]. As the agricultural sector is most affected by human activity, GHG emission from crop production and livestock industry could be negligible or even negative under improved agricultural management practices [13,14,15,16]. Hence, agriculture systems in China are becoming increasingly important as a global solution to mitigating anthropogenic GHG emission [17,18].
China’s development of low-carbon agriculture is aimed at energy saving, emission reduction and waste disposal. The goal is to build a sustainable agricultural development, achieved by adjusting the structure and scale of circular agriculture. Through this drive, the full use of resources can be achieved at the input, operations and waste treatment stages of agricultural production. This can give the level of carbon emission that is important for the development of low-carbon agriculture across the country and improvement of agricultural resource utilization. To take advantage of these measures and promote sustainable agricultural development, it is critical that the concept of “carbon footprint” is used to study GHG emission in the agriculture and animal husbandry [19]. The purpose of this study was to: (1) calculate GHG emission in planting and breeding system modules of a representative circular farm using carbon footprint and find the difference in GHG emission; (2) study differences in economic benefits of agriculture on the basis of input, output and actual conditions; and (3) determine the optimal structure and scale of different industries in circular agriculture in relation to economic benefit, environmental impact and farm waste utilization using a multi-objective linear programming model.

2. Materials and Methods

2.1. Study Area

In this study, Beiqiu Farm was used as case study of combined crop and animal husbandry. The farm is located in Beiqiu village at 37°00′12.4″ N and 116°34′22.3″ E in Yucheng, Dezhou City, Shandong Province. This is at an alluvial plain in the middle and lower reaches of the Yellow River.
Beiqiu Farm was selected in this study because it is a typical agricultural ecosystem that combines planting and breeding industry in the North China Plain. The plain is one of the main agricultural production areas in China, where 50% of the wheat and 30% of the corn are produced in the country. The farm also has waste disposal and feed processing facilities for making fodder and organic fertilizer. Thus, research on the production model could provide a reference for a sustainable agriculture development model in the country. Data were collected mainly on production in 2018 and the related statistics and literature.
An agricultural production anniversary was used to set the research boundary. Carbon emission from the crop industry subsystem mainly included GHG from agricultural input as chemical fertilizers, pesticides, seeds and energy use, agricultural operations and crop growth processes. There is scientific consensus that global warming is driven by the increasing emission of GHG from human activities [20]. Studies show that the agriculture system including the process from the production of agricultural materials to the agricultural harvest is the main source of CO2, CH4 and N2O emission [21,22]. Carbon emission from the agriculture subsystem comes mainly as GHG produced from agricultural inputs, intestinal fermentation in poultry and manure making. GHG emission was analyzed for each major stage of the combined crop and animal industry (Figure 1).

2.2. Multi-Objective Linear Programming Model

The multi-objective linear programming model was the selected optimization method in the study and the Lingo software was used for the calculation runs. Linear programming is a mathematical method used to obtain the optimal solution to objective functions under a set of constraint conditions. It organically combines qualitative and quantitative analyses [23] and is a very effective and simple method for structural adjustment and optimization.

2.3. GHG Emission Calculation

GHG emission is the direct and indirect greenhouse gas emission produced by the products or services in a life cycle (or geographical space). It is an indicator used to measure the carbon emission level and to identify carbon emissions of different functional units. The common methods used in the study of carbon footprint is life cycle assessment. This is a “cradle-to-grave” environmental evaluation approach that accounts for every link of the product or service, including production of raw materials, product manufacturing or processing, product use stages and evaluation processes. In this study, GHG produced via agricultural inputs is calculated using life cycle evaluation of agricultural operations as defined by IPCC Guidelines for National Greenhouse Gas Inventories.

2.3.1. Agriculture GHG Emission Calculation

The input of agricultural resources for the Beiqiu Farm production process in 2018 is listed in Table 1 GHG emission from the agricultural subsystem is driven mainly by agricultural production materials, such as pesticides, fertilizers, electric power and planting processes. According to the data in Table 2, GHG emission factors for agricultural resources are in Table 2.

2.3.2. Agricultural Operation Inventory

The list of the farming subsystem is divided into two parts—one is GHG emission from farm crops and the other from livestock. This also includes GHG emissions during farming and manure management operations. GHG emissions from the soil during farm operations such as nitrogen and organic fertilizer management are both direct and indirect. Direct emission of N2O was calculated using Equation (1) as follows:
DF N 2 O = F SN × EF 1 × 44 28
where DF{N2O} is the direct emission of soil N2O expressed as equivalent CO2 emission (kg CO2-eq/hm2); FSN is the annual application rate of soil nitrogen fertilizer; EF1 is the emission factor (kg CO2-eq/hm2) of soil N2O emission from nitrogen input and 44/28 is the conversion coefficient between nitrogen element and nitrous oxide.
The carbon footprint generated by indirect emission of soil N2O is calculated using Equation (2) as follows:
IDF N 2 O = F SN × Frac GASF × EF 4 × 44 28
where IDF{N2O} is the soil N2O indirect emission expressed as CO2 emission equivalent (kg CO2-eq/hm2); Frac{GASF} is the ratio of nitrogen volatized as NH3 and NOX (kg volatile nitrogen/kg nitrogen); EF4 is the N2O emission factor (kg N2O-n/kg (NH3-n +NOX-N)) of nitrogen in atmospheric deposition on soil and water surface.
Therefore, the carbon footprint for soil N2O emission is calculated using Equation (3) as follows:
CF N 2 O = DF N 2 O + IDF N 2 O
The calculated GHG emission from soil management (Table 3) was added to the GHG emission from farming. Then, the GHG emission from the other sub-system was calculated in the same way as the GHG emission from farming (Table 4).

2.3.3. Livestock GHG Emissions Calculation

Based on IPCC research, the calculation of GHG emissions from livestock mainly considers fodder input, methane (CH4) emission from enteric fermentation and methane and nitrous oxide emissions in manure management (direct and indirect).
CH4 emission from enteric fermentation of livestock is calculated as follows:
TCH 4 Enteric = i EF i × N i
where TCH4Enteric is the total methane emission from enteric fermentation (Gg CH4 yr−1); EFi is the emission factor (kg CH4 animal−1 yr −1); Ni is the number of head of livestock category i; i is the species of livestock.
The CH4 emission from manure management is next calculated as follows:
TCH 4 M = i EF j ×   N i
where TCH4-M is the total CH4 emission from manure management (kg CH4 yr−1); EFj is the emission factor (kg CH4 animal−1 yr −1); Ni is the number of head of livestock category i; i is the species of livestock.
Direct N2O emission occurs via combined nitrification and denitrification of nitrogen contained in manure. The emission of N2O from manure during storage and treatment depends on nitrogen and carbon content of manure, and on the duration of storage and type of treatment. Nitrification does not occur under anaerobic conditions. Indirect emission results from volatile nitrogen loss that occurs primarily in the form of ammonia and NOX.
Therefore, the N2O emission from manure management is calculated as follows:
N 2 O D ( mm ) = S T N i ×   Nex i ×   MS i ×   EF 3 S × 44 28
where N2OD(mm) is the direct N2O emission from manure management (kg N2O yr−1); Ni is the number of head of livestock category i; Nex(i) is the annual average N excretion per head of livestock species i (kg N animal−1 yr−1); MSi is the fraction of total annual nitrogen excretion for each livestock category i; EF3s is the emission factor for direct N2O emission from manure management (kg N2O-N/kg N); S is the manure management system; 44/28 is the conversion of N2O-N(mm) emission to N2O(mm) emission.
The N loss due to volatilization from manure management is calculated as follows:
N 2 O G ( mm ) = ( N volatilisation - MMS × EF 4 ) × 44 28
where, Nvolatilisation-MMS is the amount of manure nitrogen lost due to volatilization of NH3 and NOX; EF4 is the emission factor for N2O emission from atmospheric deposition of nitrogen on soil and water surfaces (kg N2O-N(kg NH3-N+NOX-N volatilised)−1).
The carbon footprint of the entire production farm system is finally calculated as follows:
C i = [ CF N 2 O soil + N 2 O D ( mm ) + N 2 O G ( mm ) ] × 298 + [ TCH 4 - Enetric + TCH 4 ( mm ) ] × 21
where CT is the total greenhouse gas emission from livestock category i; a constant factor of 21 is the coefficient of conversion from CH4 to CO2; a constant factor of 298 is the coefficient of conversion from N2O to CO2.
Then, GHG emissions from different species on the farm (Table 5) are calculated using the equations above.

3. Model Building

The multi-objective linear programming model is generally composed of more than two objective functions and a number of constraints. The construction of the model in this paper is to achieve the best economic and ecological benefits, keep the agricultural system a virtuous cycle, and promote the sustainable development of agriculture production. Reconfiguration of farming systems to reach various productive and environmental objectives while meeting farm and policy constraints is complicated by the large array of farm components involved and the multitude of interrelations among the components [7]. In this study, two goals were primarily set up in the model—one was the economic benefit target and the other was the ecological benefit target. Nine kinds of agricultural and livestock products were selected in Beiqiu Farm as decision variables of the model and the corresponding data (Table 6) were all from the actual production process on the farm.
Objective function: The objective function is set according to the needs of agricultural decision-makers as follows:
Y = i = 1 n a i × X i                       i = 1 , 2               n
where ai is the objective function value of variable Xi which, in this study, is unit profit and greenhouse gas emissions in unit variable; Xi is the scale of production activity, namely the scale of planting and breeding industries.
Specifically, agricultural income is an important factor in promoting sustainable development of agriculture. Thus, the objective function was set as the highest agricultural net profit as follows:
Max   f 1   ( xi ) = i = 1 9 ai × xi
Max f1 = 5505 × x1-3780 × x2 + 16,100 × x3 + 23,100 × x4 + 300 × x5 + 200 × x6 + 40 × x7 + 30 × x8 + 15 × x9;
Whereas agriculture maintains high profits, the impact of agricultural production on the environment, especially GHG emission, cannot be ignored. Therefore, the objective function was set as the minimum GHG emission as follows:
Min   f 2   ( xi ) = i = 1 9 bi × xi
Min f2 = 907.91 × x1 + 706.19 × x2 + 2804.86 × x3 + 4090.00 × x4 + 985 × x5 + 768 × x6 + 27.4 × x7 + 0.873 × x8 + 14.1 × x9
Since economic and ecological benefits have different dimensions, the extreme value of a single objective function is first calculated and used to construct a new dimensionless objective function by linear weighting as a single objective function; thereby eliminating the impact of the dimensions [28].
MaxF ( xi ) = w 1 × f 1 f 1 * w 2 × f 2 f 2 *
where wi is the weight of the economic and ecological benefit; in this research, we give them a weight of 0.5 each. The f1 × was calculated as 617,391.8 ¥ and f2 × as 503,542.7 kg CO2-eq.
Currently in the process of production, a planting industry system provides feed and a raising system provides manure as organic fertilizer. However, the problem is the imbalance of the scale of livestock and plant. The soil bearing capacity was too high because of large poultry manure emission and the planting industry provided less feed. The objective of the study was to control the growth of chemical fertilizers, animal manure and GHG emission on the one hand, and to keep planting and breeding industries in a dynamic balance on the other. The adjustment of planting structure proportion in order to make livestock and poultry dung digestible by the internal system needed to be set in the following constraint equations:
Land resource: Beiqiu Farm covers an area of 15 ha; thus, land resource was one of the reasons for limiting the scale of agricultural development. The scale of planting and breeding industry did not exceed 15 ha as:
10,000x1 + 10,000x3 + 1335.34x4 + 0.667x5 + 1.5x6+0.1x7 + 0.25x8 + 0.05x9 = 133,400
Otherwise, wheat and corn were rotated in the planting industry so that the area of wheat and that of corn were set equal in the model. At the same time, corn feed came from corn planting and so the area of corn feed was set less than that of corn planting as:
x1 = x2; x2 = x21 + x22
where x21 is the area of corn silage and x22 is the area of corn stalk
Feed resource: The planting industry provides feed for the livestock industry to ensure the quality of meat and reduce the cost. In the case of Beiqiu Farm, it was mainly corn, wheat bran and ensiling. The demand for fodder for the breeding industry in Beiqiu Farm is given in Table 5. Therefore, the constraint was set such that it was less than the supply of farming industry as follows:
  • Corn feed: 6990 × x2 = 69.7 × x4 + 63.88 × x5 + 3.6 × x6 + 4.84 × x9 + 28.47 × x8;
  • Wheat bran feed: 1050 × x1 = 19.92 × x5 + 1.8 × x7 + 0.74 × x9 + 4.38 × x8;
  • Ensiling feed: 30,000 × x21 = 76.21 × x5 + 146 × x6 + 3.6 × x7;
Straw and Manure: Agricultural wastes produced in farm production are mainly straw and dung. Resource utilization was achieved through composting. Therefore, the amount of straw and manure produced matched. Studies show that in the process of composting, the effect is best when the ratio of carbon to nitrogen is 27 [29,30]. The straw demand of different animal manures is given in Table 7.
11,250 × x1 + 30,000 × x22 = 398.6 × x5 + 213 × x6 + 7.03 × x7 + 0.98 × x9 + 24.98 × x8;
Amount of organic fertilizer: The amount of organic fertilizer made from straw and manure should meet the daily needs of the farm. These data were derived from the actual production process on Beiqiu Farm.
11,250 × x1 + 30,000 × x2 + 398.6 × x5 + 213 × x6 + 7.03 × x7 + 0.98 × x9 + 24.98 × x8 ≥ 3000 × x3 + 3000 × x4 + 1000 × x1;
Land bearing capacity: Straw and manure returned to the field via composting to make organic fertilizer, replacing part of potential chemical fertilizer use. In the planting system, the total demand for crop N is fixed, so the total amount of N input from organic fertilizer and chemical fertilizer should be balanced with the demand for crop N as:
85.2 × x1+64.5 × x2 = 25.68 × x4+16.96 × x5 + 0.9 × x6 + 0.38 × x7 + 0.02 × x8;
Input cost constraints: Currently, the farm has 3 plastic houses and 2 greenhouses. The number of plastic houses and greenhouses are restricted as follows:
X4 ≥ 2; X3, X4 ≤ 10; X3 ≥ 3;

4. Results and Discussions

4.1. Optimized Planting/Breeding Structure

The optimal solution for the farm structure optimization was obtained using the Lingo software calculation. Based on the model optimization results (Table 8), the planting area of wheat and maize on the farm are reduced, and the numbers of greenhouse and unheated greenhouse increase because of high economic benefits. For the breeding industry, the scale of geese is reduced, that of sheep and broiler have increased. However, industries of pigs and layers have completely disappeared. In terms of the rate of change, greenhouses and unheated greenhouses had the highest change. There were mainly two reasons for this high change. The first was that the two structures consumed a lot of organic fertilizer which were from manure compost in the system. The next reason was that income from them was much higher than that from food crops. However, GHG emission from the structures was much higher than that from the wheat-maize system. Given the initial input cost, the expansion of greenhouses and unheated greenhouses was restricted. The scale of winter wheat/summer maize cropping pattern was little changed. This was because winter wheat and summer maize rotation can expend compost and supply fodder, straw and silage to livestock industries. In addition, straw can be used with the manure from the breeding system to dispose excrement and urine, both of which promote a circular economy.
However, the results were for specific conditions. Due to large fluctuations of prices of agricultural products, price changes affected the farm optimization effort. There was therefore need to discuss the change of scale under specific circumstances [31]. The optimization models were relevant in assisting cropping and management of agricultural production. It was also applicable in estimating potential gains from the use of integrated systems [32]. The optimization results obtained in this study were according to the conditions of Beiqiu farm and could be used for referrals only.

4.2. Post-Optimization Benefits/Effects

Farmers usually adjust their farming systems evolutionarily for various reasons. It could be for change in market price that farmers adjust the type and size of their farm products. It could also be for policy change that farmers adjust the structure of cropping and animal husbandry. The understanding of farmers about the impact of agricultural production on the environment is relatively weak. Bio-economic farm models have the potential to support information structuring for more insight into the consequences of adjustments of farming systems [33].
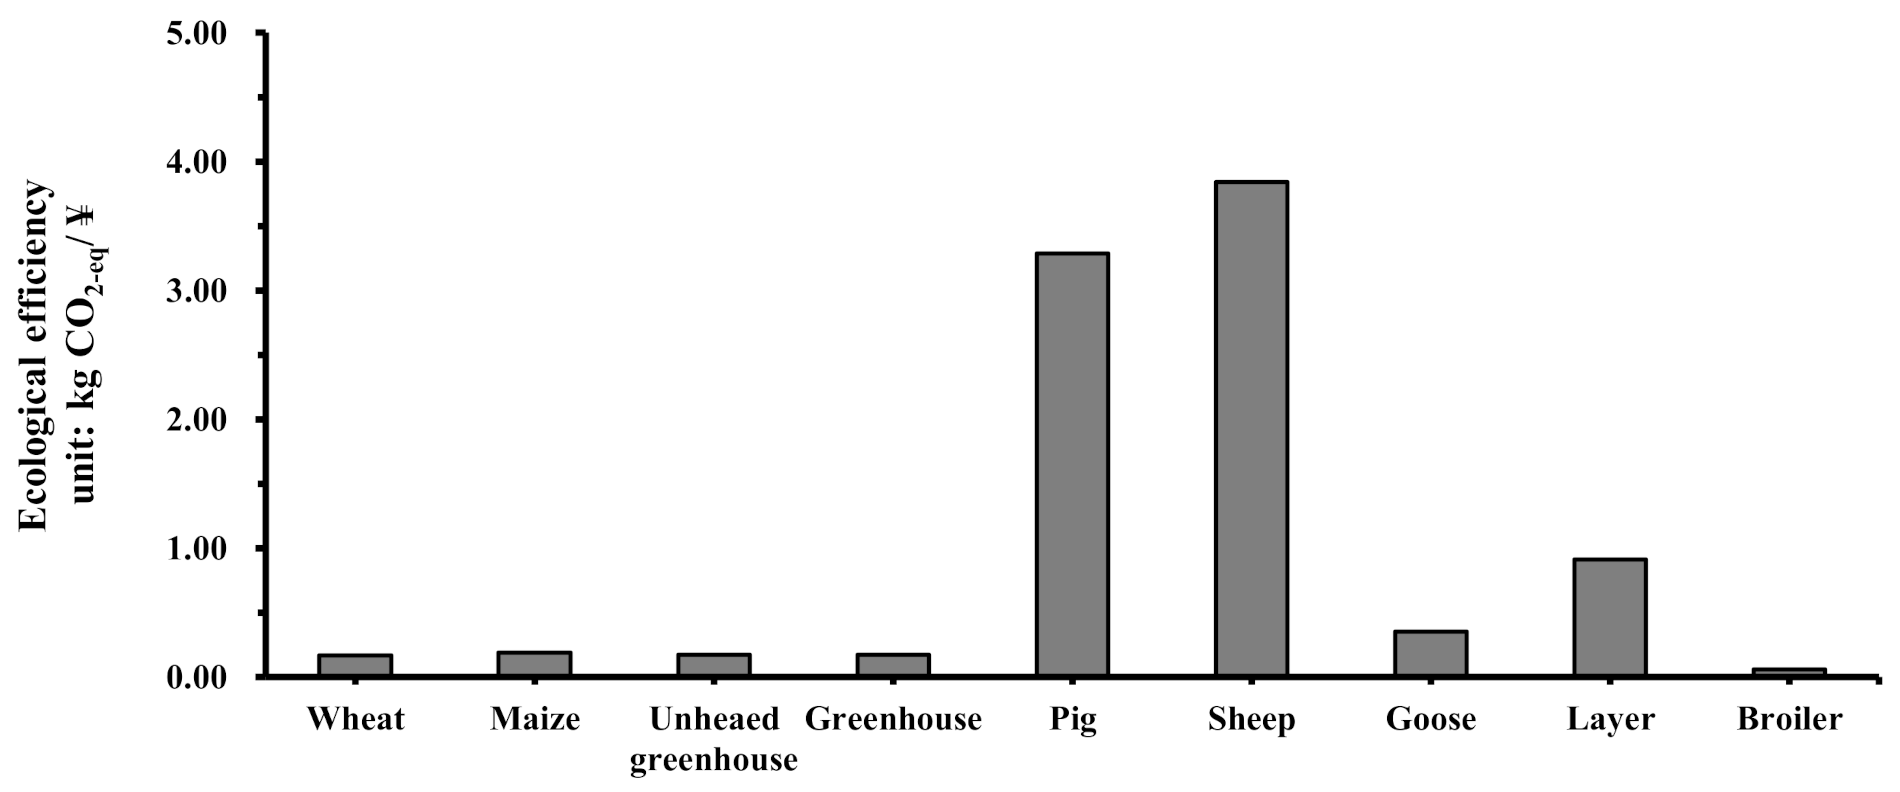
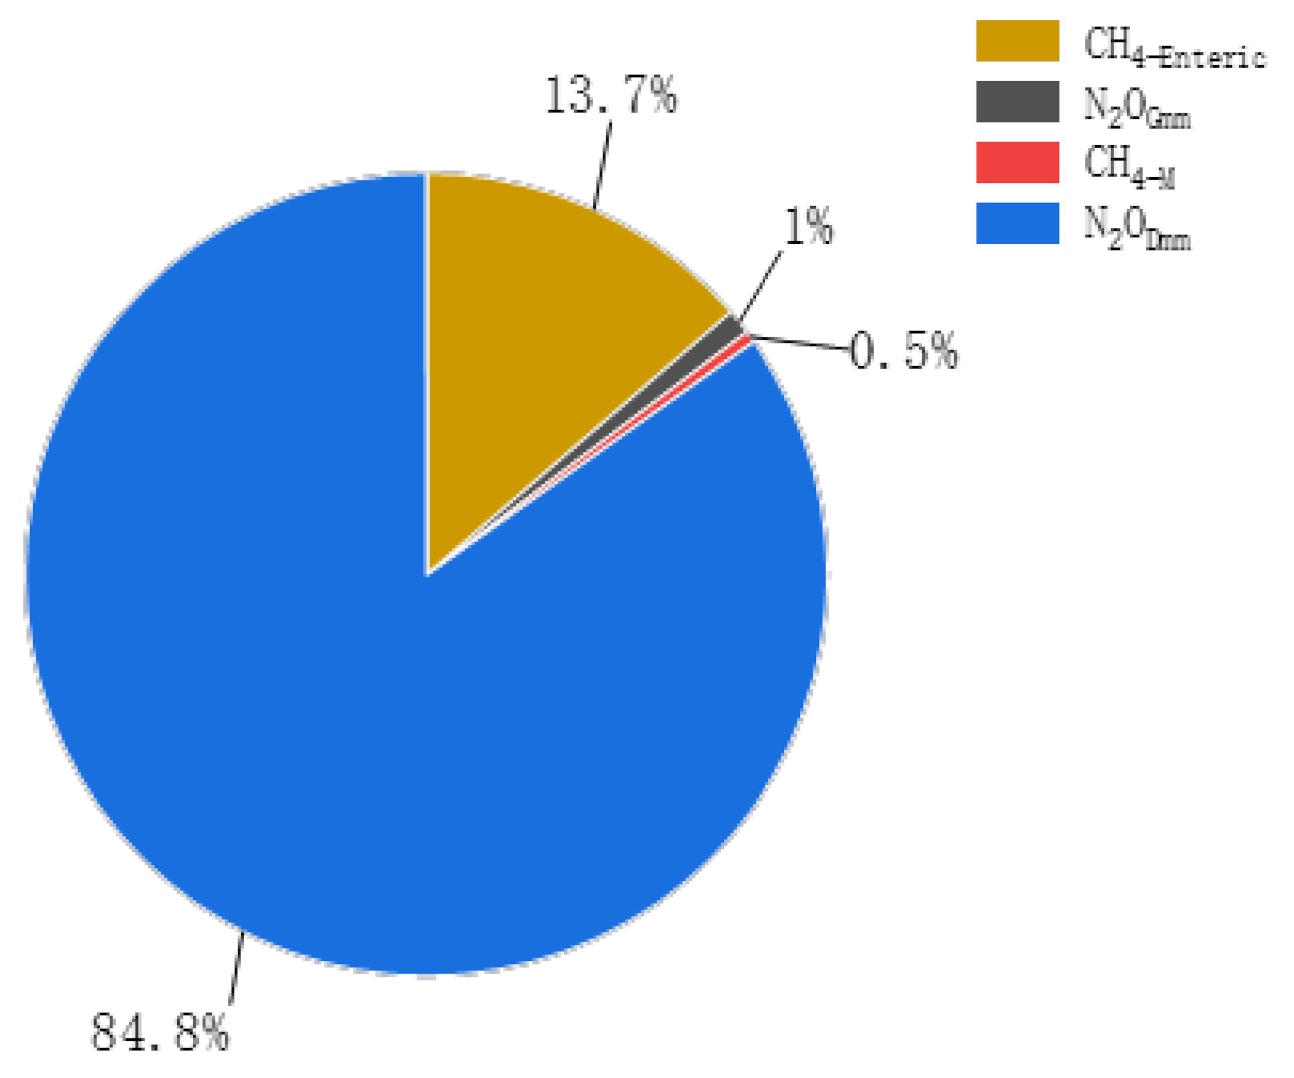
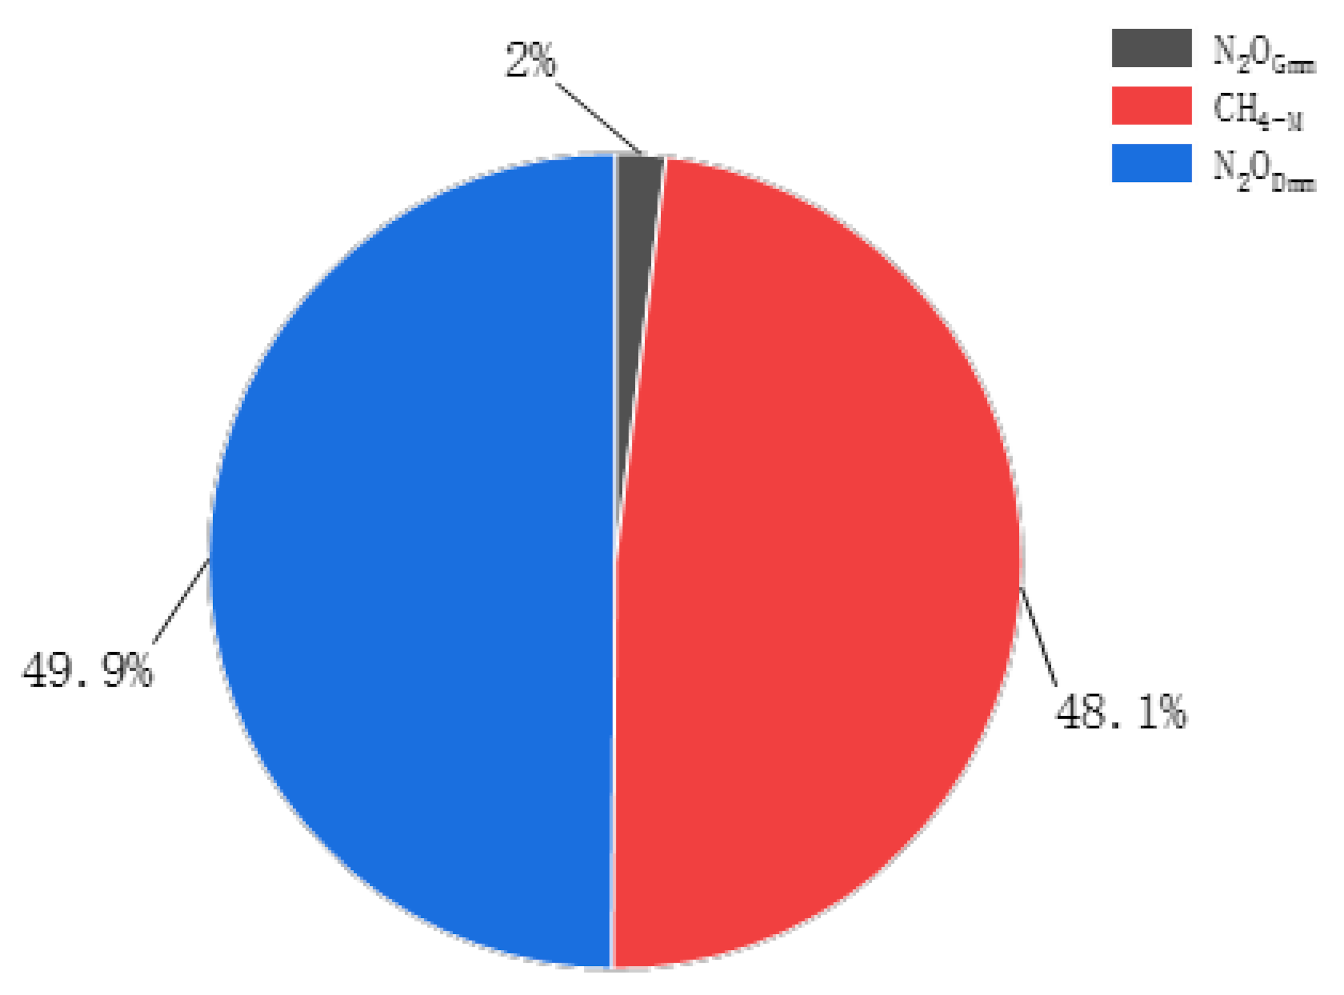
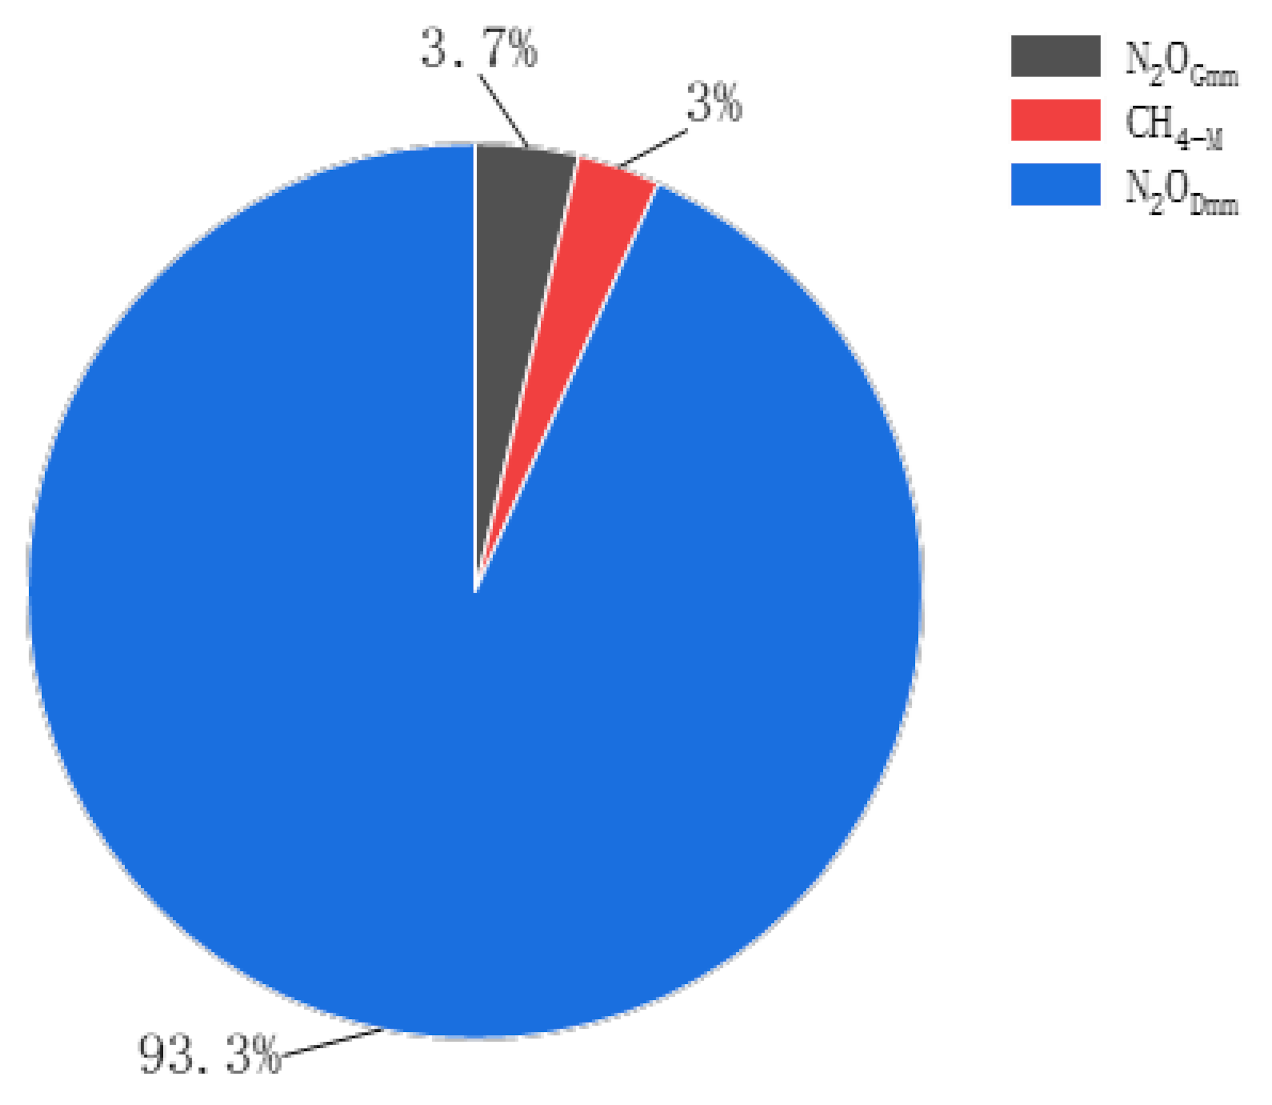
Based on the model optimization, GHG emission from the farm was 36,833.39 kg CO2–eq ha−1 for an estimated profit of 44,831.3 ¥ ha−1. That is the equivalent of 0.82 kg CO2-eq for one ¥ generated. The GHG emission was normalized by the benefit to get ecological efficiency (Figure 2). Sheep industry had the highest ecological efficiency, meaning that sheep industry created one ¥ of profit for a unit release of GHG. Broiler industry was the reverse. In the breeding subsystem, optimization greatly increased the scale of sheep and broilers for a balance to be maintained. This was because sheep which can consume straw and broilers which can consume wheat bran and corn, are indispensable in the circular agriculture system. The main source of GHG emissions was the livestock industry (Figure 3), especially manure management activities (Figure 4). Specifically, CH4 emission from enteric fermentation of sheep excreta was over 10%, while geese and broilers can be ignored. CH4 emission from broiler manure management was over 45% (Figure 5), almost the same as direct N2O emissions from manure management (N2OD (mm)). Direct N2O emissions, which occur via combined nitrification and denitrification of nitrogen contained in the manure, was the main source of GHG emission from sheep and geese industries (Figure 6). The emission of N2O from manure during storage and treatment depends on the nitrogen and carbon content of manure, and on the duration of the storage and type of treatment. Indirect N2O emissions due to volatilization of N from manure management (N2OG (mm)) can be ignored. Thus, the focus of reducing GHG emissions from circular agriculture was on improving measures for manure management and adjusting the feed structure. There was also need to reform livestock and poultry breeding technologies and management and to change the livestock pattern [34]. Sustainable livestock intensification can be key in reducing GHG emission. It provides synergy across productivity and increases income. The mitigation of climate change was another benefit due to future development of low-carbon agriculture [35].
Crop production accounts for only 13% of GHG emissions in circular agriculture, and it was mainly from the heavy fertilizer use. However, looking at the individual plates, GHG emissions from crop in circular agriculture are far less than that from conventional agriculture. This was because of the use of organic fertilizer from the recycle use of manure and straw. Studies show that using organic fertilizer is a key way of reducing carbon emission from chemical fertilizers [12,36]. China’s traditional energy consumption structure has increased the carbon footprint in fertilizer production and agricultural machinery use. Improving the energy efficiency and using cleaner energy can reduce the overall GHG emission [14]. Therefore, reducing carbon emission from agricultural production and maintaining the scales of planting and breeding remains is possible. This can be achieved by reducing inputs of chemical fertilizers and pesticides in cropping systems and utilizing the resource as poultry manure in livestock production.

4.3. Balance in Economy and Environment

In circular agriculture, feed generated in the crop industry is fed to the livestock industry and this helps reduce carbon emission as GHG along the food chain. Part of the maize silage was used in place of concentrate to reduce cost in the livestock industry [37]. Most of the feed was from the agricultural system, which not only ensured quality of agricultural products but also saved cost. This ecological efficiency of the circular agriculture system increased from 0.7 to 0.82 after optimization. Here, part of the environment was sacrificed in terms of GHG emission for economic benefits on the simulated circular agriculture system. On the other hand, however, recycling agriculture waste solved the issue of environmental pollution caused by straw burning and waste emissions.
In addition to economic gains, the use of integrated systems is beneficial to the environment. This is especially so through reuse of resources and the related negative environmental externalities [38]. China is one of the countries with the most abundant straw and dung. Based on statistics, the annual crop straw in China is as high as 900 million tons, and is increasing at a rate of 5‒10% every year [39]. In 2016, the amounts of livestock and poultry manure in China hit 3.16 × 10⁹ t. However, the comprehensive utilization rate of the resources was less than 60% [40]. Straw and feces returned to the field is a carbon sequestration measure that can lead to sustainable agricultural development. After optimization, we can make the full use of agricultural waste.
The comprehensive use of solid organic waste on the farmlands is an increasing concern in agricultural production. Straw and livestock manure are rich in organic matter and various nutrient elements, making it suitable for boosting soil fertility and soil organic matter content when applied as organic fertilizer. The main drive for straw and manure resource use is waste utilization, and the basis of it is a dynamic balance between the scale of crop and livestock industries. Composting as a valuable technology, is also widely used in recycling agricultural organic wastes. This converts organic matter into a relatively stable humus-like substance through microbial transformation [41,42]. Soil quality can be improved by using compost in place of chemical fertilizer, which is critical in the development of circular agriculture.
The European Union (2012) encourages the use of bio-waste in agriculture as it improves soil condition and provides valuable nutrients to plants [43]. Composting is one of the most effective processes used in recycling organic waste, applicable to soils as organic amendment [30]. The focus of this study was on the balance between GHG emission and agriculture income, which has a far-reaching influence on agricultural development. Issues such as soil N bearing capacity, agricultural waste disposal, food safety, food health and cost input were considered under controlled conditions. Studies show that, although farmers have more options in making practical decisions, the general focus is often on economic maximization. For strategic decision-making, therefore, farmers account for options that influence long-term performance and indicators associated with sustainability [44]. The model used in this study optimized the structure and scale of circular agriculture on the basis of both economic and environmental outputs, laying the basis for agricultural development [45]. It is difficult to balance economy with environment in terms of agricultural operations. This study provided a feasible pathway for rational decision-making in complex agricultural systems.

5. Conclusions

Building a management model for agricultural planting structure adjustment is a complex engineering task that considers land, water and climate resources in a time-space fabric. The challenge with on-farm research on models is to keep processes and output functions transparent and relevant to farm management [46,47]. There is also concern for market demand and social characteristics in relation to economic growth, environmental protection, etc. The objective of this study was to determine the economic benefit and GHG emission in a typical agricultural farm using a multi-objective linear scale model, ant to optimize the structure and scale of growing crops and raising animals on the farm. The model-driven optimized farm was a strong scientific basis for the adjustment of agricultural structure and the development of circular agriculture in the study area and beyond. The model was strongly operable, flexible and adjustable to set targets or constraint conditions. It therefore provided the needed guidance for the development of circular agriculture with different needs in different social settings.

Author Contributions

Conceptualization, S.H. and Z.O.; methodology, S.H.; data curation, Y.L.; writing—original draft preparation, S.H.; writing—review and editing, J.L., X.X., H.G., Y.X., Y.L. (Yun Lyu), Y.L. (Yang Li); funding acquisition, Z.O. All authors have read and agreed to the published version of the manuscript.

Funding

This research was funded by Chinese Academy of Sciences (Project numbers: XDA23050103 and KFJ-STS-ZDTP-049).

Institutional Review Board Statement

Not applicable.

Informed Consent Statement

Not applicable.

Data Availability Statement

Not applicable.

Acknowledgments

We thank the reviewers and editors very much for the very useful suggestions and comments.

Conflicts of Interest

The authors declare no conflict of interest.

References

  1. Wang, H.; Li, H.; Wu, X. Study on Information Needs for Promoting the Development of Circular Agriculture. In Environmental Technology and Resource Utilization II; Zhang, L., Ed.; Trans Tech Publications Ltd.: Stafa-Zurich, Switzerland, 2014; pp. 1028–1031. [Google Scholar]
  2. Ghisellini, P.; Cialani, C.; Ulgiati, S. A Review on Circular Economy: The Expected Transition to a Balanced Interplay of Environmental and Economic Systems. J. Clean. Prod. 2016, 114, 11–32. [Google Scholar] [CrossRef]
  3. Li, B.; Feng, Y.; Xia, X.; Feng, M. Evaluation of China’s Circular Agriculture Performance and Analysis of the Driving Factors. Sustainability 2021, 13, 1643. [Google Scholar] [CrossRef]
  4. Lalehzari, R.; Nasab, S.B.; Moazed, H.; Haghighi, A.; Yaghoobzadeh, M. Simulation–optimization modelling for water resources management using nsgaii-oip and modflow. Irrig. Drain. 2020, 69, 317–332. [Google Scholar] [CrossRef]
  5. Li, M.; Fu, Q.; Singh, V.P.; Ji, Y.; Liu, D.; Zhang, C.; Li, T. An optimal modelling approach for managing agricultural water-energy-food nexus under uncertainty. Sci. Total Environ. 2019, 651, 1416–1434. [Google Scholar] [CrossRef] [PubMed]
  6. Allam, M.M.; Eltahir, E.A.B. Water-Energy-Food Nexus Sustainability in the Upper Blue Nile (UBN) Basin. Front. Environ. Sci. 2019, 7, 7. [Google Scholar] [CrossRef] [Green Version]
  7. Groot, J.; Oomen, G.J.; Rossing, W.A. Multi-objective optimization and design of farming systems. Agric. Syst. 2012, 110, 63–77. [Google Scholar] [CrossRef]
  8. Klein, T.P.; Holzkämper, A.; Calanca, P.; Seppelt, R.; Fuhrer, J. Adapting agricultural land management to climate change: A regional multi-objective optimization approach. Landsc. Ecol. 2013, 28, 2029–2047. [Google Scholar] [CrossRef] [Green Version]
  9. Groot, J.C.J.; Rossing, W.A.H. Model-aided learning for adaptive management of natural resources: An evolutionary design perspective. Methods Ecol. Evol. 2011, 2, 643–650. [Google Scholar] [CrossRef]
  10. FAO. The State of Food and Agriculture: Climate Change, Agriculture and Food Security; FAO: Rome, Italy, 2016. [Google Scholar]
  11. Tilman, D.; Balzer, C.; Hill, J.; Befort, B.L. Global food demand and the sustainable intensification of agriculture. Proc. Natl. Acad. Sci. USA 2011, 108, 20260–20264. [Google Scholar] [CrossRef] [Green Version]
  12. Zhang, X.; Liu, H.; Lai, G. Relationship between fertilizer application and carbon emission reduction of large-scale farmers. Jiangsu Agric. Sci. 2018, 46, 279–284. [Google Scholar]
  13. Gan, Y.; Liang, C.; Campbell, C.A.; Zentner, R.P.; Lemke, R.L.; Wang, H.; Yang, C. Carbon footprint of spring wheat in response to fallow frequency and soil carbon changes over 25 years on the semiarid Canadian prairie. Eur. J. Agron. 2012, 43, 175–184. [Google Scholar] [CrossRef]
  14. She, W.; Wu, Y.; Huang, H.; Chen, Z.; Cui, G.; Zheng, H.; Guan, C.; Chen, F. Integrative analysis of carbon structure and carbon sink function for major crop production in China’s typical agriculture regions. J. Clean. Prod. 2017, 162, 702–708. [Google Scholar] [CrossRef]
  15. Liu, W.; Zhang, G.; Wang, X.; Lu, F.; Ouyang, Z. Carbon footprint of main crop production in China: Magnitude, spatial-temporal pattern and attribution. Sci. Total Environ. 2018, 645, 1296–1308. [Google Scholar] [CrossRef] [PubMed]
  16. Huang, J.; Chen, Y.; Pan, J.; Liu, W.; Yang, G.; Xiao, X.; Zheng, H.; Tang, W.; Tang, H.; Zhou, L. Carbon footprint of different agricultural systems in China estimated by different evaluation metrics. J. Clean. Prod. 2019, 225, 939–948. [Google Scholar] [CrossRef]
  17. Liu, C.; Lu, M.; Cui, J.; Li, B.; Fang, C. Effects of straw carbon input on carbon dynamics in agricultural soils: A meta-analysis. Glob. Chang. Biol. 2014, 20, 1366–1381. [Google Scholar] [CrossRef] [PubMed]
  18. Yan, M.; Cheng, K.; Luo, T.; Yan, Y.; Pan, G.; Rees, R.M. Carbon footprint of grain crop production in China—Based on farm survey data. J. Clean. Prod. 2015, 104, 130–138. [Google Scholar] [CrossRef]
  19. Yang, X.; Gao, W.; Zhang, M.; Chen, Y.; Sui, P. Reducing agricultural carbon footprint through diversified crop rotation systems in the North China Plain. J. Clean. Prod. 2014, 76, 131–139. [Google Scholar] [CrossRef]
  20. Ledgard, S.F.; Wei, S.; Wang, X.; Falconer, S.; Zhang, N.; Zhang, X.; Ma, L. Nitrogen and carbon footprints of dairy farm systems in China and New Zealand, as influenced by productivity, feed sources and mitigations. Agric. Water Manag. 2019, 213, 155–163. [Google Scholar] [CrossRef]
  21. West, T.O.; Marland, G. Net carbon flux from agriculture: Carbon emissions, carbon sequestration, crop yield, and land-use change. Biogeochemistry 2003, 63, 73–83. [Google Scholar] [CrossRef]
  22. Schmidhuber, J.; Tubiello, F.N. Global food security under climate change. Proc. Natl. Acad. Sci. USA 2007, 104, 19703–19708. [Google Scholar] [CrossRef] [PubMed] [Green Version]
  23. Yu, J.; Wang, R.; Chang, H.; Gao, M.; Wang, Z.; Mo, J.; Gao, C. Optimization of crop and livestock industry in Daxinganling agricultural reclamation based on planting-breeding balance. J. China Agric. Resour. Reg. Plan. 2017, 38, 228–236. [Google Scholar]
  24. Ecoinvent Database [EB/OL] (2011-05-11). Available online: http://www.ecoinvent.ch (accessed on 20 June 2016).
  25. Liu, X.L.; Wang, H.T.; Chen, J.; He, Q.; Zhang, H.; Jiang, R.; Chen, X.X.; Hou, P. Method and basic model for development of Chinese reference life cycle database of fundamental industries. Acta Sci. Circumstantiate 2010, 30, 2136–2144. [Google Scholar]
  26. Li, J.; Wang, D.; Wang, L.; Wang, Y.; Li, H. Evaluation of nitrogen and water management on greenhouse gas mitigation in winter wheat-summer maize cropland system in North China. J. Plant. Nutr. Fertitizer 2016, 22, 921–929. [Google Scholar]
  27. National Development and Reform Commission on Climate Change. Low- Carbon Development and Provincial Greenhous Gas. Inventory Training Materials[R]; National Development and Reform Commission on Climate Change: Beijing, China, 2013. [Google Scholar]
  28. Niu, K. Studies of multi-objective linear programming model on Chinese agricultural structure adjustment. Acta Agric. Zhejiangensis 2011, 23, 840–846. [Google Scholar]
  29. Zhou, J.-M. The Effect of Different C/N Ratios on the Composting of Pig Manure and Edible Fungus Residue with Rice Bran. Compos. Sci. Util. 2017, 25, 120–129. [Google Scholar] [CrossRef]
  30. Pergola, M.; Persiani, A.; Palese, A.M.; Di Meo, V.; Pastore, V.; D’Adamo, C.; Celano, G. Composting: The way for a sustainable agriculture. Appl. Soil Ecol. 2018, 123, 744–750. [Google Scholar] [CrossRef]
  31. Todman, L.C.; Coleman, K.; Milne, A.E.; Gil, J.D.B.; Reidsma, P.; Schwoob, M.-H.; Treyer, S.; Whitmore, A.P. Multi-objective optimization as a tool to identify possibilities for future agricultural landscapes. Sci. Total Environ. 2019, 687, 535–545. [Google Scholar] [CrossRef] [PubMed]
  32. Gameiro, A.H.; Rocco, C.; Filho, J.V.C. Linear Programming in the economic estimate of livestock-crop integration: Application to a Brazilian dairy farm. Rev. Bras. Zootec. 2016, 45, 181–189. [Google Scholar] [CrossRef] [Green Version]
  33. Thornton, P.; Herrero, M. Integrated crop–livestock simulation models for scenario analysis and impact assessment. Agric. Syst. 2001, 70, 581–602. [Google Scholar] [CrossRef]
  34. Patra, A.K. Accounting methane and nitrous oxide emissions, and carbon footprints of livestock food products in different states of India. J. Clean. Prod. 2017, 162, 678–686. [Google Scholar] [CrossRef]
  35. Paul, B.K.; Groot, J.C.J.; Birnholz, C.A.; Nzogela, B.; Notenbaert, A.; Woyessa, K.; Sommer, R.; Nijbroek, R.; Tittonell, P. Reducing agro-environmental trade-offs through sustainable livestock intensification across smallholder systems in Northern Tanzania. Int. J. Agric. Sustain. 2019, 18, 35–54. [Google Scholar] [CrossRef] [Green Version]
  36. Bos, J.F.; Berge, H.F.T.; Verhagen, J.; Van Ittersum, M.K. Trade-offs in soil fertility management on arable farms. Agric. Syst. 2017, 157, 292–302. [Google Scholar] [CrossRef]
  37. Lyu, Y.; Li, J.; Hou, R.; Zhu, H.; Zhu, W.; Hang, S.; Ouyang, Z. Goats or pigs? Sustainable approach of different raising systems fed by maize silage. J. Clean. Prod. 2020, 254, 120151. [Google Scholar] [CrossRef]
  38. Accatino, F.; Tonda, A.; Dross, C.; Léger, F.; Tichit, M. Trade-offs and synergies between livestock production and other ecosystem services. Agric. Syst. 2019, 168, 58–72. [Google Scholar] [CrossRef]
  39. Shi, Z.L.; Jia, T.; Wang, Y.J.; Wang, J.C.; Sun, R.H.; Wang, F.; Li, X.; Bi, Y.Y. Comprehensive utilization status of crop straw and estimation of carbon from burning in China. J. China Agric. Resour. Reg. Plan. 2017, 38, 32–37. [Google Scholar]
  40. Song, D.; Hou, S.; Wang, X.; Liang, G.; Zhou, W. Nutrient resource quantity of animal manure and its utilization potential in China. J. Plant Nutr. Fertitizer 2018, 24, 1131–1148. [Google Scholar]
  41. Negi, S.; Mandpe, A.; Hussain, A.; Kumar, S. Collegial effect of maggots larvae and garbage enzyme in rapid composting of food waste with wheat straw or biomass waste. J. Clean. Prod. 2020, 258, 120854. [Google Scholar] [CrossRef]
  42. Sharma, D.; Yadav, K.D.; Kumar, S. Biotransformation of flower waste composting: Optimization of waste combinations using response surface methodology. Bioresour. Technol. 2018, 270, 198–207. [Google Scholar] [CrossRef]
  43. Afonso, S.; Arrobas, M.; Pereira, E.L.; Rodrigues, M. Ângelo Recycling nutrient-rich hop leaves by composting with wheat straw and farmyard manure in suitable mixtures. J. Environ. Manag. 2021, 284, 112105. [Google Scholar] [CrossRef] [PubMed]
  44. Mandryk, M.; Reidsma, P.; Kanellopoulos, A.; Groot, J.C.J.; Van Ittersum, M.K. The role of farmers’ objectives in current farm practices and adaptation preferences: A case study in Flevoland, the Netherlands. Reg. Environ. Chang. 2014, 14, 1463–1478. [Google Scholar] [CrossRef]
  45. Strauch, M.; Cord, A.F.; Pätzold, C.; Lautenbach, S.; Kaim, A.; Schweitzer, C.; Seppelt, R.; Volk, M. Constraints in multi-objective optimization of land use allocation—Repair or penalize? Environ. Model. Softw. 2019, 118, 241–251. [Google Scholar] [CrossRef]
  46. Sterk, B.; Van Ittersum, M.; Leeuwis, C.; Rossing, W.; Van Keulen, H.; Van De Ven, G.; Van Ittersum, M. Finding niches for whole-farm design models–contradictio in terminis? Agric. Syst. 2006, 87, 211–228. [Google Scholar] [CrossRef]
  47. Andrieu, N.; Nogueira, D.M. Modeling biomass flows at the farm level: A discussion support tool for farmers. Agron. Sustain. Dev. 2010, 30, 505–513. [Google Scholar] [CrossRef] [Green Version]
Figure 1. Major greenhouse gas emissions at each stage of the crop and animal production system.
Sustainability 13 07154 g001
Figure 2. Ecological efficiency for different categories of the farm activities.
Sustainability 13 07154 g002
Figure 3. Plot of difference between the economy and environment due to cropping and raising animals.
Sustainability 13 07154 g003
Figure 4. Different sources of GHG emission (CO2-eq) from sheep industry.
Sustainability 13 07154 g004
Figure 5. Different sources of GHG emission (CO2-eq) from goose broiler industry.
Sustainability 13 07154 g005
Figure 6. Different sources of GHG emission (CO2-eq) from goose industry.
Sustainability 13 07154 g006
Table 1. Inputs for crops in farm production.
ItemUnitWheatMaizeUnitUnheated GreenhouseGreenhouse
Seedskg·ha−112020Seedings/each30006000
Nkg·ha−14525kg/each225345
P2O5kg·ha−137.537.5kg/each225345
K2Okg·ha−137.537.5kg/each225345
Manure CompostN kg·ha−11515N Kg/each9090
Herbicidekg·ha−10.220.2
DieselL·ha−14040
ElectricityKwh·ha−1K·wh/each500900
GHG EmissionsCO2-eq kg·ha−1323.583292.78CO2-eq kg/each1138.751806.75
Table 2. Greenhouse gas emission factors for different crops and livestock.
ItemEmission FactorUnitReference
Maize seed1.93kg CO2-eq/kgEcoinvent 2.2 [24]
Wheat seed0.58kg CO2-eq/kgEcoinvent 2.2
Corn (fodder)0.79kg CO2-eq/kgCLCD 0.7 [25]
Bean (fodder)0.84kg CO2-eq/kgCLCD 0.7
Bran (fodder)0.01kg CO2-eq/kgCLCD 0.7
Pesticide10.15kg CO2-eq/kgEcoinvent 2.2
N from fertilizer1.53kg CO2-eq/kgCLCD 0.7
Manure Compost0.20kg CO2-eq/kg(Li et al. 2016) [26]
P2O51.63kg CO2-eq/kgCLCD 0.7
K2O0.65kg CO2-eq/kgCLCD 0.7
Electricity0.527kg CO2-eq/K·whNational Development & Reform Commission [27]
Diesel4.10kg CO2-eq/kgCLCD 0.7
Table 3. Data for soil N2O emission from wheat-maize field in the study area.
ItemsN from Fertilizer (kg N2O-N/kg N)N from Manure Compost (kg N2O-N/kg N)
Managed soil60.0030.00
Direct emission1.41
Indirect emission0.19
Total1.60
Table 4. Greenhouse gas emissions from different farming systems.
ItemWheatMaizeUnheated GreenhouseGreenhouse
UnitCO2-eq kg·ha−1CO2-eq kg·ha−1CO2-eq kg/perCO2-eq kg/per
Value907.91706.192804.864090.00
Table 5. Greenhouse gas emissions from different livestock industries.
SpeciesCH4-EnetricCH4-MN2OD (mm)N2OG (mm)BeanTotal
Unitskg/headkg/headkg/headkg/headkg CO2-eq/headkg CO2-eq/head
Pig0.331.503.107.75 × 10−26.51 × 10−2985.00
Sheep5.000.172.192.62 × 10−22.20 × 10−2768.00
Goose0.020.041.77 × 10−31.48 × 10−314.10
Layer0.030.093.46 × 10−32.90 × 10−327.40
Broiler0.021.46 × 10−35.85 × 10−54.91 × 10−50.87
Table 6. Parameters for different crops and livestock species.
ItemsVariableUnitProfit/(¥·Unit−1)Land/m2Fodder/(kg·Unit−1)
CornBranEnsilingBean
WheatX1Ha5505100001050.00
MaizeX2Ha378010000699030000
Unheated greenhouseX3Each16,100667.67
GreenhouseX4Each23,4901335.34
PigX5Head3000.67−69.70−19.92−76.21−33.32
SheepX6Head2001.50−63.88−146.00−41.96
GooseX7Head400.10−3.60−1.80−3.60−3.00
LayerX8Head300.25−28.47−4.38−10.95
BroilerX9Head150.05−4.84−0.74−1.86
Table 7. The straw demand of different livestock.
SpeciesStraw DemandN from Manure Compost
kg/headkg/head
Pig398.5925.68
Sheep7.0316.96
Goose213.010.9
Layer24.980.38
Broiler0.980.02
Table 8. Model simulated results under circular agriculture optimization.
ItemVariableUnitResultActual ScaleRate %
WheatX1ha5.677.33−22.73
MaizeX2ha5.677.33−22.73
Unheated greenhouseX3each103233.33
GreenhouseX4each92350.00
PigX5head055−100.00
SheepX6head628501156.00
GooseX7head1831000−81.70
LayerX8head05500−100.00
BroilerX9head76351000663.50
Publisher’s Note: MDPI stays neutral with regard to jurisdictional claims in published maps and institutional affiliations.