Article

Predicting Fuel Consumption Reduction Potentials Based on 4D Trajectory Optimization with Heterogeneous Constraints

1
College of Civil Aviation, Nanjing University of Aeronautics and Astronautics, Nanjing 211106, China
2
Strategic Development Department, Air Traffic Management Bureau, Civil Aviation Administration of China, Beijing 100020, China
*
Author to whom correspondence should be addressed.
These authors contributed equally to this work.
Sustainability 2021, 13(13), 7043; https://doi.org/10.3390/su13137043
Submission received: 25 May 2021 / Revised: 19 June 2021 / Accepted: 21 June 2021 / Published: 23 June 2021

Abstract

:
Investigating potential ways to improve fuel efficiency of aircraft operations is crucial for the development of the global air traffic management (ATM) performance target. The implementation of trajectory-based operations (TBOs) will play a major role in enhancing the predictability of air traffic and flight efficiency. TBO also provides new means for aircraft to save energy and reduce emissions. By comprehensively considering aircraft dynamics, available route limitations, sector capacity constraints, and air traffic control restrictions on altitude and speed, a “runway-to-runway” four-dimensional trajectory multi-objective planning method under loose-to-tight heterogeneous constraints is proposed in this paper. Taking the Shanghai–Beijing city pair as an example, the upper bounds of the Pareto front describing potential fuel consumption reduction under the influence of flight time were determined under different airspace rigidities, such as different ideal and realistic operating environments, as well as fixed and optional routes. In the congestion-free scenario with fixed route, the upper bounds on fuel consumption reduction range from 3.36% to 13.38% under different benchmarks. In the capacity-constrained scenario, the trade-off solutions of trajectory optimization are compressed due to limited available entry time slots of congested sectors. The results show that more flexible route options improve fuel-saving potentials up to 8.99%. In addition, the sensitivity analysis further illustrated the pattern of how optimal solutions evolved with congested locations and severity. The outcome of this paper would provide a preliminary framework for predicting and evaluating fuel efficiency improvement potentials in TBOs, which is meaningful for setting performance targets of green ATM systems.

1. Introduction

Growth in air travel is having an increasing environmental impact. According to the 2019 International Civil Aviation Organization (ICAO) Environmental Report, one of the aviation industry’s targets to improve fuel efficiency by 1.5% every year has been constantly met and exceeded, averaging a 2.4% annualized improvement since 2009. The aim is to halve net emissions by 2050 compared with 2005 [1]. Studies have shown that there is a significant proportional relationship between carbon emission and fuel consumption [2]. Therefore, with the continuous growth of demand for air transportation, increasing the fuel efficiency of aircraft has become a key goal in the aviation industry. Aircraft technology and design improvements [3,4], improvement of the socioeconomic policies related to air transportation [5,6], optimization of aircraft operation processes [7,8], and the search for alternative fuels [9,10] are driving environmentally friendly aviation. In 2019, ICAO’s Committee on Aviation Environment Protection (CAEP) estimated that the planned implementation of the operational improvements detailed in the Aviation System Block Upgrade (ASBU) framework should provide an annual fuel savings of approximately 5.4–10.7 Mt in 2025 (compared with 2015) [1]. The Single European Sky ATM Research (SESAR), U.S. Next Generation Air Transport System (NEXTGEN), and China’s Civil Aviation ATM Modernization Strategy (CAAMS) have placed environmental friendliness, including increased fuel efficiency, at the forefront of future air traffic operations.
Trajectory-based operation is one of the basic characteristics of the new generation of air transportation systems. It aims to realize four-dimensional (4D) trajectory planning and control before takeoff and during flight through continuous information exchange between various stakeholders. The realization not only plays a major role in enhancing the predictability of air traffic and flight efficiency but also provides a new means for saving energy and reducing emissions. The 4D trajectory optimization model is a process of designing continuous or discrete trajectories composed of 3D positions and time, which minimizes (or maximizes) some measure of performance (travel time, environmental impact, etc.) while satisfying a set of constraints (aircraft performance, capacity, etc.). At present, trajectory optimizations for different flight phases, including taxiing on the airport surface, climb and descent in the Terminal Maneuvering Area (TMA), and cruise in en-route airspace, aiming at improving fuel efficiency have been extensively studied.
In order to reduce fuel consumption and exhaust emissions during taxiing on the airport surface, push-back control strategy [11,12], taxiing trajectory and speed profile optimizations [13,14], and improvement of taxiing mode (e.g., single-engine taxiing, operational tow-outs, and electric taxiing) [15,16] have been comprehensively investigated. During climb and descent, especially in high-density terminal airspace, prior research has focused more on how to make full use of runway capacity, while minimizing noise, total fuel consumption, emissions, and delays [17,18,19], and put forward operating concepts and operating procedures such as Continuous Climbing Operation (CCO) [20], Continuous Descending Operation (CDO) [21], Point Merge (PM) [22], etc. Prats et al. [23] presented a non-linear multi-objective optimal control methodology to design noise abatement procedures aimed at reducing the global annoyance perceived by the population living around the airports. Zhu et al. [24] generated the optimal descent trajectory based on the verification that there existed a certain relationship between fuel consumption and flight altitude as well as between aircraft weight and vacuum speed during descent. Rodríguez-Díaz et al. [25] developed a multi-objective optimization model under the Constrained Position Shifting (CPS) constraint to minimize noise pollution, fuel consumption, and delays. In addition, with the continuous deepening of research and field trials, the traditional terminal standard arrival and departure procedures are shown to be relatively rigid, which are less flexible to support optimal trajectory planning and implementation in the TBO context. Some novel airspace structure and operation modes were proposed to enhance the flexibility and controllability of the user-preferred trajectory [26,27].
For trajectory optimization in the en-route airspace, considerations are mainly given to fuel consumption, emissions, condensation trails, and their impact on the climate. Lovegren et al. [28,29,30] improved the fuel efficiency of aircraft by optimizing the altitude and speed profile. Soler et al. [31] studied the influence of atmospheric uncertainty, convective indicators, and cost-index on the leveled aircraft trajectory optimization. For the horizontal profile, Patron et al. [32] considered the wind direction during cruise and used genetic algorithms to select an optimal flight path for the aircraft in the pre-tactical stage. With the objective of minimizing total fuel consumption, Hartjes et al. [33] studied the long-haul flight fuel efficiency of commercial aircraft formations and analyzed the impact of wind field on the performance. Studies have shown that the choice of flight path has a significant impact on fuel efficiency and the environment. Coordinated optimization of a flight’s path and vertical profile has gradually become popular in recent years [34,35].
In addition, integrated trajectory optimization during multiple flight stage have been studied. Soler et al. proposed a multi-phase optimal control framework for commercial aircraft 4D flight trajectory planning [36]. Taking conventional cost and environmental cost into account, Tian et al. optimized a green 4D trajectory of single commercial aircraft [37]. Based on alternative trajectory options and traffic volume hotspot detection, Melgosa et al. presented an enhanced Demand and Capacity Balance (DCB) formulation, with the aim of minimizing operating costs [38]. Harada et al. evaluated the operational advantages of TBO in terms of fuel consumption, flight time, and flight distance of domestic flights in Japan [39].
Extensive studies on green trajectory planning have been implemented for different flight phases (takeoff, landing, and cruise) at the strategic and pre-tactical levels, but there are still some limitations. (1) Trajectory planning is more focused on individual optimization of the flight stage, while complete trajectory optimization from runway to runway, or even gate to gate, is rarely discussed. Meanwhile, trajectory optimization is more focused on a single dimension of a horizontal path or a vertical profile. (2) In the process of trajectory optimization, less consideration is given to realistic constraints such as the candidate routes and sector capacity limitations. (3) Investigating the potentials of fuel efficiency improvement trading off against travel time through 4D trajectory optimization with different constraints is rarely reported. In particular, how the fuel-saving potentials evolve with the congestion uncertainties has not been revealed, such that the emission reduction targets of air traffic management planning lack solid support. For this reason, based on the existing research results, taking Shanghai Hongqiao Airport (ZSSS)–Beijing Capital International Airport (ZBAA) as an example, and considering real meteorology data, aircraft dynamics, available route limitations, sector capacity constraints, and air traffic control restrictions on aircraft altitude and speed, a “runway-to-runway” multi-objective planning model under loose-to-tight constraints was developed in this study. The goal is to investigate potential fuel consumption and flight time reductions under different levels of operation restrictions, such as free-flow and capacity-constrained airspace sectors, as well as fixed and optional routes. The model enables the formulation of green aviation development goals.
The main work of this study includes:
  • A runway-to-runway 4D trajectory model and fuel consumption model were established, and a fixed-path multi-objective trajectory optimization model based on trajectory discretization was proposed. The NSGA-II algorithm was used to search the optimal speed-altitude profile between city pairs. The upper bound of fuel efficiency was investigated by examining the trade-offs between fuel consumption and flight time.
  • In order to cope with uncertainties in sector-level demand and capacity balancing that often appear in real-world operation, two 4D multi-objective optimization models based on fixed and optional routes in capacity-constrained scenarios were established, respectively, by taking into account the variation of available sector entry slots changed after takeoff. The impact of airspace congestion on fuel-saving was modeled and measured.
  • Further, a sensitivity analysis underpinned by a metric for evaluating the effect of multi-objective optimization was supplemented to give insight on how the fuel-saving potentials, as well as Pareto optimal front evolve with the congestion location (e.g., distance to the departure airport) and severity (e.g., level of delay).
The rest of this paper is organized as follows. The problem description is presented in Section 2. The 4D trajectory model and fuel consumption estimation model are presented in Section 3. An ideal trajectory optimization model for fixed-path scenario and two models that take into consideration capacity constraints for fixed and optional paths are presented in Section 4. The Non-dominated Sorting Genetic Algorithm with Elitist Strategy (NSGA-II) is adaptively improved for determining a multi-objective solution of fuel consumption and flight time in Section 5. The flight between ZSSS and ZBAA is taken as an example in Section 6 to verify the accuracy of the fuel consumption model and explore the effect of trajectory optimization on fuel consumption improvement under different strictness constraints. Conclusions and future research directions are indicated in Section 7.

2. Problem Description

In addition to being affected by its own aerodynamics and meteorological conditions, aircraft fuel consumption has significant sensitivity to flight trajectory, such as altitude, speed, and flight distance. In the TBO concept, although Shared Business Trajectory (SBT) would be coordinatively planned before takeoff, based on information such as weather conditions, scheduled flight time, scheduled route, and airspace capacity, during flight, the SBT is often difficult to implement due to disturbances of external dynamic factors such as airspace availability changes and air traffic controller intervention. The main problem to be solved in this paper is that of predicting the possible upper bound of fuel consumption reduction for a given city pair using trajectory optimization with various constraints without changing the airspace structure.
To address this problem, three multi-objective mixed-integer program models were formulated in this study while considering fuel consumption and flight time for a city pair: an ideal 4D trajectory optimization model and trajectory optimization models that considered the constraint of a sector’s controlled time of arrival (CTA) for fixed and optional paths, respectively. These models were used to determine potential fuel consumption reductions in different scenarios. To simplify the problem, the vertical profile was divided into three stages: climb, cruise, and descent. The horizontal trajectory of the aircraft was discretized in 1 km increments. The time-continuous trajectory optimization problem was transformed into a Mixed-Integer Nonlinear Program (MINLP) problem, resulting in a limited set of decision variables.
For fixed-path scenarios, under various operational constraints such as aircraft properties, control rules, and flight comfort, the relationship between flight speed and altitude was optimized collaboratively to generate a speed and vertical profile that weighs the dual goals of fuel consumption and flight time. When optional routes are considered, the route network was abstracted as a network G = (V, E), where V = j 1 , j 2 , , j n is the set of nodes, j n is the starting point for each flight segment, E = k 1 , k 2 , , k m is the set of flight segments, and the length of each flight segment is set to 1 km. Let two sequential nodes be j n and j n + 1 that are members of an adjacent matrix Θ = e j n , j n + 1 . If j n j n + 1 is connected, then e j n , j n + 1 = 1. Otherwise, e j n , j n + 1 = + . At this time, the path of aircraft α can be expressed as the set of nodes connected in series. This problem can be expressed as: under the constraints of connectivity in the network G, various operational constraints are integrated to plan the aircraft’s flight altitude and speed profile simultaneously. By establishing a Pareto frontier for fuel consumption and flight time in various scenarios, the potential fuel consumption reduction can be identified.

3. 4D Trajectory Model of Aircraft

3.1. Meteorology Model

For aircraft trajectory optimization research, the main atmospheric properties are temperature, pressure, and the density of the air. In Base of Aircraft Data (BADA) 3.11 published by EUROCONTROL [40], the relations among the atmospheric temperature, air density, and pressure are modeled as Formula (1):
T e m = T 0 + β · h , h h t r o p T t r o p , h > h t r o p
p = P 0 T e m T 0 g β · R , h h t r o p P 0 T t r o p T 0 g β · R · exp g R T t r o p h h t r o p , h h t r o p
ρ = P / R T e m
where T e m is the atmospheric temperature at the corresponding altitude; T 0 = 288.15 (K) is the mean sea level standard atmospheric temperature; h is altitude (m); the altitude of the tropopause is h t r o p = 11,000 (m) in the ISA model and the temperature is considered constant above the tropopause; T t r o p is the temperature of the tropopause (K); β = 0.0065 (K/m) is the ISA temperature gradient below the tropopause; P is the atmospheric pressure; P 0 = 101,325 (Pa) is the mean sea level standard pressure; g is the local gravity acceleration; R = 287.05287 ( m 2 / K · s 2 ) is the gas constant; and ρ is the atmospheric density.
The data of weather in this article are mainly derived from the GRIB2 files published by Global Forecast System (GFS) of the National Oceanic and Atmospheric Administration (NOAA), and the GFS data are further divided into GFS Analysis data and GFS Forecasts data. In this article, the weather data of the 0.5 * 0.5 latitude and longitude grid are selected in the GFS Analysis data.

3.2. Aircraft Dynamic Model

To accurately assess fuel consumption and flight time, in this paper, based on the Point Mass Model (PMM) [41] and the Total-Energy Model (TEM) [40], as well as adaptive improvement based on the problem, the aircraft dynamic model is established to simulate aircraft flight.
According to PMM, assuming that all forces act on the center of gravity of an aircraft, the motion of the aircraft is reduced to three degrees of freedom (three translations), and the equations of motion in three dimensions can be integrated directly. The forces acting on the aircraft are shown in Figure 1.
In Figure 1, γ is the flight path angle; α is the flight angle of attack; φ T is the engine installation angle (usually very small and approximately φ T = 0 ); v is the true airspeed (TAS); G is the force of gravity; and L and D are the lift and drag on the aircraft, respectively, expressed as:
L = S 2 C L ρ v 2
D = S 2 C D ρ v 2
where S is the reference wing area; C L and C D are the lift and drag coefficients, respectively, expressed as:
C L = 2 m g ρ v 2 S cos ϕ
C D = C D 0 + C D 2 C L 2 ;
ϕ is the slope of the aircraft; C D 0 is the parasitic drag coefficient; and C D 2 is the induced drag coefficient.
In an air reference system with wind component, the aircraft dynamics model is described as follows:
d s d t = v 1000 cos γ + v w i n d d h d t = v sin γ d v d t = 1 m T D m g sin γ d m d t = F F
where the state vector u = [s, h, v, m] is formed, respectively, by the position s along path distance (km), altitude h (m), true airspeed v (m/s), and mass m of the aircraft (kg). The control vector u = [T, γ ] is composed of the thrust T on the aircraft and the flight path angle γ ; v w i n d represents wind speed (m/s); and FF is the fuel flow of the aircraft (kg/s). In this article, after discretizing the trajectory according to the voyage, in order to facilitate calculation, we assume that, on flight segment i n i n + 1 , the T, γ , and the rate of climb/descent (Rate of Climb or Decent (ROCD)) remain unchanged.
The TEM equates the rate of work done by forces acting on the aircraft to the rate of increase in potential and kinetic energy, namely:
m g d h d t + m v d v d t = ( T D ) v

3.3. Aircraft Performance Model

Aircraft performance is the parameters that describe the motion law for the aircraft’s center of mass, including the speed, altitude, thrust, and so on [42]. The models and parameters of aircraft performance used in this paper are from BADA 3.11.
In the process of simulating aircraft movement, the acquisition of thrust is very important. This paper transforms the calculation of thrust into the solution of acceleration. That is, when R O C D i n , i n + 1 and v i are determined, the acceleration of the aircraft a i n , i n + 1 on the flight segment i n i n + 1 can be estimated according to Formula (8), and the thrust of the aircraft can be calculated in combination with Formula (7).
γ i n , i n + 1 = arcsin R O C D i n , i n + 1 v i n + v w i n d t i n , i n + 1 = d tan γ i n , i n + 1 R O C D i n , i n + 1 a i n , i n + 1 = 2 d v i n + v w i n d t i n , i n + 1 t i n , i n + 1 2
where d is the distance of the flight segment i n i n + 1 ; t i n , i n + 1 is the flight time of the flight segment i n i n + 1 ; and the corresponding R O C D i n , i n + 1 feasibility of different flight altitudes are determined according to the speed–altitude profile recommended by PTF files of BADA 3.11.
The speed of the aircraft is an important parameter for aircraft performance as well. According to the BADA 3.11 OPF file, the calibrated air speed (CAS) is often used to determine whether the aircraft speed exceeds the operational threshold. The CAS is calculated with Formula (9):
v C A S = 2 μ p 0 ρ 0 1 + p p 0 1 + μ 2 ρ p v 2 1 μ 1 μ 1 1 2
μ = κ 1 κ
where ρ 0 = 1.225 ( kg / m 3 ) is the density values at sea level; p is the atmospheric pressure; and κ = 1.4 is the specific heat ratio of the air.
According to Formula (8), the ground speed (GS) v G can be used to calculate the γ i n , i n + 1 and a i n , i n + 1 . The GS is obtained after the correction of the v w i n d for TAS:
v G = v + v w i n d

3.4. Fuel Consumption Model of Aircraft

When calculating fuel consumption, this article adopts the fuel flow rate model of BADA 3.11 and makes adaptive improvements to calculate the fuel consumption of aircraft from takeoff to landing. According to the BADA 3.11, a jet aircraft fuel consumption can be calculated with the following equations:
η = C f 1 ( 1 + v C f 2 ) F F = η · T F = 0 t F F d t
where η is the thrust specific fuel flow; C f 1 and C f 2 are, respectively, the first and second thrust-specific fuel consumption coefficients; and FF is the instantaneous fuel flow, and the total fuel consumed from 0 to t is F. Formula (11) is applicable at all flight stages except during the cruise phase and idle thrust. Idle thrust is not considered in this paper, while FF in the cruise phase is defined in Formula (12):
F F c r = η · T · C f c r
where C f c r is the fuel flow correction coefficient in cruise phase.
After discretization, the total fuel consumption can be approximated as a sum of discrete values of fuel consumption in each segment throughout the flight as following:
i F i n , i n + 1 = . i F F ¯ i n , i n + 1 · t i n , i n + 1
An estimation is done for the value of the aircraft initial state, based on historical data. After the ROCD of each segment is determined, using Formulas (1)–(10), the state vector, control vector in any segment, and arrival time at each node during the flight can be estimated, thus the average fuel flow rate F F ¯ i n , i n + 1 α can be calculated using Formulas (11) and (12).

4. Multi-Objective Optimization Modeling of “Runway-To-Runway” Flight Trajectory

4.1. Basic Assumptions

To simplify the problem, the following basic assumptions were made:
  • The clean configuration of the aircraft is adopted for optimization.
  • Human interventions are not included in the flight trajectories.

4.2. A 4D Trajectory Optimization Model for the Fixed Path Scenario (Model I)

4.2.1. Decision Variables

In this paper, the horizontal trajectory is discretized, and the continuous 4D trajectory optimization is transformed into a problem involving determining the flight speed and altitude at the nodes in each flight segment. Therefore, the trajectory optimization decision variables under a fixed path are the speed v i α and altitude h i α of the aircraft at node i.

4.2.2. Objective Function

Model I is intended to generate an ideal economic flight trajectory for the aircraft based on the aircraft performance model proposed in Section 3 and a pre-set horizontal path, while meeting the basic air traffic operation restrictions. The total fuel consumed by the aircraft in the air is the main optimization objective of Model I. In addition, the flight time between city pairs is also an important factor that airlines must consider when making flight plans and crew scheduling. Therefore, this paper establishes the dual objectives of fuel consumption and flight time to examine the trade-off relationship between the two, as well as to analyze the influence of flight time adjustments on the potential of fuel consumption improvement. The objective function is defined in Formula (14):
min i F i n , i n + 1 α , i t i n , i n + 1 α , α A , i I
where α is the aircraft; A is the set of aircrafts; i is a node; I is the set of nodes; and F i n , i n + 1 α and t i n , i n + 1 α , respectively, represent the fuel consumption and flight time of aircraft α on the flight segment.

4.2.3. Constraints

  • Altitude constraint
    The aircraft needs to maintain a specific altitude during flight. This limitation is determined by the aircraft’s own properties and airspace limitation, as defined in Formula (15).
    h i , c o n t r o l min α h i α min h i , c o n t r o l max α , h max α , α A , i I
    where h max α is the maximum altitude of the aircraft under the constraint of its own properties and h i , c o n t r o l min α and h i , c o n t r o l max α are the altitude limits in the controlled sector, i.e., the minimum and maximum altitude thresholds of aircraft α at node i.
    In particular, if the flight is a two-way route, the aircraft should comply with the “odd for eastbound and even for westbound” regulations in addition to meeting the above constraints, i.e., an aircraft flying eastward adopts odd-numbered altitude levels and an aircraft flying westward adopts even-numbered altitude levels.
    h α / 100 = 2 N , w e s t 2 N + 1 , e a s t , α A , N { 0 , 1 , 2 , }
  • Speed constraint
    Similarly, the speed of aircraft α at node i must meet the limitations of its own properties and control rules of the sector.
    max v i , c o n t r o l min α , v i , m i n α v i α min v i , c o n t r o l max , α v i , max α , α A , i I
    where v i , min α and v i , max α are the minimum and maximum speed of aircraft α at node i under the constraint of its own properties and v i , c o n t r o l min α and v i , c o n t r o l max α are the minimum and maximum speed of aircraft α at node i under the air traffic control constraint in a specific sector.
    The thrust required to operate the aircraft is also taken as a constraint to ensure passengers’ comfort:
    v i n + 1 2 v i n 2 2 · d a i n , i n + 1
    where a = 0.6096 m/s2 is the maximum longitudinal acceleration recommended in the BADA 3.11 GPF file.
  • Climb and descent performance constraints
    The rates of climb and descent of the aircraft cannot exceed the maximum rate of climb or the maximum rate of descent. In this article, the rate of climb and the rate of descent introduced from BADA 3.11 PTF file are used as the thresholds for the climb and descent operations.
    h i n + 1 α h i n α t i n , i n + 1 α x i n , i n + 1 α C L max α + y i n , i n + 1 α D E max α , α A , i I
    where C L max α and D E max α are the aircraft’s maximum rate of climb and maximum rate of descent, respectively. State variables x i n , i n + 1 α and y i n , i n + 1 α are introduced to denote the flight state, as defined in Formula (20).
    x i n , i n + 1 α = 1 , h i n + 1 α h i n α > 0 0 , o t h e r w i s e
    y i n , i n + 1 α = 1 , h i n + 1 α h i n α < 0 0 , o t h e r w i s e
  • Timeliness constraint
    Time efficiency is another important dimension from airline’s perspective. Therefore, when planning a trajectory, the city-pair flight time should be kept within an acceptable range, as shown in Formula (21).
    M A T A i t i n , i n + 1 α S A T α M A T D , α A , i I
    where SAT α is the standard airborne time (SAT) of aircraft α , which is obtained according to flight schedule and the Collaborative Decision Making (CDM) system in China; MATD is a positive number, which is the maximum acceptable time delay (MATD) of landing; and MATA is a negative number, which is the maximum acceptable time advance (MATA) of landing.

4.3. Aircraft Flight Trajectory Optimization Model for the Fixed Path Scenario under Capacity Limitation (Model II)

The CDM system is a regional air traffic flow management system that allocates flight departure slots by integrating various air and ground restrictions. However, due to the takeoff time slot freeze (generally 30 min in advance), changes in the sector capacity–flow balance may occur due to uncertainty, resulting in unavailability of an entry time slot in the original schedule. In the TBO context, the aircraft would be capable of re-planning flight trajectories based on air–ground negotiation to generate an updated available entry time slot in the restricted sector. Therefore, based on the ideal horizontal path in Model I, a 4D trajectory multi-objective optimization model for a fixed path with capacity constraints was developed to analyze the impact of airspace congestion on potential reductions in fuel efficiency for a rigid air route structure.

4.3.1. Decision Variables

v i α and h i α have the same meaning as in Model I.

4.3.2. Objective Function

Model II is constructed based on Model I, and the meaning and expression of the objective function are the same as that in Formula (14).

4.3.3. Constraints

The meanings and expressions of altitude constraints, speed constraints, climb and descent constraints, and time constraints in Model II are the same as those in Model I, as shown in Formulas (15)–(21). Due to capacity limitation, this model shall guarantee that all the aircraft enter the sectors within available time slots, as shown in Formula (22).
τ i α T w , α A , i I , w W
where i is a node that enters sector w; τ i α is the time aircraft α passes node i; T w is the set of available time slots of sector w; and W is the set of sectors.

4.4. Multi-Path-Based Aircraft Flight Trajectory Optimization Model under Capacity Constraints Scenario (Model III)

Compared with Model II, Model III relaxes the rigid route structure restrictions, allowing the aircraft to independently select flight paths based on an updated sector capacity–flow relationship after takeoff. This allows the effect of airspace flexibility on aircraft fuel efficiency to be to explored.

4.4.1. Decision Variables

v j α and h j α have the same meaning as in Model I. To identify whether aircraft α passes through node j, the variable z j α is introduced, as shown in Formula (23).
z j α = 1 , a i r c r a f t α p a s s e s n o d e j 0 , o t h e r w i s e
Furthermore, to identify the connectivity between nodes that the aircraft passes, the variable γ j n , j n + 1 α is introduced to indicate whether the aircraft chooses to fly through the edge formed by connected nodes. For any two nodes j n and j n + 1 , there is:
γ j n , j n + 1 α = 1 , a i r c r a f t α p a s s e s n o d e j n j n + 1 s e g m e n t 0 , o t h e r w i s e , w h e r e e j n , j n + 1 = 1

4.4.2. Objective Function

Model III allows the aircraft to flexibly select the flight path according to sector congestion information after takeoff. This provides integrated planning of the aircraft’s horizontal trajectory, vertical profile, and flight speed, which are used to minimize flight time and fuel consumption, as shown in Formula (25).
min j F j , C j α γ j , C j α , j t j , C j α γ j , C j α
where C j is the node connected with node j.

4.4.3. Constraints

The Model III constraint condition changes and expands the Model II constraint based on network connectivity. For α A , j V , w W , the constraint conditions are shown in Formula (26).
e j , C j = 1
j V γ j , C j α = 1 , j j | z j α = 1
max v j , c o n t r o l min α , v j , min α z j α v j α min v j , c o n t r o l max , α v j , max α
h j , c o n t r o l min α z j α h j α min h j , c o n t r o l max α , h max α
γ j , C j α t j , C j α x j , C j α C L max α + y j , C j α D E max α γ j , C j α h C j α h j n α
M A T A j γ j , C j α t j , C j α S A T α M A T D
z j α τ j α T w
Formula (26a) is the connectivity constraint, i.e., adjacent nodes in the path selected by the aircraft must be connected in the network. Formula (26b) is a unique constraint, i.e., after the aircraft passes through any node there is one and only one next node. Formulas (26c)–(26g) are the speed, altitude, climb and descent performance, timeliness, and sector available time slot constraints, respectively, which are the same as those defined in Model I.

5. Solution Algorithm

The complexity of the aircraft trajectory optimization problem increases geometrically as the number of decision variables increases. It is difficult to obtain and verify the solution in polynomial time. As an NP-hard problem, the solutions are independent, therefore a metaheuristic algorithm is used to find the solution [43]. A genetic algorithm is a random search algorithm that mimics natural selection, heredity, and mutation. It provides a general framework for solving complex optimization problems, and it has been successfully used in many disciplines. Research results show that the Non-Dominated Sorting Genetic Algorithm (NSGA-II) using the elite retention strategy can efficiently seek a set of different solutions and converge to the real Pareto optimal solution set. Recently, a comprehensive comparison was made to justify the overall advantages of NSGA-II in solving trajectory optimization problems in terms of solution quality and convergence speed [27,44,45]. Therefore, the NSGA-II algorithm was chosen to solve the optimization problem outlined herein, and a flowchart for this algorithm is shown in Figure 2.
To solve the problem, the NSGA-II algorithm was modified as follows:
  • Encoding
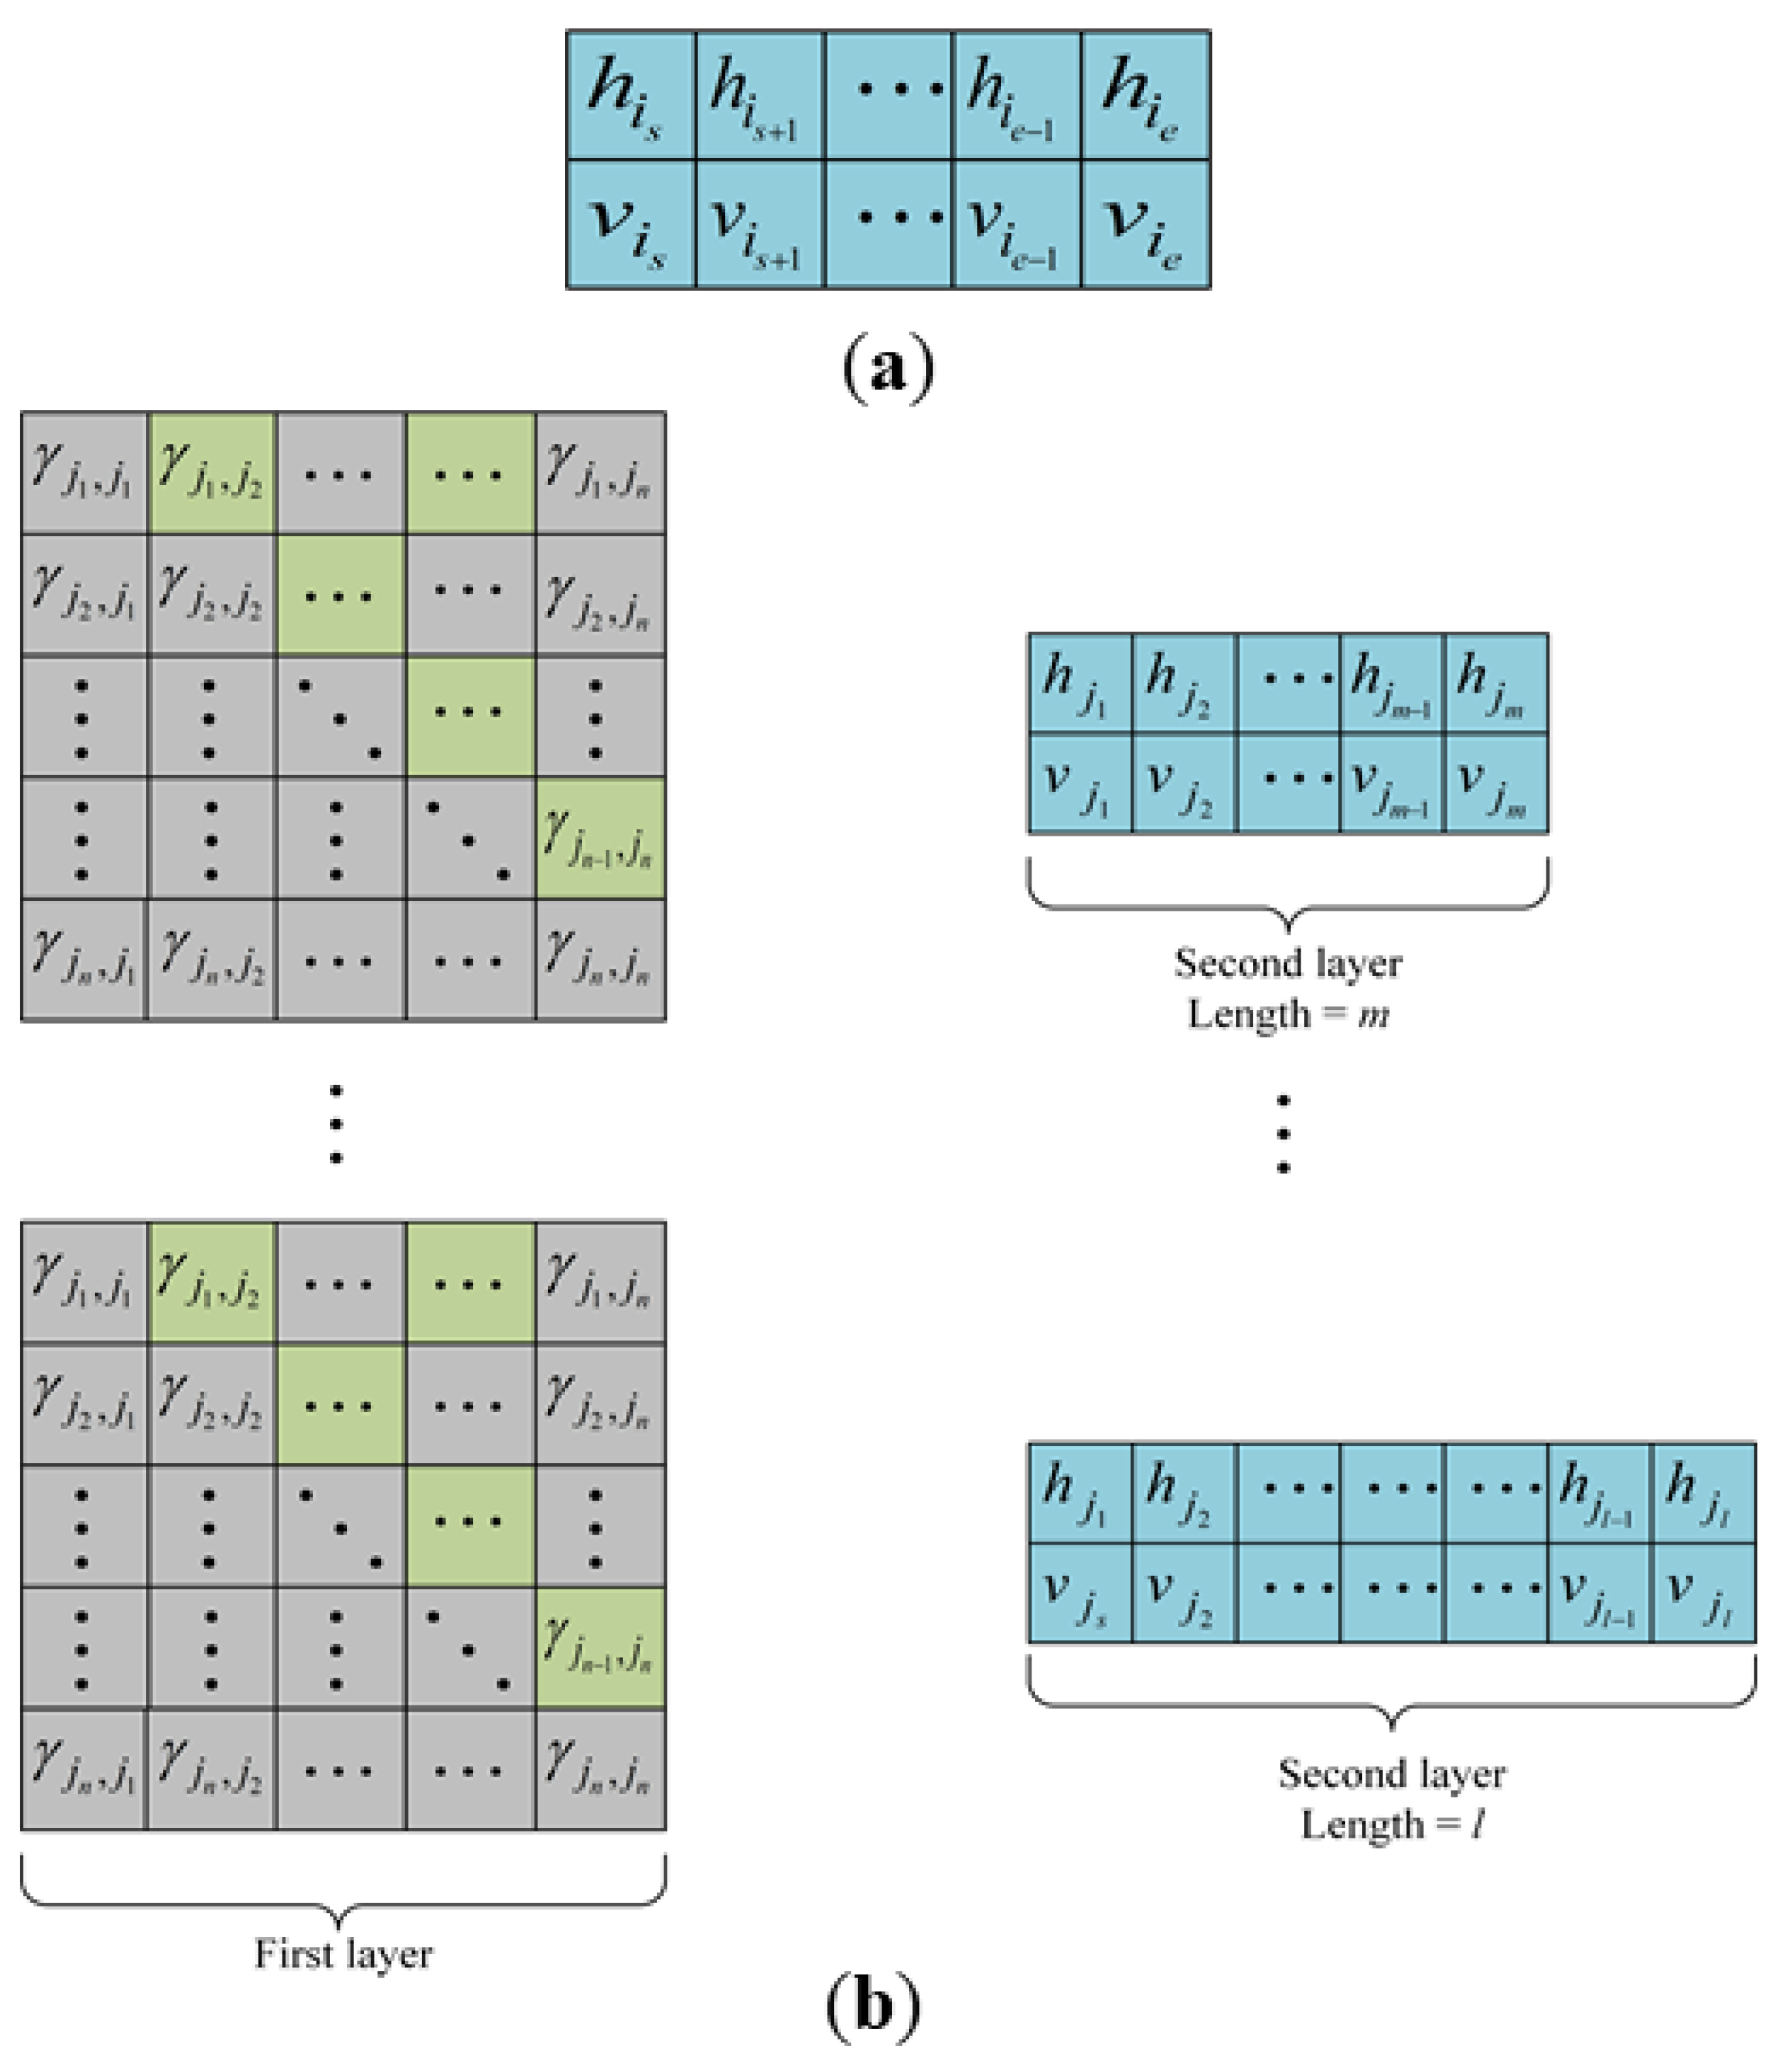
    The chromosome encoding pattern is shown in Figure 3. For the fixed path scenario, the altitude and speed of each node from initial node i s to termination node i e are defined as positive integer, as shown in Figure 3a. For the multi-path scenario, to improve the computational efficiency, a hierarchical and variable-length chromosome was designed. The first layer is encoded as a 0–1 matrix presenting the route choice based on the variable γ j n , j n + 1 defined in Section 4.3. The green gene represents the connectivity between node j n and j n + 1 according to the adjacent matrix Θ = e j n , j n + 1 defined in Section 2. Otherwise, the links are not connected and the genes are encoded as 0, which do not change during subsequent genetic manipulation. The second layer of the chromosome is as the same as the fixed path scenario, as shown in Figure 3b. Note that the length of the second layer is determined by the route coded in the first layer.
  • Initial population
    The initial population, as the iterative starting point of the heuristic algorithm, is an important factor affecting population evolution and efficiency of the algorithm. When optimizing a single path, historical trajectory data were used to form the initial population to obtain the Pareto frontier solution. When optimizing multiple paths, the Pareto frontier solutions for a single path were randomly selected and combined into multiple path optimization individuals, forming the initial population. One should note that, in actual operation, the altitude and speed of an aircraft, being significantly sensitive to factors such as maneuvering actions, changes in aerodynamic configuration, and meteorological conditions, are very prone to fluctuations. Therefore, to determine the optimal altitude-velocity profile under ideal conditions, the altitude and velocity data in the historical trajectory data were smoothed [46].
  • Genetic manipulation
    The tournament algorithm and elite retention strategy were used to select individuals from the parent population, and the elite individuals were selected for crossover and mutation to obtain the offspring population.
    • Crossover method
      For fixed path scenario, the one-point crossover was performed in units of decision variables (altitude and speed) corresponding to an aircraft, i.e., a random crossover point is selected and the first part from each parent is copied to the corresponding child, and the second parts are copied crosswise.
      For the multi-path scenario, two crossover methods with the same probability were adopted. Case 1 is the crossover of paths that lead to the crossover of altitude and speed simultaneously. For Case 2, the chromosomes with the same path are selected for crossover of the second layer, which is the same as the crossover operator in fixed-path scenario. It should be noted that, in structural airspace, there are often a limited number of bifurcation nodes in the route network. Therefore, for Case 1, in order to improve the efficiency of path search, the selection of crossover nodes is not completely random, but randomly selected from the bifurcation nodes in the route network.
    • Mutation method
      In this paper, the aircraft altitude and speed profiles are optimized by mutation independently to generate more solutions along the Pareto-optimal front. Once the mutation node i m is selected, the altitude and speed are mutated with with equal probability:
      When the aircraft is climbing or descending, according to altitude and speed of the predecessor node and successor node of mutation node, based on Formulas (15)–(20), the ranges of altitude h i m min α , h i m max α and v i m min α , v i m max α at the mutation node were determined. The altitude and speed at i m were replaced by h i m α and v i m α , respectively, as shown in Formula (27).
      h i m α N h i m min α , h i m max α
      v i m α N v i m min α , v i m max α
      When the aircraft is cruising, altitude and speed were independently disturbed using the disturbance values r h and r v with equal probability, respectively, as shown in Formula (28). The mutation method of the fixed and optional path scenarios is the same.
      h i m α = h i m α ± r h
      v i m α = v i m α ± r v
      One should note that, because the predecessor node has a greater impact on the successor node, after crossover and mutation, offspring chromosomes’ feasibility must be verified. The three gene positions before, in the middle of, and after crossover and mutation are used to determine whether a chromosome meets the constraint conditions. If it does, the offspring chromosome is obtained; otherwise, correction is made using the correction operator.
  • Correction operator
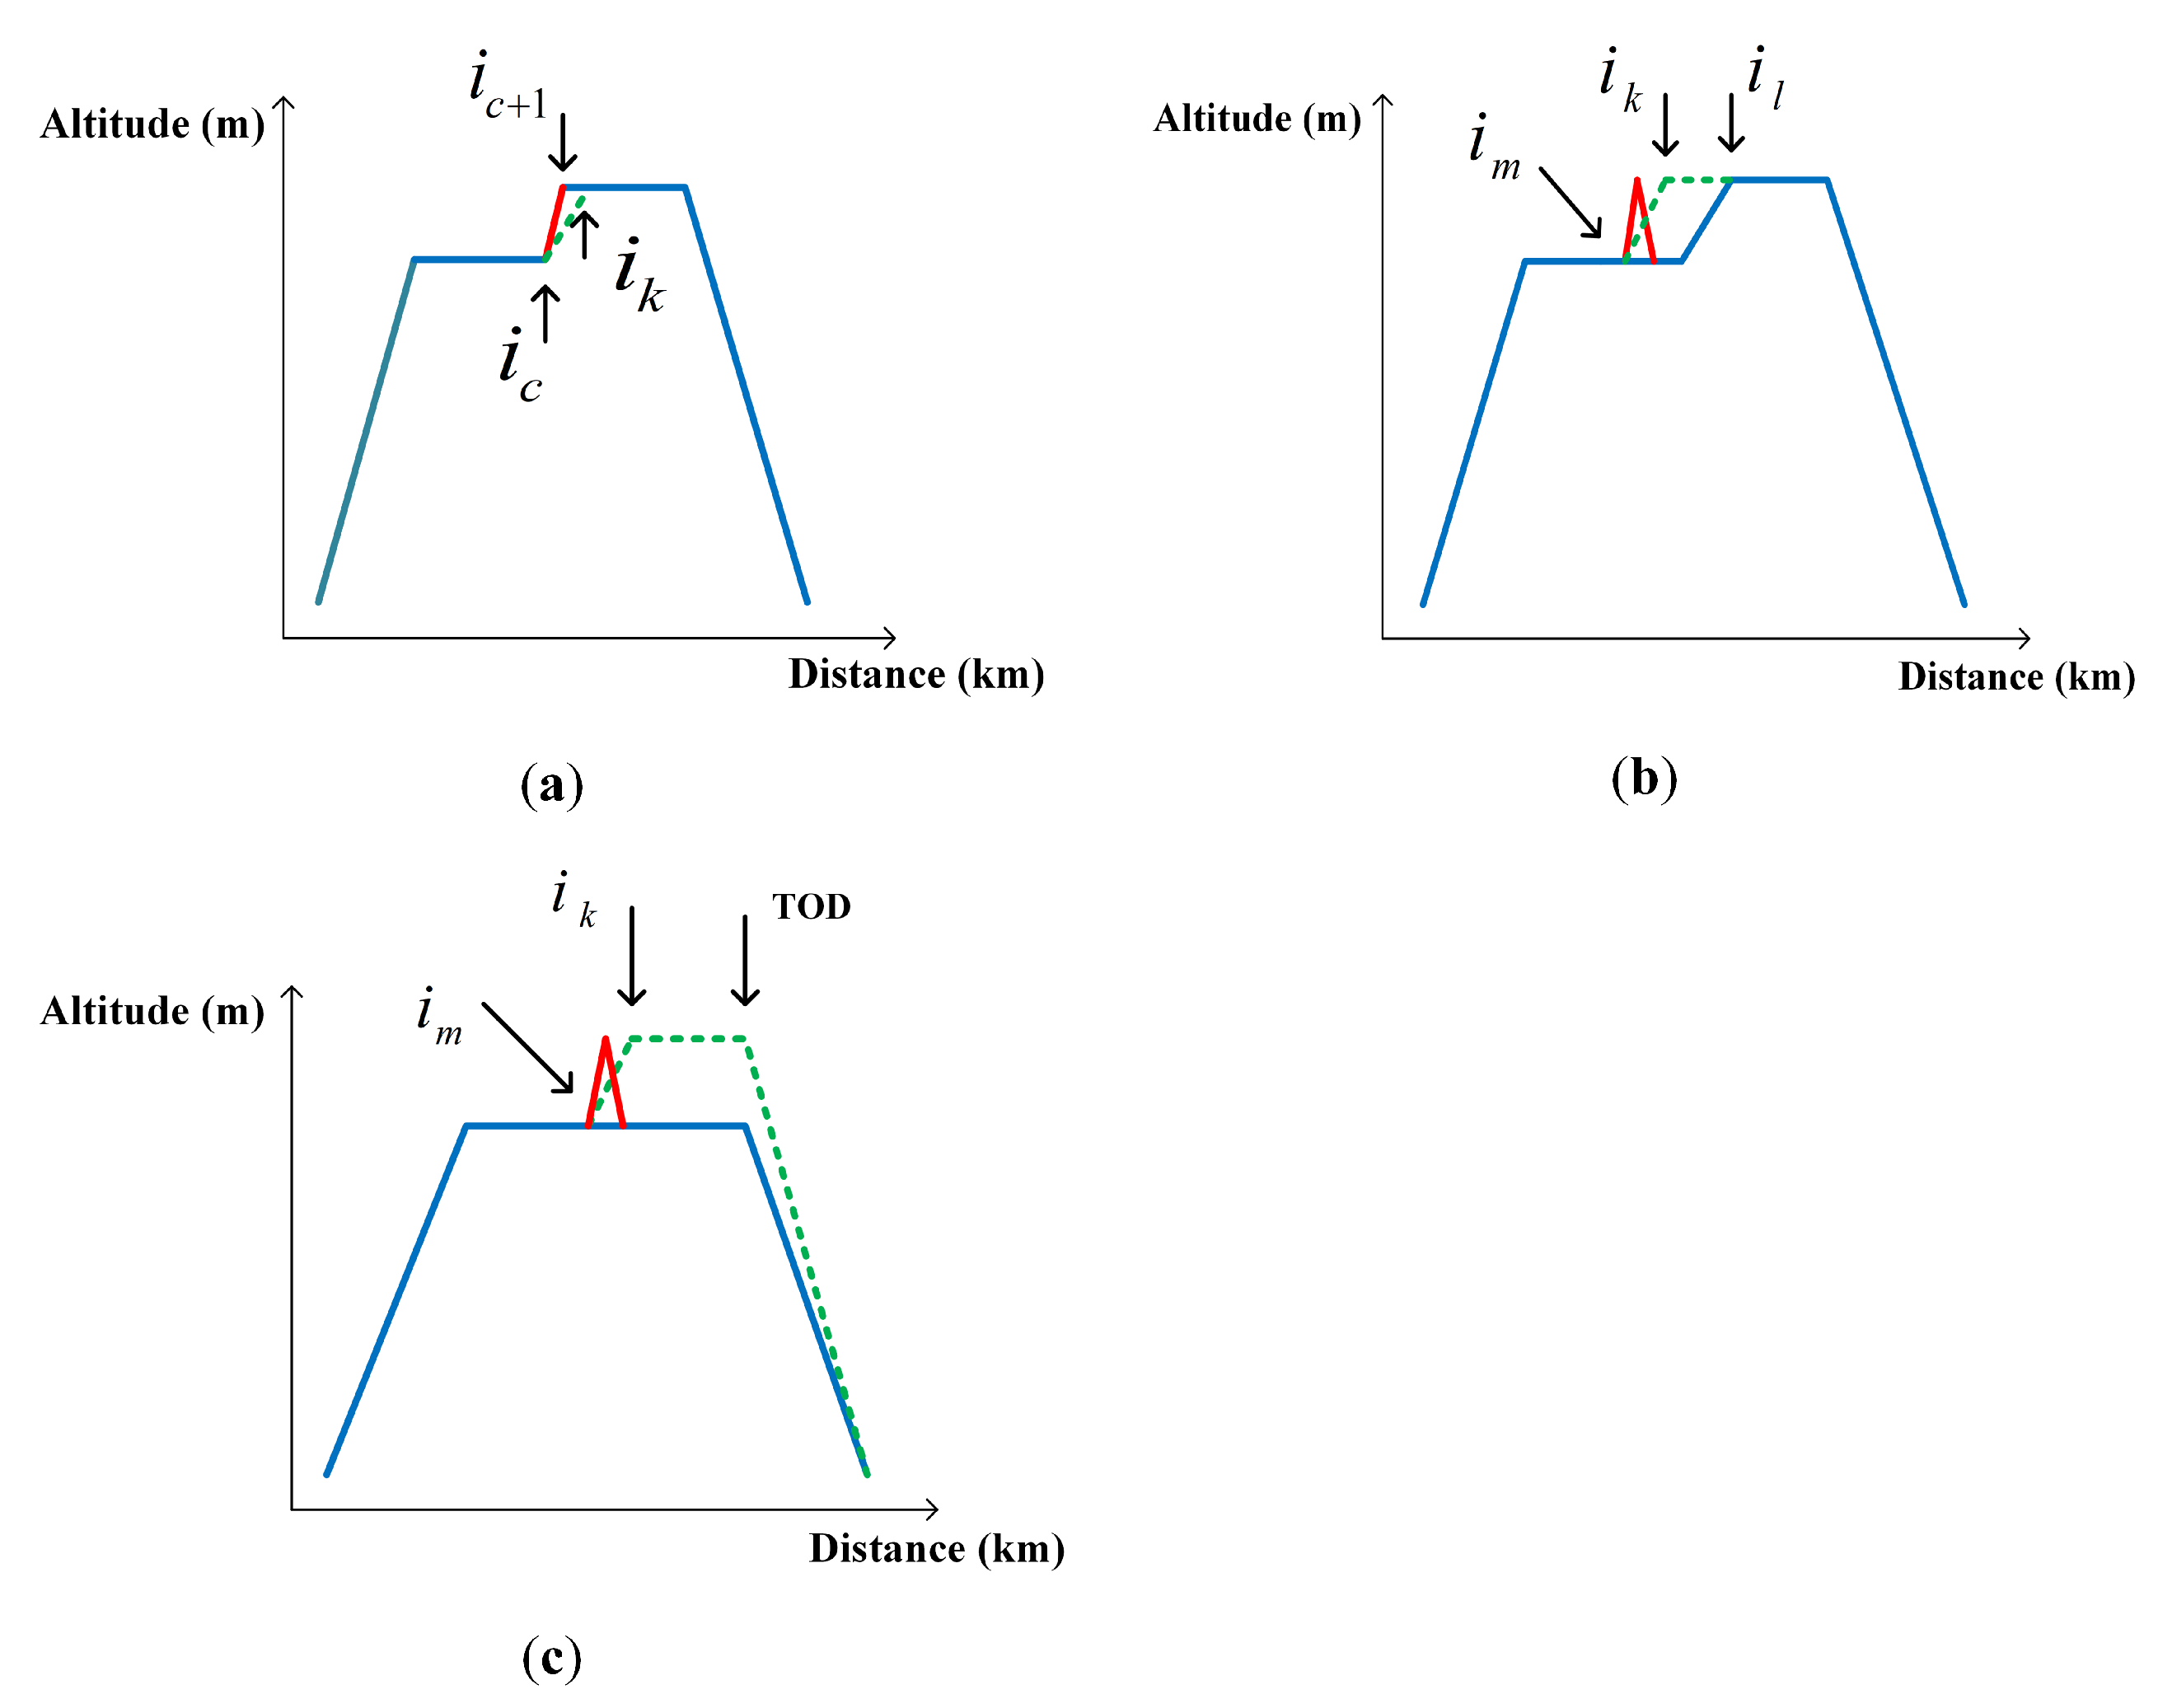
    The altitude profile is taken as an example to demonstrate the correction operator, as shown in Figure 4. The crossover node is i c , the mutation node is i m , the blue solid line is the original trajectory, and the red solid line is the trajectory of the aircraft after crossover or mutation. Obviously, dramatic changes in altitude between adjacent nodes is not possible. The following three scenarios illustrate the correction operator. Case 1 is the crossover correction operator, while Case 2 and Case 3 are the mutation correction operators.
    • Case 1
      For the crossover operation, as shown in Figure 4a, the speed relationship between node i c and node i k should be determined firstly. On the segment i c i k , v i c < v i k , v i c = v i k , and v i c > v i k means the aircraft conducted accelerated climb, climb at a constant speed and decelerated climb, respectively, until reached the same altitude as the node i k . The altitude and speed of any node from i c to i k is corrected by using Formulas (1)–(10) and the rate of climb recommended by the BADA 3.11 manual. The situation of the descent is similar, so it is not repeated here.
    • Case 2
      After i m , if there exists h i l > h i m , the correction method is illustrated in Figure 4b. During the segment i m i k , the altitude and speed correction method is the same as the crossover correction method (see i c i k in Figure 4a), and is not repeated. On segment i k i l , the trajectory is further corrected by a cruise segment at constant altitude and speed. Thus far, the correction from i m to i l is completed. In a similar way, the correction works if there exists h i l < h i m after i m .
    • Case 3
      If the aircraft cruises at a constant altitude after i m , the correction method is as shown in Figure 4c. The altitude and speed of each subsequent node after i m are calculated and corrected using Formulas (1)–(10) and the rate of climb recommended by the BADA 3.11 manual. When h i k = h i m , the climb ends, and the aircraft cruises at constant altitude and speed from i k to the top of decent (TOD). The altitude and speed of each node during the descent can be estimated using Formulas (1)–(10) and the rate of descent recommended by the BADA 3.11 manual. Thus far, the correction is completed. In a similar way, the correction works for modification of a sharp descent due to mutation.
  • Non-dominant sorting and crowding distance sorting
    The non-dominated sorting method is used to quickly stratify all individuals in the population, forming multiple Pareto frontiers with different levels. Crowding degree is used to measure the distance from one solution to two adjacent solutions on the frontier of the same non-dominated solution.
  • Termination condition
    The algorithm is terminated by setting the maximum number of iterations and testing the convergence results in each generation of the population. When the number of Pareto optimal frontier solutions in the population exceeds 80% of the population size, the algorithm is automatically terminated.

6. Case Analysis

6.1. Basic Parameters

6.1.1. Route Structure and Operation Restrictions

In this study, one of China’s busiest routes, ZSSS–ZBAA, was selected for optimization. Its flight routes and the sectors passed by flights are shown in Figure 5. Among them, waypoint data primarily include the longitude and latitude of the waypoint and the connection between waypoints, forming a basic network structure. The runway-to-runway 4D trajectory optimization has received focus without considering details of the aircraft’s airport surface operation, so departure from and arrival at airports are each regarded as one network node. To study fuel consumption under temporary changes in the capacity–flow relationship, the concept of a “hotspot” was introduced to characterize the busy area when the capacity and flow lose balance during a certain period [47]. By analyzing the historical air traffic data, Sector 5 and Sector 6 are identified as “hotspots”. City-pair flight data and operating restrictions are shown in Table A1 and Table A2.

6.1.2. Typical Aircraft Types and Performance Parameters

In 2019, the Airbus A333 was the most frequently used aircraft on the ZSSS–ZBAA city pair (accounting for 37% of total flights). Therefore, Airbus A333 was used as an example aircraft, and its basic performance parameters are shown in Table 1.

6.1.3. Optimization Parameters

The optimization algorithm was written in Python 3.6.3. The parameters in the NSGA-II algorithm were set as follows: the population size was set to 1000, the maximum number of iterations was set to 100, the mutation probability was set to 0.1, the crossover probability was set to 0.95, r h = 600 m, and r v = 1 m/s. The relevant parameters of an Airbus A333 are shown in Table 1. The SAT for ZSSS–ZBAA is 105 min, where the maximum allowable advance and delay are 5 and 10 min, respectively.
The flight level is one of the important factors that affect aircraft fuel efficiency. Generally, air density is lower at higher altitude, so the aircraft receives less drag and is more fuel-efficient. In actual flight, the choice of altitude must consider the restrictions of waypoints and ATC preferences during flight. The height profile of an Airbus A333 on a typical day during a week is shown in Figure 6. Clearly, before reaching TOD, the aircraft descends to a relatively low altitude and maintains a level flight for a certain distance. The cruising altitude level of an Airbus A333 for the week and level-flight altitude level before TOD are shown in Table 2. Flights that cruised at 10,400 m and higher accounted for 80.9%. Considering that the ultimate objective of optimization is to increase the aircraft’s fuel efficiency, the initial cruising level was set to 10,400 m and above. At the flight level before TOD, 98.3% of aircraft used 8400 and 9200 m, which were selected as the initial flight altitudes before TOD.

6.2. Verification of Fuel Consumption Model

First, to verify the accuracy of the fuel calculation model, QAR data were used to estimate fuel consumption. QAR data of A333 from ZSSS to ZBAA with mass of 172,365 kg were chosen, as shown in Table A3. According to the aircraft’s speed, altitude, and ROCD from takeoff to landing, the fuel consumption model established in this paper is used to estimate fuel flow, and the estimated fuel flow is compared with the actual fuel flow, as shown in Figure 7. The fuel consumption change pattern calculated with the BADA model is basically the same as the trend of the recorded QAR data, and the value is similar. In general, the Mean Relative Error (MRE) from the BADA method is 12.3%, and the R 2 is 91.2%. The fuel flow prediction accuracy during climb and level-flight phases is relatively satisfactory with the average relative errors 9.6% and 7.1%, respectively. The overall estimation accuracy is within the acceptable range [48]. Therefore, the accuracy of the BADA fuel consumption model used in this study meets the requirements for trajectory optimization.

6.3. Optimization Result Analysis

6.3.1. Scenario 1: Ideal Trajectory Optimization Analysis for the Fixed Path

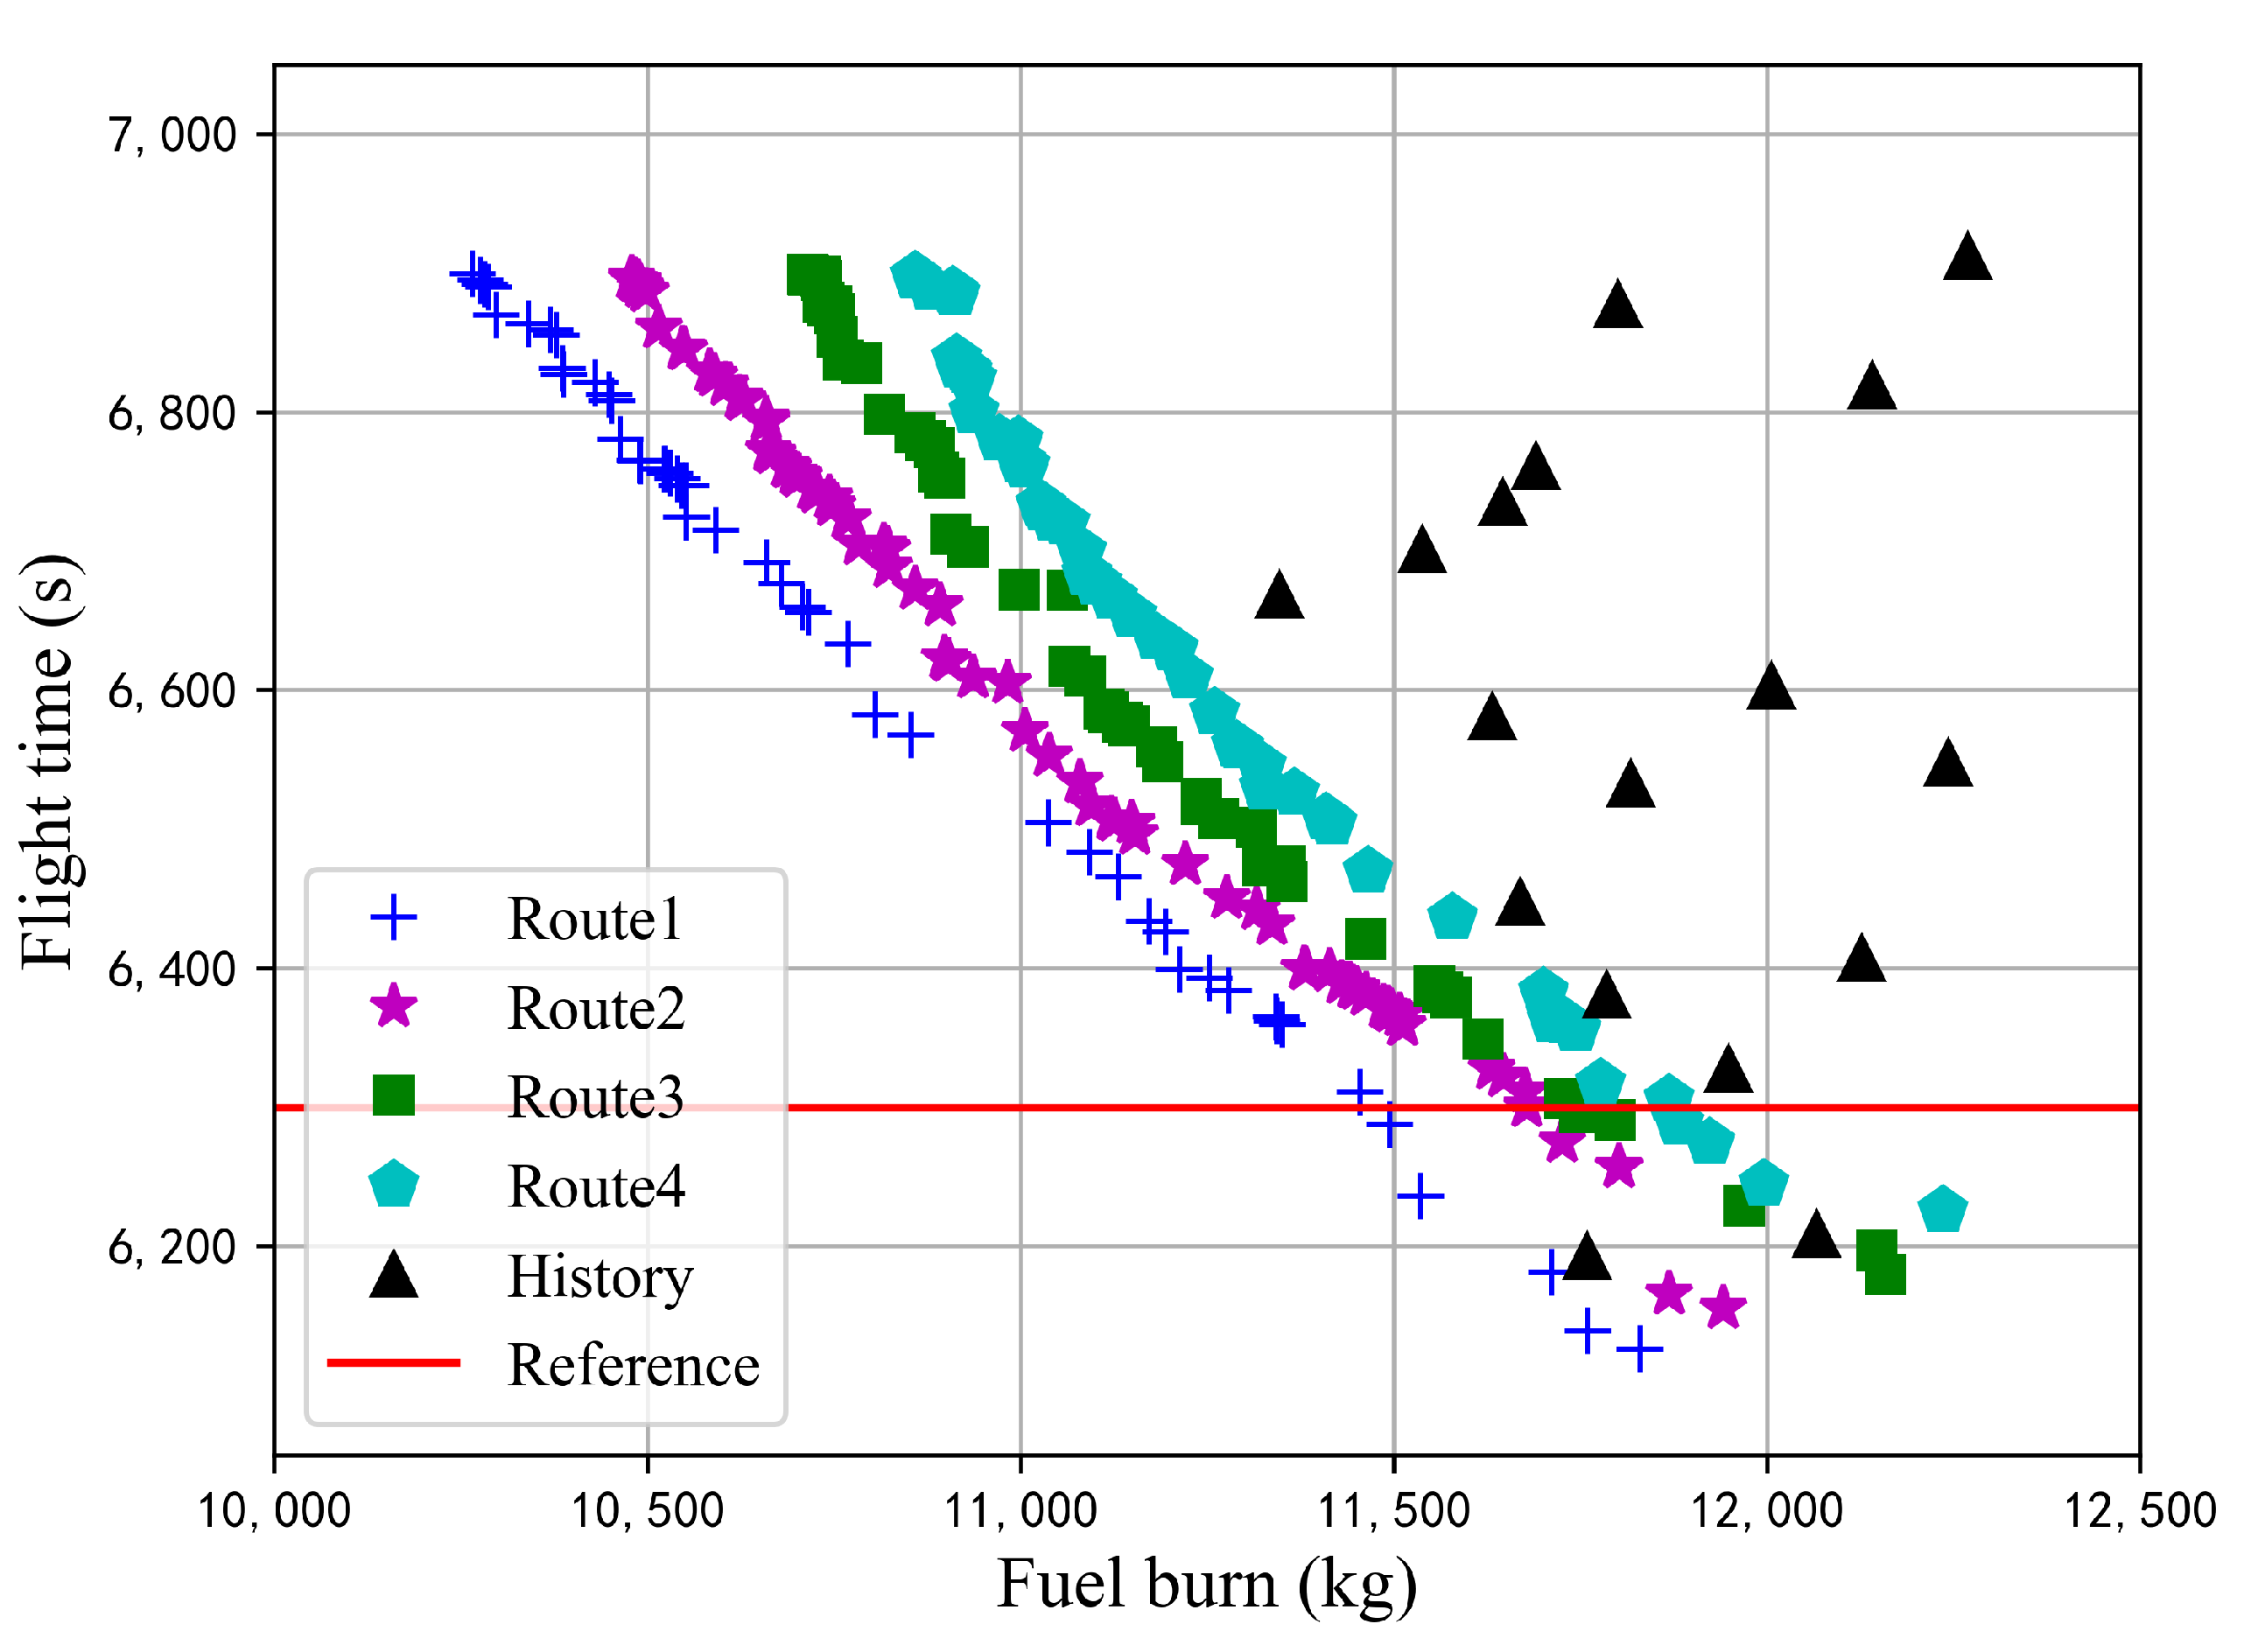
The optimal flight trajectory was planned for each of the four horizontal paths shown in Table A1. The Pareto frontier solution in each path is shown in Figure 8. The red line segment is the reference baseline of the SAT. The results show that flight time has a significant impact on fuel consumption, and, within the preset time range, the overall relationship is shown to be a linear one with similar slope, i.e., approximately 118.8 kg is required for every minute of advance. Meanwhile, without considering capacity constraints, the flight distance has an absolute impact on the Pareto frontier position, i.e., as the flight distance increases, the fuel consumption under the same flight time gradually increases, and the flight time under the same fuel consumption increases. Clearly, under the same operating constraints and optimization environment, any one of the frontier solutions with a longer horizontal path cannot be better than other frontier solutions with a shorter one in terms of fuel and flight time. In addition, as the flight distance increases, the Pareto frontier begins to show an inflection point, because the official standard flight time does not leave too much room for flights to arrive early.
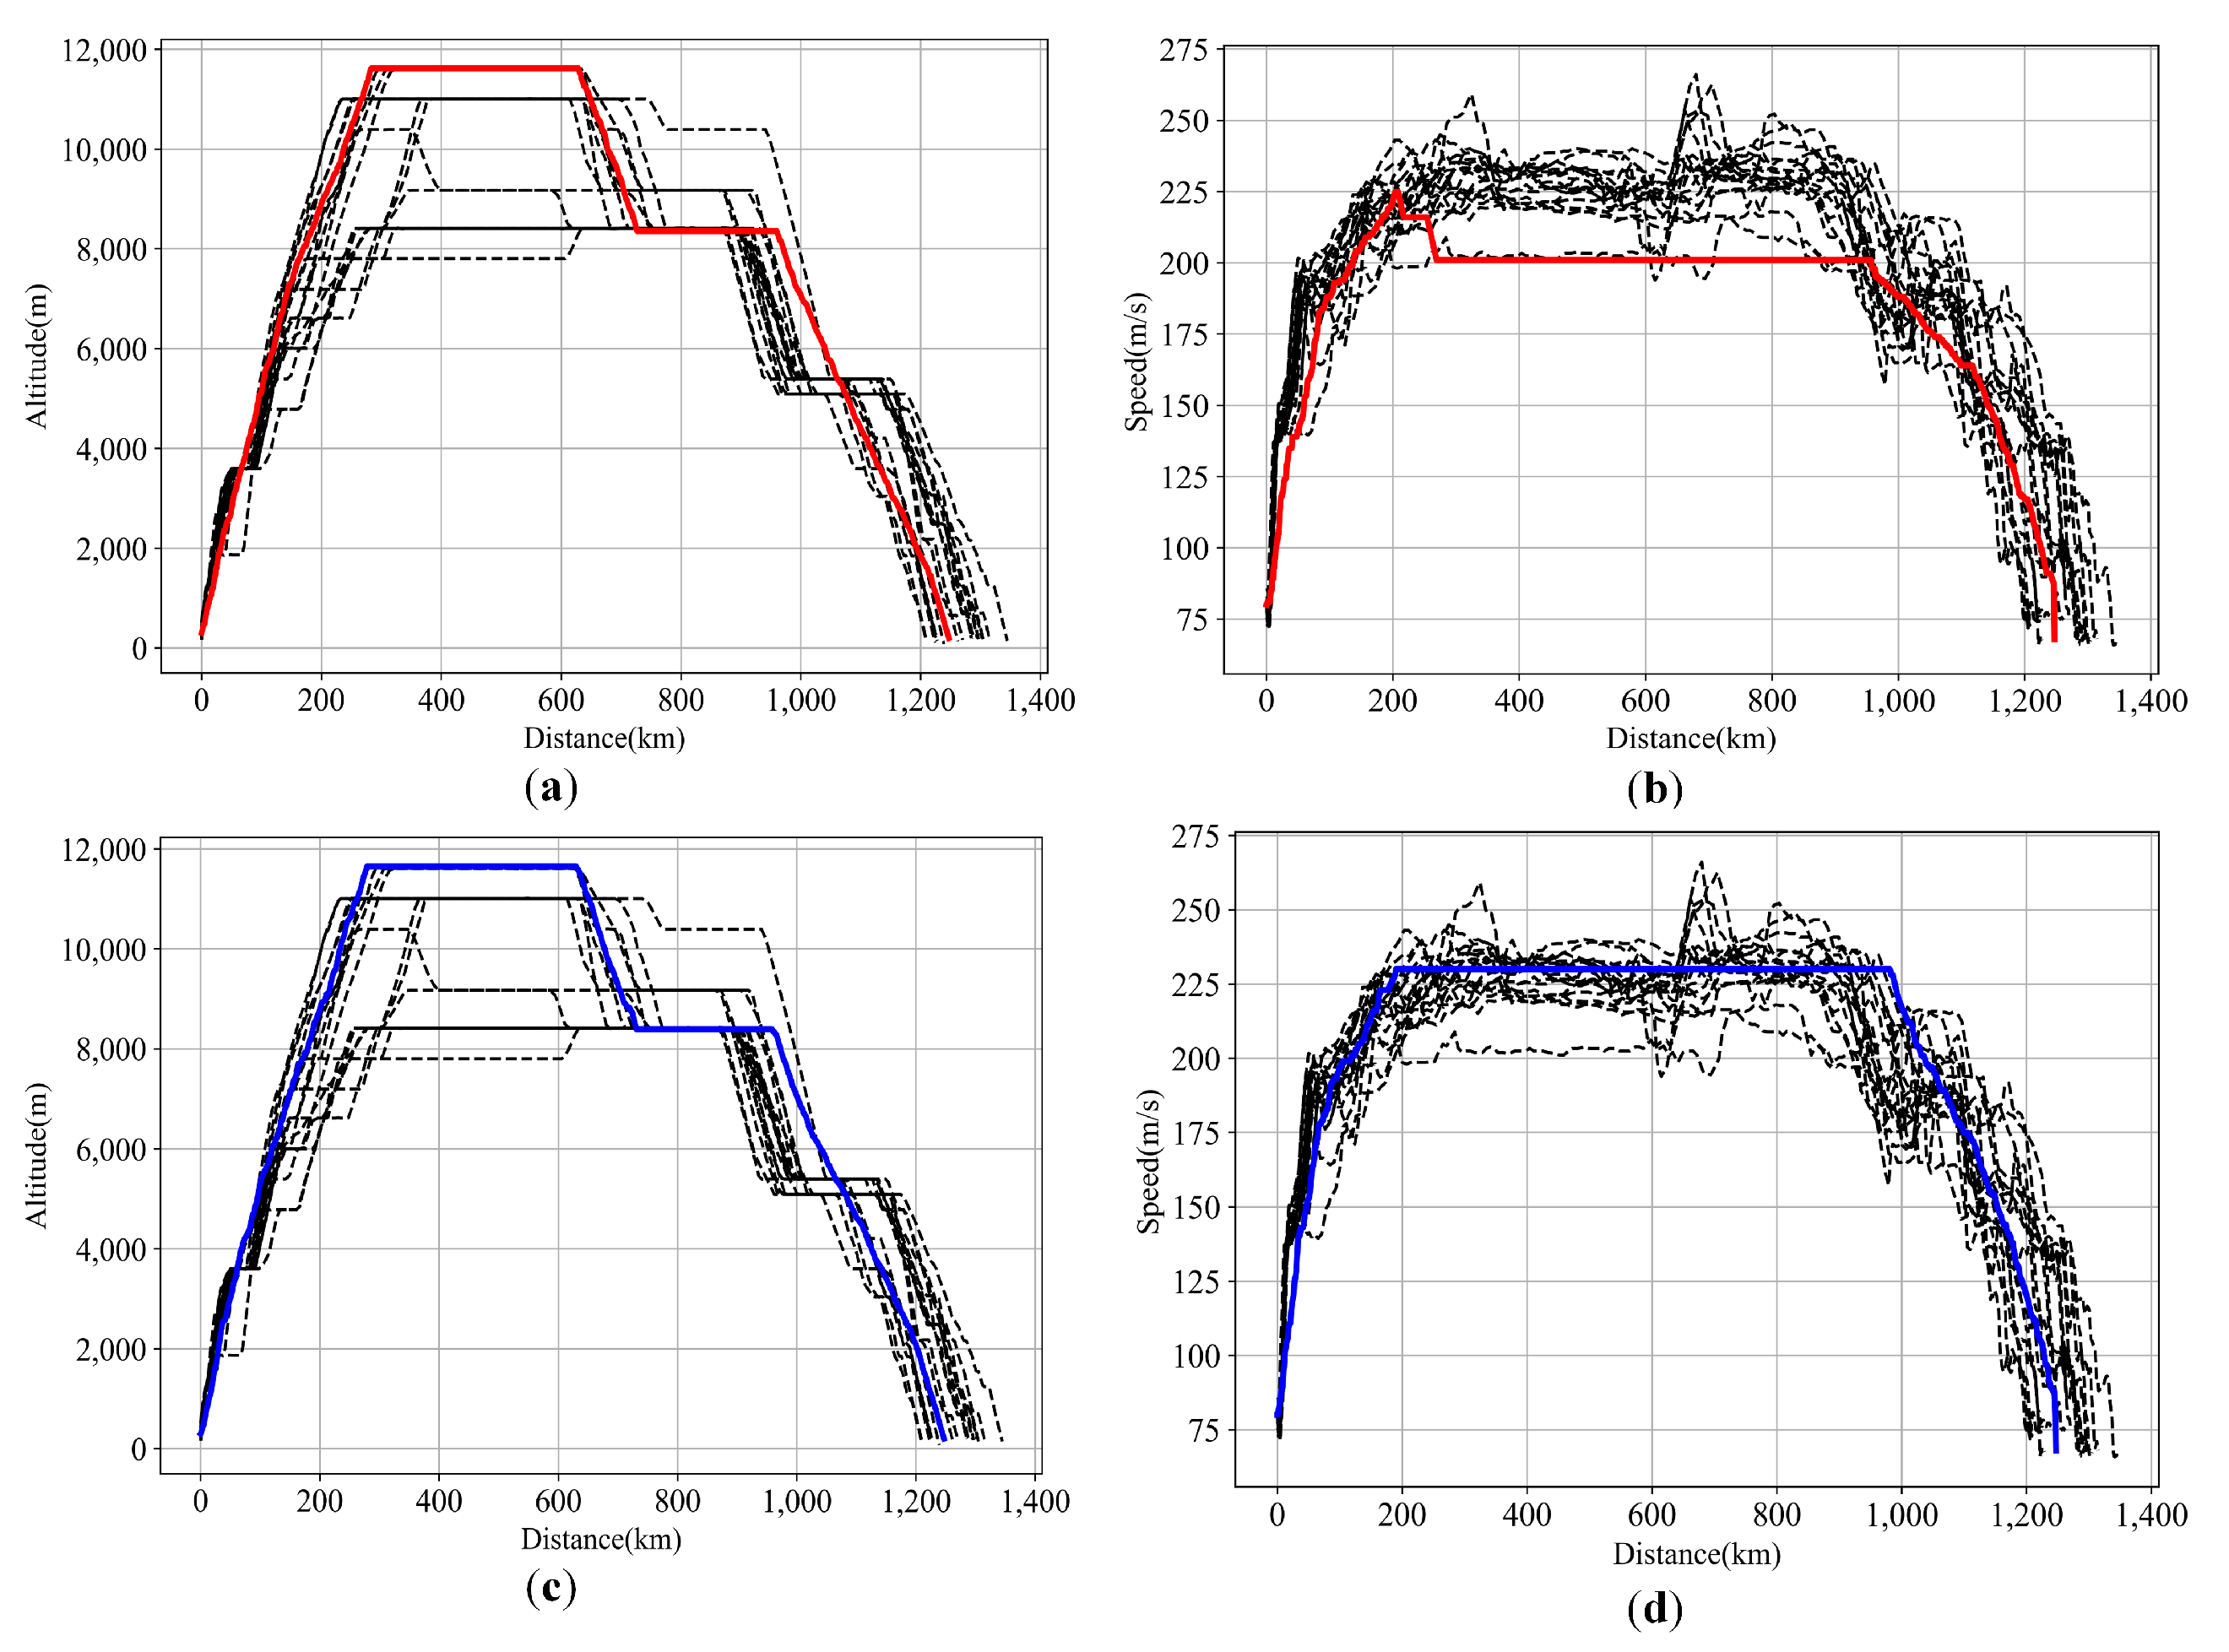
To investigate the trade-off space between fuel consumption and flight time, the altitude and speed of the aircraft during flight were analyzed. Figure 9 shows a comparison of the optimal and historical trajectory profiles corresponding to the solution with minimum fuel consumption (Trajectory 1) and minimum travel time (Trajectory 2) in Route 1. The red solid line is Trajectory 1, the blue solid line is Trajectory 2, and the black dotted lines are the historical trajectories of Airbus A333 on 1 July 2019. It shows that there were many low-altitude level-flight phases in the original trajectory, and the altitude and speed fluctuated greatly during cruise, resulting in higher fuel consumption. The difference between the results for Trajectories 1 and 2 obviously comes from the change in speed. Figure 9 shows that the aircraft reaches top of climb (TOC) at 284 km and TOD at 969 km when fuel consumption is minimized. The cruising altitude is maintained at 11,600 m. To determine the minimum fuel consumption, the flight speed was reduced to 201 m/s. To meet the control preference, the cruise level drops to 8400 m at 740 km away from departure airport. When the flight time is minimized, the aircraft reaches TOC at 276 km and TOD at 958 km. The cruising altitude is maintained at 11,600 m, and the cruising speed is maintained at 230 m/s. To meet the control preference, the cruising altitude drops to 8400 m at 733 km from the departure airport. High altitude and low speed cruising can significantly reduce fuel consumption while meeting timeliness constraints.
To evaluate the optimal upper bound of fuel efficiency in ideal conditions, the total fuel consumption before and after flight trajectory optimization on a typical day were compared. The historical fuel consumption during the flight was calculated using the fuel consumption model presented in this paper. First, the minimum fuel consumption in Route 1 and standard flight time were taken as upper bounds for comparison with the historical fuel consumption in each flight to obtain the ideal upper bound on fuel consumption reduction. To further increase the practical significance of the comparison, the same or similar flight time (the MRE of flight time of selected solutions in Routes 1–4 are 0.07%, 0.07%, −0.02%, and −0.01%) corresponding to the optimal fuel consumption solution in the Pareto frontier along different paths was selected for comparison, as shown in Figure 10. Among them, a positive value represents reductions compared to the historical fuel consumption/time, and vice versa for a negative value. Specifically, as shown in Table 3, the aircraft operates under the ideal altitude–speed profile corresponding to the minimum fuel consumption in Route 1 with standard flight time. The average ideal upper bounds on fuel consumption reduction are 13.38% and 3.36%, respectively; when similar flight times were selected for Routes 1–4, the average fuel consumption reduction rates were 8.05%, 6.55%, 5.17%, and 4.06%, respectively. Under the flight time limit, choosing a flight path with a shorter horizontal distance has greater potential for fuel consumption reduction.
Furthermore, the flight time was varied from 100 to 115 min in 5 min increments. The group of flights on a typical day is shown in Table 3. Multi-factor analysis of variance was used to evaluate the significance of the influence of route and flight time on fuel consumption. First, the normality of the data was tested, and the results are shown in Table A4. The results show that the data obey a normal distribution. Second, the data were tested for homogeneity of variance. Table A5 shows a Levene test table for error variance. The results show that the p-value of the Levene homogeneity of variance test statistic is 0.886, which is >0.05, so the data can be taken to meet the homogeneity of variance. Therefore, the data satisfy the premise of performing analysis of variance. Table 4 shows the main effects test results of the analysis of variance. The results show that the p-values of the main effects of time period and path are both <0.05, indicating that flight time and path have a significant impact on fuel consumption reduction. The p-value of interaction factors between time period and path is 0.999, which is greater than 0.05, implying that the effect of time on fuel saving potential does not change significantly with the choice of path. The result seems to conform to the reality because in this case the lengths of different paths do not differ too much, such that, no matter which path is chosen, the impact of flight time on fuel saving is roughly identical.
In summary, in a traffic scenario with no capacity constraints on a fixed path, the trajectory optimization method proposed in this paper can weigh the trade-off between flight time and fuel consumption, plan an ideal altitude–speed profile, and obtain upper bounds on fuel consumption reduction under different constraints. The model provides a basis for determining the ideal city-pair flight energy savings and emission reductions determined by 4D trajectory optimization.

6.3.2. Scenario 2: Trajectory Optimization Analysis Based on Fixed and Available Flight Path Sets under Capacity Constraints

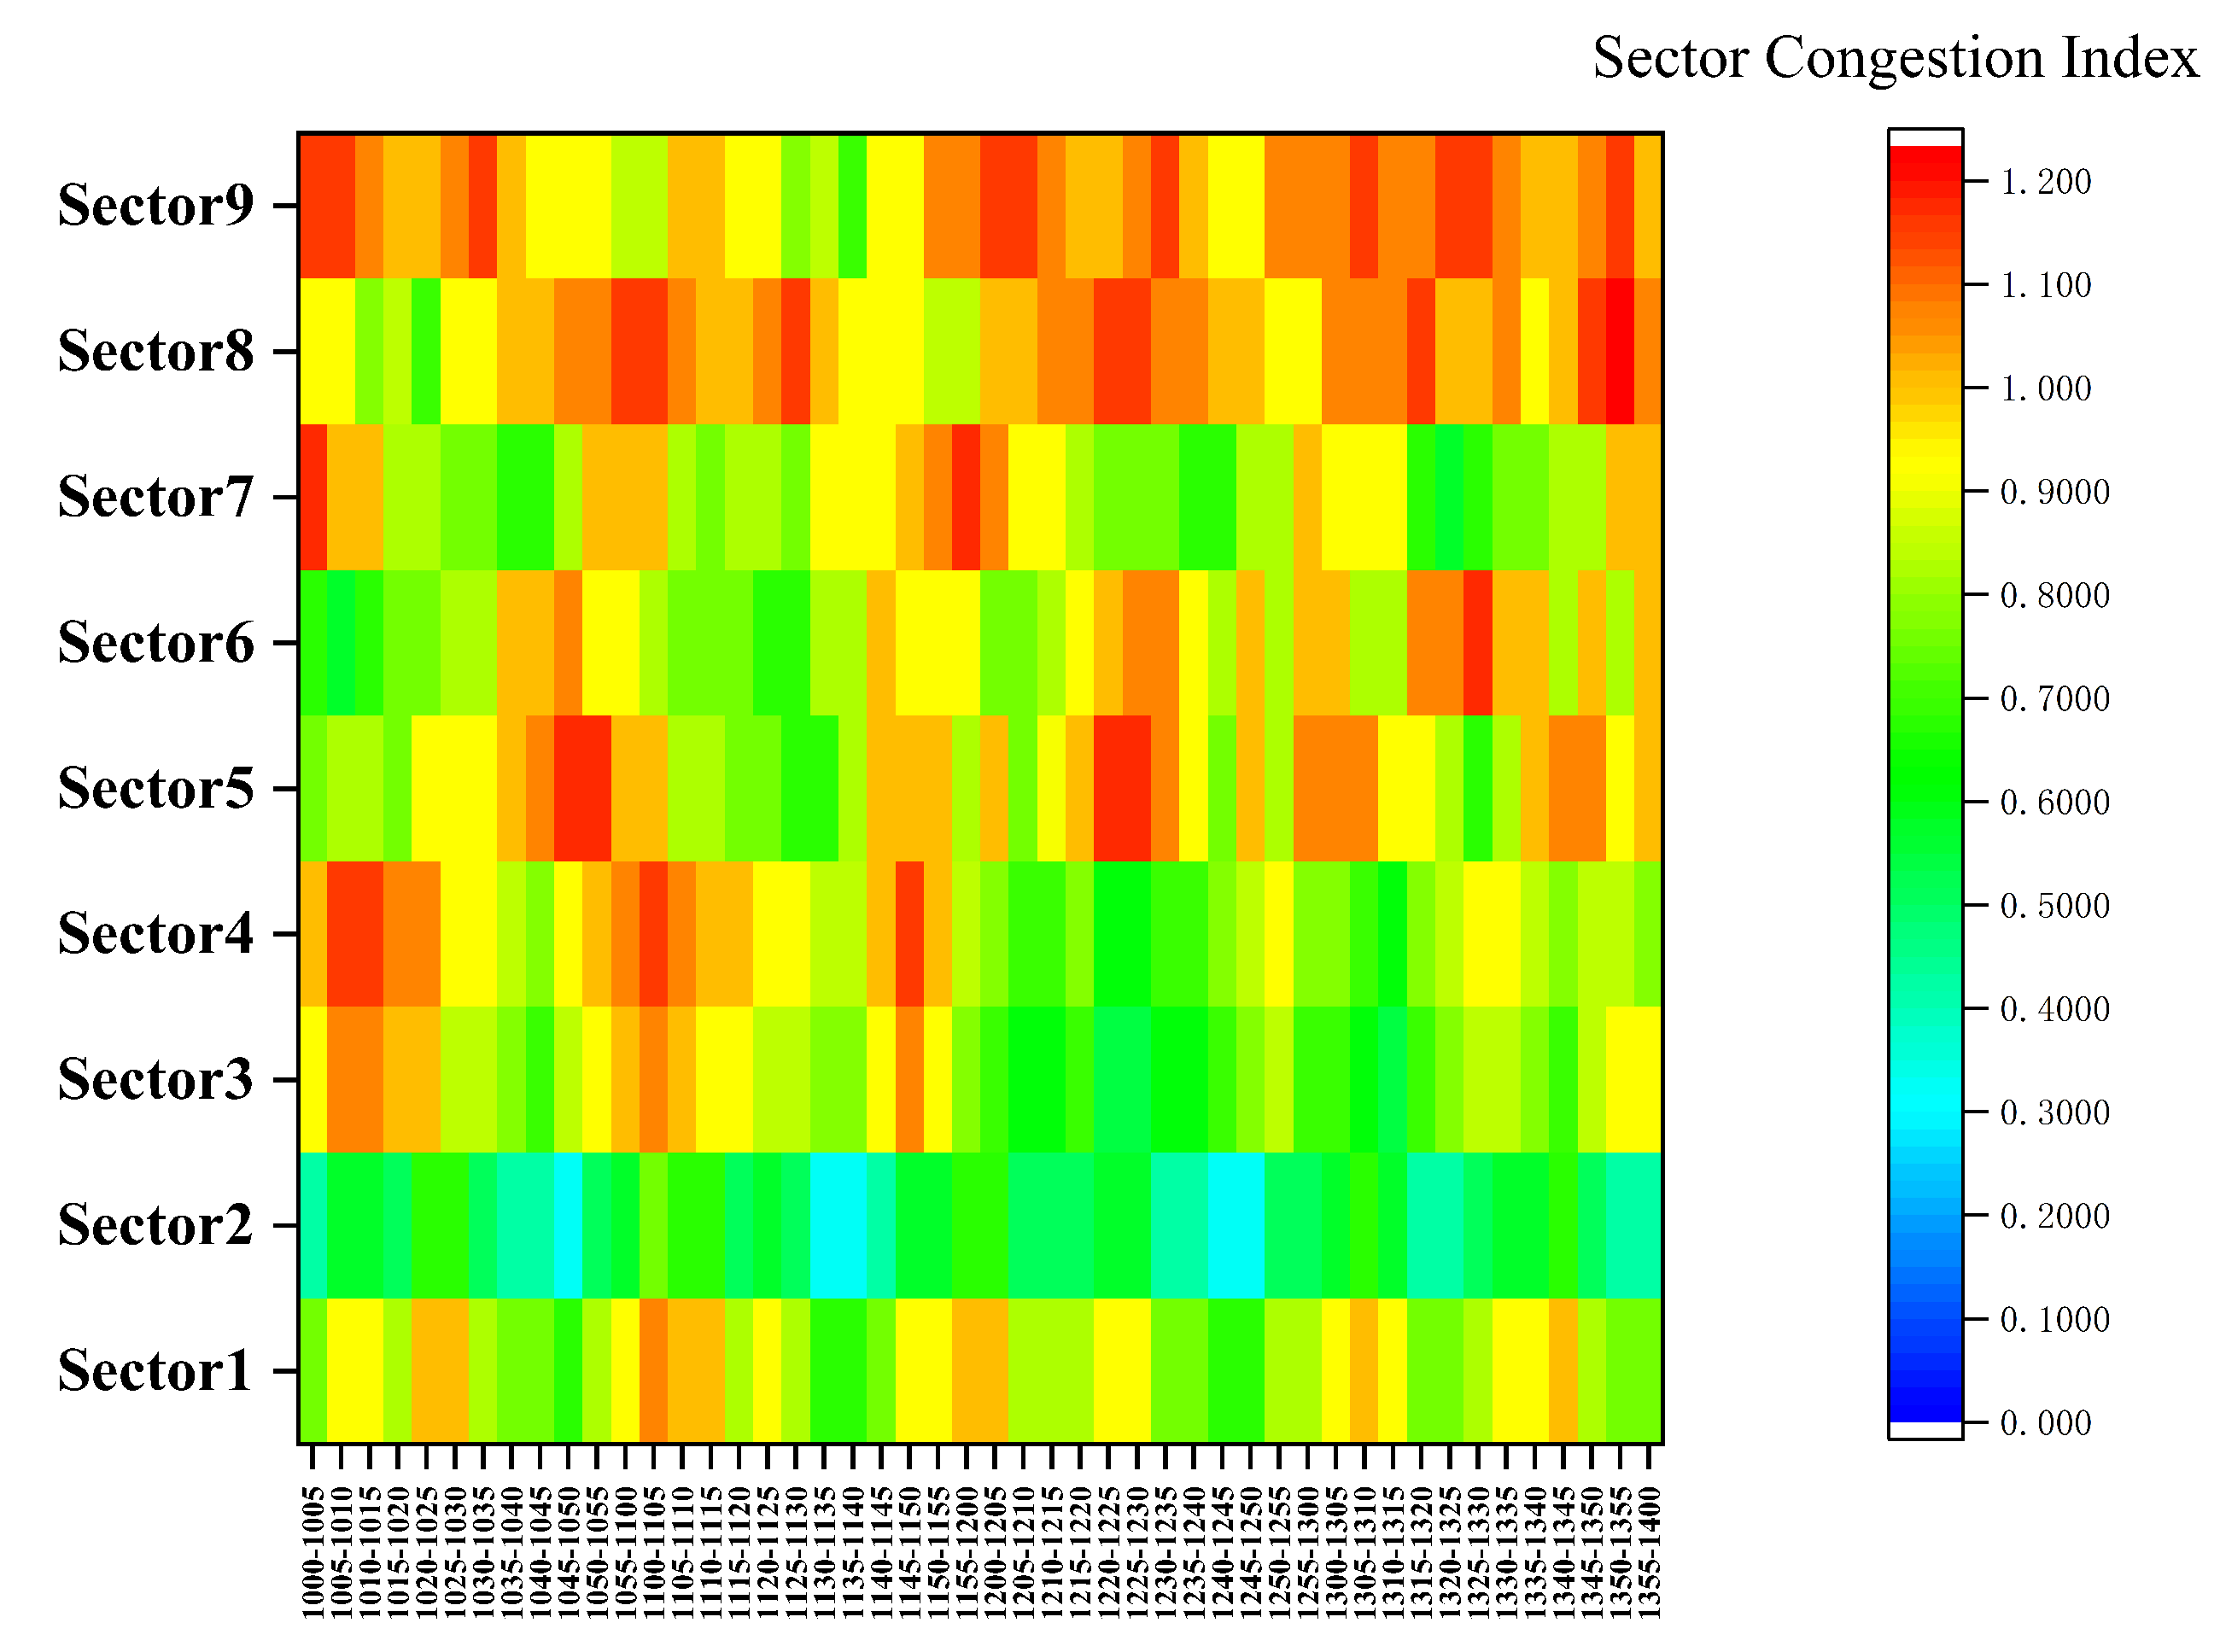
In addition to the highly dynamic atmospheric environment, potential reductions in aircraft fuel consumption in a real flight are affected by uncertainty in capacity and flow. The sector capacity–flow relationship from historical data was analyzed and four A333s were selected during the busy period of 10:00–14:00 on a typical day for experimental analysis. The congestion level in sectors from ZSSS to ZBAA at 10:00–14:00 is shown in Figure 11. Sector capacity was calculated using 15 min as statistical granularity and 5 min as rolling capacity in the sliding window, and sector congestion is the ratio of flow to capacity. The updated available time slots for a hotspot are shown in Table A6. The “time of enter hotspot” in the table was determined using the lowest fuel consumption trajectory of Route 1 (no capacity constraint) in Scenario 1.
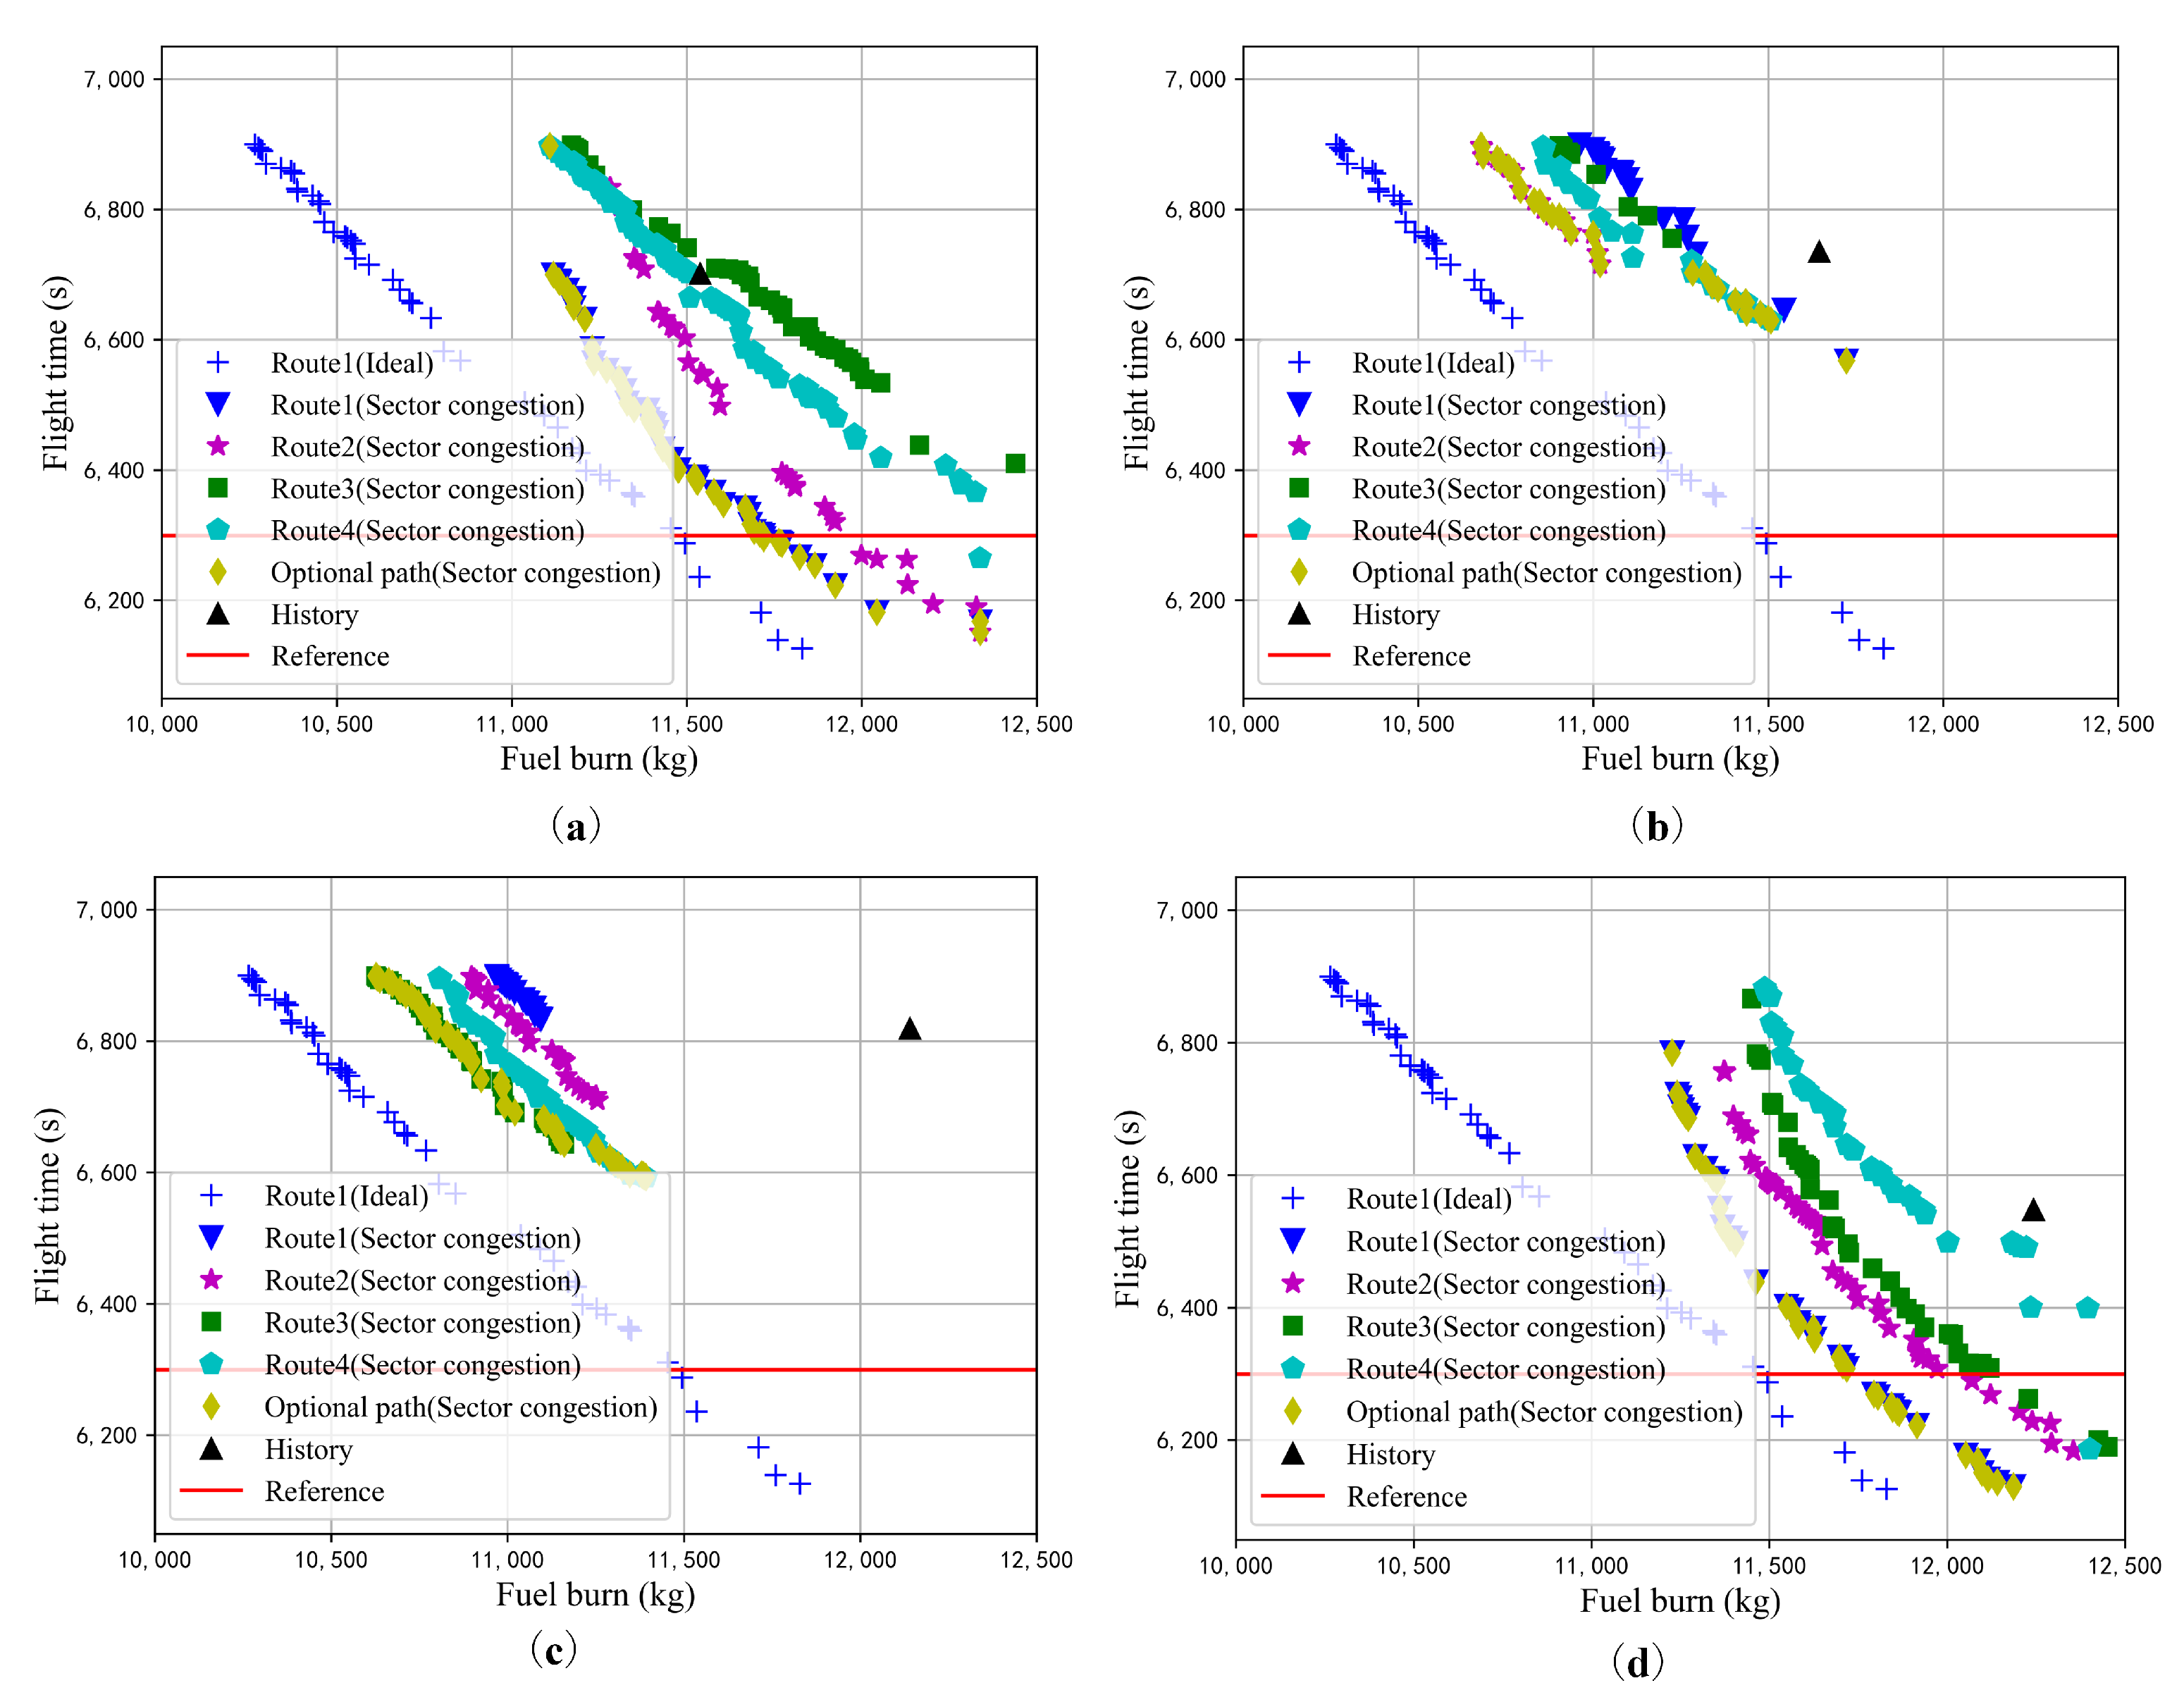
In the above scenario, fixed and optional path trajectory optimization for capacity constraints were carried out, as shown in Figure 12. In general, the limited capacity reduces the space for trade-off optimization of flight trajectories, and a more flexible horizontal operation space helps increase the potential reduction in fuel consumption. Compared with the fixed route (Route 1) and the historical flight trajectory, the minimum fuel consumption of the optional route trajectory optimization decreased by 1.45% and 8.25% on average. Under the same and similar flight time, fuel consumption on the optional route was decreased by 1.30% and 6.89%, respectively. The planned entry time of the four flights at the hotspot is different from the time slot for allowed entry, and the trajectory optimization potential is significantly different. Among them, the optimization results for Flights 1 and 4 are consistent with those for the fixed route, indicating that, when the planned arrival time is slightly later than the controlled arrival time, the aircraft can still obtain the lowest fuel consumption by adjusting the speed and altitude while maintaining the optimal fixed route (Route 1). In particular, when the planned arrival time is earlier than the controlled arrival time within a certain range, such as Flights 2 and 3, the Pareto frontier is very different from that of the fixed path. To further explore the causal factors driving these results, the flight trajectory was further optimized using Routes 2 and 4 as fixed paths under capacity constraints. The frontier solutions are shown in Figure 12.
The Pareto optimal frontiers for different paths for Aircraft 2 are shown in Figure 12b. Under capacity constraints, the fuel efficiency from high to low is Route 2, Route 4, Route 1, and Route 3. The reason for this ranking is that the available time slots for aircraft flying over Sector 5 and Sector 6 are consistent and limited. Compared with Routes 1 and 3, Routes 2 and 4 have longer flight distances before entering the hotspot, and the aircraft can use smaller speed adjustments to remain in the time slot when entering the sector. In addition, Route 2’s flight distance is shorter than that of Route 4’s, so Route 4’s optimal Pareto frontier and Route 2’s (with capacity constraint) Pareto frontier nearly coincide. In addition, compared to the optimal Pareto frontier for Route 1 (without capacity constraint), the Pareto frontier trade-off space for all paths under capacity constraints is compressed, and flight time tends to be distributed above 110 min. This shows that the use of air speed control to delay the time required for the aircraft to enter the sector has limited space for trajectory optimization.
The Pareto optimal frontiers for different paths of Aircraft 3 are shown in Figure 12c. Under capacity constraints, the fuel efficiency from high to low is found on Route 3, Route 4, Route 2, and Route 1. The reason for this ranking is that Routes 3 and 4 have the same time slots to enter Sector 6, and Sector 6’s available time slot is more relaxed than Sector 5’s. In addition, Route 3 has a shorter flight distance than Route 4. Therefore, Route 4’s optimal Pareto frontier and Route 3’s (with capacity constraint) Pareto frontier nearly coincide. Routes 1 and 2 enter Sector 5 within the same available time slot, but Route 2 has a longer flight distance before flying over the hotspot, such that the aircraft can use smaller speed adjustments to remain in the time slot when entering the sector, resulting in better fuel efficiency compared to Route 1. In particular, the optimal frontier for Route 1 (with capacity limitation) is very tight and is quite close to the maximum flight time of 115 min, which suggests the lowest trade-off flexibility in trajectory selection. It shows that, when the aircraft does not have optional route space, and the sector is available within the allotted time slot, the method of decelerating to delay the aircraft’s entry into Sector 5 and meet the timeliness constraints has almost reached its limit. This better reflects the importance of optional route space for reducing travel time.
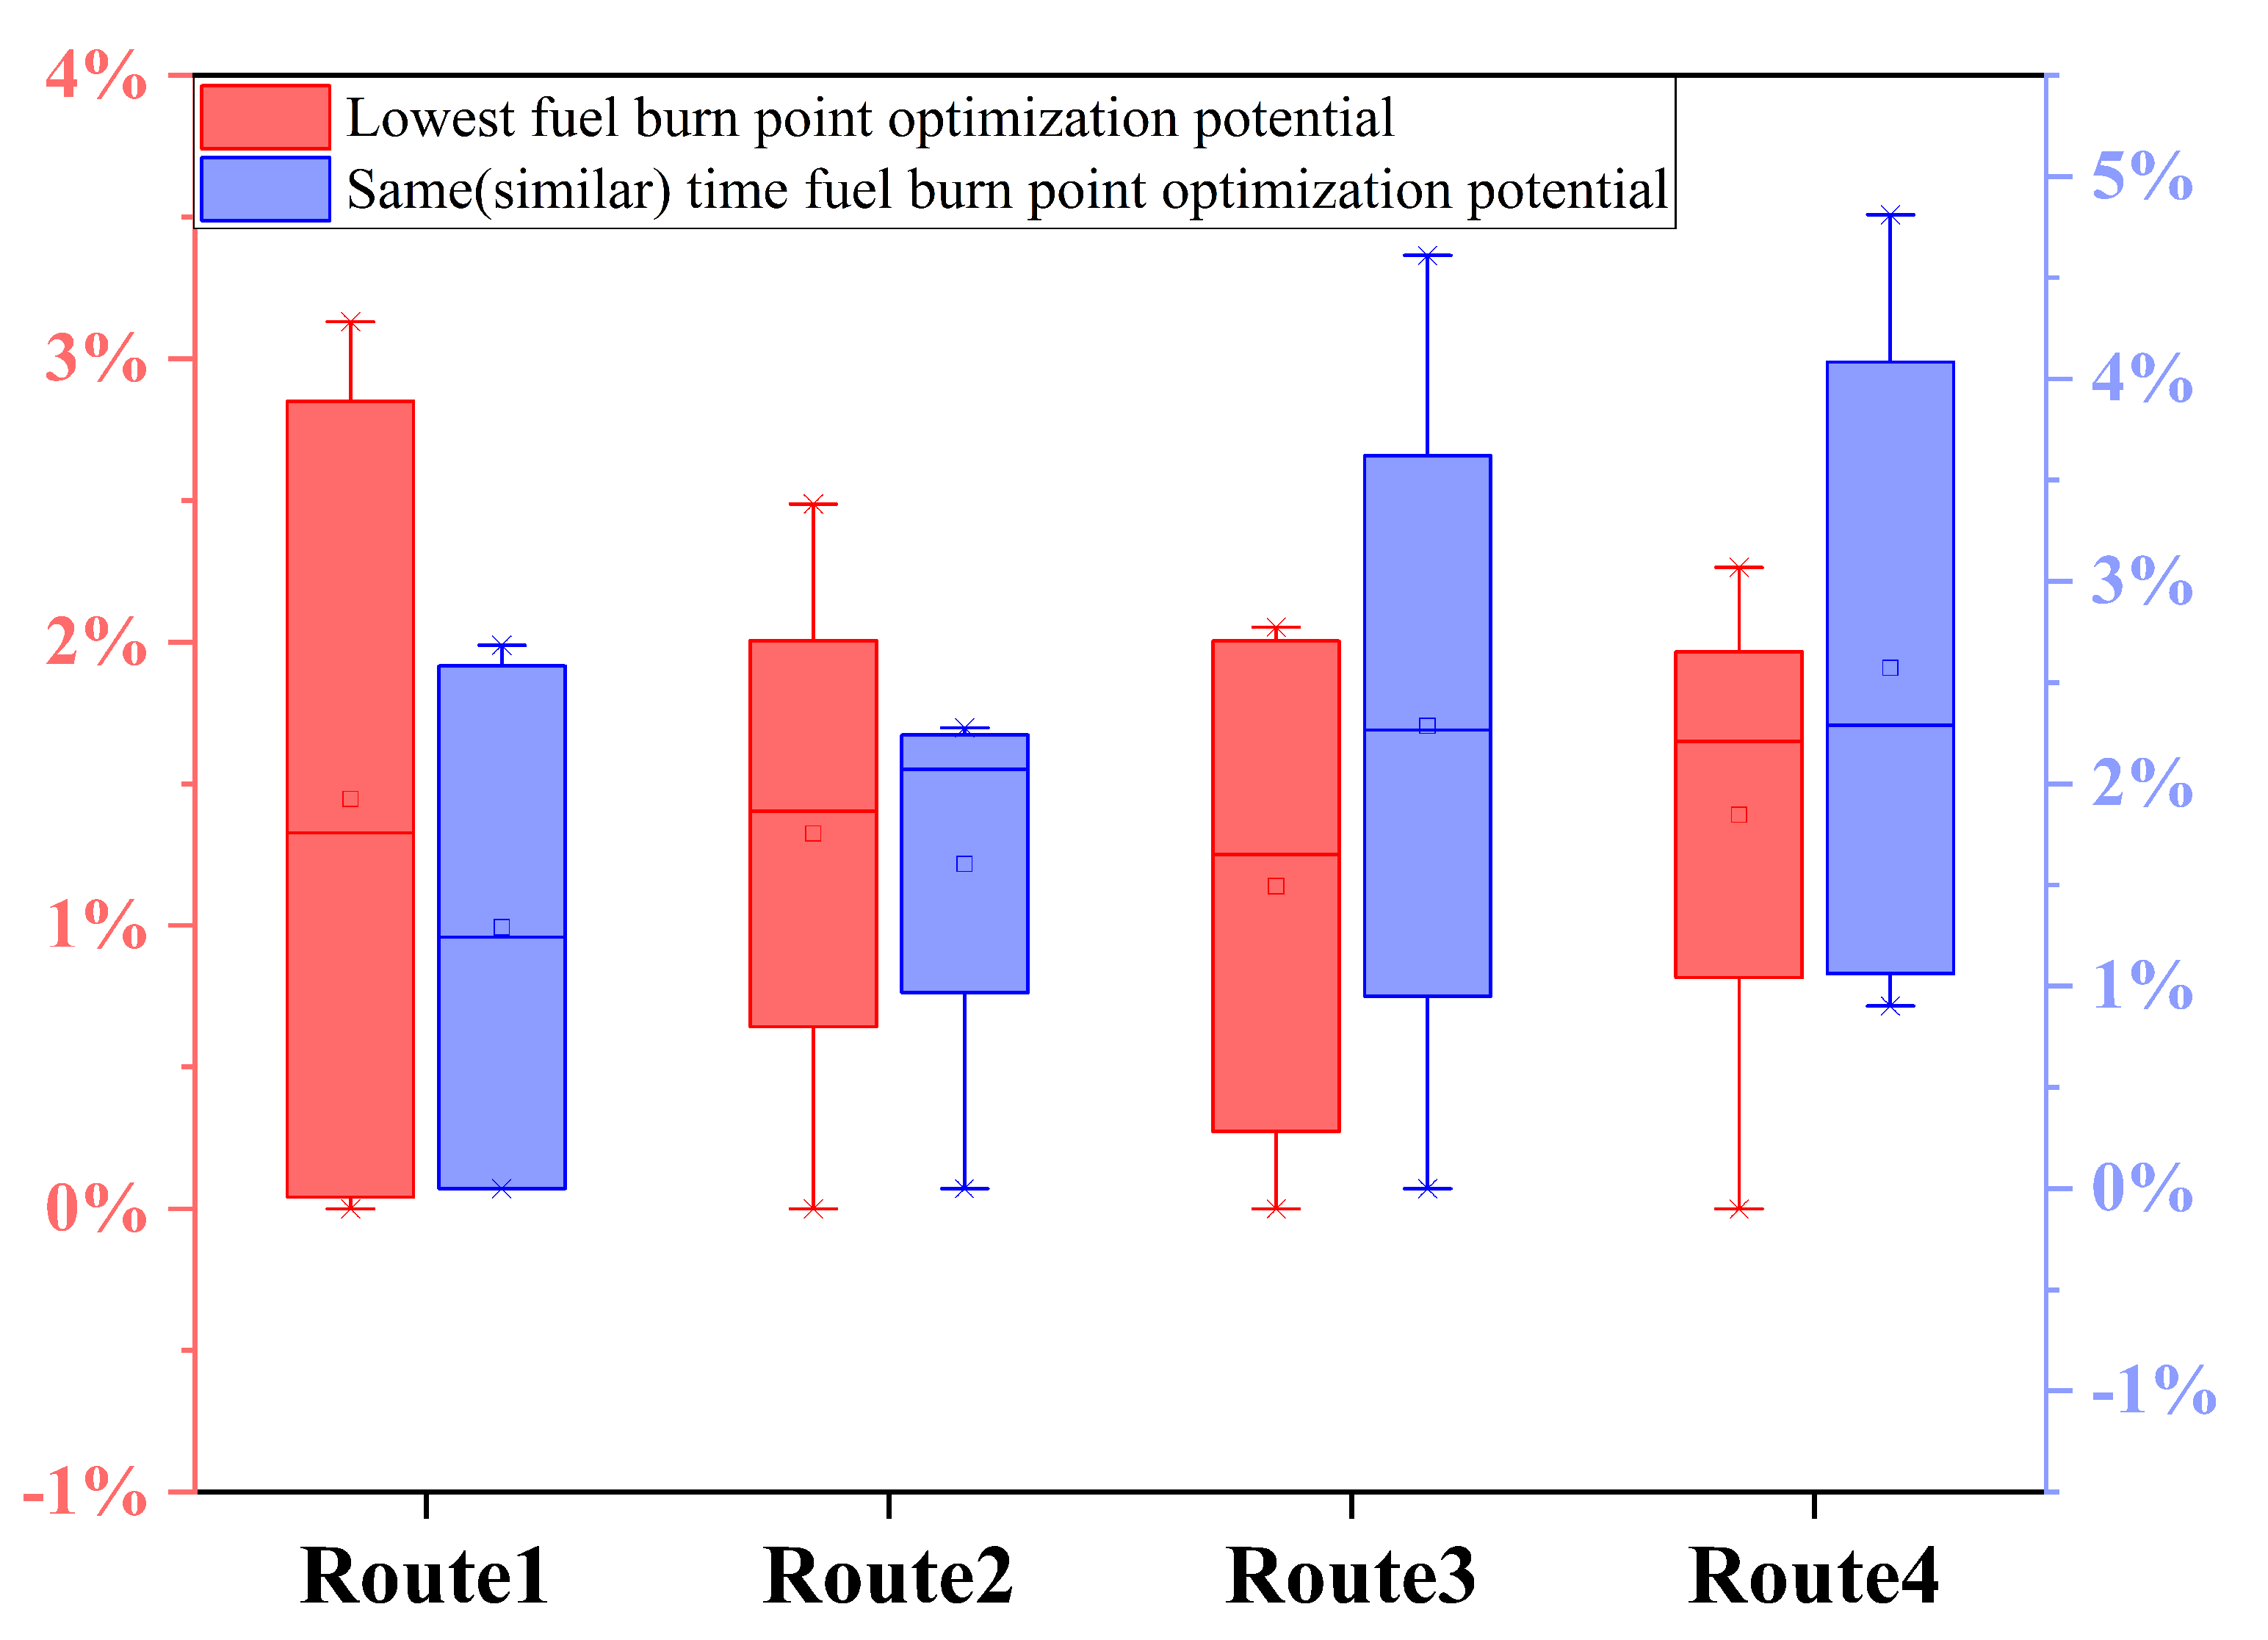
To explore the potential of optional routes for fuel efficiency improvement in the case of airspace congestion, the minimized fuel consumption point determined with optional path trajectory optimization was used as the upper bound and compared with the minimum fuel consumption determined for Routes 1–4 held fixed under capacity constraints. To further increase the practical significance of the comparison, the optimal fuel consumption solutions corresponding to the flight times that were similar or equal to the historical data were chosen (the MRE of flight time of selected solutions in Routes 1–4 are −0.05%, −0.03%, −0.12%, and 0.02%, respectively) from the Pareto frontiers for the optional and fixed paths for comparison, as shown in Figure 13. Specifically, compared with that of Routes 1–4, the average fuel consumption reduction for the optional route at its optimal fuel consumption point is 1.45%, 1.35%, 1.17%, and 1.41%, respectively. At the same or similar flight time points, the average fuel consumption reduction is 1.31%, 1.64%, 2.39%, and 2.70%, respectively. This verifies the effectiveness of the path selection model, as shown in Table 5.
Furthermore, the fuel consumed by the four A333s during the busy period of 10:00–14:00 on a typical day for optional and fixed routes is shown in Table A7. Similarly, a multi- way analysis of variance was carried out to evaluate whether the effect of the optional route on fuel consumption is significant. First, normality of the data was tested, and the results are shown in Table A8. The results show that the data follow a normal distribution. Second, the data were tested for homogeneity of variance. Table A9 shows a Levene test table for error variance. The results show that the significance of the test statistics for Levene homogeneity of variance is 0.477 > 0.05, so variance can be considered homogeneous. Therefore, the analysis of variance can be used to analyze these data. Table 6 shows analysis of variance results, indicating that optional routes have a significant and positive effect (p = 0.019) on fuel consumption.

6.3.3. Fuel Consumption Reduction Potential

The upper bound on potential fuel consumption reduction for city-pair flights was determined using trajectory optimization without changing the airspace structure. Compared with historical fuel consumption data, when an aircraft operates with an ideal altitude–speed profile corresponding to minimal fuel consumption on Route 1 and standard flight time in ideal operating conditions, the average ideal upper bounds for fuel consumption optimization are 13.38% and 3.36%, respectively, in the congestion-free scenario (Figure 14); regarding the same (similar) flight time, average fuel consumption reductions in Routes 1–4 are 8.05%, 6.55%, 5.17%, and 4.06%, respectively, as shown in Figure 14. When the aircraft operates under the capacity limit, the fuel consumption reductions for the optional route and Routes 1–4 are 8.99%, 6.92%, 7.01%, 7.18%, and 6.95%, respectively. One can see that the 4D trajectory multi-objective optimization model proposed in this paper can be used to examine trade-offs between fuel consumption and flight efficiency. By evaluating the fuel consumption reduction potential in different scenarios, different airspace rigidities, and different flight time requirements, the upper bounds on fuel consumption reduction can be determined for different comparison benchmarks. This provides a basis for determining city-pair flight energy savings and emission reduction targets based on 4D trajectory optimization, as shown in Figure 14.

6.4. Sensitivity Study

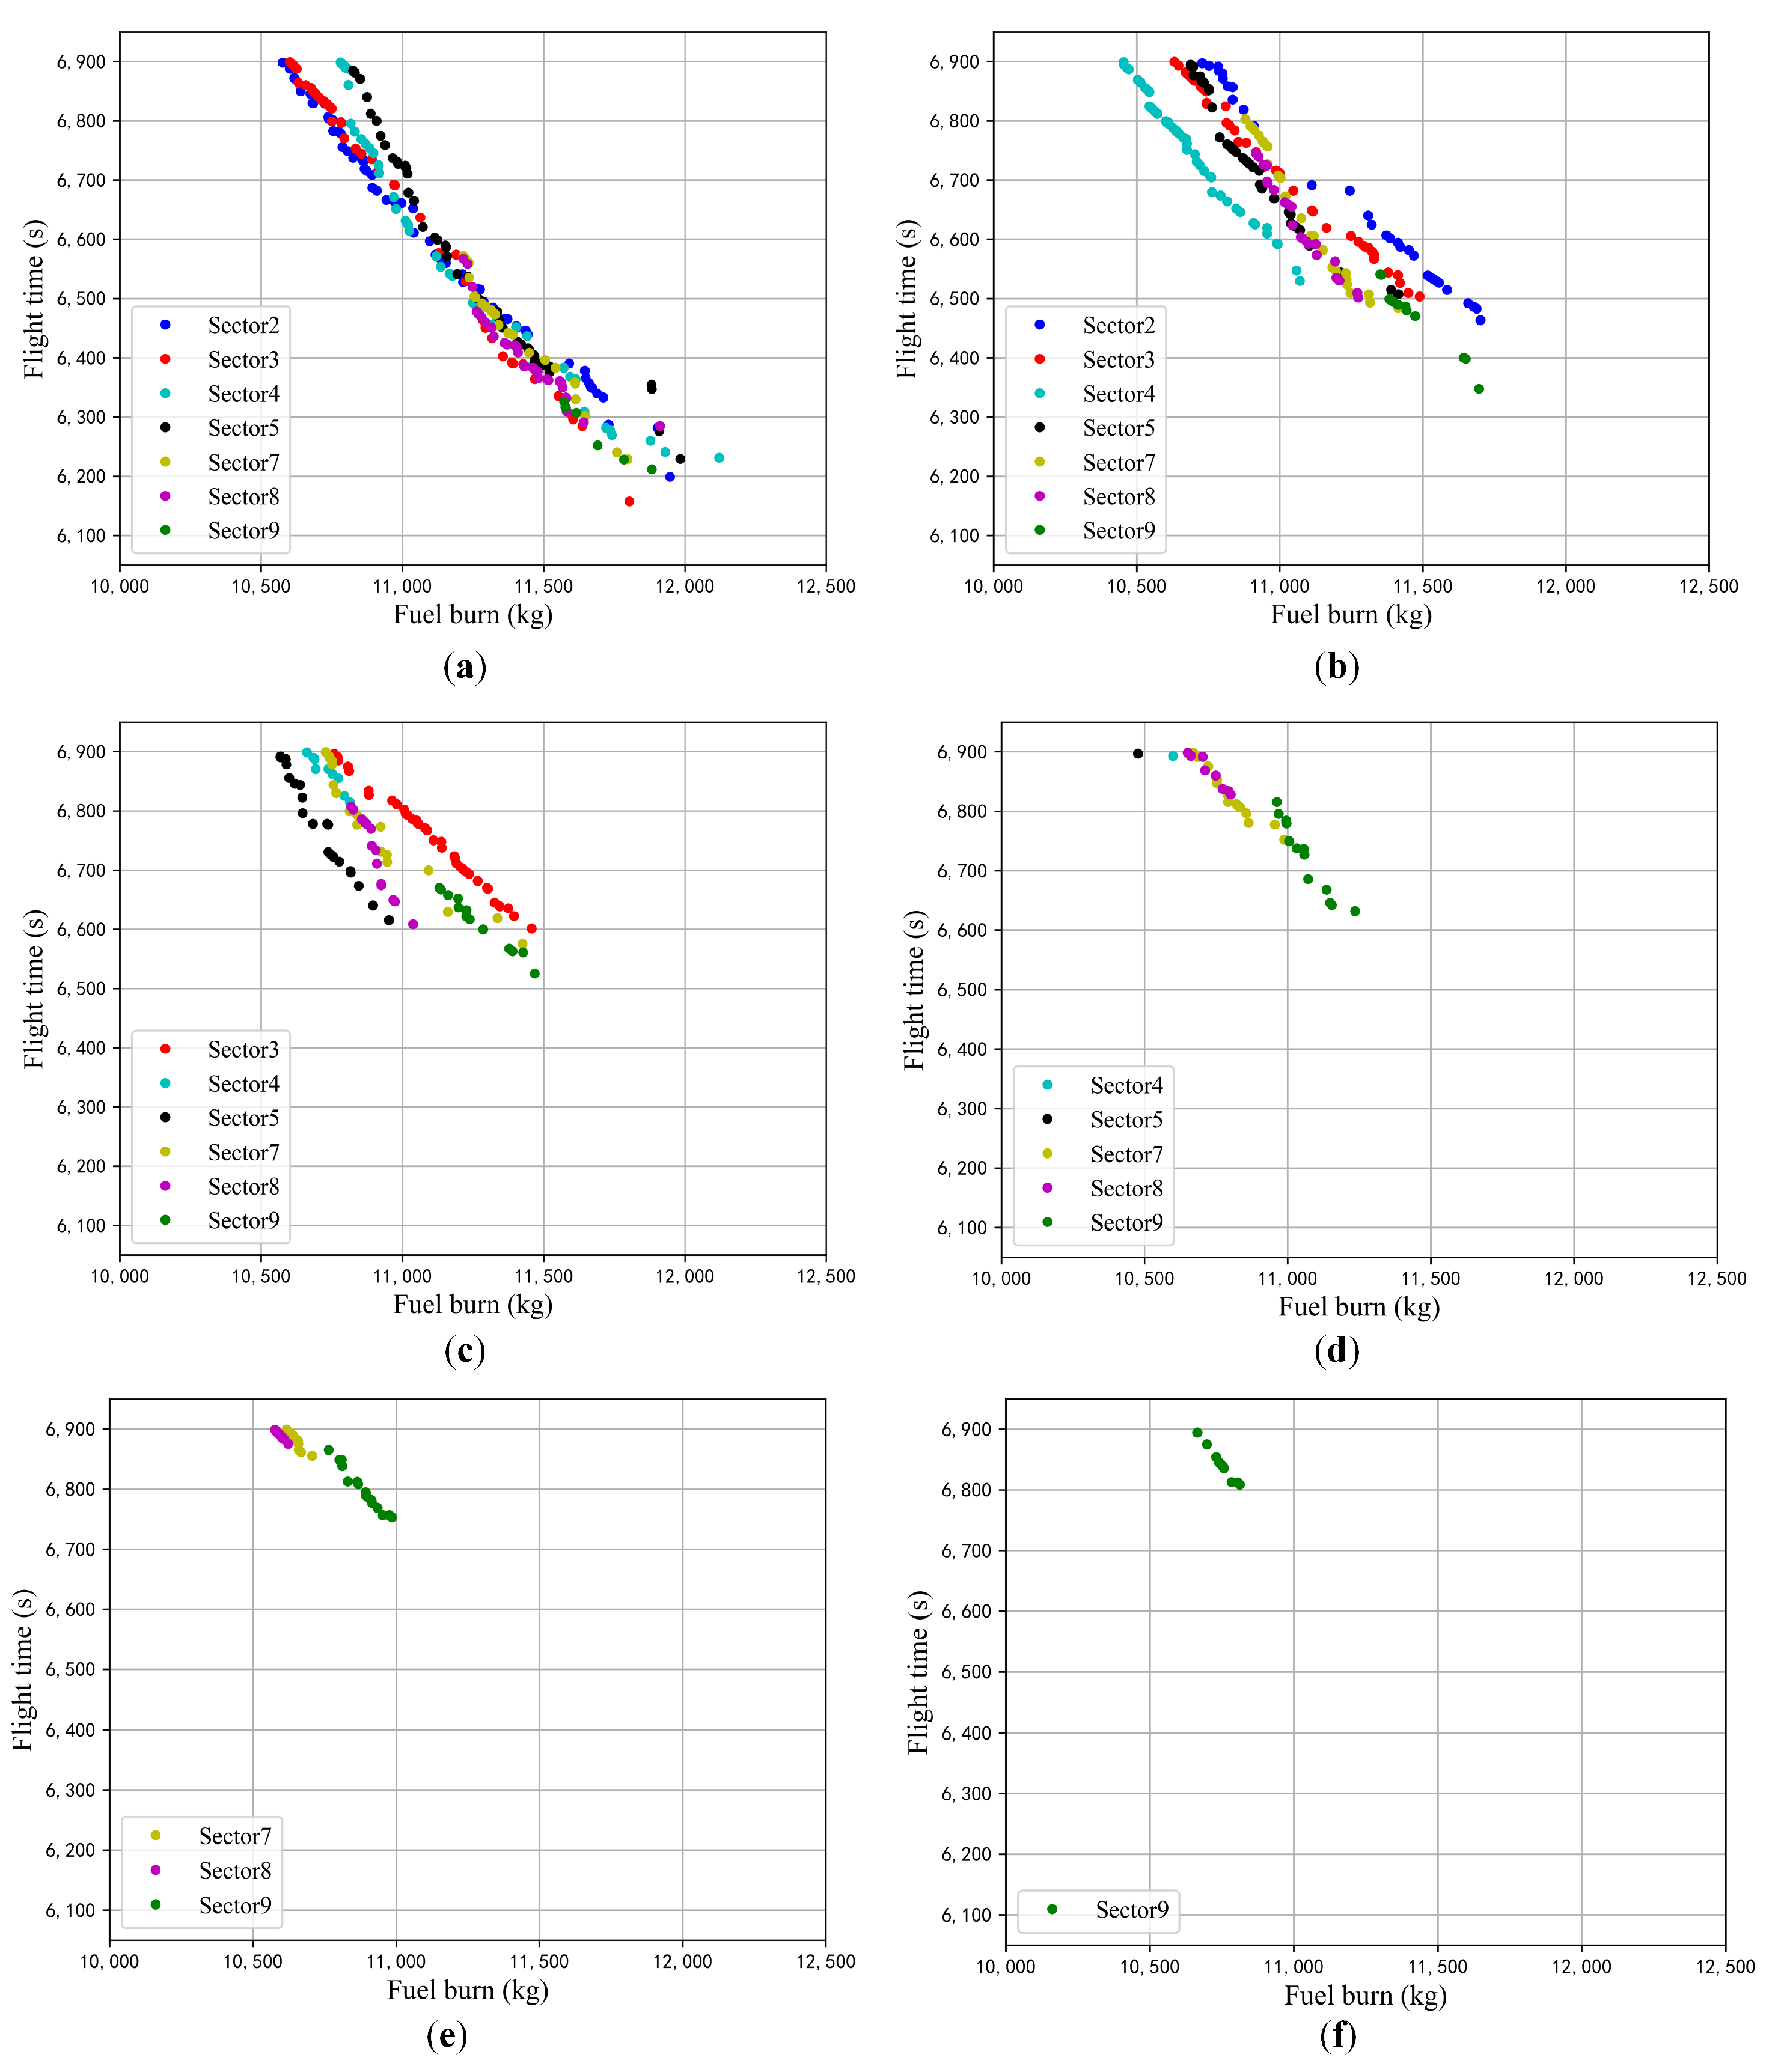
In order to further explore the impact of congestion location and uncertainty level on fuel efficiency, a sensitivity analysis was conducted using time-optimal trajectory along Route 1 in congestion-free scenario as the baseline (go through Sector 2, Sector 3, Sector 4, Sector 5, Sector 7, Sector 8 and Sector 9 in turn). Series of scenarios were designed by two independent variables: congested sector and severity of congestion (i.e., difference between the available entry slot and the planned arrival time).
Trajectory optimizations in above scenarios are shown in Figure 15. The time offset between the available time slot and the planned arrival time of the congested sector ranged from 2 to 12 min, incremented by 2 min. In general, the time offset and congested sector (interpreted as the distance to the departure airport) have a significant impact on the trajectory optimization effect. With the increase of the severity of congestion, it becomes less likely to arrive at the destination airport in advance. Meanwhile, the trade-off solution space decreases gradually. In addition, as the congested sector gets farther away from the departure airport, the aircraft has stronger ability to tolerate higher variations by adjusting speed and altitude profile. In particular, when the time offset is 12 min, solutions can be achieved if and only if the congested sector is Sector 9, which is closest to the landing airport.
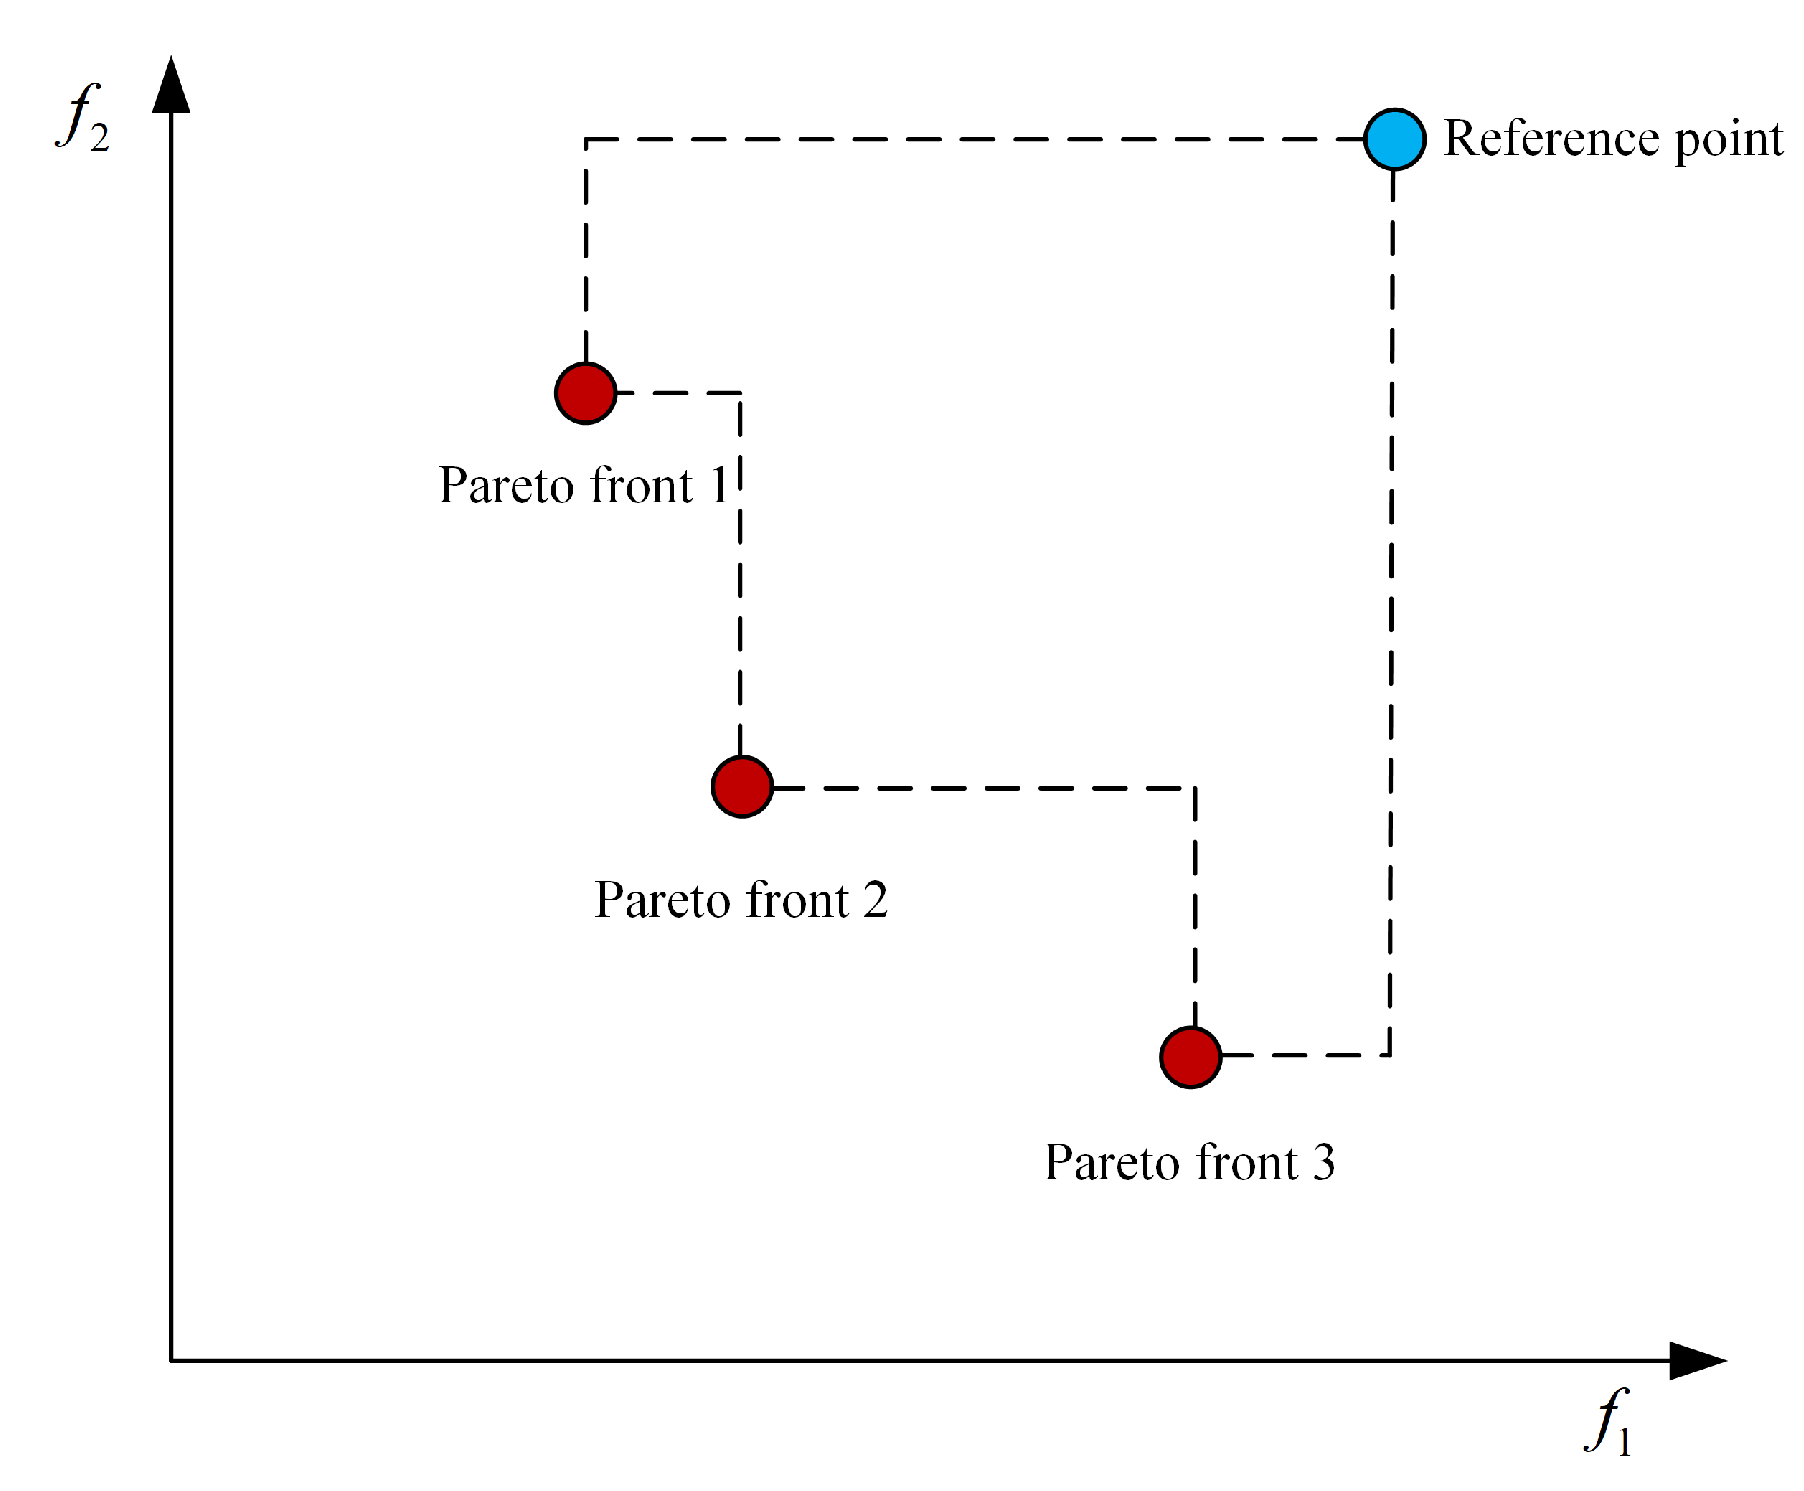
In order to further quantify the impact of airspace congestion on the optimization effect, and to explore the internal relationship between aircraft fuel efficiency and temporal-spatial characteristics of airspace congestion, the Hypervolume (HV) index is used to evaluate the pros and cons of the Pareto front solution [49], as shown in Formula (29). R i is a rectangle constructed by each element in the Pareto front and the reference point as the diagonal vertices, as shown in Figure 16. It should be noted that, when calculating HV, the data should be normalized.
H V = v o l u m e i = 1 m R i
The normalized (1,1) is selected as the reference point, and the results of HV are shown in Table 7. For the same sector, larger deviation would result in worse optimization effect. Interestingly, when the degree of congestion is small to medium (i.e., the time offset is 2–6 min), the fuel efficiency increases at first and then drops, as the congested sector gets close to the landing airport. In addition, for different time offsets, the “best” sectors varies accordingly, as shown in Table 7. It implies that, for low-to-medium variation, more balanced space on both sided of the congested sector would be more beneficial for trajectory optimization. When the congestion is getting severe (i.e., the time offset is 8–12 min), the “best” sector with best performance is always Sector 9 (see Table 7). It implies that allocating heavy delay to the airspace sector that is farthest away from the departure airport would achieve optimal solutions within predefined tolerable delay (i.e., [−5 min, 10 min]) in the model. The results are fairly fit with the nature of uncertainty, that is uncertainty is magnified over time. Therefore, more robust and refined ATFM strategies would significantly improve the performance of Pareto optimal front of trajectory optimization.

7. Conclusions

Studying the fuel-saving potentials and their influencing factors in the TBO context is a very first step of setting environmental performance targets in the development of the next generation of the ATM system, which is still an open topic receiving insufficient concern. This paper focuses on developing runway-to-runway 4D trajectory optimization models with heterogeneous constraints of travel time boundaries, route options, and sector capacity limitations from both airspace users’ and air traffic managers’ perspectives. The significance of fuel consumption reduction was examined for city-pair (ZSSS–ZBAA) trajectory optimization in ideal and congested operation scenarios with either fixed or optional routes. The congestion impact on the fuel-saving potentials was supplementarily included. In the following, our main conclusions, some implications, and future work are stated.
  • Main conclusions
    In the congestion-free scenario with fixed route, travel time has a significant impact on fuel consumption. Overall, linear trade-off characteristics between fuel burn and flight time within the predefined range of tolerable delay was observed (i.e., 1 min in advance requires an extra 118.8 kg of fuel). Within a predefined travel time boundary, cruising at higher altitude with lower speed would burn less fuel. In the congestion-free scenario, the flight distance simply has a negative impact on the optimal Pareto front (i.e., an extra 23.6 kg of fuel required for each kilometer), the slopes of which are similar for different route choices. The results imply that, considering a tolerable delay, choosing a flight path with shorter horizontal distance would achieve greater potential for fuel consumption optimization. In the capacity-constrained scenario, which is the common situation in daily ATFM (Air Traffic Flow Management) practice, the trade-off space of optimal trajectory solutions is compressed due to fewer available entry time slots in congested sectors, which would significantly reduce the fuel efficiency. Nevertheless, more energy-saving potentials would benefit from flexible route options.
    Apparently, the trajectory optimization effect is sensitive to the congestion location and severity. Generally, within travel time constraints, the maximum acceptable sector entry time delay after takeoff (i.e., ATFM uncertainty) increases as the congested sector becomes further away from the departure airport. The best performance would be achieved when the entry time uncertainty (less than 6 min) emerges around the middle of the flight path. Therefore, in the TBO context, aircraft performance margin, and RTA constraints of individual flight trajectory should be taken into consideration in balancing capacity and air traffic flow among multiple sectors, in order to achieve minimum deviation to the planned trajectory while maintaining high operational efficiency, economy, and predictability.
  • Limitations and future work
    This paper provides a preliminary but adaptable framework for predicting and evaluating city-pair fuel efficiency improvement potentials in the TBO context. A more comprehensive study that expands the research scope from a single city pair to the entire airport network including domestic and international flights would achieve more insights for setting green development goals in future ATM.
    More impact factors shall be considered in addition to route choice, flight time, and coarse-grained sector congestion, in investigating fuel-saving potentials at the entire network level by incorporating airport capacity constraints, incidental capacity shortfalls, Miles (Minutes)-in-Trail regulations, ATC separation management, prevailing climate, or emerging severe weather conditions. A big data-driven fuel assumption modeling would be a promising approach to deal with the above uncertainties and even emergency and in-stable air traffic operation scenarios.
    In addition, a higher degree of routing flexibility would unleash fuel-saving potentials in the TBO context. Free Route Airspace (FRA) [50], compared with structural airspace with preset but limited routing options, is a more promising means of increasing trajectory-based operation performance, which would be worthwhile for advancing airspace planning and management. For the China airspace system, a more practical way to enhance the operational flexibility is to design modularized airspace that retains the original ATS (Air Traffic Service) route and adaptively configures entry and exit points, as well as free maneuvering zones based on the availability of airspace resources underpinned by Flexible Use of Airspace (FUA).

Author Contributions

Conceptualization, F.L. and Z.L.; methodology, F.L. and Z.L.; software, Z.L. and H.X; validation, F.L., Z.L., and H.X.; formal analysis, H.X. and L.Y.; investigation, L.Y. and M.H.; resources, H.X. and M.H.; data curation, H.X. and L.Y.; writing—original draft preparation, F.L. and Z.L.; writing—review and editing, H.X. and L.Y.; visualization, H.X. and L.Y.; supervision, L.Y. and M.H.; project administration, L.Y.; and funding acquisition, L.Y. All authors have read and agreed to the published version of the manuscript.

Funding

This research was funded by the National Natural Science Foundation of China (Grant No. 61903187), Natural Science Foundation of Jiangsu Province (Grant No. BK20190414), and National Key Research and Development Project (2018YFE0208700).

Institutional Review Board Statement

Not applicable.

Informed Consent Statement

Not applicable.

Data Availability Statement

Not applicable.

Conflicts of Interest

The authors declare no conflict of interest.

Abbreviations

The following abbreviations are used in this manuscript:
ATMAir Traffic Management
ASBUAviation System Block Upgrade
ATFMAir Traffic Flow Management
ATSAir Traffic Service
BADABase of Aircraft Data
CAEPICAO’s Committee on Aviation Environment Protection
CAAMSCivil Aviation ATM Modernization Strategy
CCOContinuous Climbing Operation
CDOContinuous Descending Operation
CTAControlled Time of Arrival
CPSConstrained Position Shifting
CAScalibrated air speed
CDMCollaborative Decision Making
DCBDemand and Capacity Balance
FRAFree Route Airspace
FUAFlexible Use of Airspace
GFSGlobal Forecast System
GSGround Speed
HVHypervolume
ICAOInternational Civil Aviation Organization
MINLPMixed-Integer Nonlinear Program
MATDMaximum Acceptable Time Delay
MATAmaximum acceptable time advance
MREMean Relative Error
NextGenNext Generation Air Transport System
NOAANational Oceanic and Atmospheric Administration
NSGA-IINon-dominated Sorting Genetic Algorithm with Elitist Strategy
PMPoint Merge
PMMPoint Mass Model
ROCDRate of Climb/Descent
SESARSingle European Sky ATM Research
SBTShared Business Trajectory
SATStandard Airborne Time
TBOTrajectory-based on Operation
TMATerminal Maneuvering Area
TEMTotal Energy Model
TASTrue Airspeed
TODTop of Decent
TOCTop of Climb
4DFour-dimensional

Appendix A

Table A1. ZSSS–ZBAA waypoints information.
Route CodeWaypointsHorizontal Distance (km)Passing Sector (Hotspot)
Route 1ZSSS, PK, POMOK, XIREM, PIKAS,
UNTAN, PIMOL, XUTGU, NIXEM,
SUBKU, ATVAD, LAGAL, OMUDI,
DPX, UDINO, P58, P60, P86,
ABTUB, DALIM, TUMLO, P148,
BIVOR, VYK, ZBAA
1248Sector 5
Route 2ZSSS, PK, POMOK, XIREM, PIKAS,
YCH, HUN, IDKOT, OMUDI, DPX,
UDINO, P58, P60, P86, ABTUB,
DALIM, TUMLO, P148, BIVOR, VYK, ZBAA
1256Sector 5
Route 3ZSSS, PK, POMOK, XIREM, PIKAS,
UNTAN, PIMOL, XUTGU, NIXEM, SUBKU,
ATVAD, LAGAL, OMUDI, DPX, UDINO,
P58, P197, P64, P198, AR, P229,
P431, OLRED, TUMLO, P148,
BIVOR, VYK, ZBAA
1260Sector 6
Route 4ZSSS, PK, POMOK, XIREM,
PIKAS, YCH, HUN, IDKOT,
OMUDI, DPX, UDINO, P58,
P197, P64, P198, AR, P229,
P431, OLRED, TUMLO, P148,
BIVOR, VYK, ZBAA
1268Sector 6
Table A2. Restricted conditions of ZSSS–ZBAA flight process.
DescriptionRestriction Information
PD065Altitude ≥ 1800 m, Speed ≤ 250 kt
PKAltitude ≥ 3000 m
SS073Altitude ≥ 4800 m
Lowest safe altitudeAltitude ≥ 2184 m
VYKAltitude ≥ 5100 m
AA121Altitude ≥ 3000 m, Speed ≤ 250 kt
AA122Speed ≤ 220 kt
Table A3. QAR data of A333 from ZSSS to ZBAA (partial).
RecordTimeFlightPhaseLongitudeLatitudePA_ftIVV_fpmCAS_ktTAS_ktMachGS_ktFuelFlow_lbhWindspeed_ktWind_DIR
13:17:02TAKE OFF121.33331.1845204002002014939 | 170825174
13:17:03TAKE OFF121.33331.1845204002502516288 | 166325174
15:00:47LADNING116.571340.0908376480340341561 | 150814173
15:00:48LADNING116.571340.0912372640300301543 | 150814173
Table A4. Normality test.
PathKolmogorov-SmirnovShapiro-Wilk
StatisticDfp-ValueStatisticDfp-Value
Fuel consumption savingsRoute 10.127170.2000.975170.897
Route 20.114170.2000.987170.995
Route 30.090170.2000.990170.999
Route 40.086170.2000.992170.997
Table A5. Levene test of error variance.
FDF 1DF 2p-Value
0.51311560.886
Table A6. Available time slots for the hotspots (partial).
FlightTakeoff TimeTime of Entering HotspotAvailable Time for Sector 5 (Examples)Available Time for Sector 6 (Examples)
Flight 111:1112:0511:55–12:0012:00–12:05
Flight 211:5612:4612:50–12:5512:50–12:55
Flight 312:1713:0513:10–13:1513:05–13:15
Flight 413:0613:5913:50–13:5513:50–13:55
Table A7. The potential of optional routes for fuel efficiency improvement in the case of airspace congestion.
FlightOptional PathFixed Path
Fuel Consumption of the Optimal Fuel Consumption Point (kg)Fuel Consumption of the Same (Similar) Time Point (kg)Route 1 Minimum Fuel Consumption(kg)Route 2 Minimum Fuel Consumption(kg)Route 3 Minimum Fuel Consumption(kg)Route 4 Minimum Fuel Consumption(kg)Route 1 Time Same (Similar) Point Fuel Consumption (kg)Route 2 Time Same (Similar) Point Fuel Consumption (kg)Route 3 Time Same (Similar) Point Fuel Consumption (kg)Route 4 Time Same (Similar) Point Fuel Consumption (kg)
Flight 111,107.9711,117.3011,117.3011,279.9111,168.8411,107.9711,117.3011,376.2911,654.7811,503.60
Flight 210,678.7611,011.5310,960.4310,678.7610,902.5610,855.8111,291.8011,011.5311,224.7911,111.87
Flight 310,625.5410,795.5310,968.9510,896.5610,625.5410,805.6611,093.2511,038.8410,795.5310,928.90
Flight 411,225.5411,359.5011,225.5411,371.5711,449.3411,485.5611,359.5011,583.7811,666.3911,933.62
Table A8. Normality test.
PathKolmogorov-SmirnovShapiro-Wilk
StatisticDfp-ValueStatisticDfp-Value
Fuel consumptionOptional path0.17280.2000.94080.613
fixed path0.105320.2000.983320.870
Table A9. Levene test of error variance.
FDF 1DF 2p-Value
0.9597320.477

References

  1. ICAO. 2019 Environmental Report: Aviation and Environment; International Civil Aviation Organization: Montréal, QC, Canada, 2019. [Google Scholar]
  2. Schäfer, A.W.; Evans, A.D.; Reynolds, T.G.; Dray, L. Costs of mitigating CO2 emissions from passenger aircraft. Nat. Clim. Chang. 2016, 6, 412–417. [Google Scholar] [CrossRef] [Green Version]
  3. Wang, Y.; Yin, H.; Zhang, S.; Yu, X. Multi-objective optimization of aircraft design for emission and cost reductions. Chin. J. Aeronaut. 2014, 27, 52–58. [Google Scholar] [CrossRef] [Green Version]
  4. Liem, R.P.; Kenway, G.K.; Martins, J.R. Multimission aircraft fuel-burn minimization via multipoint aerostructural optimization. AIAA J. 2015, 53, 104–122. [Google Scholar] [CrossRef] [Green Version]
  5. Qiu, L.; He, L. Can green traffic policies affect air quality? Evidence from a difference-in-difference estimation in China. Sustainability 2017, 9, 1067. [Google Scholar] [CrossRef] [Green Version]
  6. Lee, J.; Mo, J. Analysis of technological innovation and environmental performance improvement in aviation sector. Int. J. Environ. Res. Public Health 2011, 8, 3777–3795. [Google Scholar] [CrossRef] [PubMed] [Green Version]
  7. Xu, Y.; Prats, X. Linear holding for airspace flow programs: A case study on delay absorption and recovery. IEEE Trans. Intell. Transp. Syst. 2018, 20, 1042–1051. [Google Scholar] [CrossRef]
  8. González-Arribas, D.; Soler, M.; Sanjurjo-Rivo, M.; Kamgarpour, M.; Simarro, J. Robust aircraft trajectory planning under uncertain convective environments with optimal control and rapidly developing thunderstorms. Aerosp. Sci. Technol. 2019, 89, 445–459. [Google Scholar] [CrossRef] [Green Version]
  9. Sehra, A.K.; Whitlow, J.W. Propulsion and power for 21st century aviation. Prog. Aeronaut. Sci. 2004, 40, 199–235. [Google Scholar] [CrossRef]
  10. Janić, M. Greening commercial air transportation by using liquid hydrogen (LH2) as a fuel. Int. J. Hydrogen Energy 2014, 39, 16426–16441. [Google Scholar] [CrossRef]
  11. Yang, L.; Yin, S.; Han, K.; Haddad, J.; Hu, M. Fundamental diagrams of airport surface traffic: Models and applications. Int. J. Hydrogen Energy 2017, 106, 29–51. [Google Scholar] [CrossRef]
  12. Ng, K.; Lee, C.K.; Chan, F.T.S.; Lv, Y. Review on meta-heuristics approaches for airside operation research. Appl. Soft. Comput. 2018, 66, 104–133. [Google Scholar] [CrossRef]
  13. Evertse, C.; Visser, H. Real-time airport surface movement planning: Minimizing aircraft emissions. Transp. Res. Part. C-Emerg. Technol. 2017, 79, 224–241. [Google Scholar] [CrossRef]
  14. Khadilkar, H.; Balakrishnan, H. Estimation of aircraft taxi fuel burn using flight data recorder archives. Transp. Res. D Transp. Environ. 2012, 17, 532–537. [Google Scholar] [CrossRef]
  15. Deonandan, I.; Balakrishnan, H. Evaluation of strategies for reducing taxi-out emissions at airports. In Proceedings of the 10th AIAA Aviation Technology, Integration, and Operations (ATIO) Conference, Fort Worth, TX, USA, 13–15 September 2010. [Google Scholar]
  16. Lukic, M.; Giangrande, P.; Hebala, A.; Nuzzo, S.; Galea, M. Review, challenges, and future developments of electric taxiing systems. IEEE Trans. Transp. Electrif. 2012, 17, 532–537. [Google Scholar] [CrossRef]
  17. Ng, K.; Lee, C.; Chan, F.T.; Qin, Y. Robust aircraft sequencing and scheduling problem with arrival/departure delay using the min-max regret approach. Transp. Res. Pt. E-Logist. Transp. Rev. 2017, 106, 115–136. [Google Scholar] [CrossRef]
  18. Ng, K.; Lee, C.K.; Chan, F.T.; Chen, C.; Qin, Y. A two-stage robust optimisation for terminal traffic flow problem. Appl. Soft. Comput. 2020, 89, 106048. [Google Scholar] [CrossRef]
  19. Ng, K.; Lee, C.K. Aircraft scheduling considering discrete airborne delay and holding pattern in the near terminal area. In Proceedings of the 13th International Conference on Intelligent Computing (ICIC), Liverpool, UK, 7–10 August 2017. [Google Scholar]
  20. Villegas, D.M.; Gómez Comendador, V.F.; García-Heras, C.J.; Arnaldo, V.R.M. Environmental benefits in terms of fuel efficiency and noise when introducing continuous climb operations as part of terminal airspace operation. Int. J. Sustain. Transp. 2020, 14, 903–913. [Google Scholar] [CrossRef]
  21. Sáez, R.; Prats, X.; Polishchuk, T.; Polishchuk, V. Traffic synchronization in terminal airspace to enable continuous descent operations in trombone sequencing and merging procedures: An implementation study for Frankfurt airport. Transp. Res. Pt. C Emerg. Technol. 2020, 121, 102875. [Google Scholar] [CrossRef]
  22. Favennec, B.; Symmans, T.; Houlihan, D.; Vergne, K.; Zeghal, K. Point Merge Integration of arrival flows enabling extensive RNAV Application and continuous descent–operational Services and environment definition. Aufl. BréTigny Eurocontrol. Exp. Cent. 2010, 2010, 1–22. [Google Scholar]
  23. Prats, X.; Puig, V.; Quevedo, J.; Nejjari, F. Multi-objective optimisation for aircraft departure trajectories minimising noise annoyance. Transp. Res. Pt. C Emerg. Technol. 2010, 18, 975–989. [Google Scholar] [CrossRef]
  24. Zhu, Q.; Pei, J.; Liu, X.; Zhou, Z. Analyzing commercial aircraft fuel consumption during descent: A case study using an improved K-means clustering algorithm. J. Clean. Prod. 2019, 223, 869–882. [Google Scholar] [CrossRef]
  25. Rodríguez-Díaz, A.; Adenso-Díaz, B.; González-Torre, P.L. Improving aircraft approach operations taking into account noise and fuel consumption. J. Air Transp. Manag. 2019, 77, 46–56. [Google Scholar] [CrossRef]
  26. Tian, Y.; Wan, L.; Ye, B.; Yin, R.; Xing, D. Optimization method for reducing the air pollutant emission and aviation noise of arrival in terminal area. Sustainability 2019, 11, 4715. [Google Scholar] [CrossRef] [Green Version]
  27. Yang, L.; Li, W.; Wang, S.; Zhao, Z. Multi-Attributes Decision-Making for CDO Trajectory Planning in a Novel Terminal Airspace. Sustainability 2019, 13, 1354. [Google Scholar] [CrossRef]
  28. Lovegren, J.; Hansman, R.J. Estimation of Potential Aircraft Fuel Burn Reduction in Cruise via Speed and Altitude Optimization Strategies; MIT International Center for Air Transportation (ICAT) Department of Aeronautics & Astronautics Massachusetts Institute of Technology: Cambridge, MA, USA, 2011. [Google Scholar]
  29. Delgado, L.; Prats, X. Fuel consumption assessment for speed variation concepts during the cruise phase. In Proceedings of the ATM Economics Conference, Belgrade, Serbia, 5–9 October 2017. [Google Scholar]
  30. Williams, V.; Noland, R.B.; Toumi, R. Air transport cruise altitude restrictions to minimize contrail formation. Clim. Policy 2003, 3, 207–219. [Google Scholar] [CrossRef]
  31. Soler, M.; González-Arribas, D.; Sanjurjo-Rivo, M.; García-Heras, J.; Sacher, D.; Gelhardt, U.; Lang, J.; Hauf, T.; Simarro, J. Infuence of atmospheric uncertainty, convective indicators, and cost-index on the leveled aircraft trajectory optimization problem. Transp. Res. Pt. C Emerg. Technol. 2020, 120, 102784. [Google Scholar] [CrossRef]
  32. Patron, R.F.; Kessaci, A.; Botez, R.M. Flight trajectories optimization under the influence of winds using genetic algorithms. In Proceedings of the AIAA Guidance, Navigation, and Control (GNC) Conference, Boston, MA, USA, 19–22 August 2013. [Google Scholar]
  33. Hartjes, S.; Visser, H.G.; van Hellenberg Hubar, M.E.G. Trajectory optimization of extended formation flights for commercial aviation. Aerospace 2019, 6, 100. [Google Scholar] [CrossRef] [Green Version]
  34. Wickramasinghe, N.K.; Brown, M.; Hirabayashi, H.; Nagaoka, S. Feasibility study on constrained optimal trajectory application in the Japanese airspace. In Proceedings of the AIAA Modeling and Simulation Technologies Conference, Grapevine, TX, USA, 9–13 January 2017. [Google Scholar]
  35. Sridhar, B.; Chen, N.Y.; Ng, H.K. Energy efficient contrail mitigation strategies for reducing the environmental impact of aviation. In Proceedings of the Tenth USA/Europe Air Traffic Management Research and Development Seminar, ATM2013, Moffett Field, CA, USA, 10–13 June 2013. [Google Scholar]
  36. Soler, M.; Olivares, A.; Staffetti, E. Multiphase optimal control framework for commercial aircraft four-dimensional flight-planning problems. J. Aircr. 2015, 52, 274–286. [Google Scholar] [CrossRef]
  37. Tian, Y.; He, X.; Xu, Y.; Wan, L.; Ye, B. 4D Trajectory optimization of commercial flight for green civil aviation. IEEE Access 2020, 8, 62815–62829. [Google Scholar] [CrossRef]
  38. Melgosa, M.; Prats, X.; Xu, Y.; Delgado, L. Enhanced demand and capacity balancing based on alternative trajectory options and traffic volume hotspot detection. In Proceedings of the 2019 IEEE/AIAA 38th Digital Avionics Systems Conference (DASC), San Diego, CA, USA, 8–12 September 2019. [Google Scholar]
  39. Harada, A.; Ezaki, T.; Wakayama, T.; Oka, K. Air traffic efficiency analysis of airliner scheduled flights using collaborative actions for renovation of air traffic systems open data. J. Adv. Transp. 2018, 2018, 1–14. [Google Scholar] [CrossRef]
  40. Center, E.E. User Manual for the Base of Aircraft Data (BADA); Revision 3.11; EEC Note: Brussels, Belgium, 2013. [Google Scholar]
  41. Glover, W.; Lygeros, J. A multi-aircraft model for conflict detection and resolution algorithm evaluation. HYBRIDGE Deliv. D 2004, 1, 3. [Google Scholar]
  42. Fang, Z. Aircraft Flight Dynamics; Beihang Univ. Press: Beijing, China, 2005; pp. 1–35. [Google Scholar]
  43. Singh, V. Fuel consumption minimization of transport aircraft using real-coded genetic algorithm. Proc. Inst. Mech. Eng. Part G J. Aerosp. Eng. 2018, 232, 1925–1943. [Google Scholar] [CrossRef]
  44. Jones, D.F.; Mirrazavi, S.K.; Tamiz, M. Multi-objective meta-heuristics: An overview of the current state-of-the-art. Eur. J. Oper. Res. 2002, 137, 1–9. [Google Scholar] [CrossRef]
  45. Zitzler, E.; Deb, K.; Thiele, L. Comparison of multiobjective evolutionary algorithms: Empirical results. Evol. Comput. 2000, 8, 173–195. [Google Scholar] [CrossRef] [PubMed] [Green Version]
  46. Psiaki, M.L. Backward-smoothing extended Kalman filter. J. Guid. Control Dyn. 2005, 28, 885–894. [Google Scholar] [CrossRef]
  47. Ruiz, S.; Guichard, L.; Pilon, N.; Delcourte, K. A new air traffic flow management user-driven prioritisation process for low volume operator in constraint: Simulations and results. J. Adv. Transp. 2019, 2019, 1208279. [Google Scholar] [CrossRef]
  48. Liu, F.; Wang, C.; Wang, L. Estimating Aircraft Fuel Consumption using Radar Tracks Data. Int. J. Perform. Eng. 2018, 14, 2249–2260. [Google Scholar] [CrossRef] [Green Version]
  49. Yu, X.; Lu, Y.; Yu, X. Evaluating multiobjective evolutionary algorithms using MCDM methods. Math. Probl. Eng. 2018, 2018, 1–13. [Google Scholar] [CrossRef] [Green Version]
  50. Gaxiola, C.A.N.; Barrado, C.; Royo, P.; Pastor, E. Assessment of the North European free route airspace deployment. J. Air Transp. Manag. 2018, 73, 113–119. [Google Scholar] [CrossRef]
Figure 1. Forces acting on the aircraft.
Sustainability 13 07043 g001
Figure 2. Non-dominated Sorting Genetic Algorithm with Elitist Strategy (NSGA-II) procedure.
Sustainability 13 07043 g002
Figure 3. Chromosome encoding pattern: (a) fixed path scenario; and (b) multi-path scenario.
Sustainability 13 07043 g003
Figure 4. Illustration diagram of correction operator: (a) Case 1; (b) Case 2; and (c) Case 3.
Sustainability 13 07043 g004
Figure 5. Schematic diagram of the route structure of ZSSS–ZBAA.
Sustainability 13 07043 g005
Figure 6. The altitude profile of the A333 during a typical week.
Sustainability 13 07043 g006
Figure 7. Comparison of actual and estimated fuel flow.
Sustainability 13 07043 g007
Figure 8. Pareto optimal fronts for different fixed paths.
Sustainability 13 07043 g008
Figure 9. Optimized vertical profile: (a) Comparison of altitude profile in Trajectory 1; (b) comparison of speed profile of Trajectory 1; (c) comparison of altitude profile in Trajectory 2; and (d) comparison of speed profile in of Trajectory 2.
Sustainability 13 07043 g009
Figure 10. Fuel reduction potential for different paths and differences in flight times under ideal conditions.
Sustainability 13 07043 g010
Figure 11. Congestion in ZSSS–ZBAA from 10:00 to 14:00.
Sustainability 13 07043 g011
Figure 12. Pareto optimal fronts of aircraft on fixed and optional paths: (a) Flight 1; (b) Flight 2; (c) Flight 3; and (d) Flight 4.
Sustainability 13 07043 g012
Figure 13. Fuel optimization optional for optional paths relative to different fixed paths under capacity constraints.
Sustainability 13 07043 g013
Figure 14. Potential fuel consumption reduction in different operating conditions.
Sustainability 13 07043 g014
Figure 15. Pareto optimal fronts with different congested sectors and severities of congestion: (a) 2 min; (b) 4 min; (c) 6 min; (d) 8 min; (e) 10 min; and (f) 12 min.
Sustainability 13 07043 g015
Figure 16. Hypervolume schematic.
Sustainability 13 07043 g016
Table 1. Airbus A333 mechanical and aerodynamic characteristics.
Performance ParameterValue
Reference mass (kg)174,000
Wing area (m2)361.6
Parasitic drag coefficient C D 0 0.019805
Induced drag coefficient C D 2 0.031875
First thrust-specific fuel consumption coefficient C f 1 0.61503
Second thrust-specific fuel consumption coefficient C f 2 919.03
Fuel flow correction factor during cruise C f c r 0.93655
Table 2. Airbus A333 flight level during a typical week.
Cruising Altitude (m)RatioFlight Altitude before TOD (m)Ratio
78001.70%--
840013.80%840060.40%
92008.60%920037.90%
10,40034.50%10,4001.70%
11,00032.80%--
11,60013.60%--
Table 3. Potential fuel consumption reduction and corresponding flight period.
Flight CodeRoute 1 Lowest Fuel Consumption PointRoute 1 Standard Flight Time PointRoute 1Route 2Route 3Route 4Group
Flight 116.32%6.64%16.32%14.59%12.67%11.49%3
Flight 214.49%4.60%10.00%8.53%7.66%6.51%3
Flight 312.89%2.81%4.29%2.73%1.77%0.72%2
Flight 412.70%2.59%0.41%−0.93%−3.29%−4.05%1
Flight 514.08%4.14%4.14%2.66%1.84%1.44%2
Flight 613.13%3.07%6.60%6.25%4.88%4.15%2
Flight 711.84%1.64%9.39%7.71%6.42%5.32%3
Flight 813.00%2.94%12.75%11.04%8.97%7.53%3
Flight 915.44%5.56%14.09%12.66%11.15%9.94%3
Flight 1011.74%1.52%7.11%5.38%4.42%3.19%2
Flight 1114.92%5.07%4.39%1.63%−0.67%−1.41%3
Flight 1212.18%2.02%9.98%8.59%6.85%5.86%1
Flight 1312.02%1.84%4.26%3.36%2.67%0.78%3
Flight 1416.15%6.64%11.36%9.84%8.60%7.52%2
Flight 159.52%−0.95%5.89%4.30%2.51%1.97%2
Flight 1611.02%0.72%7.61%6.21%5.28%3.95%3
Flight 1715.34%5.55%7.54%6.16%5.47%3.51%2
Average optimization13.38%3.36%8.05%6.55%5.17%4.06%
Table 4. Analysis of variance results.
Dependent Variable: Fuel Consumption Savings
SourceType III Sum of SquaresDfMean SquareFp-Value
Correction model0.074 a110.0077.7860.000
Intercept0.08710.087101.4390.000
Path0.01330.0045.1140.003
Period0.05820.02933.7860.000
Path * Period0.00065.291 × 10 5 0.620.999
Error0.048560.001
Total0.36068
Total after correction0.12267
a R2 = 0.605 (adjusted R2 = 0.527).
Table 5. The potential of optional routes for fuel efficiency improvement in the case of airspace congestion.
FlightPoint of Optimal Fuel ConsumptionSame or Similar Time Points
Route 1Route 2Route 3Route 4Route 1Route 2Route 3Route 4
Flight 10.08%1.52%0.54%002.28%4.61%3.36%
Flight 22.57%02.05%1.63%2.48%01.90%0.90%
Flight 33.13%2.49%01.67%2.68%2.20%01.22%
Flight 401.28%1.95%2.26%01.94%2.63%4.81%
Average optimization1.45%1.35%1.17%1.41%1.31%1.64%2.39%2.70%
Table 6. Analysis of variance results.
Dependent Variable: Fuel Consumption Savings
SourceType III Sum of SquaresDfMean SquareFp-Value
Correction model2,494,110.21 a 7356,301.4599.9220.000
Intercept314,423,004713,144,230,04787,553.7140.000
Whether there is a candidate route217960.8571217,960.8576.0690.019
Different aircraft1,401,258.3503467,086.11713.0060.00
Whether there is a candidate route * Different aircraft2741.3953913.7980.0250.994
Error1,149,184.3983235,912.012
Total4,965,710,22140
Total after correction3,643,294.60939
a R2 = 0.685 (adjusted R2 = 0.616). * stands for interaction effect in ANOVA in general.
Table 7. HV Calculation Result.
Time Offset 2 minTime Offset 4 minTime Offset 6 minTime Offset 8 minTime Offset 10 minTime Offset 12 min
Sector 20.3894759160.245791975
Sector 30.4146676620.2568700730.183452001
Sector 40.3797954250.2853375540.0900540890
Sector 50.3595881970.2736874730.2221817880
Sector 70.3399197460.2693419270.2146784770.110161960.036034223
Sector 80.3272699130.2622933230.2075699530.0559674970.020278687
Sector 90.276207460.2782006850.215651250.1745237660.1077112890.071256447
Publisher’s Note: MDPI stays neutral with regard to jurisdictional claims in published maps and institutional affiliations.